Abstract
Two-dimensional viscoplastic nonlinear analyses of the 2019 Feijão Dam 1 failure are performed using the finite difference program FLAC 8.1 with the user-defined constitutive models PM4SiltR and PM4Sand to assess how a series of commonly used engineering approaches can approximate the observed failure. A brief history of Feijão Dam 1, its failure, and the findings from two previous independent failure investigations are summarized. The present study uses the site characterization from those prior studies to develop the dam cross section, obtain material index properties, and establish groundwater conditions but uses alternative techniques for characterizing undrained shear strengths. The simulations show that the dam was marginally stable against long-term consolidated, undrained conditions and that modest loading changes were sufficient to trigger failure with deformation patterns consistent with the observed failure. The simulations further show that the collapse could have been triggered by a modest wetting event, ongoing drilling activities, or a combination of both mechanisms. Result sensitivity to choices in the calibration process and the numerical solution scheme are evaluated. The implications of these results on the use of commonly used engineering approaches for system-level time-dependent analyses and on long-term slope stability assessment procedures in practice are discussed. The results of this study provide support for the use of these analysis methods and engineering procedures in practice despite their simplifications and associated limitations.
1. Introduction
Feijão Dam 1 was an 86 m-tall tailings impoundment located at the Córrego de Feijão Mine in Brumadihno, Minas Gerais, Brazil that suffered a catastrophic failure on 25 January 2019. The impoundment was constructed using the upstream construction method. By-products of mine operations (tailings) were placed behind the embankment using the hydraulic fill method. The embankment was primarily composed of compacted tailings and the structure was founded on native clayey soil. Negligible deformations were observed prior to the failure. Collapse of the dam occurred within approximately 5 s of initial deformations being observed. The failure surface appeared to develop within the impounded tailings and to not go through the foundation. The failure resulted in more than 250 deaths and significant economic and environmental costs [1]. Characteristics of the tailings impoundment and subsequent investigations into the failure are provided in two reports [2,3]. Robertson et al. [2] concluded that (1) the failure was triggered by a loss of suction in the unsaturated zone due to heavy rainfall in late 2018 combined with internal creep, and (2) the drilling that was in progress at the time of the failure could not have triggered the collapse. Arroyo and Gens [3] concluded that (1) internal creep and the effects of increased precipitation, alone or in combination, would not have triggered the collapse, and (2) drilling of borehole B1-SM-3 potentially triggered the collapse. Thus, these two studies reached opposing conclusions regarding mechanisms that may or may not have triggered the collapse. Additional investigations into this failure have occurred over recent years [4,5]; however, most of these utilize data and information from one of (or both) reports mentioned prior.
Performing stability assessments of earthen structures, such as dams and tailings impoundments, requires accounting for all potential loading conditions and failure modes as well as understanding the potential limitations of the analyses. These stability assessments generally rely on various simplifications to make complex field problems more tractable, with the choice of simplifications depending on the mechanisms controlling stability for a specific structure. Soil strengths are most commonly represented in stability analyses as drained or undrained for different loading conditions, whereas the effects on soil strength of transient seepage and pore water suction in unsaturated or saturated zones are modeled less frequently. Shewbridge [6] noted that several significant texts do not consider long-term, consolidated, undrained strengths in static stability assessments, although several significant failures have occurred under these conditions (e.g., Feijão Dam 1). Analysis methods range from limit equilibrium methods (LEM) to more complex nonlinear analyses using finite element or finite difference methods. Two-dimensional (2D) analysis methods are used more extensively than three-dimensional (3D) methods, with the latter generally reserved for situations where an improved representation of the physical geometry is expected to have a significant effect on the results. LEMs can provide an assessment of structure stability but are generally unable to identify potential failure mechanisms that depend on complex soil behaviors such as strain-softening, viscous effects, and progressive failure. Nonlinear analyses generally provide an improved representation of complex soil behaviors, with additional capabilities dependent on the choice of constitutive models and numerical platforms. For example, Zabolotnii et al. [7] highlighted the importance of nonlinear analyses in capturing the progressive failure observed in the Mount Polley Tailings Storage Facility failure and the influence of localization in analyses of systems involving strain-softening materials. The stability of a specific earthen structure can be influenced to different degrees by complexities in stress–strain behaviors, transient seepage, unsaturated soil characteristics, geometries, and imposed loadings, which collectively may require combining several analyses that isolate and evaluate different mechanisms using available state-of-the-art or state-of-practice tools.
The present study was motivated by the need for continued validation of nonlinear stability analysis procedures for dams and tailings impoundments involving soils susceptible to static liquefaction or undrained strength loss (i.e., strain-softening soils). Validation, in this context, applies to a reproducible set of analysis components (problem idealization approach, soil property characterization procedures, constitutive models, numerical methods, calibration protocols, and numerical protocols) and refers to whether a specific analysis procedure approximates the governing physics with sufficient accuracy to be useful for guiding engineering decisions. In particular, the Feijão Dam 1 case history provides an opportunity to validate stability analysis procedures that utilize the finite difference program FLAC 8.1 [8] with the user-defined constitutive models PM4Sand [9] and PM4SiltR [10,11,12], with the latter being recently developed for representing strain-rate dependent responses of clays and plastic silts. These stability analysis procedures are well-suited for modeling complex soil behaviors but also have known limitations in approximating other complexities (as discussed in subsequent sections), such that validation against case histories or physical model tests is an ongoing need. It should be noted that this analysis does not attempt to identify the root causes of this failure, rather this manuscript aims to evaluate a series of commonly utilized engineering approaches and their ability to approximate the failure.
This paper presents the results of 2D viscoplastic nonlinear analyses of the 2019 Feijão Dam 1 failure in Brazil using FLAC 8.1 with the user-defined constitutive models PM4SiltR and PM4Sand and following engineering procedures and analysis simplifications common in practice. A brief history of Feijão Dam 1, its failure, and the subsequent failure investigations as described by Robertson et al. [2] and Arroyo and Gens [3] are summarized. The present study uses the site characterization by Robertson et al. [2] to develop the dam cross section, obtain material index properties, and establish groundwater conditions, but uses alternative techniques for characterizing undrained shear strengths. Simulations showed that the dam was marginally stable against long-term consolidated, undrained conditions and that modest loading changes were sufficient to trigger failure with deformation patterns consistent with the observed failure. Simulations further show that collapse could have been triggered by a modest wetting event causing an increase in water contents and loss of suction above the phreatic surface, by the ongoing drilling activities causing a localized loss of shear strength in the tailings, or a combination of both mechanisms. The sensitivity of the results to choices in the calibration process and the numerical solution scheme are examined. The implications of these results on the use of these repeatable engineering approaches and long-term slope stability assessment procedures in practice are discussed. The results of this study are shown to provide support for the use of these analysis methods and engineering procedures in practice despite their simplifications and associated limitations.
2. History and Failure of Feijão Dam 1
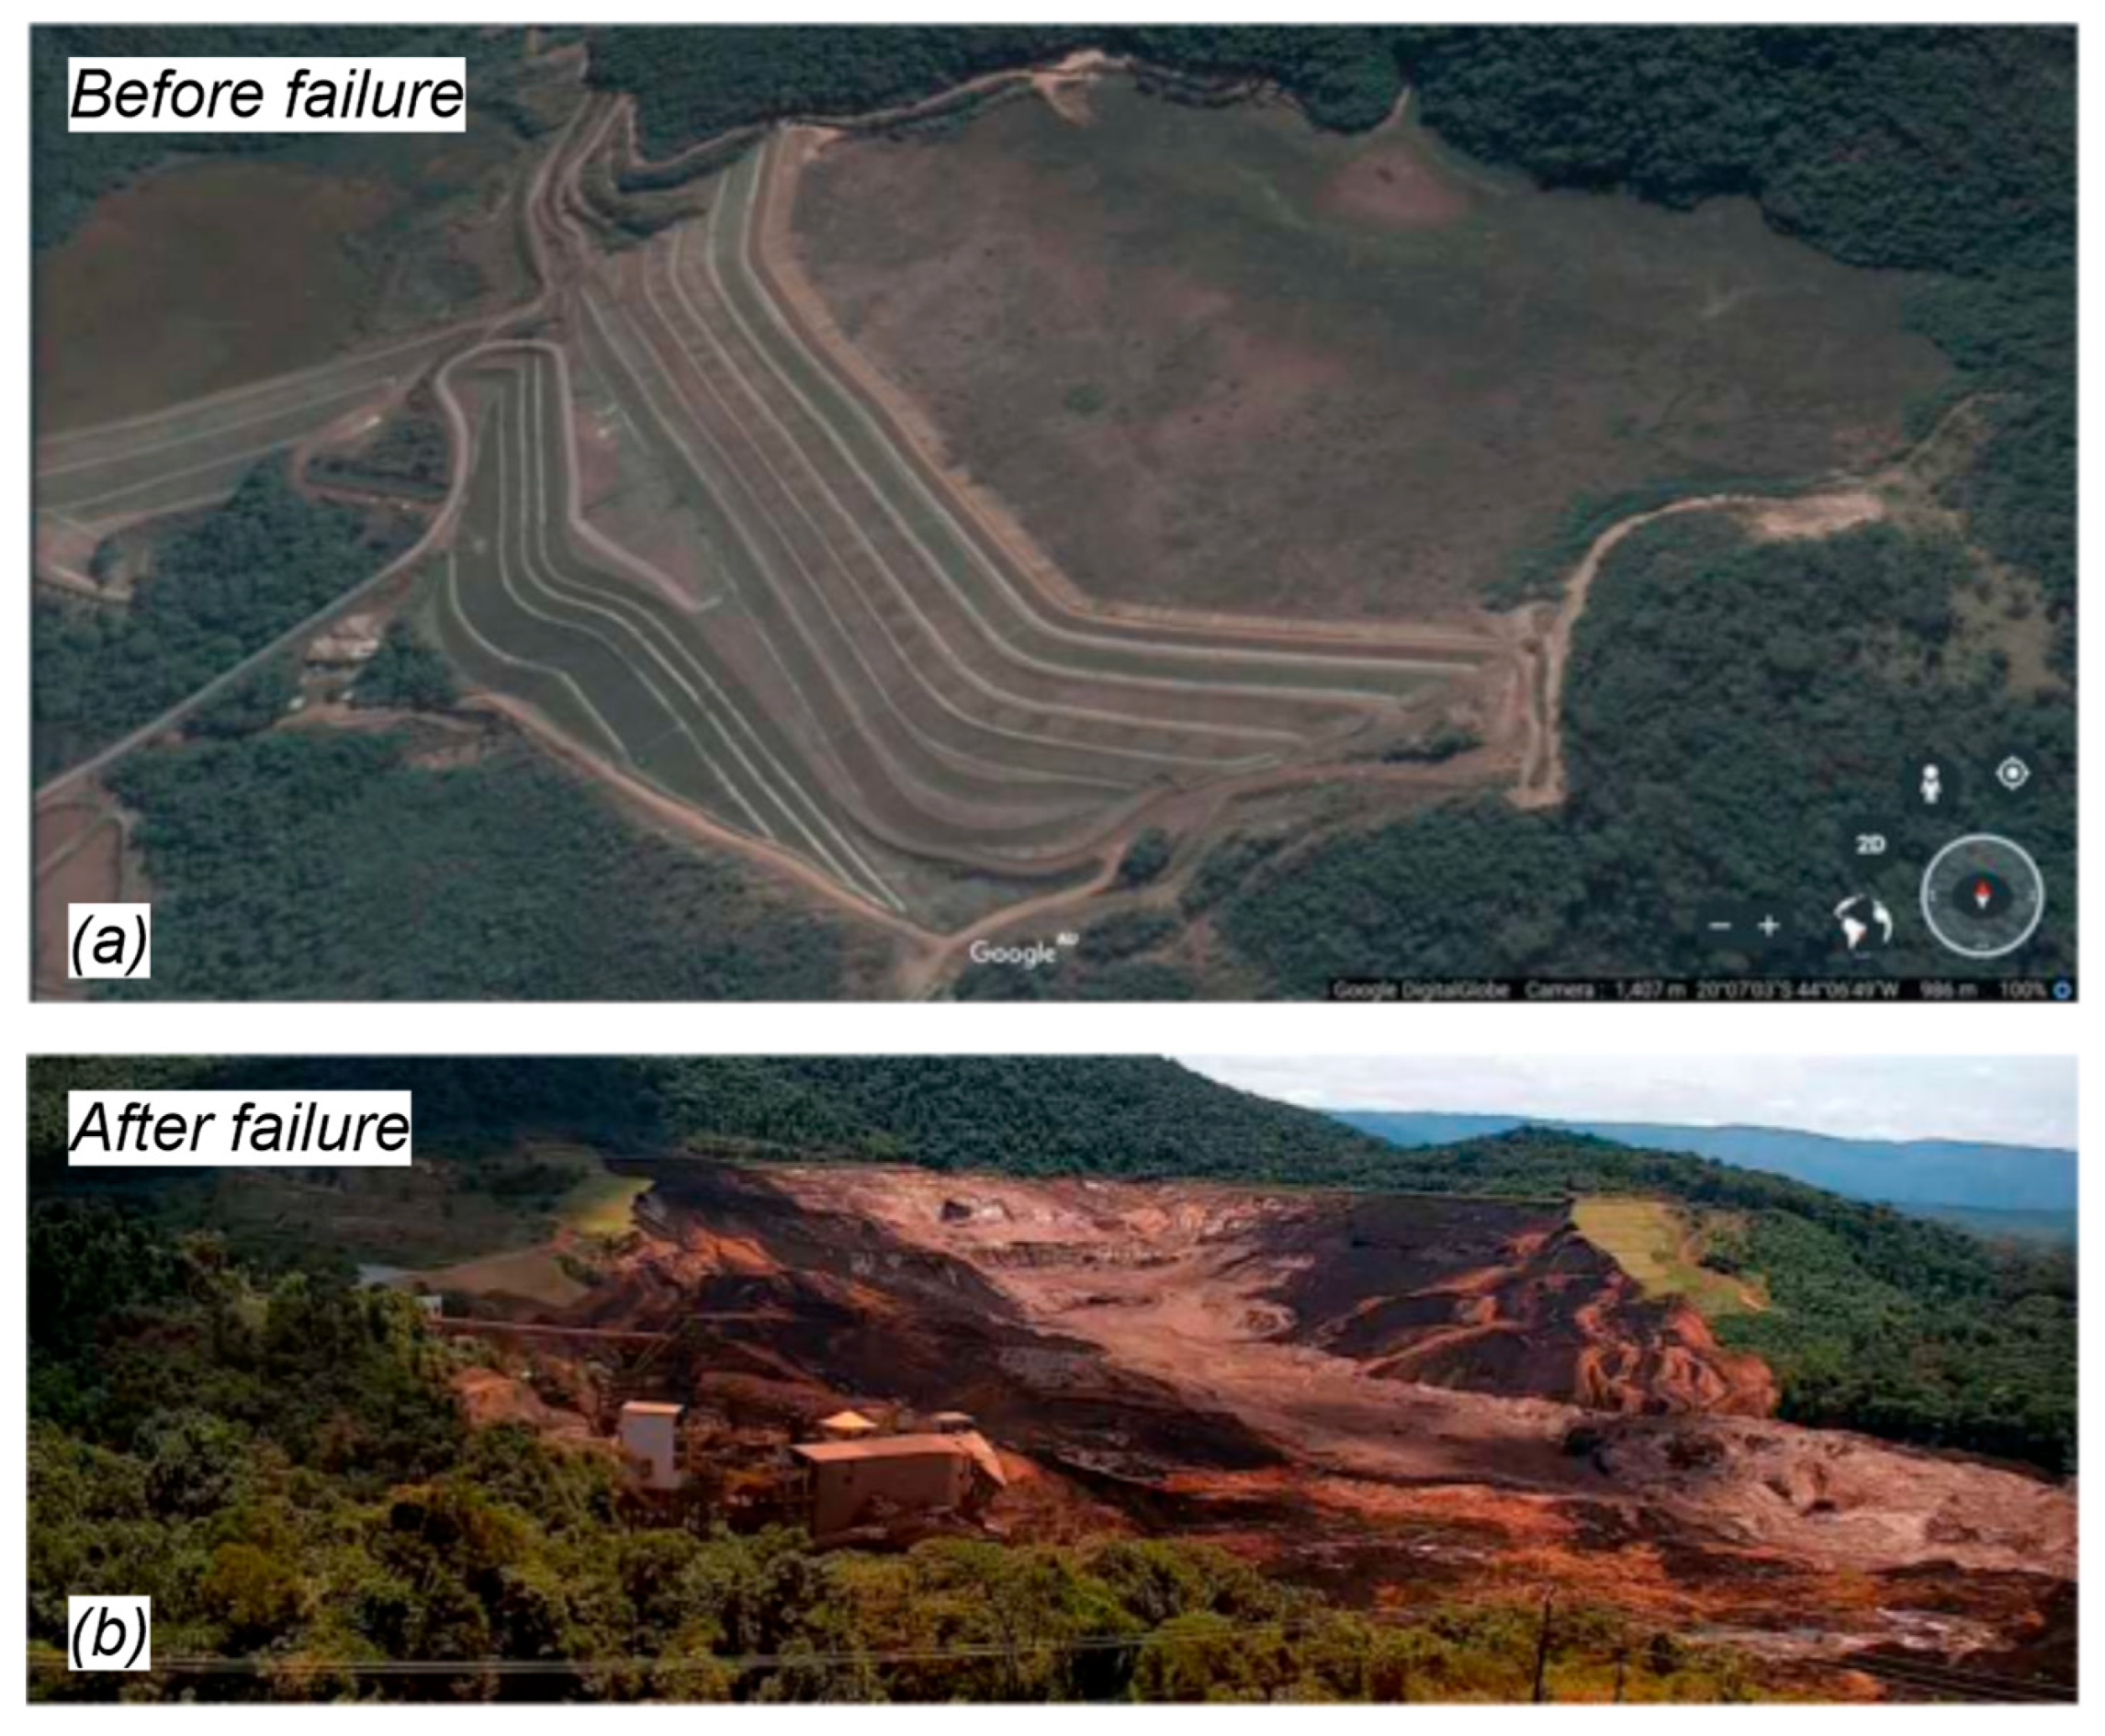
Feijão Dam 1 was an approximately 86 meter-tall tailings impoundment with a 720 meter-long crest located in Brumadihno, Minas Gerais, Brazil at the Córrego de Feijão Mine. The dam was constructed over 37 years beginning in 1976 with ten raises with height increases varying from 5 m to 18 m using the upstream construction method [2]. The fourth raise was a setback relative to the first three raisings which reduced the overall slope of the dam but moved the upper portion of the dam over weaker, finer tailings. The dam was constructed by multiple construction companies and designed by five engineering firms. Construction was completed in 2013 and tailings deposition ceased in July 2016 with the final constructed slope shown in Figure 1a. The dam slope ranged from 1.5H:1V to 2.5H:1V with most raisings having a 2H:1V slope. The impoundment was founded on a native clay layer and the raisings generally consisted of compacted tailings behind which tailings were deposited using the hydraulic fill method [2]. Deposited tailings consisted of interbedded fine and coarse tailings near the face of the dam and a very soft slime in the pond region.
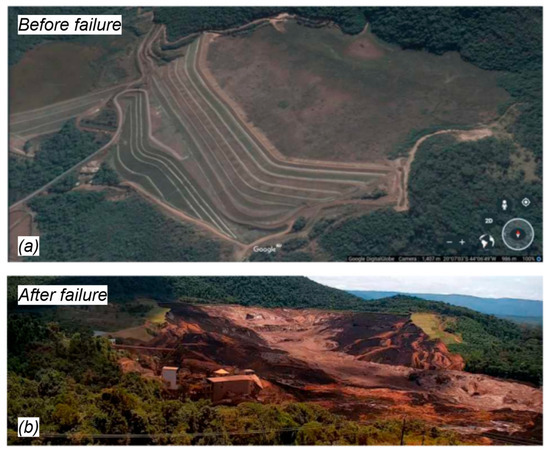
Figure 1.
Feijão Dam 1 (a) looking north prior to failure (Google Earth via Robertson et al. [2]) and (b) after failure [2].
On 25 January 2019, Feijão Dam 1 suffered a rapid collapse resulting in the release of approximately 9.7 million cubic meters of retained tailings, nearly 75% of the total retained material. The dam after failure is shown in Figure 1b. The failure resulted in more than 250 deaths and environmental impacts that reached nearly 300 km downstream [1] and contributed to the development of the Global Industry Standard on Tailings Management [13]. The failure surface extended from the crest to just above the toe (near the top of the first raising). The full collapse occurred within seconds of the first observed deformations. The initial failure surface appeared to be relatively shallow with retrogressive slip-surfaces developing further into the retained materials.
Negligible deformations were observed prior to the failure based on survey, inclinometer, ground-based radar, satellite (InSAR), and drone video data [2]. The survey and inclinometer data indicated no discernable trends in the measurements. Analyses of InSAR data indicated that downward deformations near the crest and mid-slope of the dam were no greater than 30 mm/year increasing to approximately 36 mm/year in the lower central region of the dam. InSAR analysis paired with rainfall data indicated that deformations may have increased slightly during the wet season. Robertson et al. [2] concluded that the tailings were fully consolidated and that the observed deformations were likely the result of ongoing internal creep and not indicative of an imminent failure.
The Expert Panel Report (EPR) prepared by Robertson et al. [2] summarized their investigations, analyses, and findings. The EPR utilized a stochastic state parameter-based approach for estimating the strengths of the fine and coarse tailings in their analysis. Critical state properties were established through laboratory testing, generally on reconstituted samples, and state parameter distributions were developed from cone penetration tests (CPT) profiles using two different methodologies for the tailings [14,15]. Forty stochastic realizations of state parameter distributions in the dam were developed. The static Factors of Safety (FS) for these forty realizations ranged from 0.5 to 2.2 using peak undrained shear strengths (su,pk) with the Shear Strength Reduction Method (SSRM). Four stochastic realizations with FS of 1.0 to 1.16 were selected for further analyses. The shear strengths in these selected realizations were further reduced to obtain an FS of 1.0. Potential failure triggers were applied to the modified, marginally stable realizations in nonlinear analyses using FLAC 2D and 3D. The results indicated that the failure was due to brittle strengths in the tailings coupled with ongoing internal creep and a loss of suction due to seasonal wetting. The EPR eliminated ongoing drilling operations as a potential mechanism for triggering the collapse. The EPR further eliminated tailings deposition, dam construction, earthquakes, blasting, fatigue loading, internal erosion and piping, human interaction, and underground springs.
A second report by CIMNE [3] was commissioned by Vale (mine operator) in conjunction with Brazilian authorities. Their analyses also utilized a state-parameter-based approach for estimating the strengths of the fine and coarse tailings. Critical state properties were developed from laboratory testing, generally on reconstituted samples, and state parameter variability was developed using two CPT methodologies [14,16]. The state parameter distributions were developed using weighted averaging of CPT data. Additionally, CIMNE performed a series of nine triaxial compression tests at varying strain rates (0.002 mm/min, 0.02 mm/min, and 0.2 mm/min) on reconstituted tailings specimens to investigate the strain rate dependency over two orders of magnitude of strain rate. The average change in undrained strength per order of magnitude change in strain rate was 2%. The foundation was modeled as elastic. Nonlinear analyses were performed in PLAXIS [17] using the rate-independent Clay and Sand Model (CASM) modified to capture viscous effects (CASM-visco). The analysis results indicated that ongoing drilling operations were a potential cause of the failure. CIMNE eliminated internal creep and wetting-induced loss of suction as the potential trigger mechanism. CIMNE also eliminated blasting, earthquakes, loss of support, and construction traffic as potential triggers.
3. Material Characterization
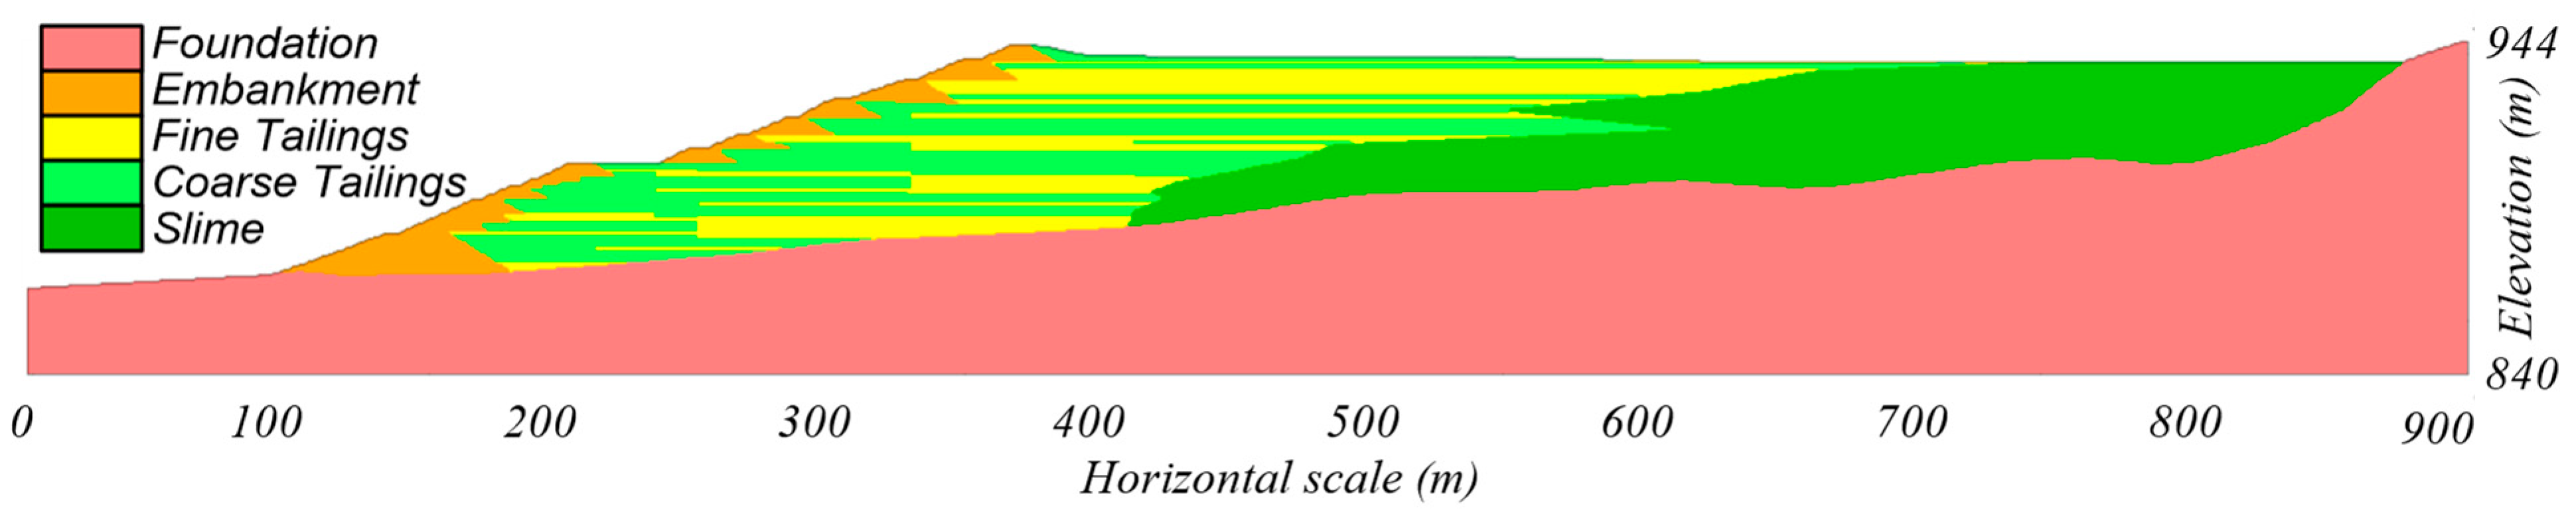
The analyses presented herein utilized the subsurface cross-section shown in Figure 2, as developed in the EPR. The cross-section includes five materials: coarse tailings, fine tailings, slime, embankment, and foundation. Index properties and drained strengths were generally taken as reported in the EPR. Undrained strengths were re-examined using the available laboratory test and CPT data, as discussed below. Material properties used in the present baseline analyses are listed in Table 1. Variations in key properties are examined in the sensitivity analyses described later. This analysis did not consider spatial variability, and each layer was treated as a single material with homogenous, stress-dependent properties consistent with common assumptions and approaches in forward-looking design and practice.
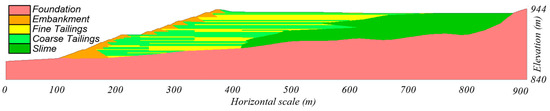
Figure 2.
Feijão Dam 1 Section 3-3’ after Robertson et al. [2].

Table 1.
Selected soil properties.
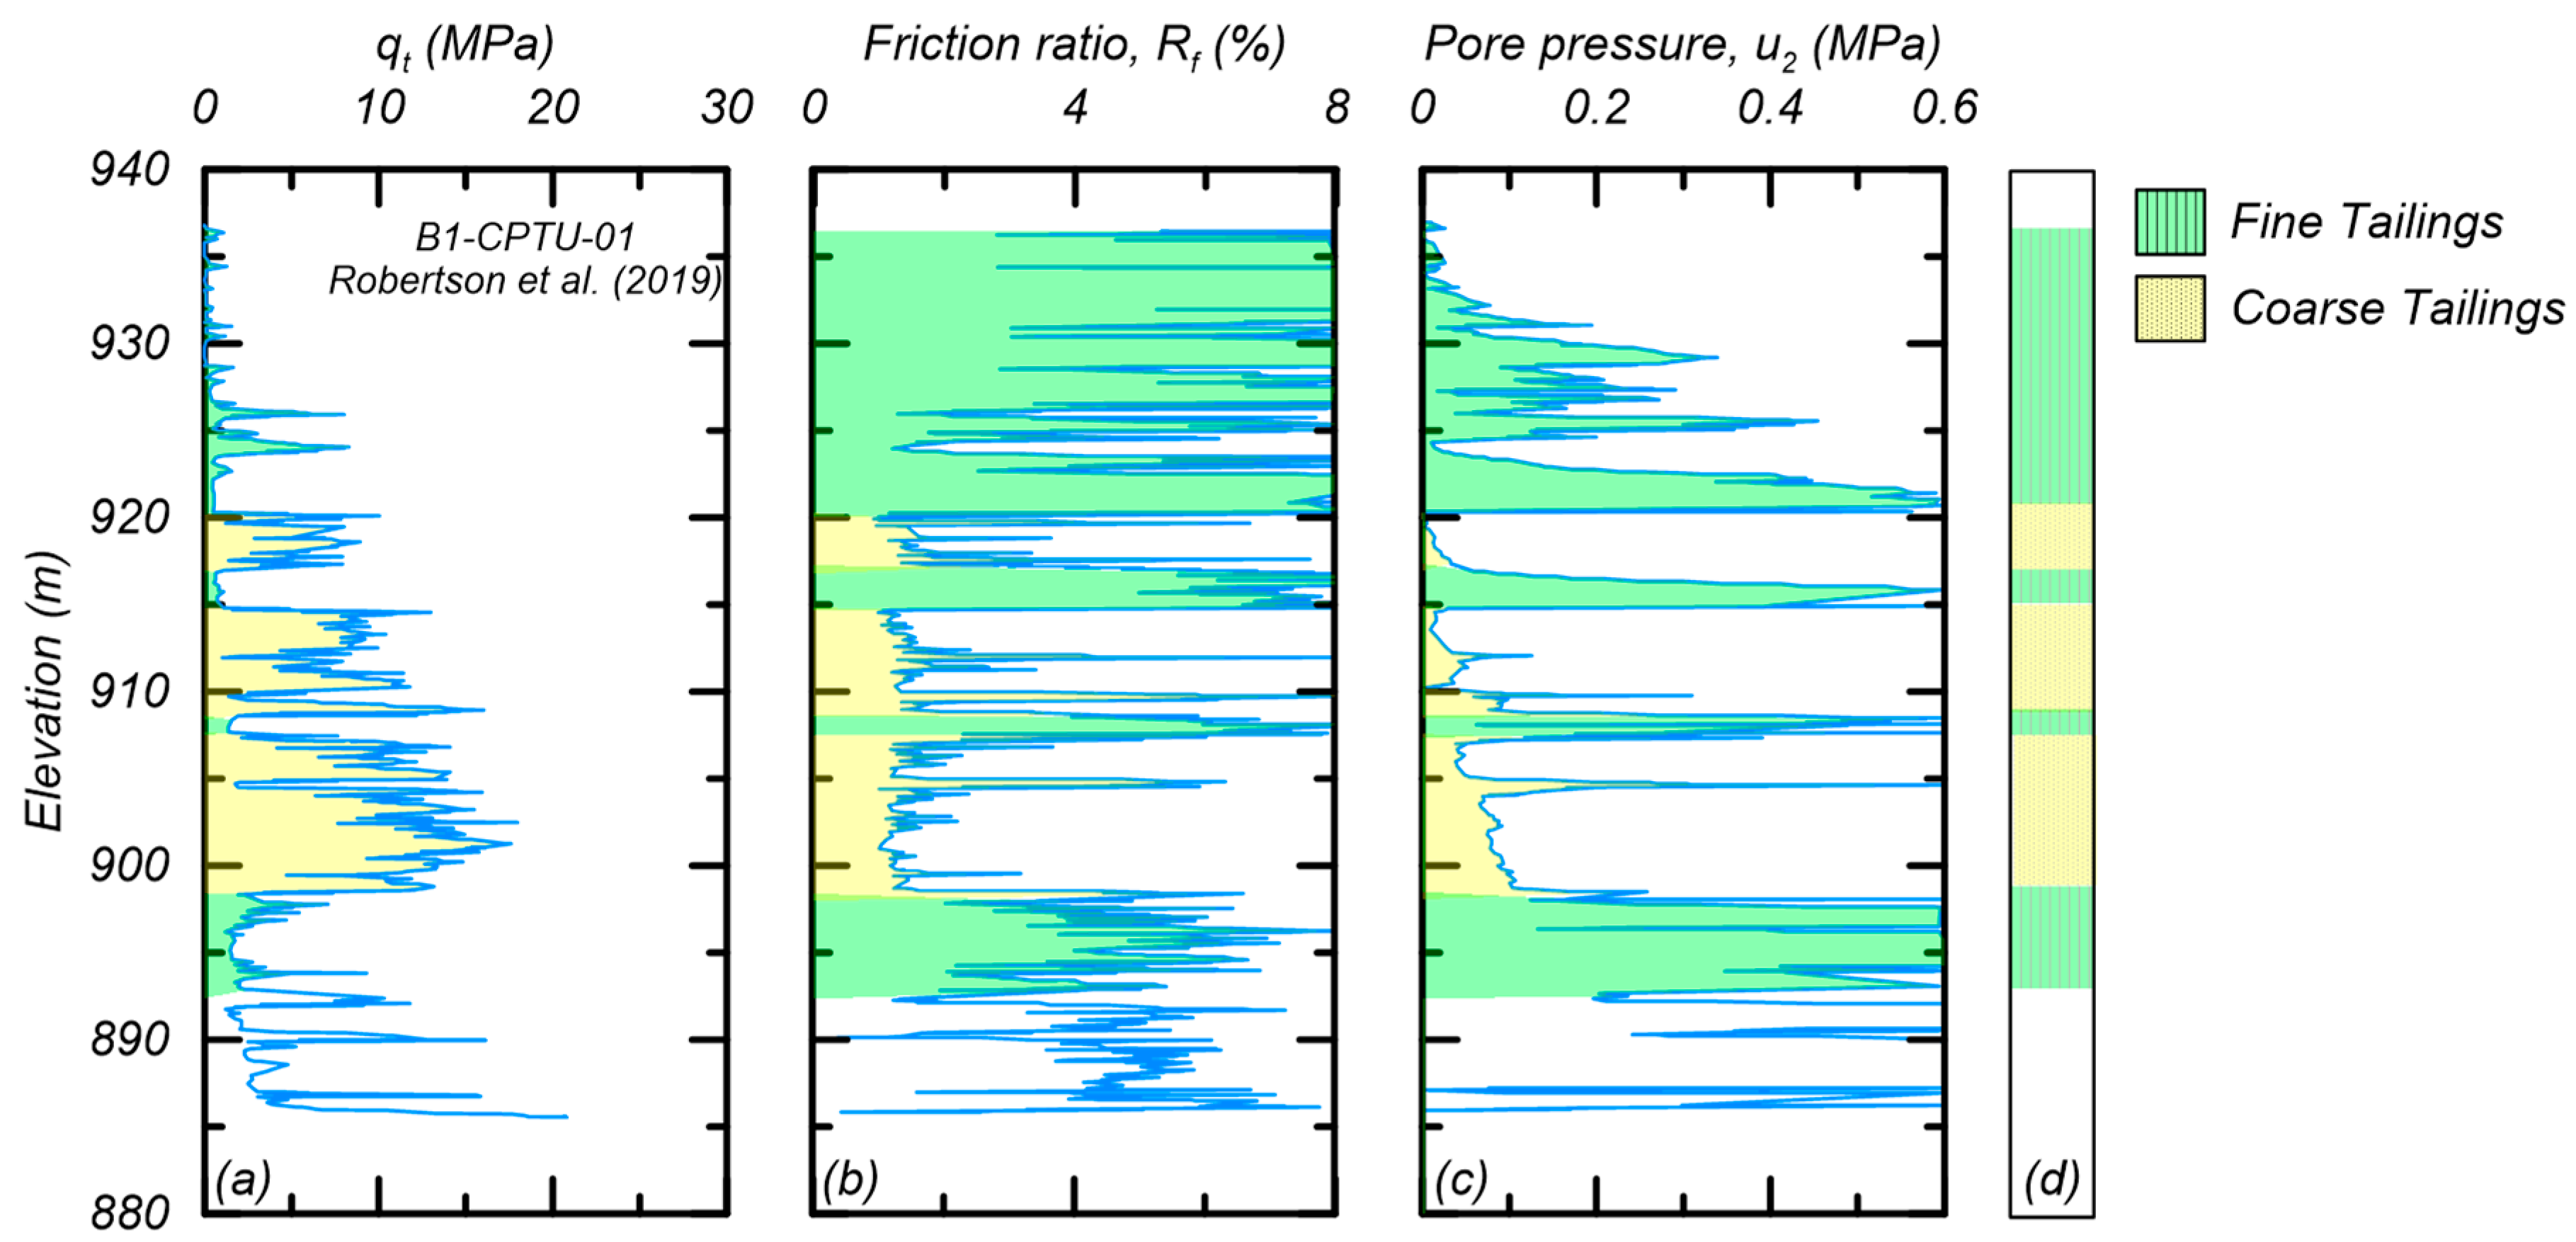
The interlayering and distinct differences of the coarse and fine tailings are illustrated by the data for B1-CPTU-01 from the EPR in Figure 3, showing profiles for (a) cone tip resistance (qt), (b) friction ratio (Rf), (c) pore pressure behind the tip (u2), and (d) interpreted stratigraphic units. The fine tailings are identified by their smaller qt values and larger Rf and u2 values, which results in a clay-like soil behavior classification [18]. The qt values in the fine tailings increase approximately linearly with depth, which is consistent with a normally consolidated profile of clay-like soil. The coarse tailings are identified by their larger qt values and smaller Rf and u2 values, which results in a sand-like soil behavior classification.
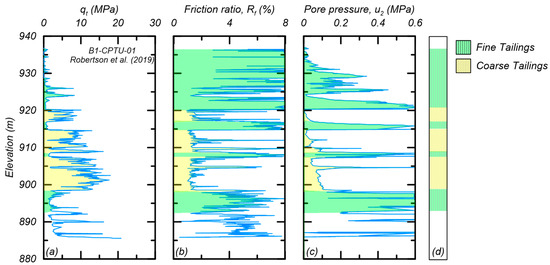
Figure 3.
Profile of B1-CPTU-01 showing: (a) cone tip resistance (qt); (b) friction ratio (Rf); (c) pore pressure (u2); and (d) delineation of materials (after [2]).
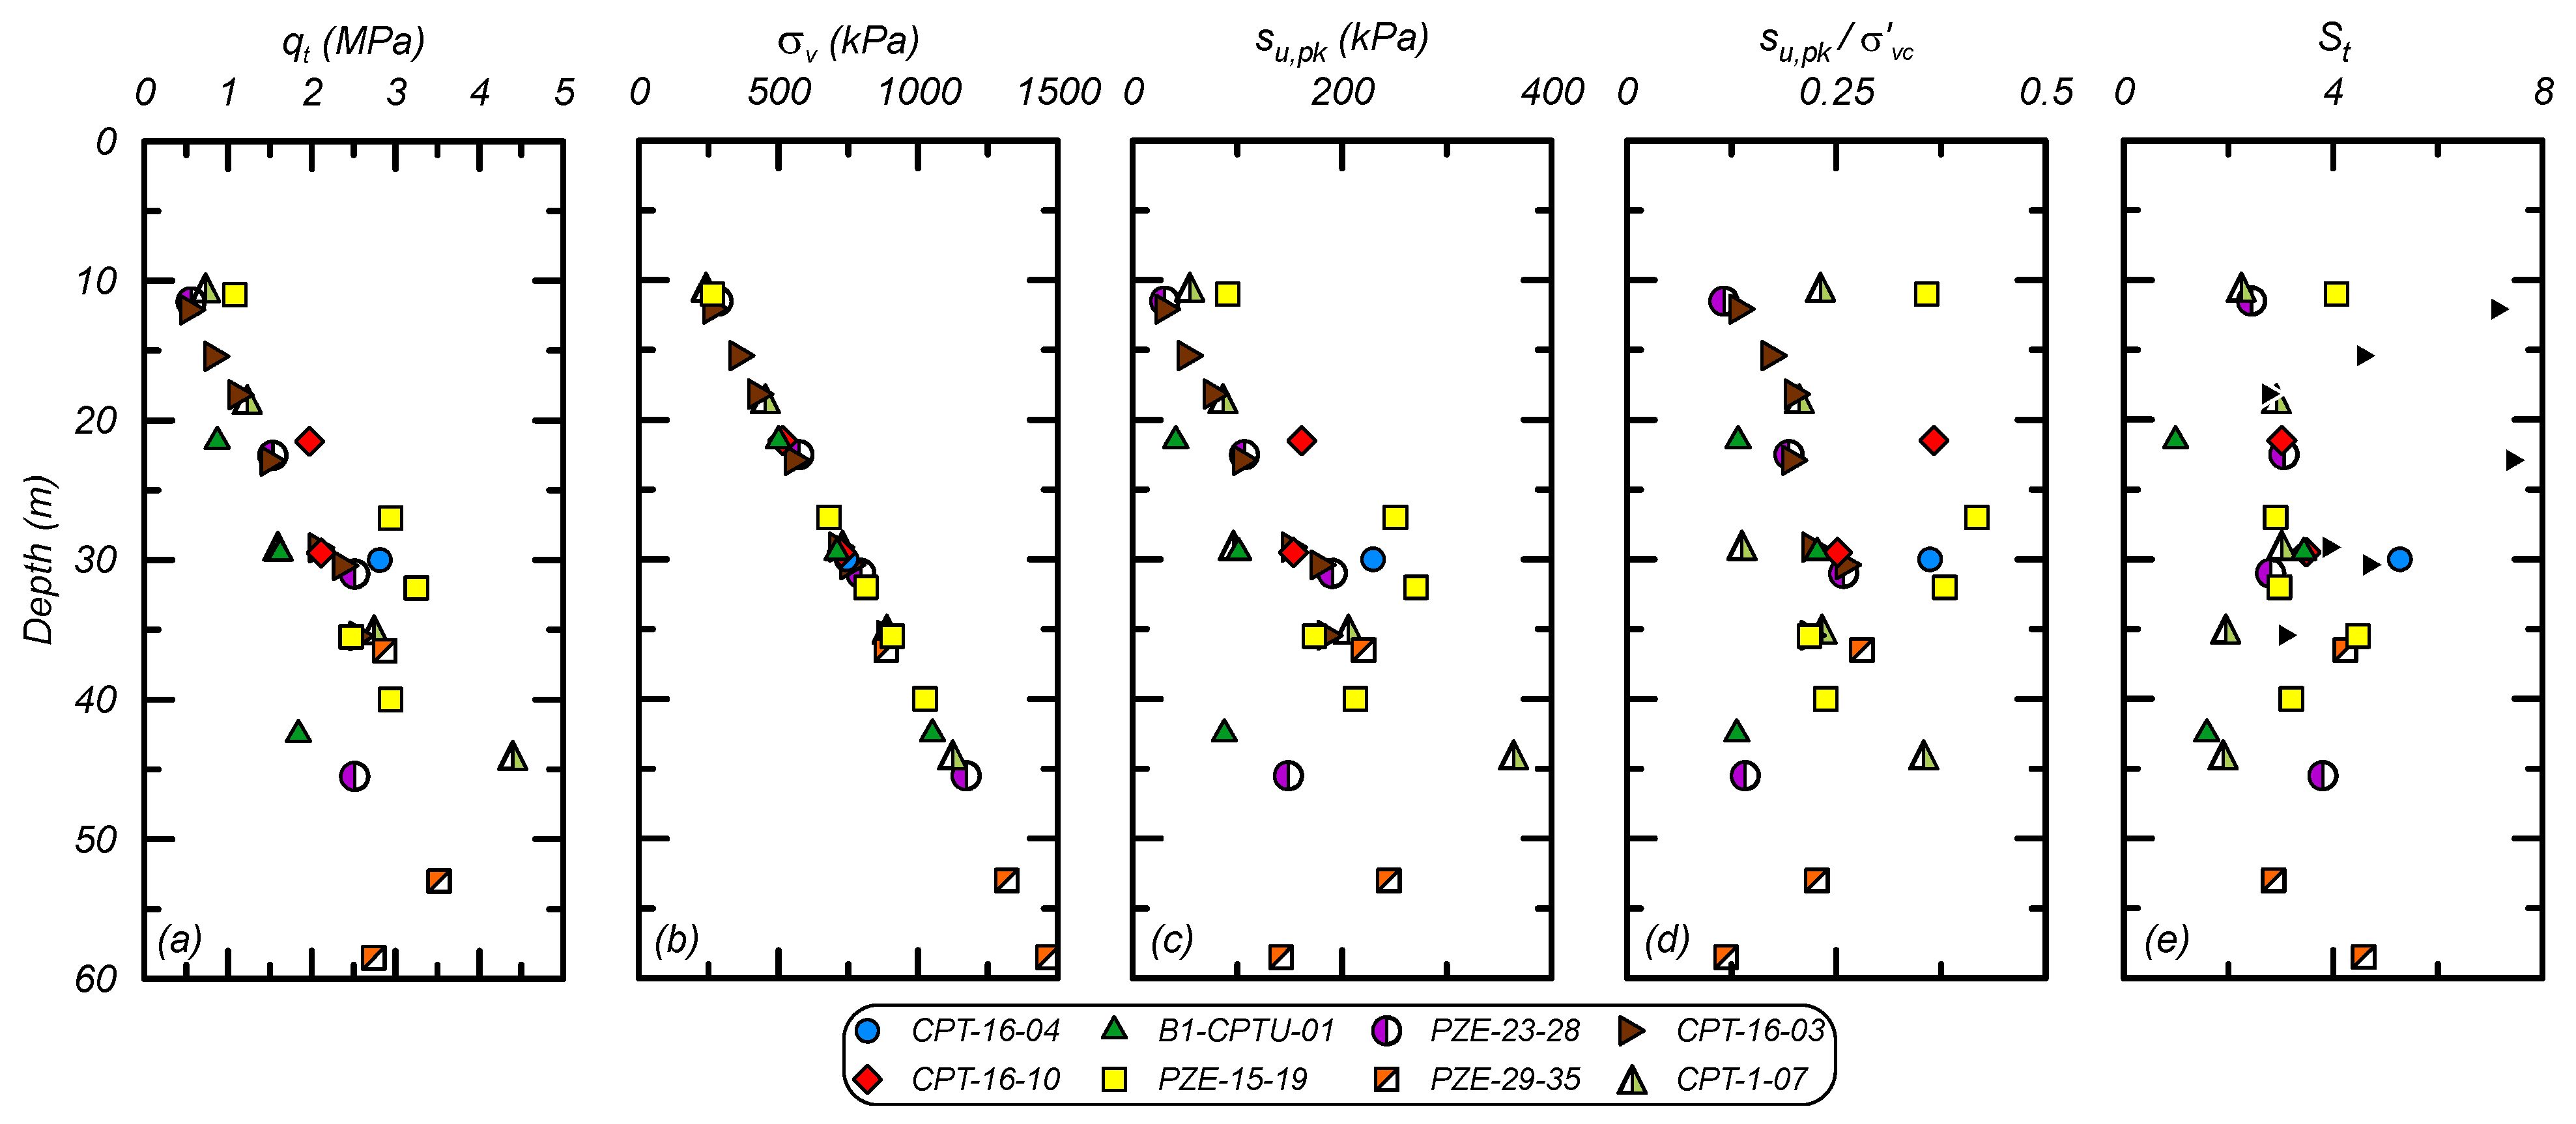
The fine tailings properties were characterized using data from the EPR and analysis of CPT data. The undrained strength (su) of the fine tailings was estimated through a combination of CPT data interpretation, laboratory test data, and empirical correlations for low plasticity silts and clays. CPT data digitized from the EPR is summarized in Figure 4 showing profiles of (a) qt; (b) total vertical stress (σv); (c) su,pk; (d) peak undrained strength ratio (su,pk/σ′vc); and (e) sensitivity (St). The su,pk was estimated using an Nkt of 9 based on correlations for brittle soils and Nkt values from other studies on tailings [19,20,21]. The St was estimated using sleeve friction correlations [22] and the limited number of field vane results showed a St of approximately 4. The su,pk/σ′v of the fine tailings was characterized as 0.21, based on the 50th percentile of the values in Figure 4, with a St of 4 for DSS loading. Larger Nkt values that are often used for less brittle, sedimentary materials (~12–14) would result in a su,pk/σ′vc of approximately 0.15 to 0.17, which is lower than expected for most low plasticity fine-grained materials. The small-strain stiffness was taken as characterized in the EPR based on dilatometer data. The fine tailings were characterized as having an average dry density of 1898 kg/m3, porosity of 0.59, plasticity index (PI) of 4, liquid limit (LL) of 21, fines content (FC) of 71%, and USCS classification of low plasticity silt (ML). The vertical (ky) and horizontal (kh) hydraulic conductivities were taken as 2.0 × 10⁻⁶ and 1.0 × 10⁻⁵ cm/s, respectively.
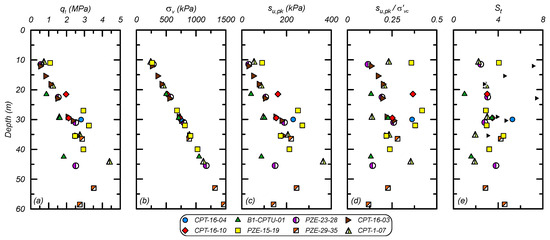
Figure 4.
Profiles for the fine tailings based on CPT data: (a) representative cone tip resistance (qt); (b) total vertical stress (σv); (c) peak undrained strength (su,pk); (d) normalized peak undrained strength ratio (su,pk/σ′vc); and (e) sensitivity (St).
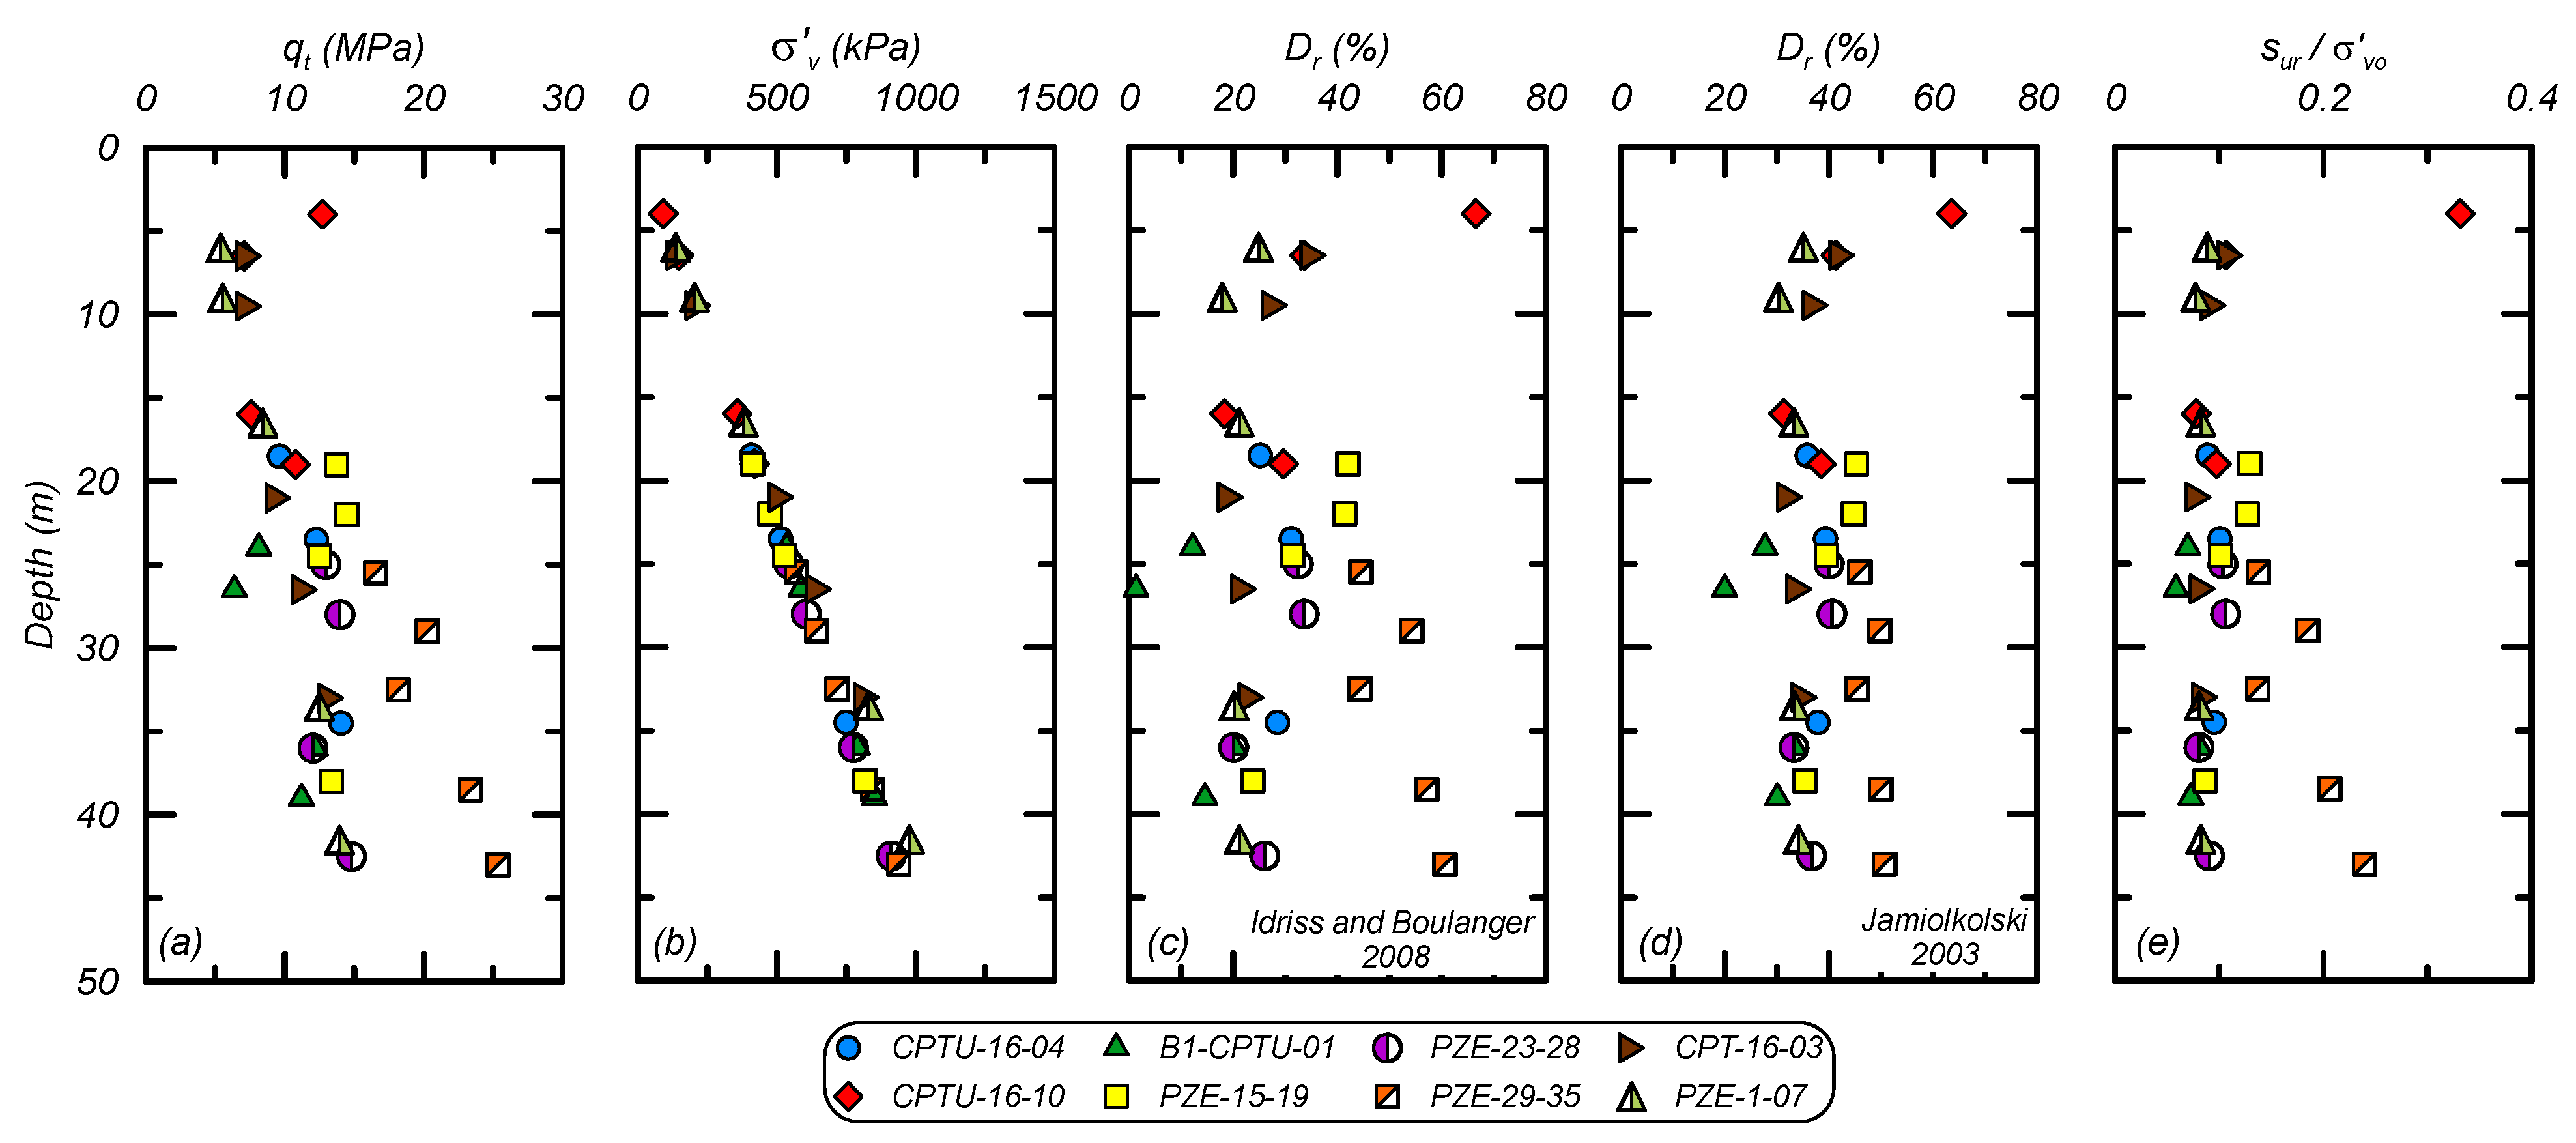
The coarse tailing properties were characterized using data from the EPR and analysis of CPT data. Drained and undrained strength parameters were characterized using CPT correlations common for sand-like materials. Digitized CPT data and correlation results are shown in Figure 5, which contains profiles of (a) qt; (b) vertical effective stress (σ′v); (c) relative density (Dr) using the Idriss and Boulanger [23] correlation; (d) Dr using the Jamiolkowski [24] correlation; and (e) the residual undrained strength ratio (sur/σ′vc) using the Idriss and Boulanger [23] method. The average Dr was about 35% from these two correlations and the average sur/σ′v was 0.09, with the Jamiolkowski [24] method generally predicting higher Dr compared to the Idriss and Boulanger [23] method. The EPR estimated an average su,pk/σ′v of 0.29 (from CPT correlations), which is consistent with estimates based on the CPT data in Figure 5 and relationships by Olson and Stark [25]. Limited field vane test results indicated a large-strain strength loss consistent with the estimated sur/σ′v and su,pk/σ′v from CPT relationships. The small-strain stiffness was characterized using the dilatometer data from the EPR and was found to be similar to the small-strain stiffness of the fine tailings. The coarse tailings were characterized as having an average dry density of 2265 kg/m3, porosity of 0.5, PI of 0, FC of 33%, and USCS classification of SM. The ky and kh were taken as 1.0 × 10⁻⁴ and 5.0 × 10⁻⁴ cm/s, respectively.
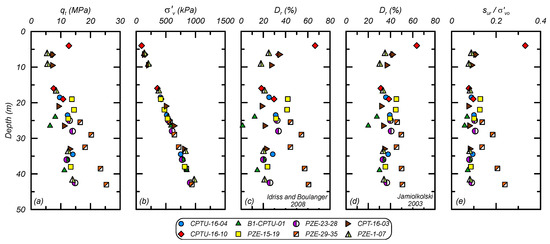
Figure 5.
Profiles for the coarse tailings based on CPT data: (a) representative cone tip resistance (qt); (b) vertical effective stress (σ′v); (c) relative density (Dr) using the Idriss and Boulanger [23] correlation; (d) Dr using the Jamiolkowski et al. [24] correlation; and (e) residual strength ratio (sur/σ′vo).
The slime properties were characterized using the limited data from the EPR and comparisons to the properties of the fine tailings, while also recognizing that the slime is located far enough from the dam face to not affect the anticipated failure mechanisms. The limited CPT data indicate that the slime is weaker than the fine tailings, especially at shallow depths. For simplicity, the slime was assumed to have an undrained strength that was 80% of the fine tailings resulting in an su,pk/σ′vc of 0.16 and a St of 4. Similarly, the small-strain stiffness was assumed to be 80% of the fine and coarse tailings’ small-strain stiffness. The slime was characterized as having an average dry density of 2014 kg/m3, porosity of 0.49, PI of 18, LL of 42, and USCS classification of CL. The ky and kh were taken as 5.0 × 10⁻⁷ and 1.0 × 10⁻⁶ cm/s, respectively.
The foundation soils were characterized as residual or colluvial soil of gneiss saprolite [3]. The EPR presented DSS laboratory tests that had an average su,pk/σ′vc = 0.33 without strain-softening but it is not apparent which strength was used in their analyses. CIMNE discussed the possibility of the available laboratory tests and CPT data not being representative of the overall foundation unit as they were from relatively shallow depths; they subsequently modeled the foundation as elastic, precluding failure surfaces from developing in the foundation. Whittle et al. [4] modeled the foundation as drained with a friction angle of 30 degrees and a cohesion of 8.5 kPa. The analyses herein subsequently modeled the foundation with an su,pk/σ′vc = 0.5 and an St = 1. Parametric analyses that consider lower foundation strengths and the influence of the foundation strength on the failure mechanism are discussed later. The foundation as identified and tested by the EPR had an average density of 1898 kg/m3, porosity of 0.31, PI of 18, LL of 60, and USCS classification of MH. The ky and kh were taken as 9.3 × 10⁻⁵ cm/s.
The embankment properties were characterized using data from the EPR. The embankment was assumed to have an average drained friction angle of 36 degrees. The embankment materials were characterized as having an average density of 1863 kg/m3, porosity of 0.3, PI of 4, LL of 20, and USCS classification of SM. The ky and kh were taken as 1.2 × 10⁻⁴ cm/s.
4. Constitutive Model Calibration
The user-defined constitutive models PM4SiltR (version 1.0) and PM4Sand (version 3.1) were used for all materials. PM4SiltR was used to model the fine tailings, slime, and foundation materials. PM4Sand was used to model the coarse tailings and embankment materials.
PM4SiltR is a modified version of PM4Silt that incorporates viscoplasticity and is intended for slope stability applications. Viscoplasticity was implemented in the model using a consistency approach coupled with an internal strain rate and an auto-decay mechanism. The model has six required input parameters: (1) the critical state undrained strength or strength ratio (su,cs or su,cs/σ′vc); (2) the shear modulus coefficient (Go); (3) the contraction rate parameter (hpo); (4) the rate dependency factor for the critical state stress ratio (FM); (5) the rate dependency factor for the critical state line (Fp); and (6) the minimum normalized strain rate producing a viscid response (). The model has an additional 12 parameters that are assigned default values based on a generalized calibration and can be modified at the user’s discretion. Constitutive details and example calibrations are given in [11,12], as well as in the user manual [10].
PM4Sand is a critical state-based, stress-ratio-controlled, bounding surface plasticity model for sands that builds on the framework of the plasticity model developed by Dafalias and Manzari [26]. PM4Sand has three primary (required) input parameters: (1) relative density (Dr); (2) the shear modulus coefficient (Go); and (3) the contraction rate parameter (hpo). The model has an additional 21 parameters that are assigned default values based on a generalized calibration and can be modified at the user’s discretion [9].
The calibration process used for both models was to determine input parameters that make the constitutive model approximate the target soil properties (or stress–strain responses) as closely as possible. The target soil properties are determined from a synthesis of available information (e.g., laboratory test data, in situ test data, and empirical correlations), allowing for the limitations in each data source and addressing inconsistencies across data sources. This approach separates the soil characterization and model calibration tasks, which has practical advantages over traditional mechanics of materials approaches that may emphasize laboratory testing as the direct basis for model calibration. For this study, the target soil properties were characterized in Section 3.
4.1. Fine Tailings, Foundation, and Slime
The calibration process for the fine tailings, slime, and foundation materials involved the following: (1) establishing su,cs/σ′vc and Go based on the material characterization; (2) adjusting the nb,wet parameter to obtain the desired su,pk/σ′vc and hence St; (3) adjusting hpo to obtain reasonable rates of post-peak strain-softening; (4) adjusting Fp, FM, and to obtain the desired viscous response; and (5) iteratively repeating steps 1–4 as warranted. The input parameters for the baseline calibrations are presented in Table 2; parameters not listed retained their default values. Sensitivity to selected input parameters is discussed in the results section.
Table 2.
PM4SiltR input parameters for the base calibration of fine tailings, foundation, and slime.
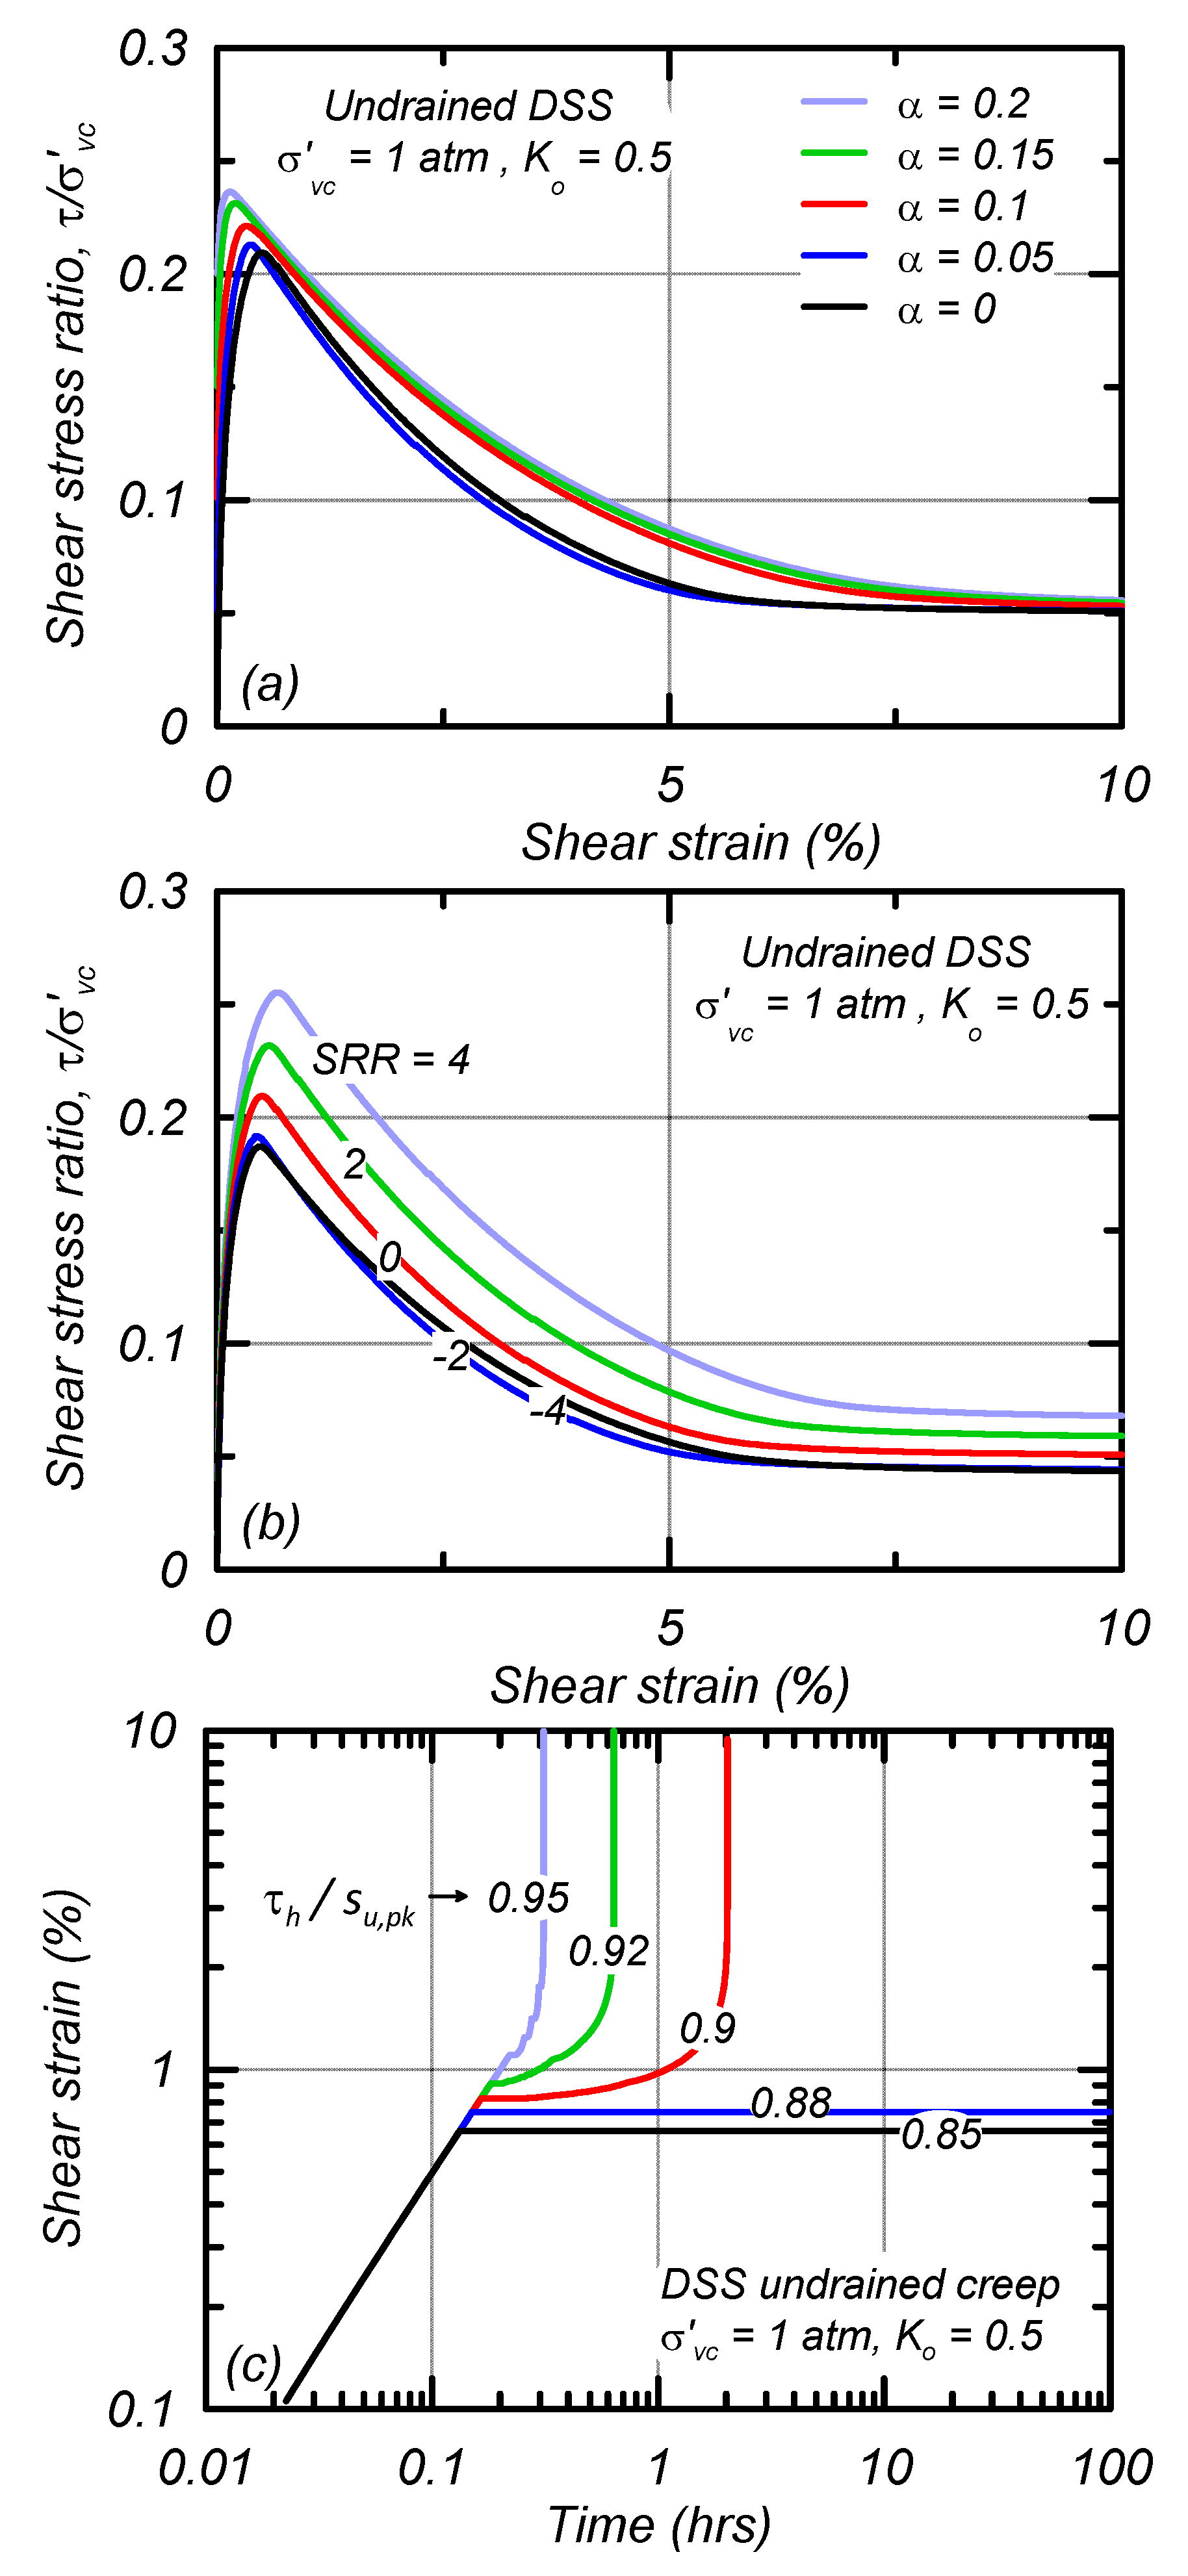
Stress–strain responses for single element simulations of undrained DSS loading consolidated to a σ′vc of 1 atm and K0 of 0.5 are shown in Figure 6 for the fine tailings with varying static shear stress ratios (α) of 0.0, 0.05, 0.1, 0.15, and 0.2 (Figure 6a) and varying applied strain rate ratios (SRR = ) of −4, −2, 0, 2, and 4 (Figure 6b). Increasing α increased the initial stiffness of the stress–strain response and increased the su,pk. The stress–strain responses exhibit post-peak, strain-softening consistent with the imposed St of 4. The su,pk increases by approximately 5% per log cycle of loading rate. Stress–strain responses for SRRs of −2 and −4 mobilize approximately the same su,pk, which is approximately 90% of su,pk,ref. The minimum mobilized su,pk is determined by the location of the static bounding surface which is controlled by FM, Fp, and . The stress–strain responses for the slime with varying α and SRRs are similar to those of the fine tailings but the slime has a reference peak strength ratio of 0.16 (80% of the fine tailings).
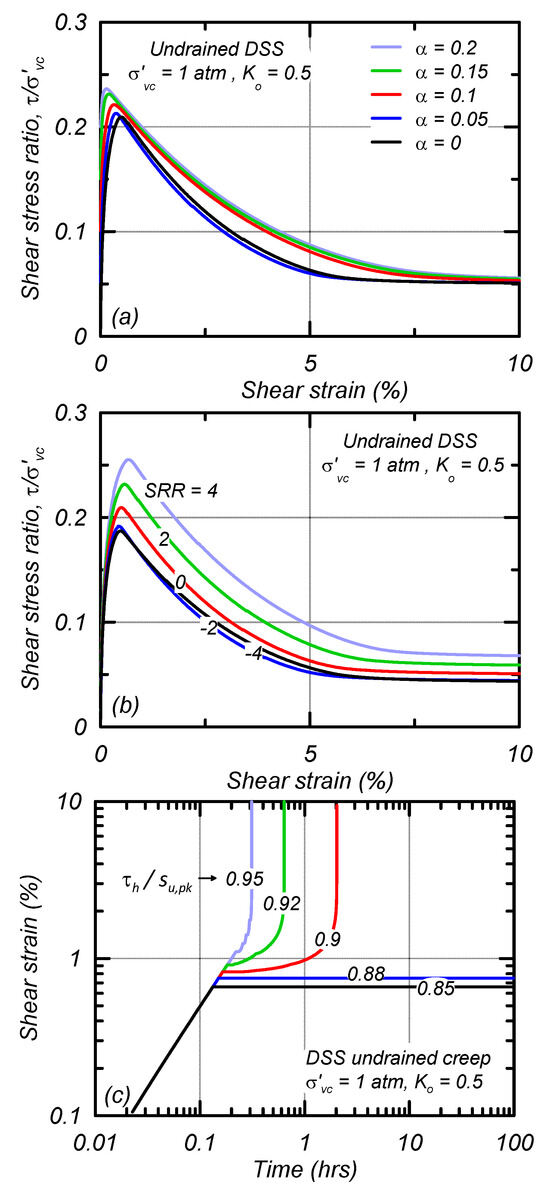
Figure 6.
Simulations of DSS loading with (a) varying sustained static shear stress ratios, (b) varying applied strain rates, and (c) undrained creep simulations with varying sustained shear stresses for the fine tailings.
The undrained creep response in DSS loading at different sustained stress ratios is shown for the fine tailings (Figure 6c) for single element simulations consolidated to a σ′vc = 1 atm, K0 = 0.5 and α = 0. After initial consolidation, shear stress (τh) was applied under undrained loading at a fixed rate until reaching target percentages of su,pk, after which τh was held constant. Stable conditions developed for τh/su,pk < 0.88 and undrained creep rupture occurred for τh/su,pk > 0.9. The distinction between stable and rupture conditions is dependent on the placement of the static bounding surface. The time to rupture decreases with increasing sustained stress levels. The undrained creep response of the slime is similar to that of the fine tailings.
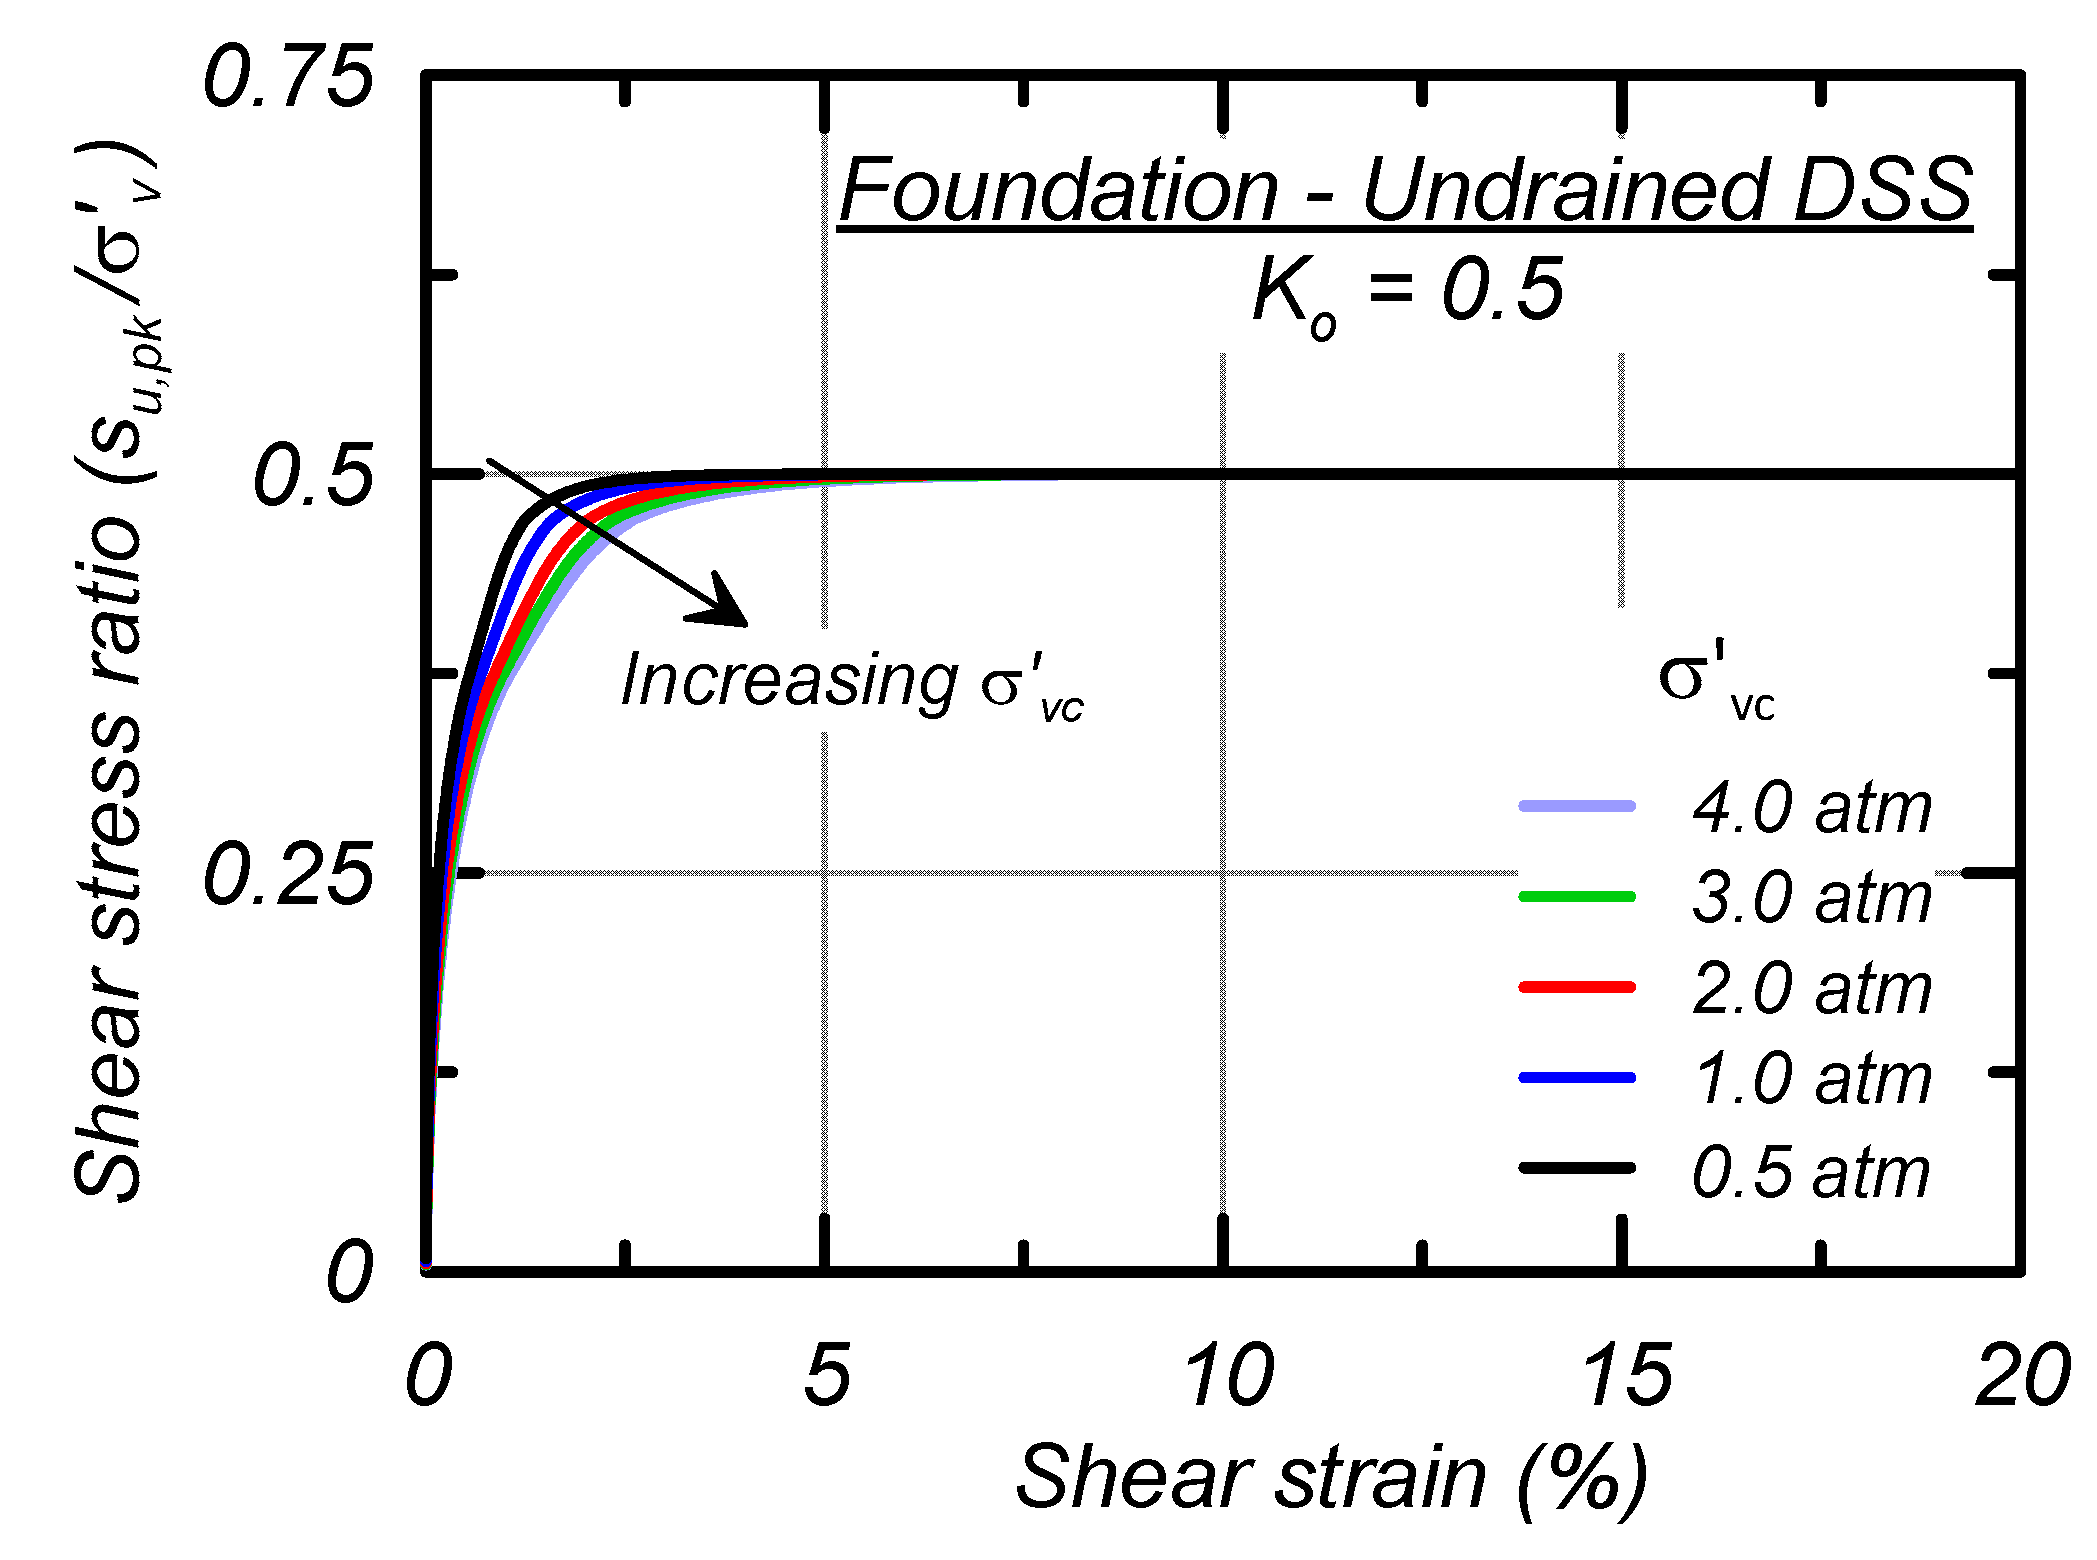
Stress–strain responses for single-element simulations of the foundation material subjected to undrained DSS loading after consolidation to σ′vc of 0.5, 1, 2, 3, and 4 atm and K0 of 0.5 are shown in Figure 7. Peak strength is mobilized at larger shear strains with increasing σ′vc and the su,pk/σ′vc is 0.5. Post-peak, the stress–strain response strain-hardens and does not lose strength, consistent with the characterized St of 1. The foundation Fp and FM parameters are 0 and as such the baseline calibration does not have the potential for creep to occur and the strength does not vary with the SRR.
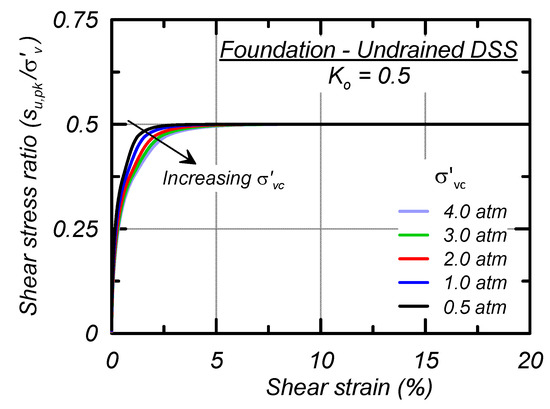
Figure 7.
Simulations of undrained DSS loading with varying vertical confining pressures for the foundation.
4.2. Coarse Tailings and Embankment
The calibration of PM4Sand for the coarse tailings and embankment materials was performed as follows: (1) establishing Dr and Go based on material characterization; (2) adjusting R to position the critical state line to produce the target su,r/σ′vo; (3) adjusting nb, hpo, and ho to obtain desired su,pk and reasonable rates of strain-softening; and (4) iteratively repeating steps 1–3 until no further adjustments are warranted. The value of R computed in step (2) is a function of the initial effective stress state and thus varies across elements. The value of R is computed as,
where DR is the relative density, su,cs is the undrained critical state strength, M is the critical state stress ratio, Pa is atmospheric pressure, and Q and R are Bolton’s dilatancy relationship parameters.
Calibrated input parameters for the coarse tailings and embankment materials are shown in Table 3. All other parameters retained their default values.
Table 3.
PM4Sand input parameters for the coarse tailings and embankment.
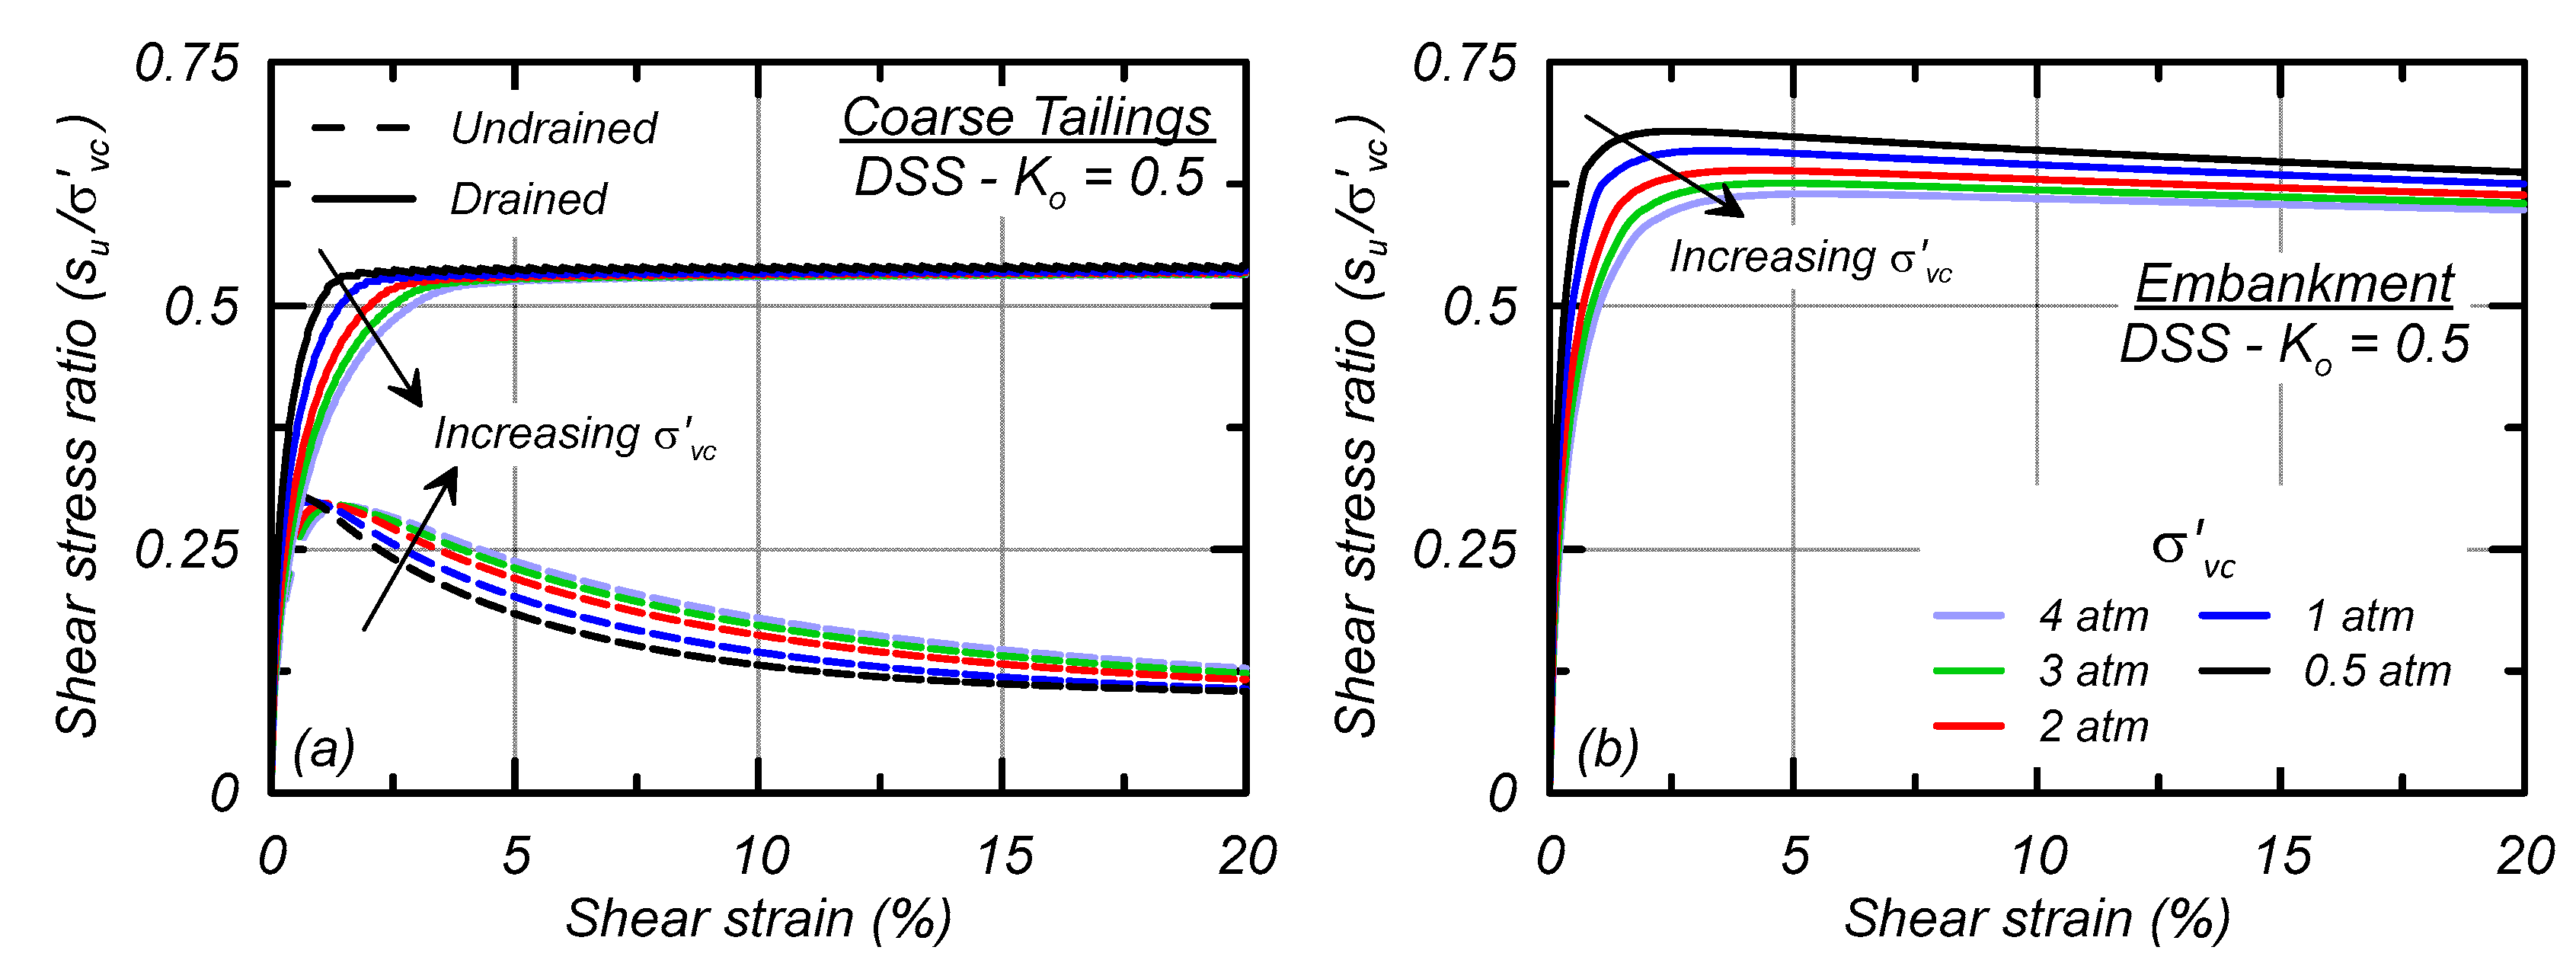
Single element simulations of monotonic DSS loading are shown for the coarse tailings (undrained and drained loading, Figure 8a) and embankment material (drained loading, Figure 8b) consolidated to varying σ′vc of 0.5, 1, 2, 3, and 4 atm and K0 of 0.5. The coarse tailings are stronger drained than undrained as they are initially loose of critical state. Drained loading of the coarse tailings mobilizes a shear strength ratio slightly larger than 0.5 while undrained loading mobilizes a su,pk/σ′vc of 0.29. Post peak, the coarse tailings strain-soften when undrained to the sur/σ′vc of 0.09 whereas the coarse tailings strain-harden when loaded under drained conditions. The influence of drained versus undrained coarse tailings behavior is discussed in the results section. The embankment material mobilizes a drained friction angle between 32 and 36 degrees depending on σ′vc and exhibits only minor post-peak strain softening.
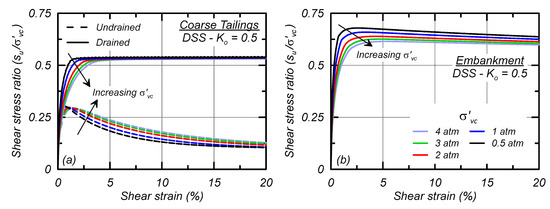
Figure 8.
Stress–strain responses for DSS loading with varying confining stresses for: (a) undrained and drained loading for the coarse tailings; and (b) drained loading for embankment material.
5. Model Development and Initial Stress Conditions
Two-dimensional nonlinear analyses were performed using the finite difference program FLAC 8.1 [8] with the creep module. The analysis cross-section and stratigraphy are shown in Figure 2. Elements were generally 1 m thick by 2 m wide for a total of approximately 45,000 elements. The initial static stress and seepage conditions were established with the following sequence.
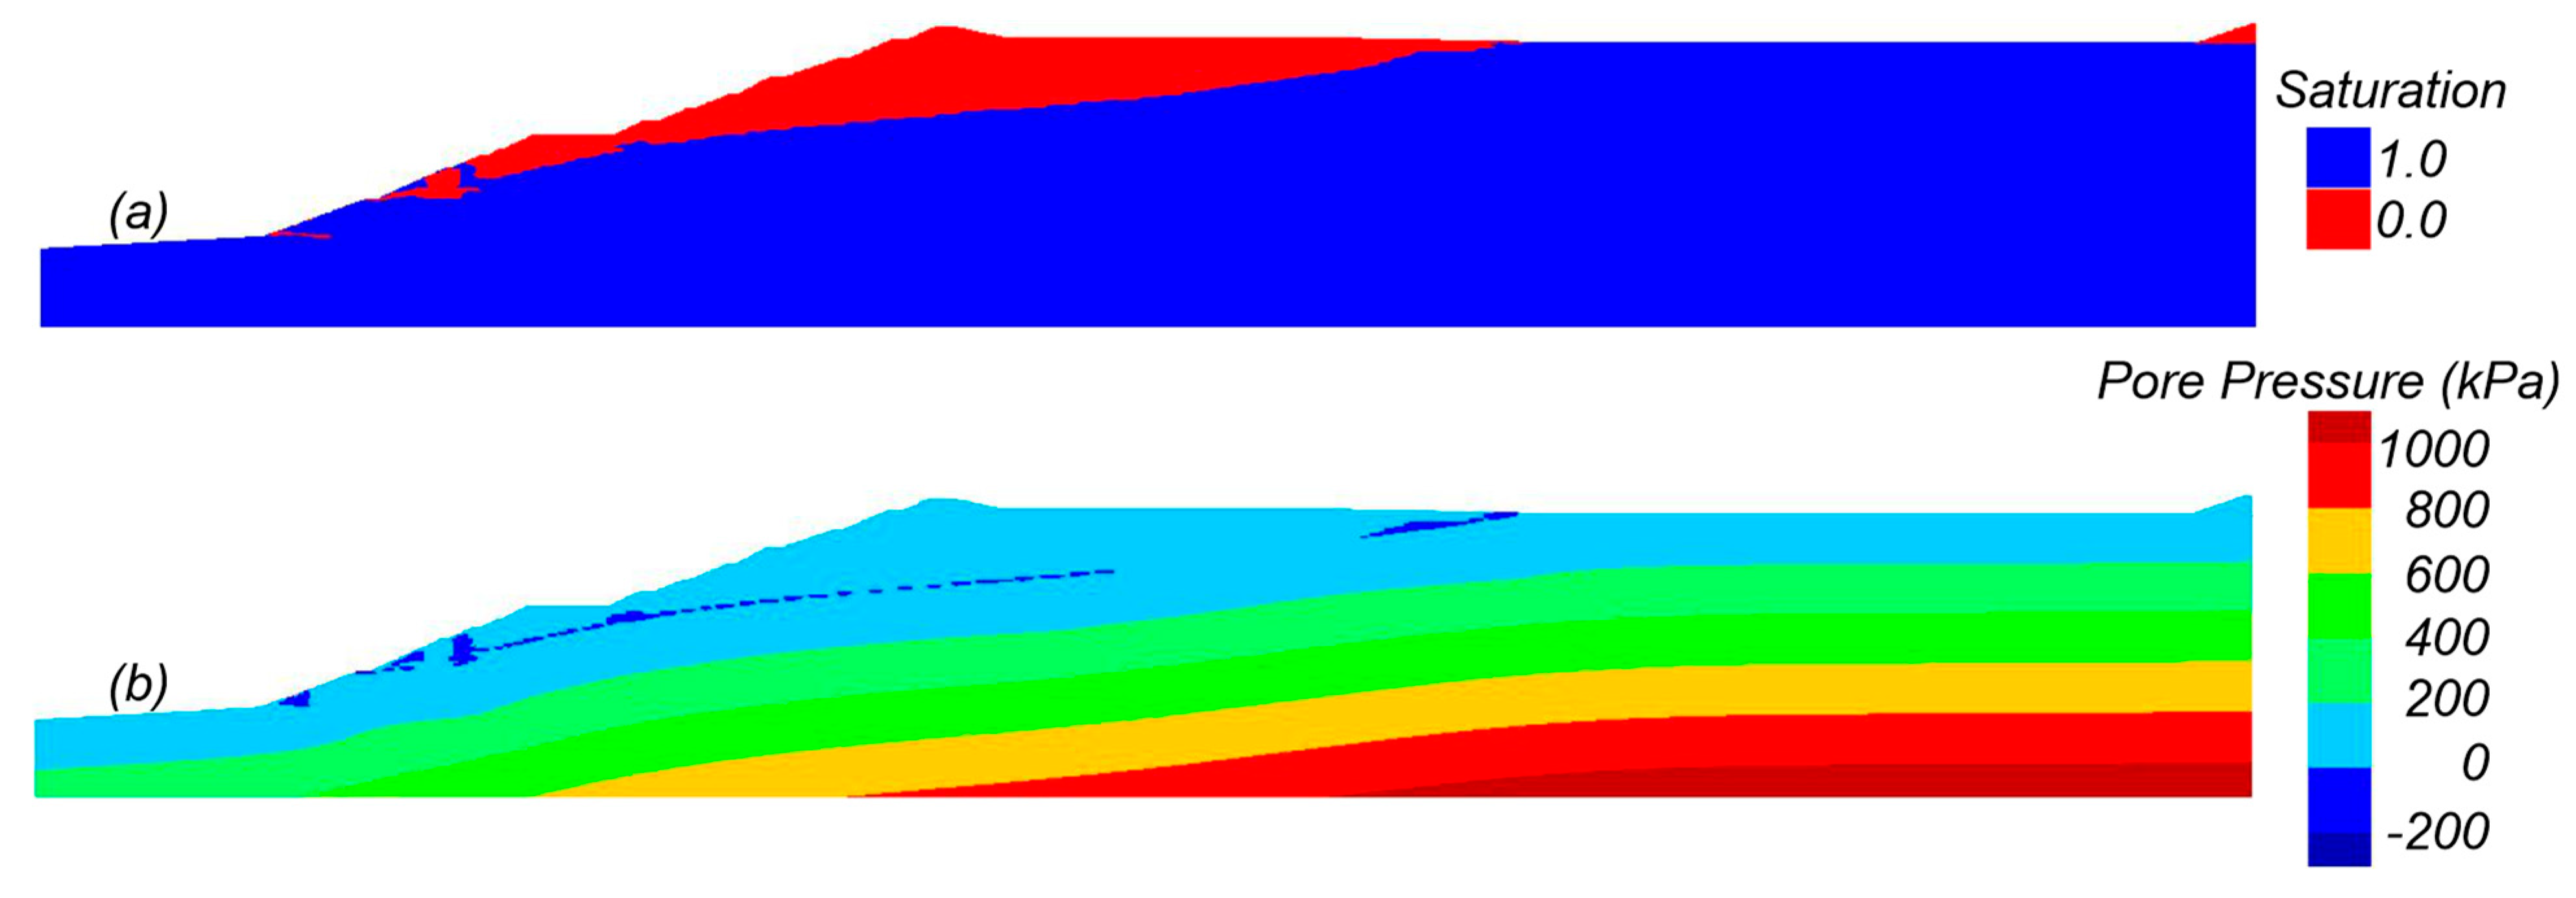
The initial seepage conditions were established first using an uncoupled analysis calibrated to produce results consistent with the piezometer data and seepage analysis results in the EPR. The EPR examined seepage under 2D and 3D conditions and accounted for seepage in partially saturated soils. The analyses did not consider partial saturation and instead treated soils above the water table as dry (S = 0%) and below the water table as fully saturated (S = 100%). This approach is in line with the goal of using approaches commonly used in forward design where the influence of partial saturation is often not considered. The FLAC seepage analyses did not account for seepage in partially saturated soils, such that material property adjustments were made to obtain consistency with the piezometer data and EPR results. The pore fluid tensile stress controls the height to which soils are saturated by a capillary rise above the phreatic surface; pore fluid tensile stresses of 29.4 kPa, 9.8 kPa, and 9.8 kPa were assigned to the fine tailings, coarse tailings, and embankment materials to produce capillary saturation to heights of 3.0 m, 1.0 m, and 1.0 m above the phreatic surface, respectively. Hydraulic conductivities of the materials were initially assigned the values in Table 1 and then iteratively adjusted to obtain a phreatic surface consistent with the EPR. The final calibrated analysis included two adjustments: (1) the isotropic conductivity of the foundation was reduced to 1 × 10⁻⁶ cm/s, and (2) the coarse tailings conductivity was made isotropic with a reduced conductivity of 1 × 10⁻⁵ cm/s. The results of the steady-state seepage analysis are illustrated in Figure 9, which shows saturation and pore pressure contours. The calibrated phreatic surface, like in the EPR, is high near the face of the dam due to a lack of internal drainage in the lower portion of the dam.
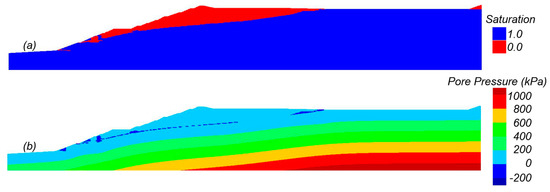
Figure 9.
Contours of (a) saturation and (b) pore pressure at the end of consolidation.
Initial stress conditions were computed with another uncoupled analysis (using pore pressures based on the preceding step) in which (1) vertical stresses were based on overlying soils, (2) horizontal stresses were assigned based on a K0 = 0.5, and (3) all zones assigned a Mohr-Coulomb constitutive model and a stress-dependent secant shear modulus. After solving for equilibrium, the material models were then switched to PM4Sand and PM4SiltR (without viscous parameters) and equilibrium was again solved.
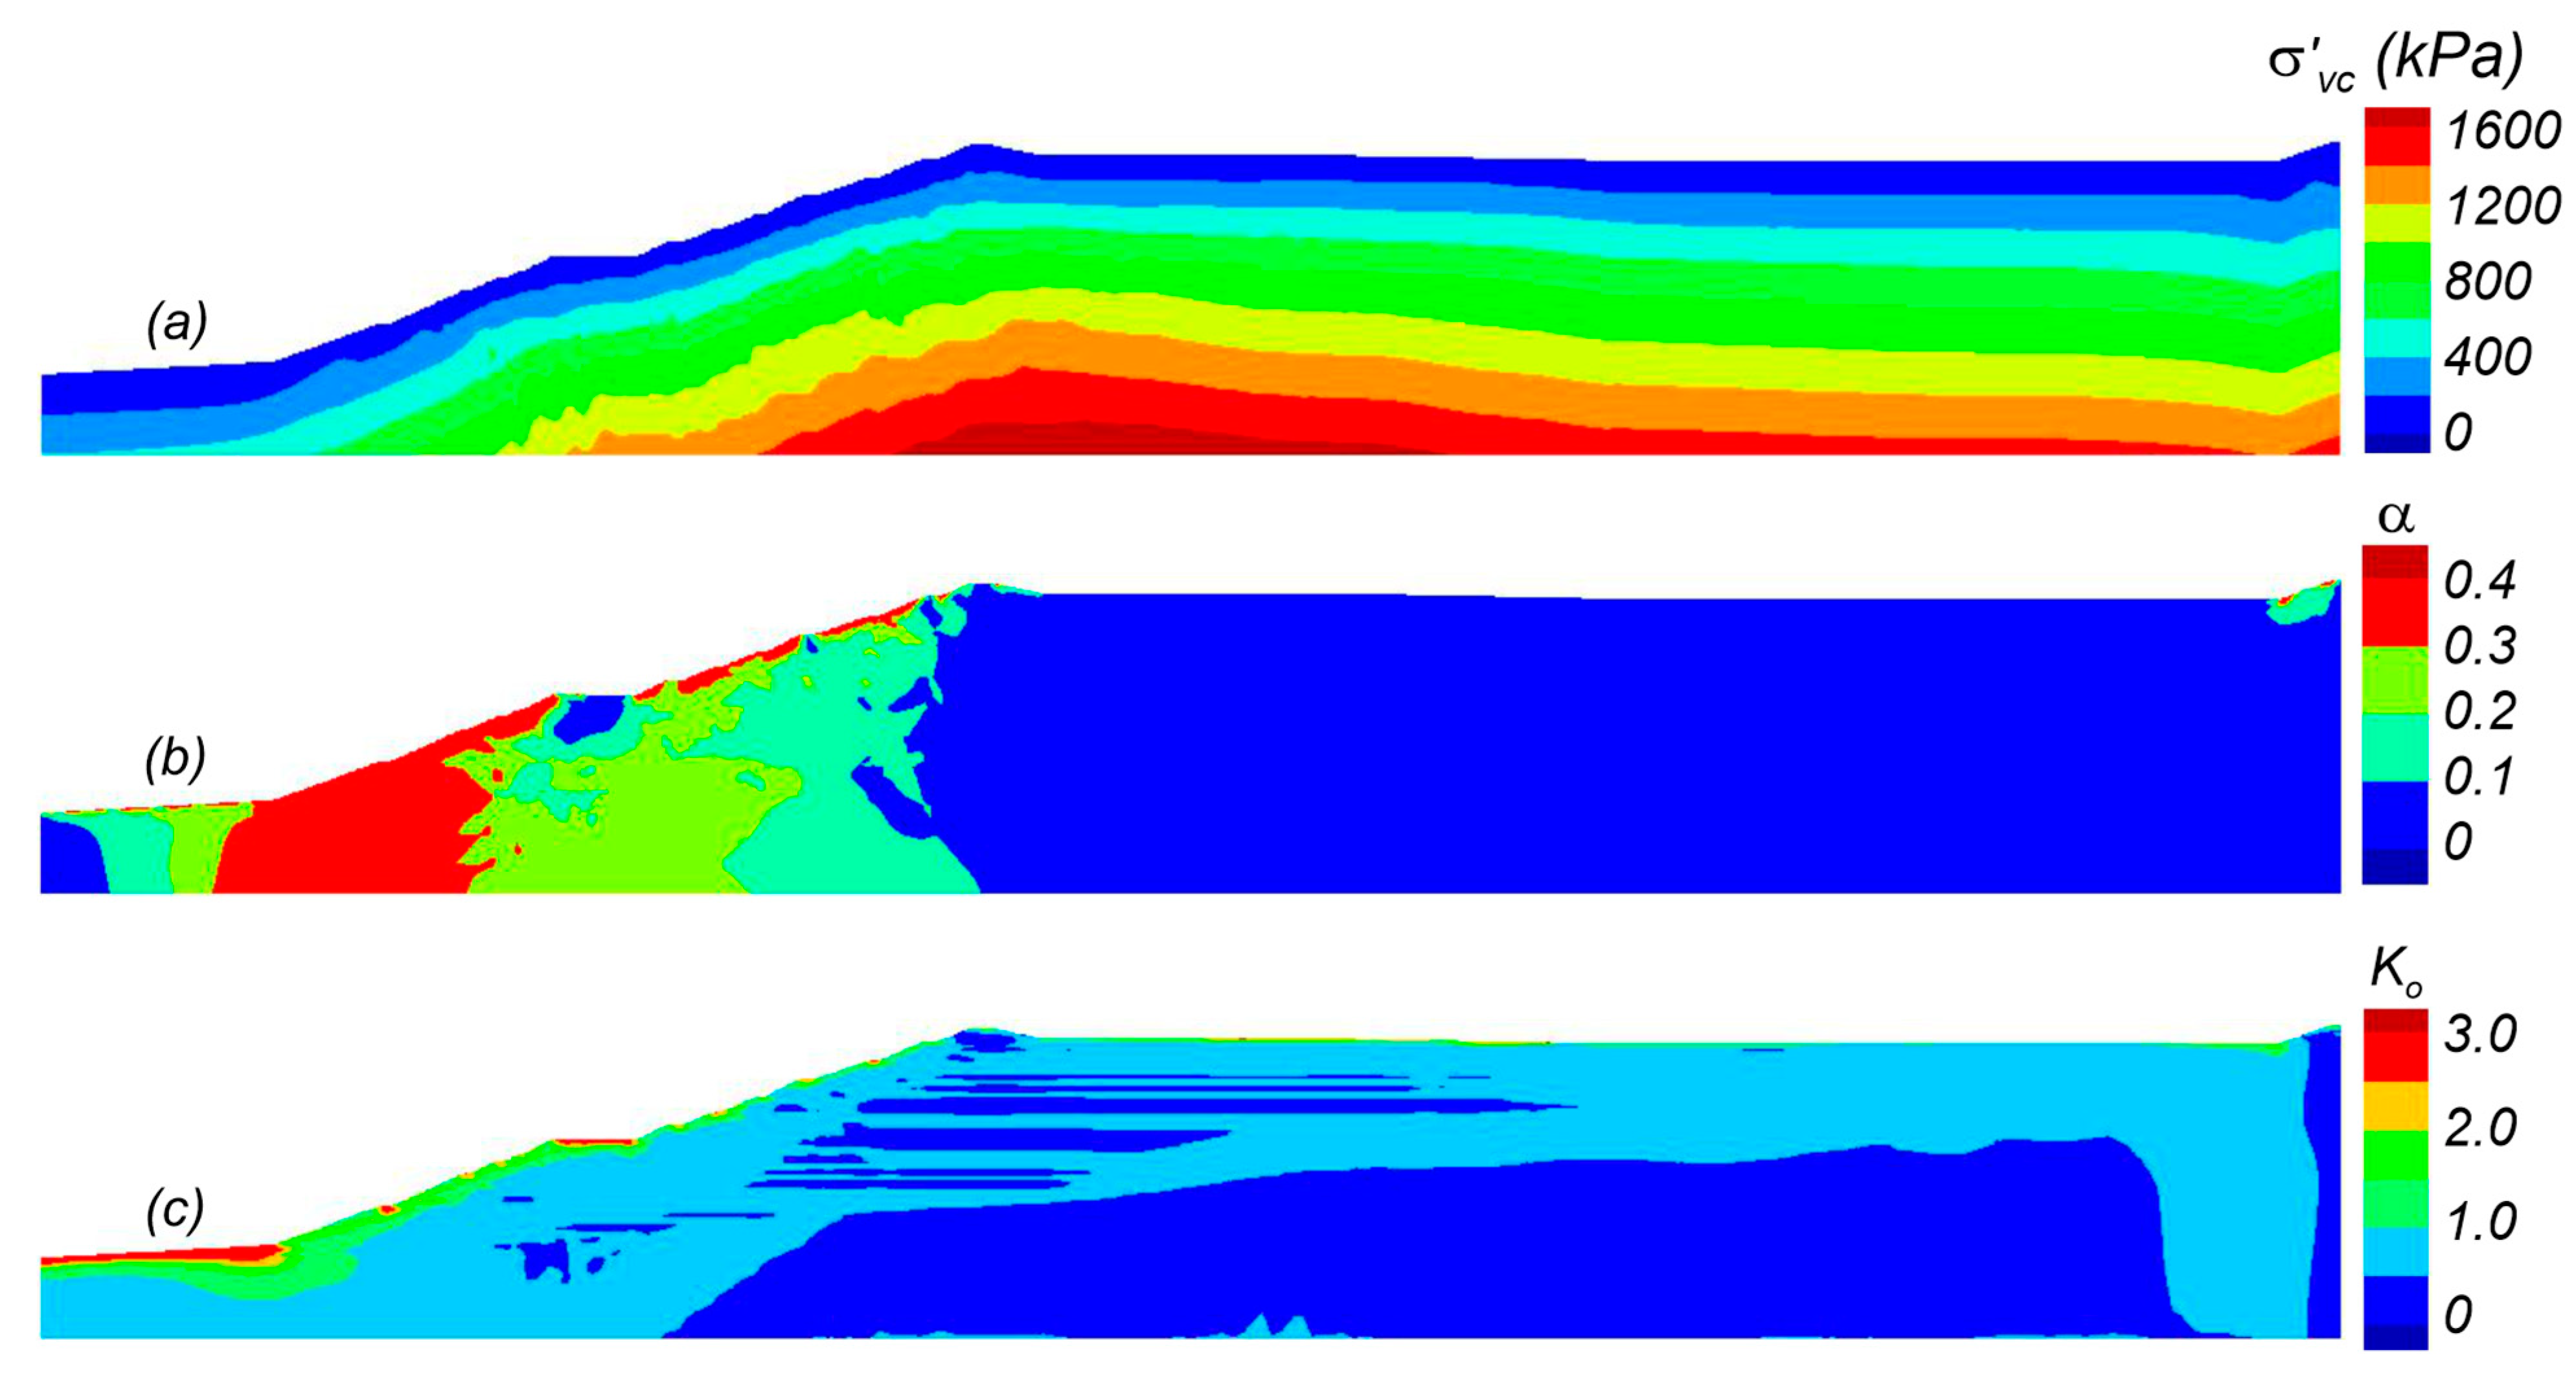
Viscous parameters in PM4SiltR were then initiated and a coupled creep analysis was performed with all materials fully drained. The final “initial” stress conditions were established when creep deformations had ceased, corresponding to a long-term fully consolidated condition. The initial stress conditions are illustrated in Figure 10 in terms of (a) σ′v, (b) α, and (c) K0. The σ′v increases smoothly with depth from the ground surface. The α values range from 0.1 to 0.3 in the tailings and foundation under the embankment and approaches 0.4 near the dam face. Large α values are expected due to the relatively steep slope of the embankment and the placement of the set-back relative to the dam face. K0 is generally 0.5 in the tailings below the dam face except in narrow bands where K0 is decreased due to rotation of principal stresses in the fine tailings.
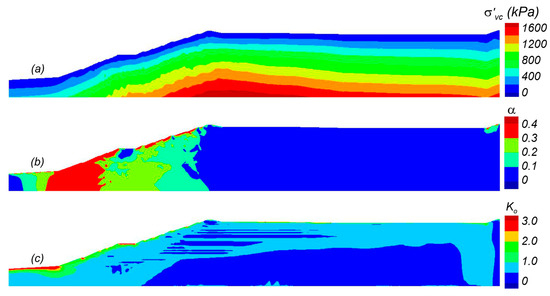
Figure 10.
Initial static stress conditions at the end of consolidation: (a) vertical effective stress (σ′vc); (b) horizontal static shear stress ratio (α); and (c) at-rest lateral earth pressure coefficient (K0).
6. Static Factor of Safety by SSRM
The static FS against slope instability, evaluated using the SSRM, is presented first to provide context for the viscoplastic nonlinear analysis results presented next. The SSRM analyses used non-strain-softening Mohr-Coulomb models (i.e., neglecting progressive failure effects) and assigned strengths based on the initial stress conditions and strength properties described previously. For long-term drained stability, materials were assigned the following drained friction angles: (1) 34° for the coarse tailings and foundation materials; (2) 33° for the fine tailings; (3) 30° for the slime; and (4) 36° for the embankment materials. The FS was 1.54 for this long-term drained condition. For long-term (consolidated) undrained stability, the analyses assumed (1) the embankment was drained with a friction angle of 36°, (2) the foundation was undrained with an su/σ′vc = 0.5, (3) the coarse tailings were undrained with an su/σ′vc = 0.29 where saturated, and drained with a friction angle of 34° where unsaturated, (4) the fine tailings were undrained with an su/σ′vc = 0.21 where saturated, and drained with a friction angle of 33° where unsaturated, and (5) the slime was undrained with an su/σ′vc = 0.16. The FS for this long-term consolidated undrained condition was 1.06. The failure surface was similar to those observed during the nonlinear analyses. The low FS for long-term undrained loading indicates that the dam was only marginally stable, such that, when combined with progressive failure effects, it is reasonable to expect instability may be triggered by some combination of a relatively small increase in loading or reduction in shear strength. The low FS is consistent with recent analyses [4] that calculated the FS to be between 1.11 and 1.16 using 2D numerical limit analyses. The small difference in FS can be attributed to their slightly higher characterized strength (su,pk/σ′vc = 0.22 versus 0.21) of the fine tailings and differences in geometries, imposed drainage conditions, and stratigraphy.
7. Nonlinear Viscoplastic Deformation and Stability Analysis
Nonlinear viscoplastic analyses were performed for two different loading/disturbance scenarios applied after the establishment of the initial stress conditions (i.e., long-term, fully consolidated condition). The two loading scenarios are (1) wetting events and (2) borehole disturbance events. These analyses imposed fully undrained conditions (i.e., no flow) and thus do not account for the potentially beneficial effects of consolidation during creep. This is a conservative assumption that is in line with the primary goal of assessing the ability of the utilized approaches to reasonably approximate the observed global failure rather than directly model the fundamental mechanisms behind these small overall loading increments. Further, the approaches used herein (e.g., uniform soil properties and no transient seepage or partial saturation) are consistent with forward design in practice but differ from other advanced approaches (e.g., spatial variability, considering transient seepage and partial saturation) that may be used in failure analyses (e.g., [2,3]). Parametric analyses are used to evaluate how the responses to different loading intensities are affected by reasonable variations in input parameters and analysis procedures.
7.1. Response to Wetting Events
Wetting events were modeled as a progressive uniform increase in the degree of saturation (ΔS) in the unsaturated materials above the phreatic surface while simultaneously eliminating suction (negative pore pressures) in the soils saturated by capillary rise. Increasing ΔS increases the weight of the potential slide mass through increased water contents and unit weights and reduces the resisting force with the loss of suction, both of which decrease the stability of the dam. The water content changes (Δwc) in the fine tailings, coarse tailings, and embankment materials due to the imposed ΔS are shown in Table 4. The Δwc is different for each material because they have varying porosities and specific gravities. For example, imposing ΔS = 15% produces Δwc of 4.7%, 3.3%, and 2.4% in the fine tailings, coarse tailings, and embankment materials above the phreatic surface, respectively. These Δwc affect only a portion of the eventual slide mass, as shown later, such that an imposed ΔS = 15% increases the slide mass weight and average driving shear stress along the eventual failure surface by only ~2.2%. This increase in driving stresses is combined with a concurrent reduction in shear strength within the zone of capillary rise (due to the imposed loss of suction), but the increase in driving stress has a greater influence because the zones of capillary rise are not large relative to the dimensions of the slope. In all cases, wetting events are imposed by linearly increasing the degree of saturation and linearly reducing capillary suction pressures in applicable zones over a period of approximately 4 days; this short loading period is a simplification for reducing computational time, given that the problem idealization does not attempt to simulate the transient effects of infiltration/evaporation on the pore water suction and strength characteristics of the unsaturated zones.
Table 4.
Changes in saturation, water content, and average slide mass weight.
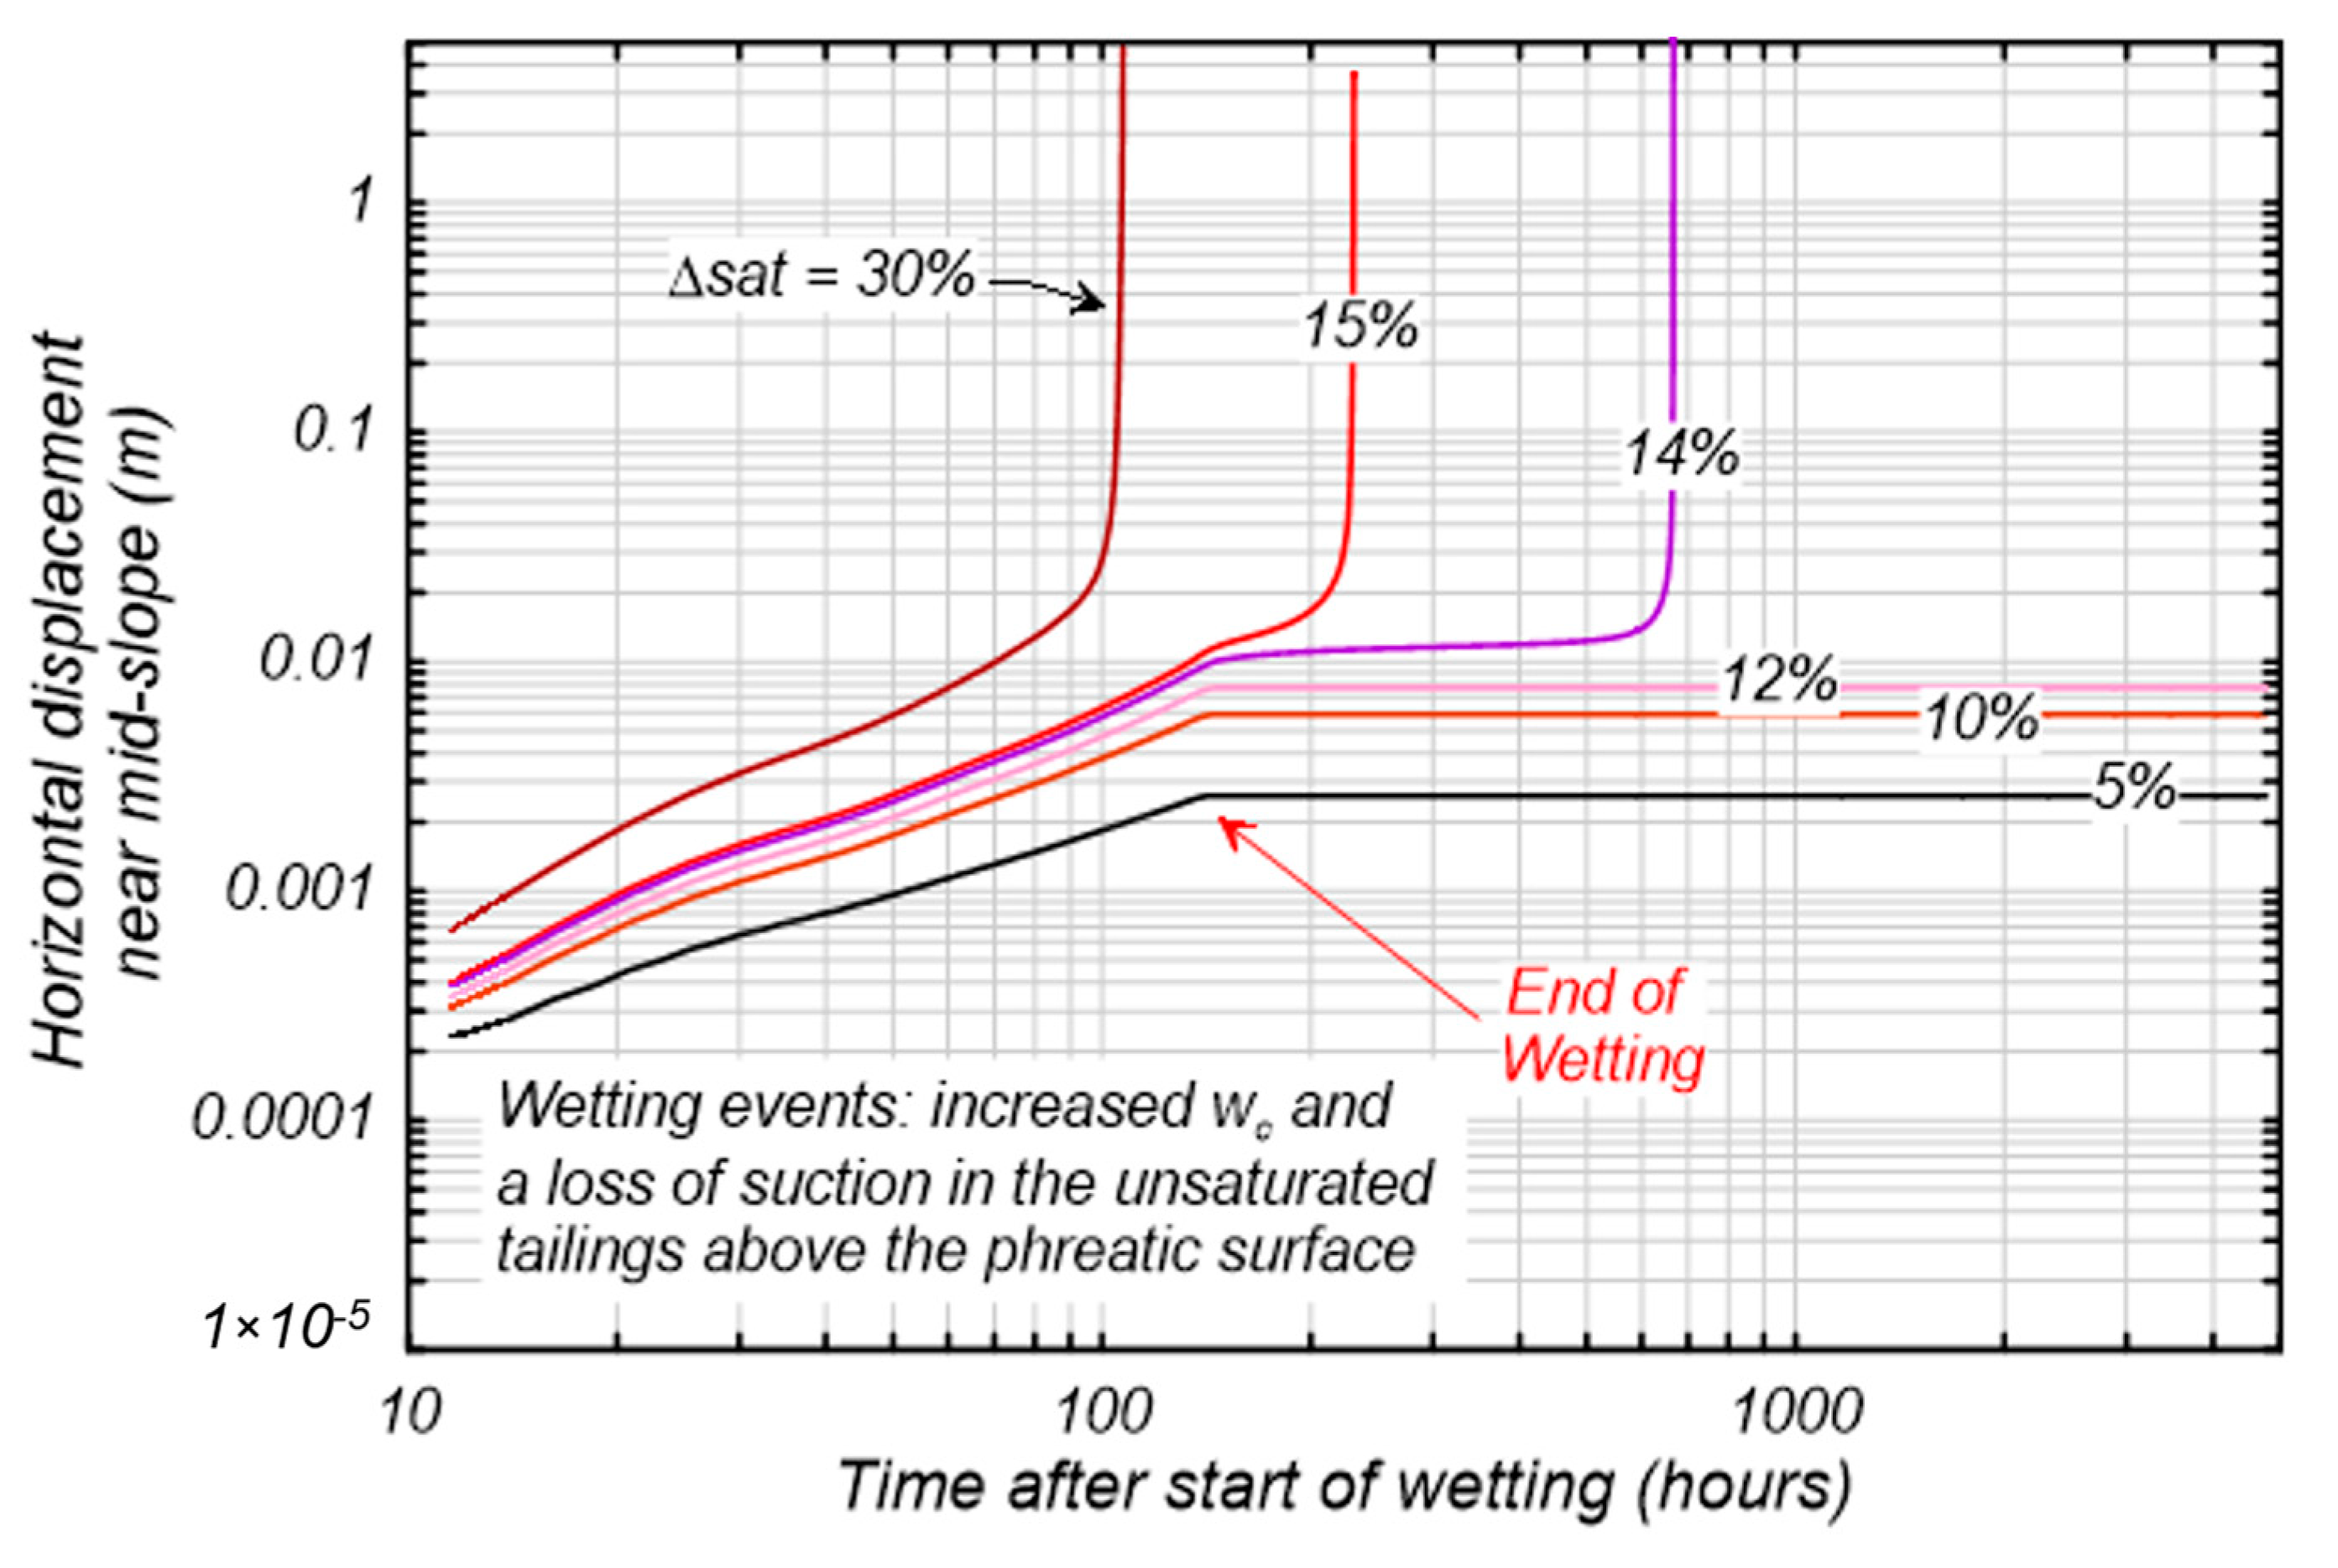
Horizontal displacement at the mid-slope setback is plotted versus time since the start of wetting in Figure 11 for ΔS of 5%, 10%, 12%, 14%, 15%, and 30%. Simulations with ΔS 12% accumulated less than 10 mm of horizontal displacement at the set-back with most of the deformation occurring as the wetting load was imposed. The simulation with ΔS = 30% failed during the wetting event. The simulations with ΔS = 14% and 15% developed slope instability in approximately 24 days and 6 days, respectively, after the end of the wetting event. For both these cases, displacements at the set-back remained small (less than approximately 20 mm) until just prior to the failure occurring. Imposing ΔS = 14% or 15% increased the average driving shear stresses along the eventual failure surface by only about 2.2%, which might not be expected to trigger failure on its own given the static FS = 1.06, but it was sufficient to trigger failure because it initiated the onset of progressive failure.
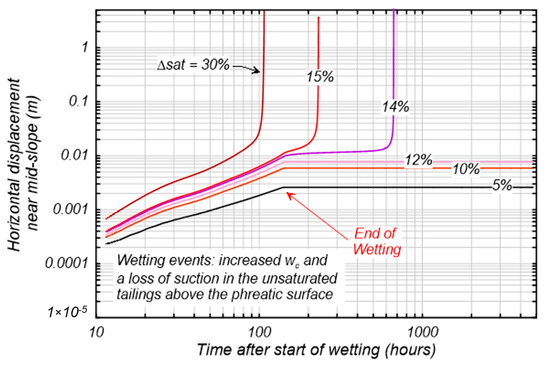
Figure 11.
Horizontal deformations at the set-back versus time after the start of a wetting event causing an increase in the percent saturation (ΔS) and loss of suction in unsaturated tailings above the phreatic surface.
Wetting events that resulted in slope instability involved progressive failure as the failure surface (or shear zone) developed over time in the strain-softening tailings. The progressive development of the eventual failure surface is shown in Figure 12 which shows shear strain contours (capped at 15%) for the simulation with a ΔS = 14% at set-back displacements of 2 cm, 5 cm, 20 cm, 40 cm, and 500 cm. The failure surface initially developed in a thin fine tailings layer that approaches the dam face near the top of the first raising; this region had initial α values close to the su,pk/σ′vc and thus required only a minor shear stress increase before beginning to strain-soften. Set-back displacements were only 2 cm at an elapsed time of 648 h (27 days) and 5 cm at 663 h (28 days), followed by a more rapid increase in displacements leading to slope instability four hours later (elapsed time = 667 h). The fully developed failure surface is illustrated in Figure 13, which shows contours of x-displacement and y-displacement at the end of the simulation. The failure surface daylights on the dam face near the top of the first raise and at the crest behind the final raising. The simulated failure surface is similar to the failure observed in the video and those predicted by the EPR and CIMNE. These analyses do not simulate runout or retrogressive failure mechanisms, although it would be expected that collapse and runout of slide materials above this relatively steep failure surface would be followed by retrogressive slip surfaces as the remaining slopes are too steep to remain stable.
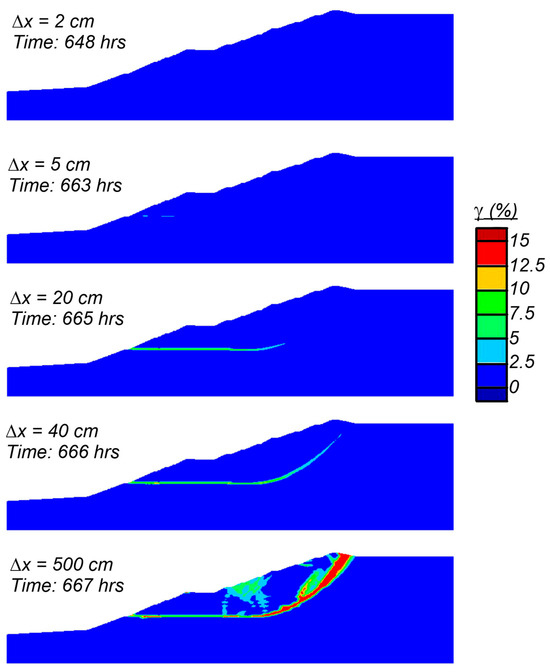
Figure 12.
Shear strain contours (capped at 15%) at slope deformations of 2 cm, 5 cm, 20 cm, 40 cm, and 500 cm for the simulation with a ΔS = 14%.
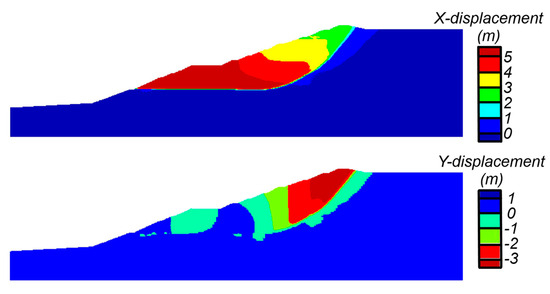
Figure 13.
Contours of X-displacement and Y-displacement at the end of the simulation with a ΔS = 14%.
The EPR modeling of the wetting event assumed a uniform strength reduction of 15 kPa in all of the unsaturated tailings due to a loss of suction, whereas the analyses herein assumed a strength reduction in the tailings with suction due to capillary rise (3 m in the fine tailings and 1 m in the coarse tailings). These two approaches crudely approximate the effects that transient infiltration and evaporation would have on soil strengths, and they produce different magnitudes of reduction in the overall resisting force. The approximate total resisting force of the simulated failure band (based on a piecewise averaging of strengths along the failure band) is approximately 75,000 kN/m. The unsaturated tailings accounted for approximately 60 m of the failure band in the analyses herein. The EPR approach would result in a reduction of approximately 900 kN/m or approximately 1.2% of the total resisting force. The approach herein resulted in a reduction in resisting force of approximately 100 kN/m or 0.13% of the total resisting force. If the strength reduction due to loss of suction in the present analyses were of the same magnitude as in the EPR, the magnitude of wetting necessary to trigger slope instability would be smaller than shown. Separate numerical simulations of transient infiltration and evaporation that account for changes in soil pore–water suction characteristics could provide better guidance on the timing and magnitude of potential strength losses, but it is sufficient for the present study to recognize that these effects are on the order of a percent change in the total resisting force.
Parametric analyses were performed that varied the fine tailings strength, rate of strain-softening, and viscous parameters as well as the foundation strength and the drainage conditions in the coarse tailings. The maximum ΔS sustainable prior to creep failure is shown in Table 5 for the parameters varied, which also illustrates the effect of the parameter variation on su,pk and su,static. Decreasing the fine tailings su,pk by 10% caused the system to be unstable in undrained conditions without a change in loading (i.e., ΔS = 0%); consistent with the static FS = 1.06 and the eventual failure surface passing predominantly through fine tailings. Increasing the fine tailings su,pk by 10% increased the ΔS that can be withstood prior to creep failure to about 60% compared to 14% with the baseline su,pk. These results indicate that the magnitude of ΔS required to trigger instability is very sensitive to su/σ′vc because the FS is already close to unity. Decreasing the rate of strain-softening (by setting hpo = 1000) increased the ΔS prior to failure to approximately 26%, whereas increasing the rate of strain-softening (by setting hpo = 10) decreased the ΔS prior to failure to approximately 1%, indicating that the brittleness of the tailings is critical to the development of the progressive failure. Increasing the fine tailings su,static (either through Fp and FM or ) while keeping su,pk constant, increased the ΔS that can be incurred prior to loading. Conversely, decreasing su,static caused the system to be unstable in undrained conditions without a change in loading as the lower static strength of the fine tailings was sufficient to initiate progressive failure. Decreasing the foundation material’s su,pk/σ′vc to 0.40 resulted in the failure surface going through the foundation at the toe of the dam which was not observed in the failure. Modeling the coarse tailings as drained increased the ΔS prior to failure to 19% compared to 14% when the coarse tailings were undrained. The ΔS to failure was relatively insensitive to the coarse tailing’s drainage condition, illustrating that the fine tailing characterization was more critical to the stability of the structure. Varying other parameters would likely alter the magnitude of saturation needed to trigger the failure but have limited to no impact on the failure mechanism itself.
Table 5.
ΔS needed to initiate slope instability with variation in fine tailings calibration.
Simulations were performed with Fp = FM = 0.0 to investigate the stability of the slope in the absence of creep which had two primary effects. The first effect is that the static strength is the same as the characterized peak strength which increased the ΔS prior to slope instability to 40%. The second effect is that there was no delayed failure as stress reduction and creep in time were unable to occur. The failure occurs during the wetting event due to only the increased driving stresses. The absence of viscous effects did not alter the predicted failure surface. These simulations showed that nonviscous models could predict the failure mechanism but would be unable to capture a delayed failure and would estimate different magnitudes of loading necessary to trigger the failure.
Additional analyses were performed to evaluate the sensitivity to numerical implementation including mesh size and time step constraints. Sensitivity analyses using smaller strain increment limits for constraining time steps within the explicit creep solution of FLAC showed minimal effect on ΔS prior to instability (~1%) and a minor effect on the timing of the failure. The influence of mesh size and time step are additional factors that must be accounted for when analyzing the results of analyses on strain-softening materials. Further refining the mesh (decreasing the mesh size) reduced the magnitude of deformation needed for the system to become unstable. The mesh refinement also influenced the timing of the failure as the reduced deformations do not take as long to accumulate which allows failure to occur more rapidly. Additionally, due to the low viscosity of the tailings material, the system did not appear to benefit from the regularization (reduced mesh dependency) that is associated with the inclusion of viscous effects in analyses and as such the solution remained mesh-dependent. The mesh dependency would be expected to decrease in systems with more viscous materials.
7.2. Response to Drilling-Induced Disturbances
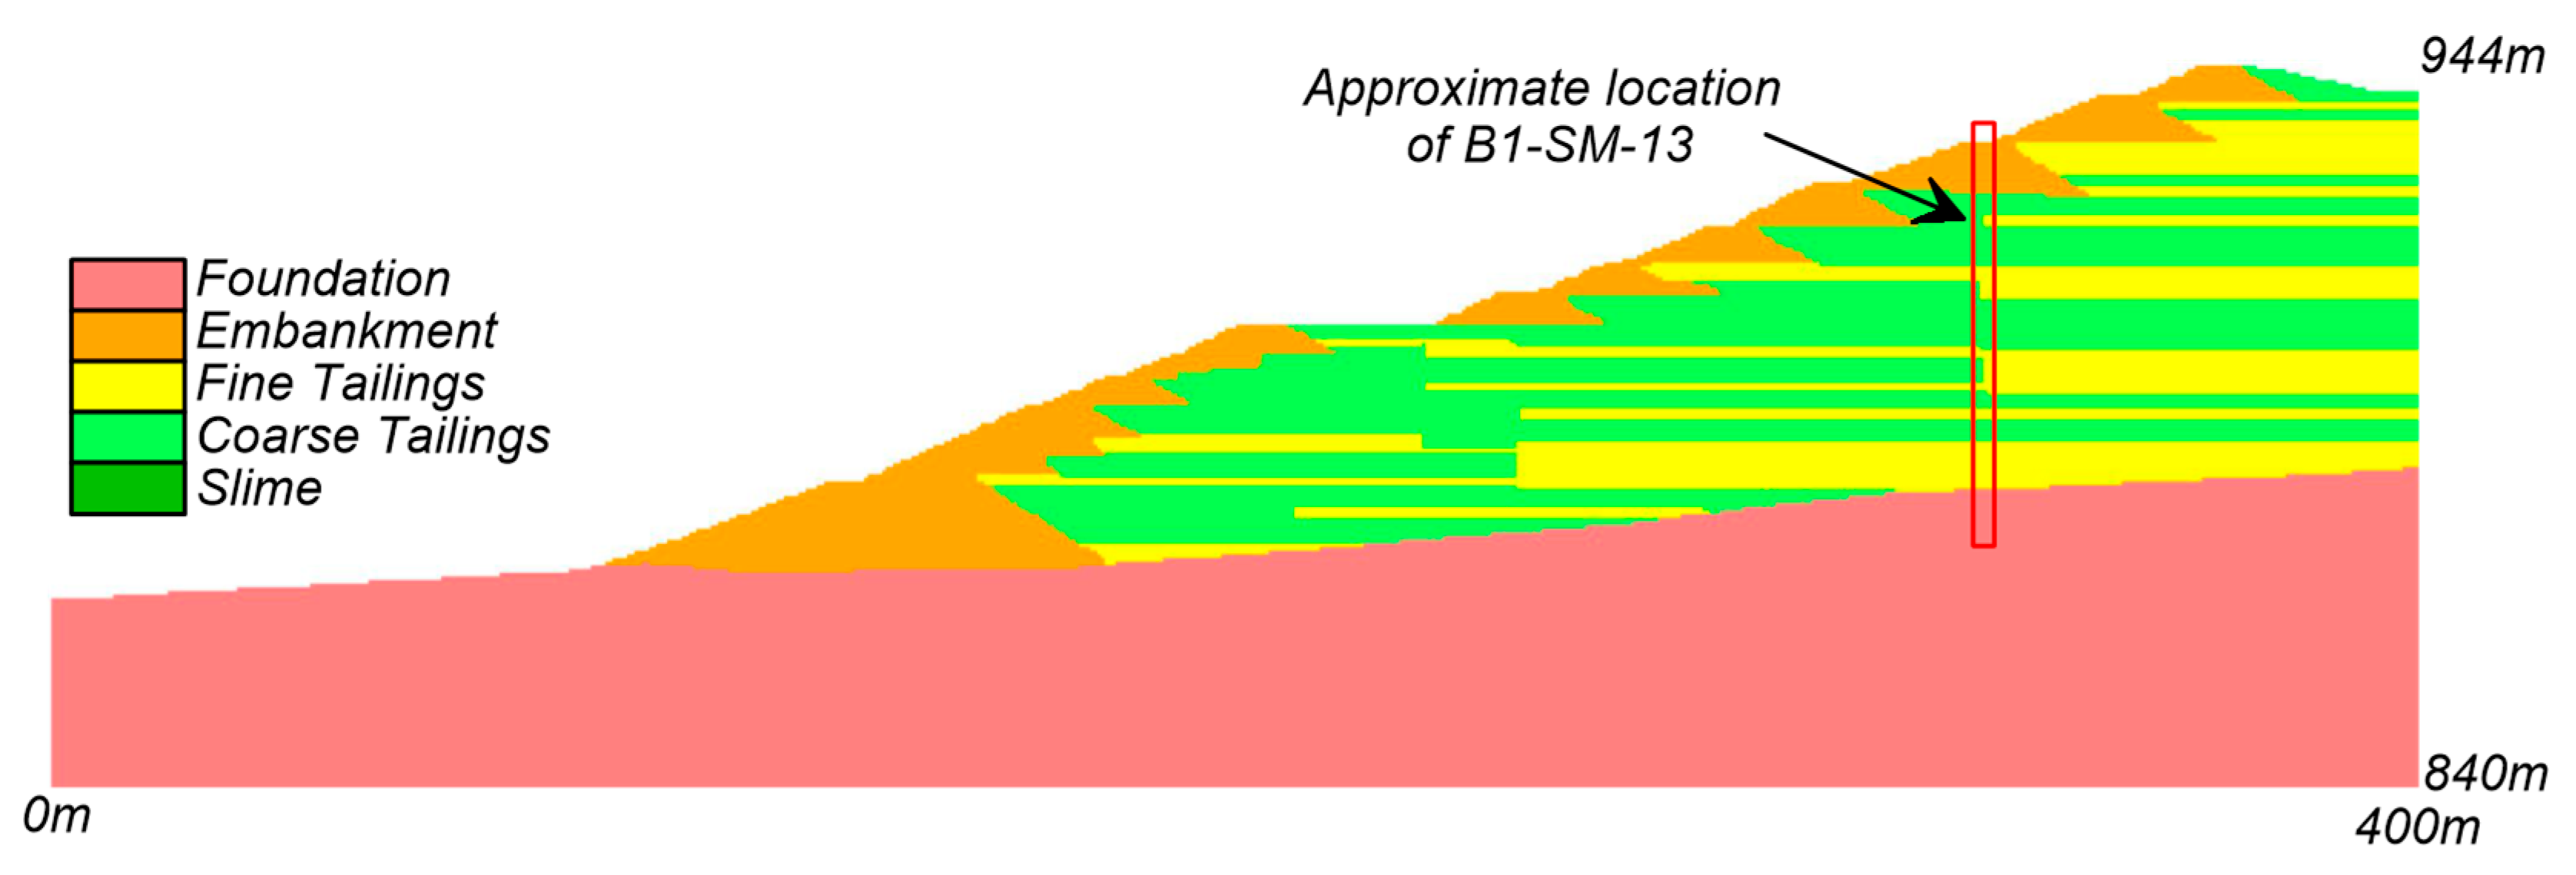
Drilling-induced slope instability was investigated by simulating large strength loss in a localized zone due to the hypothetical occurrence of a hydraulic fracture or over-pressurized zone along the borehole (B1-SM-13), which was being drilled at the time of failure. Figure 14 shows the approximate location of borehole B1-SM-13 along Section 3-3’. Available records indicate that borehole B1-SM-13 was advanced using rotary drilling methods with water recirculation in casing to native soil on the day prior to the failure [2]. No drilling log is available for this activity, and thus the potential for hydraulic fracturing and fluid loss to have occurred during drilling is speculative for the purpose of exploring the potential impacts of such an event. The potential extent of strength loss due to a hydraulic fracture was crudely estimated by equating an estimate of possible fluid loss with the volume of a fracture, e.g., a borehole water level drop of approximately 30 m (down to the phreatic surface) in a 100 mm-diameter hole could fill a 5 mm thick, circular fracture with a diameter of almost 8 m. The plan area of such a fracture would be equivalent to a 1.0 m wide zone over a 50 m long reach. Alternatively, the elevated water levels inside the borehole could have over-pressurized zones around the borehole, possibly triggering local strength losses or yielding. In this regard, CIMNE assumed that liquefaction was triggered in a local zone near the base of the tailings during the drilling of borehole B1-SM-13. Boring-induced liquefaction was imposed on a 1 m wide by 3 m tall zone around the borehole in their 2D analyses and as 1 m wide, 1 m long, and 3 m tall zone around the borehole in their 3D analyses of a 15 m wide slice of the slope. The actual size of any borehole disturbance zone is highly uncertain, but the above discussion suggests a 2D analysis should consider borehole disturbance as having relatively small dimensions. The baseline 2D mesh has elements that are generally 1 m tall by 2 m wide, such that the disturbance zone was modeled as being one element tall and a varying number of elements wide.
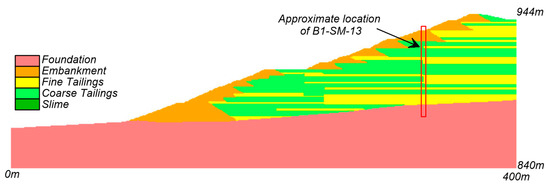
Figure 14.
Approximate location of borehole B1-SM-13 along Section 3-3’.
Parametric analyses varied the horizontal and vertical dimensions, depth, and strength loss for the potential borehole disturbance zone. The location of the borehole disturbance zone had a strong effect on the potential for drilling to trigger slope instability. Simulations with the borehole disturbance zone near the bottom of the tailings (just above the foundation surface) resulted in minimal deformations regardless of the vertical and horizontal dimensions examined (up to a zone of 1 m tall by 12 m wide). Simulations with the borehole disturbance zone at a depth of 45 m, which is close to the depth where the failure surface formed in the prior analyses for wetting events, were most susceptible to slope instability being triggered by a borehole disturbance. Possible disturbances at these intermediate depths would have occurred when drilling reached this depth the day before the slope failure.
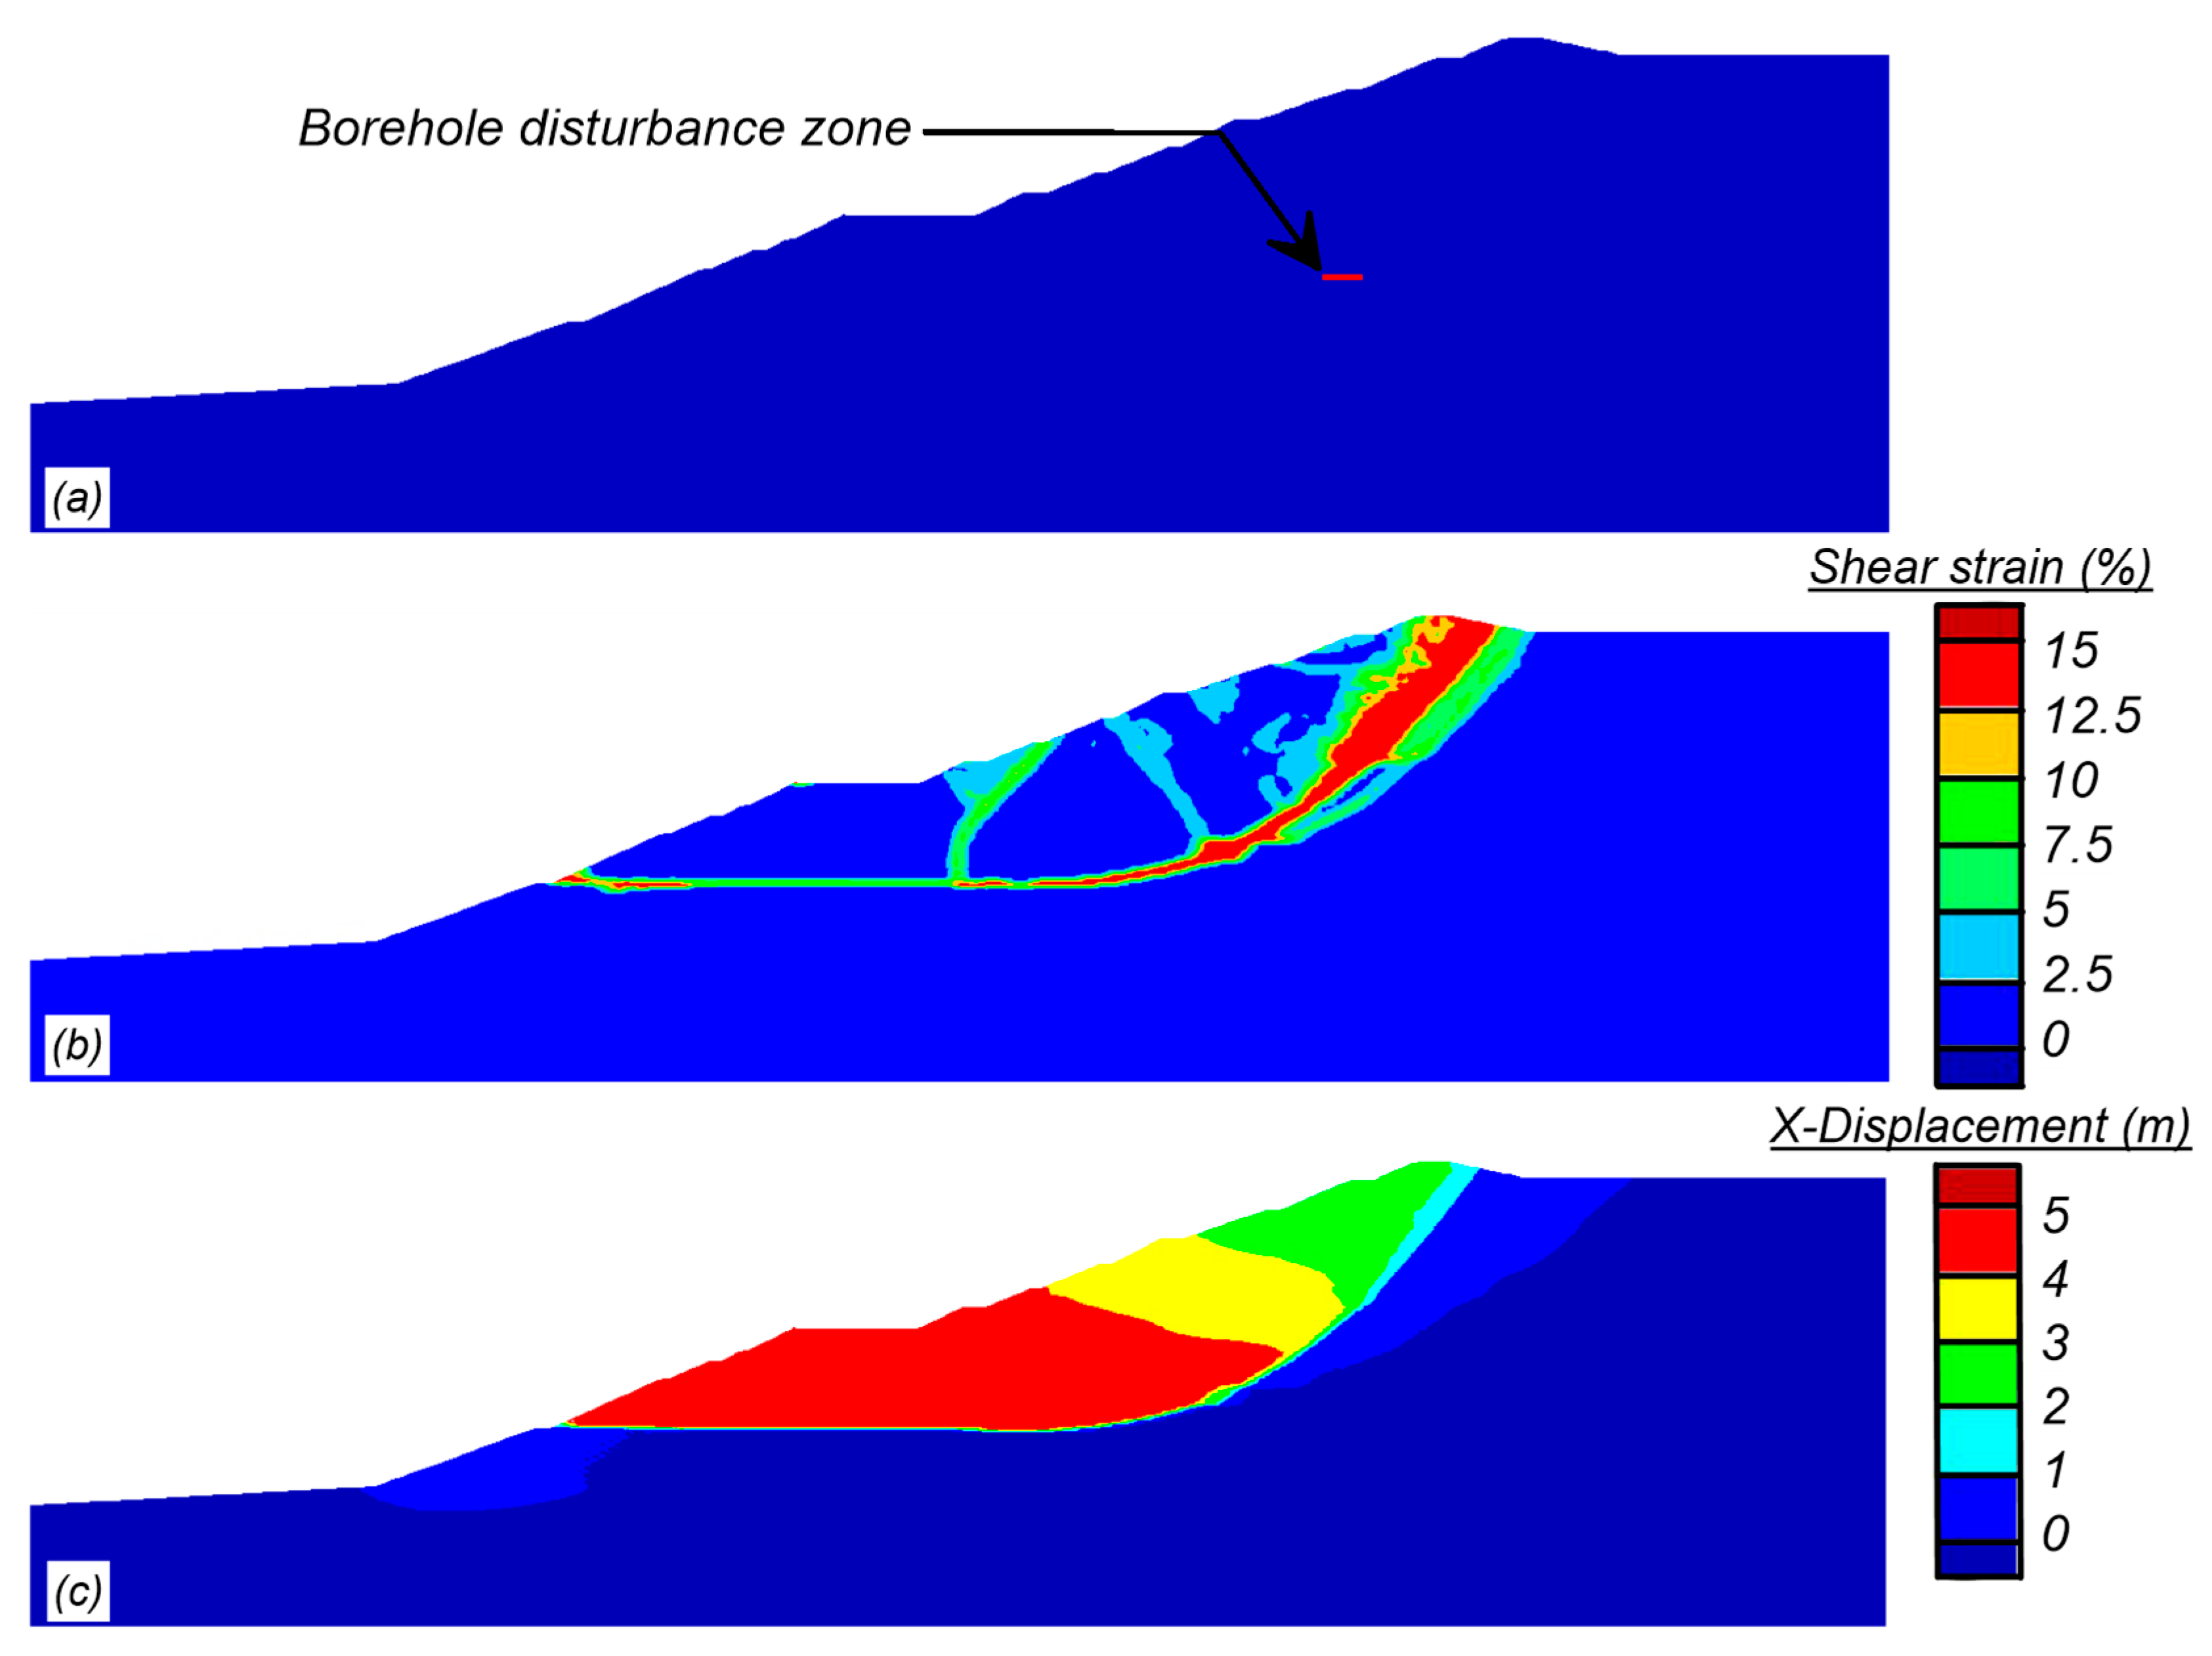
The results of a simulation with a borehole disturbance zone 12 m wide by 1 m tall at a depth of 45 m in borehole B1-SM-13 are presented in Figure 15 showing the location of the borehole disturbance zone (Figure 15a) and contours of shear strain (Figure 15b) and horizontal displacement (Figure 15c) at the end of the analysis. The displacement and shear strain contours illustrate a rotational failure with a slide mass that resembles the observed failure. The failure occurs approximately 35 h after the borehole disturbance which is qualitatively consistent with drilling at that depth having occurred the day before the slope failure. The 12 m length of the disturbance zone represents about 4.7% of the total failure surface length, which would increase average driving shear stresses elsewhere along the eventual failure surface by a similar percentage. This change in shear stresses might not be expected to trigger failure on its own given the static FS = 1.06, but it was sufficient to trigger failure because it initiated the onset of progressive failure as noted for the wetting event scenarios and discussed below.
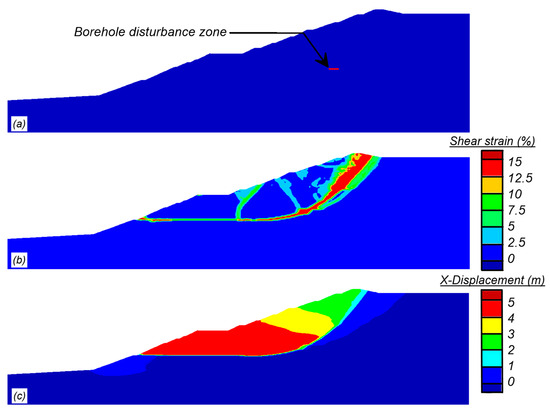
Figure 15.
Results of simulation of borehole disturbance causing slope instability: (a) borehole disturbance zone; (b) shear strain (capped at 15%); and (c) horizontal displacement.
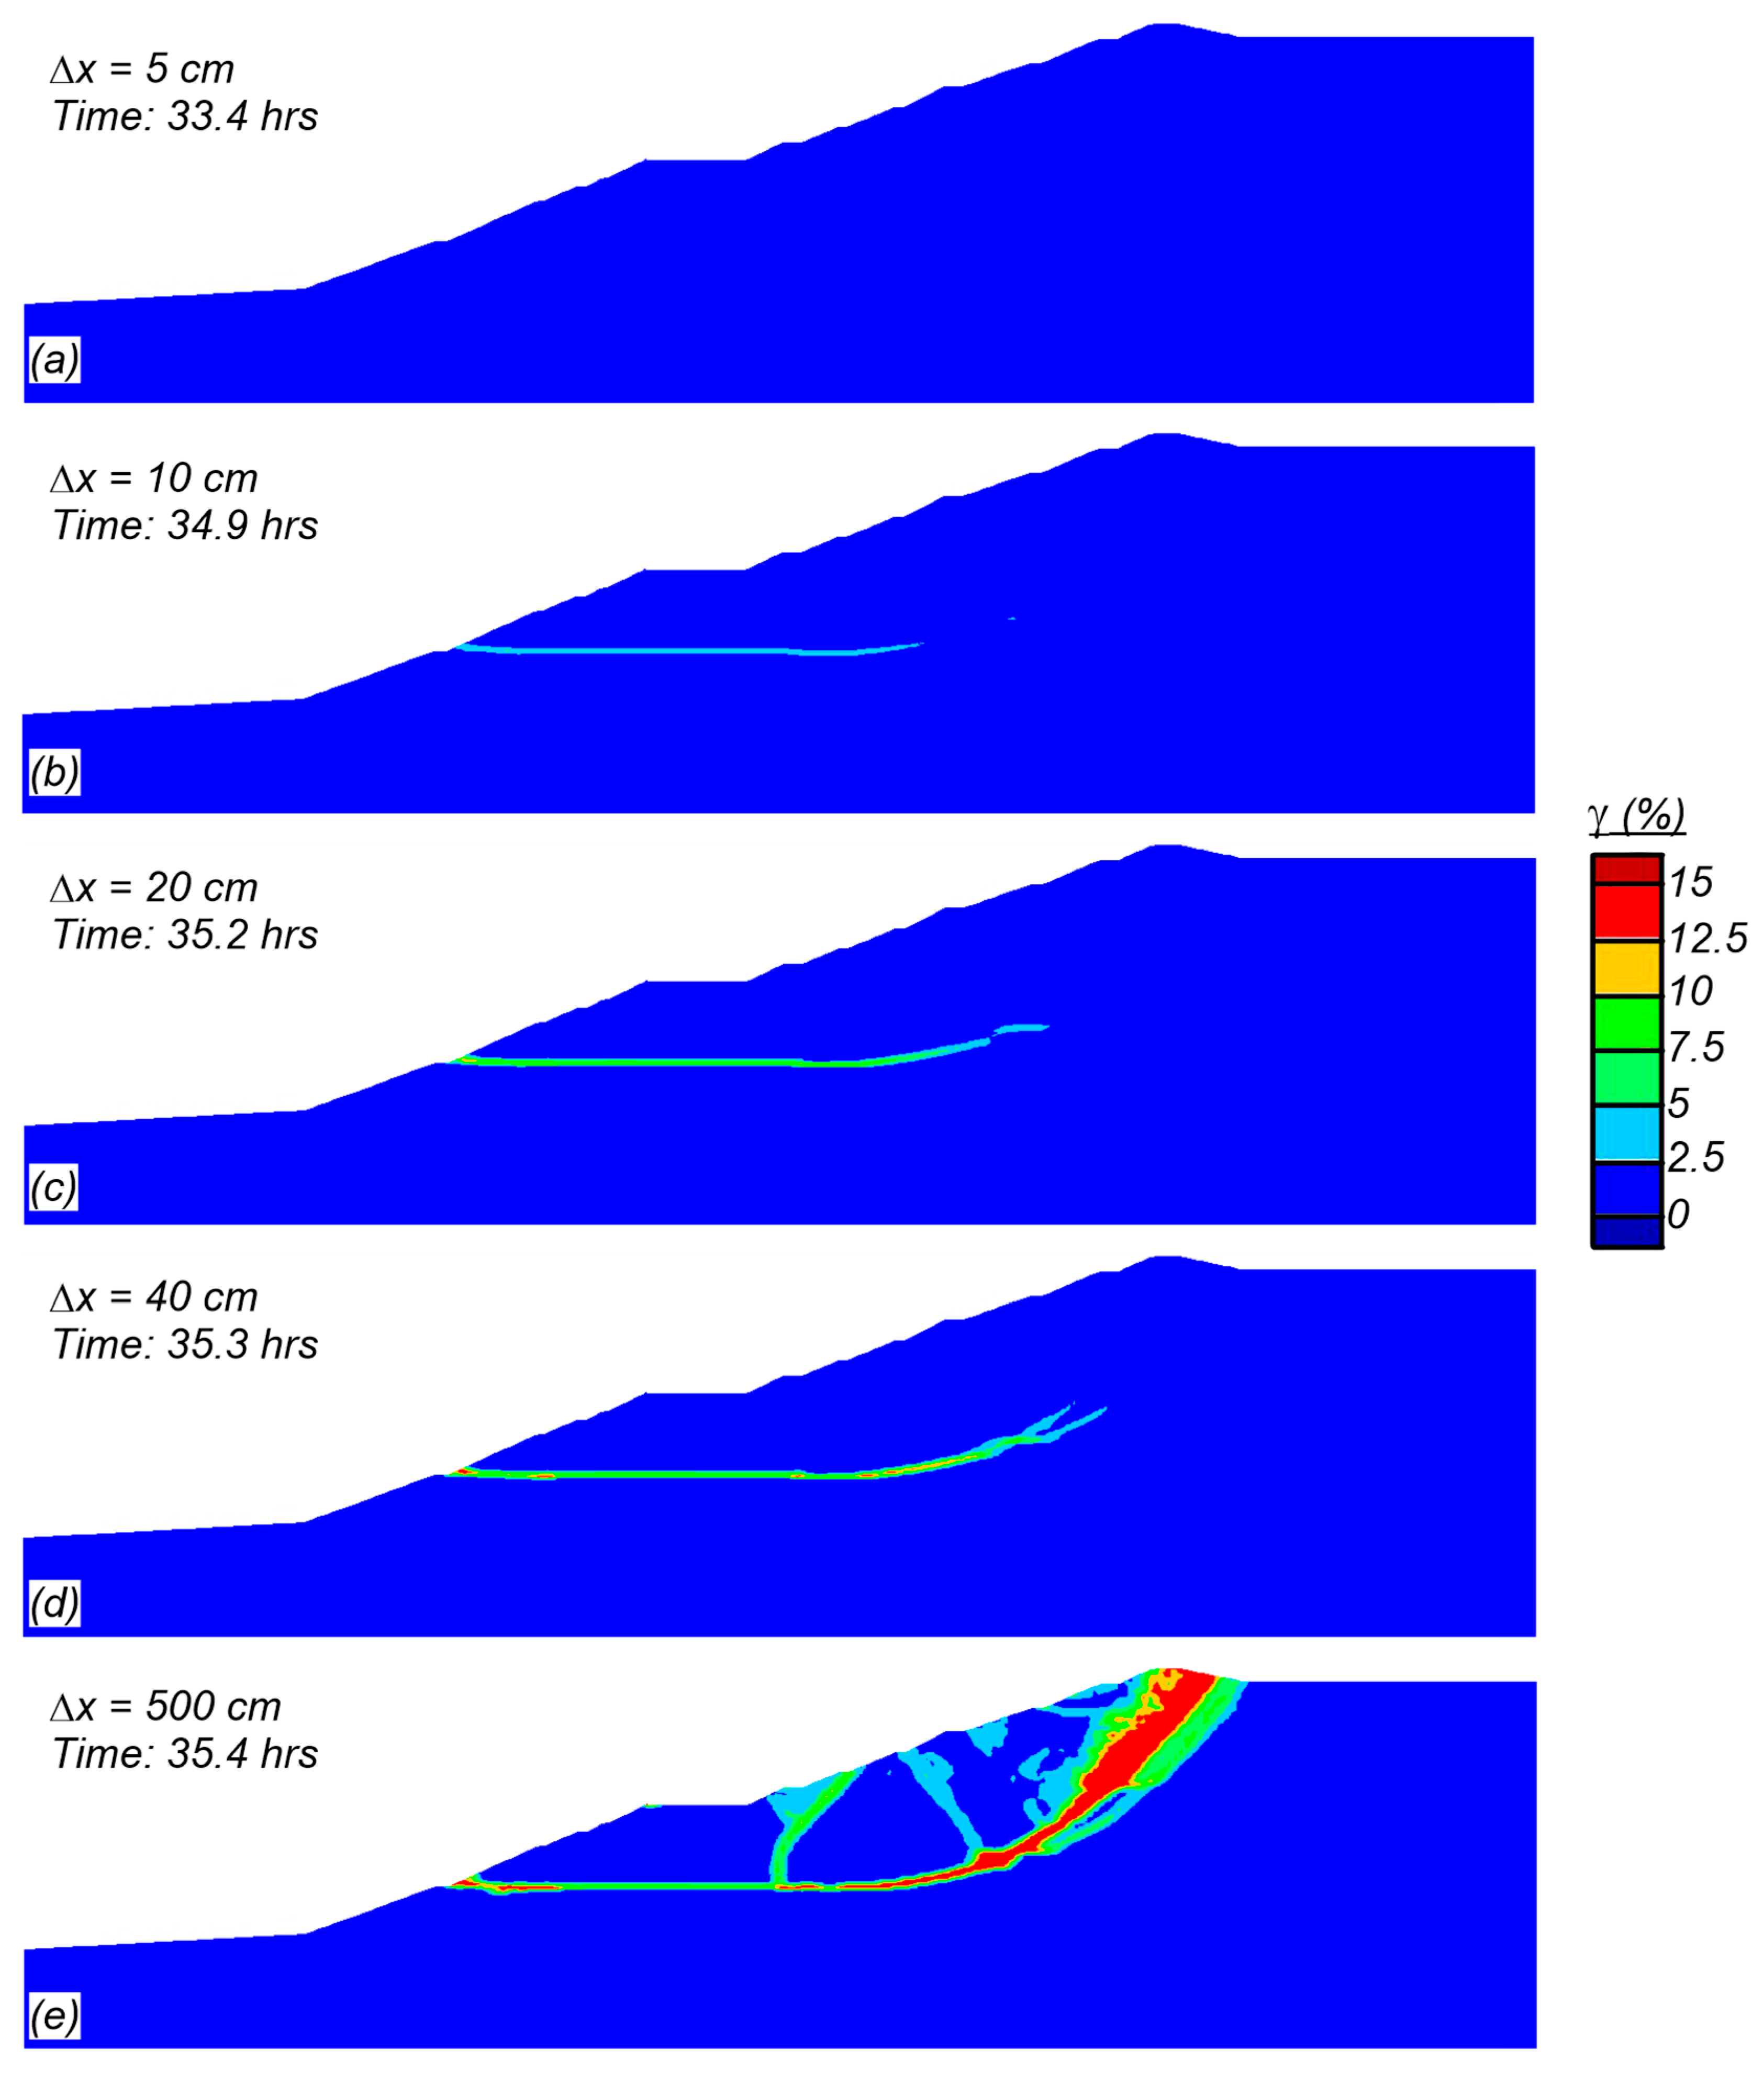
Borehole disturbances that trigger failure involve a progressive failure within the impoundment. Figure 16 shows shear strain contours (capped at 15%) when the horizontal displacements at the mid-slope setback are 5 cm, 10 cm, 20 cm, 40 cm, and 500 cm. Only 5 cm of displacement developed over the first 33.4 h after the borehole disturbance occurred, with no observed localized shear band. Over approximately the next 1.5 h (elapsed time 34.9 h) the displacement increased to 10 cm and the failure surface began to develop along the fine tailings layer near the dam face and to the left of the imposed borehole disturbance. At an elapsed time of 35.4 h, 500 cm of displacement had developed with full collapse underway. While the details and timing of the progressive failure may slightly differ, the similarity in shape and size of the failure surfaces from both a wetting event and from a borehole disturbance indicates that the critical failure surface is similar regardless of the triggering mechanism.
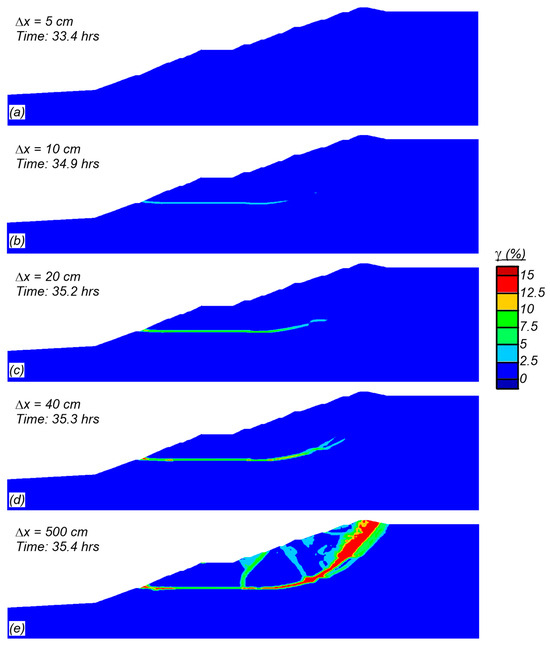
Figure 16.
Contours of shear strain (capped at 15%) at horizontal embankment deformations of: (a) 5 cm; (b) 10 cm; (c) 20 cm; (d) 40 cm; and (e) 500 cm.
Similar parameter variations were performed to identify the influence of critical fine tailings parameters on the disturbance width necessary to initiate undrained failure. As seen in wetting-induced displacement analyses; decreasing the su,pk by 10% and decreasing su,static (through either mechanism) caused the system to be unstable undrained without any external changes in loading. The smallest disturbance width that initiates undrained failure is shown in Table 6 for each of the parameters that were varied. Increasing the fine tailings su,pk by 10% increased the disturbance width necessary to induce undrained failure to >40 m compared to 12 m with the baseline su,pk. These results indicate that the disturbance width required to trigger instability is very sensitive to su,pk/σ′vc. Decreasing the rate of strain-softening (by setting hpo = 1000) increased the disturbance width prior to failure to 18 m, whereas increasing the rate of strain-softening (by setting hpo = 10) decreased the disturbance width prior to failure to 2 m. Increasing the fine tailings su,static (either through Fp and FM or ) while keeping su,pk constant, increased the disturbance width that can be incurred prior to loading to 16 m. Varying other parameters would be likely to alter the borehole disturbance width needed to trigger the failure, but have limited to no impact on the failure mechanism itself.
Table 6.
Disturbance width necessary to initiate slope instability with variation in fine tailings calibration.
Generally, the failure mechanism mobilized through the tailings and did not involve the foundation (consistent with the observed failure) regardless of the disturbance size and location. One exception was a simulation with the baseline properties and a disturbance width of 10 m which initiated a failure surface through the foundation. The same analysis with a disturbance width of 8 m remained stable with deformations less than 1 cm while a disturbance width of 12 m mobilized a failure through the tailings (Figure 15). These simulations highlight the sensitivity of the dam stability to the width of the imposed disturbance. They also highlight the sensitivity to the foundation strength as a slightly higher foundation strength would have precluded failure through the foundation.
8. Discussion
Feijão Dam 1 was marginally stable against undrained loading such that only minor loading changes were required to trigger undrained failure. Relatively small changes in shear stress were sufficient to initiate post-peak strain-softening and progressive failure in the fine tailings. The results showed that either a modest wetting event or borehole-induced disturbance could provide a large enough change in shear stresses to initiate progressive failure. Parametric analyses indicated that the time to failure may range from a few hours to upwards of two months. It is unlikely, however, that the longer times to failure would occur in the field as it is likely that the fine tailings would consolidate over that time scale. The estimated time to 50% consolidation for the fine tailings is about 2 days and 35 days for drainage lengths of 1 m and 4 m, respectively, based on the estimated hydraulic conductivity and compressibility for these soils. The coarse tailings would consolidate in considerably less time than the fine tailings as they behaved drained during CPT testing. This indicates that wetting from rainfall events months earlier was unlikely to be the sole cause of the failure although more recent rainfall events may have been a contributing factor. Further, the progressive nature of the failure highlights the need to directly account for potential strength loss in numerical analyses. Simulations that do not account for potential strength loss would be unable to predict the progressive failure mechanism observed in this failure.
The characterization of the fine tailings was critical to the overall stability of the dam as it was the weakest material near the dam face and laterally continuous over large distances in regions with high initial static shear stresses. These analyses showed that relatively simple site characterization techniques common in geotechnical practice were sufficient to predict undrained failure. The su,pk/σ′vc of 0.2 to 0.22 for the fine tailings was supported by a synthesis of results from procedures common in geotechnical practice for fine-grained (cohesive) materials including (1) interpretation of CPT data using an Nkt, (2) limited data from laboratory tests and in situ vane shear tests, and (3) empirical expectations for DSS loading of normally consolidated, plastic silts. This method of strength characterization resulted in similar strengths to those characterized by CIMNE which utilized a state parameter-based approach. Estimates of undrained strength (and other critical geotechnical properties) are best supported by a synthesis of different applicable approaches while recognizing the limitations and biases of each approach.
The stability analysis procedure used in this study has certain limitations and relies on several simplifications that limit the ability of the simulations to recreate certain case history details. For example, the analyses do not account for transient infiltration, evaporation, or seepage within the unsaturated zones and thus cannot directly evaluate the timing of strength losses that may be associated with the rainfall events that preceded the collapse. Similarly, the analyses do not directly model borehole disturbance processes but rather use a crude equivalent 2D representation of potential borehole-induced strength losses to provide insights into what level of strength loss could trigger instability. However, these types of simplifications and approximations were shown to represent the order of one or two percent changes in the total resisting or driving forces. The potential error associated with these and other simplifications/limitations is of secondary importance compared to the uncertainty in the undrained shear strength of the fine tailings alone, whether evaluating stability or the timing of deformations. Accordingly, the stability analysis results provide reasonable bounds on the observed responses and appear of sufficient accuracy to guide engineering assessments for similar facilities. The results also indicate that simplified approximations of complex loading conditions (e.g., increased saturation as a proxy for rainfall or localized strength loss as a proxy for drilling effects) provide a reasonable alternative to the highly intricate modeling necessary to fully account for the physics in these loading conditions while still providing insightful results.
The present analyses illustrate the need to consider consolidated, undrained strengths when evaluating the stability of earthen structures. However, as noted by Shewbridge [6], significant books [27] and manuals [28] do not consider long-term, consolidated, undrained strengths when assessing stability. Other texts (e.g., [29]) recommend considering consolidated, undrained strengths when evaluating long-term stability recognizing that failures in low OCR clays are rapid and can occur without notable changes in loading. Based on the present results and other recent slope failures in fine-grained soils, evaluations of long-term stability should always consider undrained shear strengths in fine-grained (cohesive) soils.
9. Conclusions
Two-dimensional nonlinear analyses of the 2019 Feijão Dam 1 failure were performed using the finite-difference program FLAC 8.1 with the user-defined constitutive models PM4SiltR and PM4Sand and following engineering procedures and analysis simplifications common in practice. Feijão Dam 1 was an 86-metre-tall tailings impoundment built with upstream construction that failed on January 25th, 2019. Negligible deformations were observed prior to the failure. Two prior investigations into the failure utilized a state parameter-based approach for strength characterization and found that the failure was due to either wetting-induced internal creep [2] or drilling-induced strength loss [3]. The present analyses primarily utilized the characterized index properties and drained strengths from the EPR. The undrained strengths were reevaluated using other methods commonly utilized in geotechnical practice including analysis of CPT data using an Nkt, limited laboratory data, and empirical correlations for DSS loading in low plasticity silts and clays for the fine tailings and a CPT-based Dr and remolded strength ratio approach for the coarse tailings. The strength characterization resulted in undrained strengths similar to the strengths obtained with the state parameter-based approach used by CIMNE.
The simulation results indicated that the dam was marginally stable against undrained loading and that both wetting-induced internal creep and drilling-induced strength loss were potential failure triggers. The failure was initiated in a fine tailings layer with high static shear stresses and the failure band progressively developed in time. Drilling-induced strength loss triggered slope instability when the idealized strength loss occurred along the critical failure surface. Sensitivity analyses indicated that increased rates of strain-softening and increased magnitude of viscous effects increase the potential for a progressive undrained failure to develop in the strain-softening tailings. These results were consistent with separate stability analyses using the SSRM method that gave an FS of 1.06 against undrained failure and did not account for progressive failure effects.
The results of these analyses indicate that nonlinear stability analyses using this combination of tools (FLAC with PM4SiltR and PM4Sand) and characterization methods were in reasonable agreement with the observed field behavior. The analyses were shown to capture the general shape and pattern of the failure mechanism, the susceptibility to instability due to minor loading changes, and the small deformations and minimal pore pressure changes prior to the collapse. Simplifications and limitations in the analyses limit the ability to recreate certain case history details, but the potential errors associated with these simplifications were of secondary importance to the effects of uncertainty in key soil properties. The results of this study provide support for the use of these stability analysis procedures in practice despite their simplifications and limitations.
Author Contributions
Conceptualization—T.J.O. and R.W.B.; Methodology—T.J.O. and R.W.B.; Writing—original—T.J.O.; Writing—review and editing—T.J.O. and R.W.B.; Software—T.J.O. and R.W.B.; Funding Acquisition—R.W.B.; Formal Analysis—T.J.O. and R.W.B.; Supervision—R.W.B. All authors have read and agreed to the published version of the manuscript.
Funding
The work described herein was supported in part by the California Department of Water Resources under Contract 4600009751. Any opinions, findings, or recommendations expressed herein are those of the authors and do not necessarily represent the views of this organization. The authors appreciate the above support.
Data Availability Statement
Data that supports the findings of this study are available from the corresponding author upon reasonable request.
Conflicts of Interest
The authors declare there are no conflicting interests.
References
- Thompson, F.; Lacerda, D.; Sartori, E.; Campos, G.M.; de Oliveira, B.C.V.; de Almeida, M.G.; de Aguiar, D.B.; Souza, T.d.S.; Vergilio, C.d.S.; de Rezende, C.E.; et al. Metal concentrations and biological effects from one of the largest mining disasters in the world (Brumadinho, Minas Gerais, Brazil). Sci. Rep. 2020, 10, 5936. [Google Scholar] [CrossRef]
- Robertson, P.K.; de Melo, L.; Williams, D.J.; Wilson, G.W. Report of the Expert Panel on the Technical Causes of the Failure of Feijão Dam 1. 2019. Available online: http://www.b1technicalinvestigation.com (accessed on 18 December 2019).
- Arroyo, M.; Gens, A. Computational Analyses of Dam 1 Failure at the Corrego de Feijão Mine in Brumadihno; CIMNE: Barcelona, Spain, 2021. [Google Scholar]
- Whittle, A.J.; Akl, S.A.Y.; El-Naggar, H.M.; Galaa, A.M. Stability analysis of upstream tailings dam using numerical limit analyses. J. Geotech. Geoenviron. Eng. 2022, 148, 04022035. [Google Scholar] [CrossRef]
- Zhu, F.; Zhang, W.; Puzrin, A.M. The slip surface mechanism of delayed failure of the Brumadihno tailings dam in 2019. Commun. Earth Environ. 2024, 5, 33. [Google Scholar] [CrossRef]
- Shewbridge, S. Undrained strengths and long-term stability of slopes. J. Geotech. Geoenviron. Eng. 2019, 145, 02519002. [Google Scholar] [CrossRef]
- Zabolotnii, E.; Morgenstern, N.R.; Wilson, G.W. Mechanism of failure of the Mount Polley Tailings Storage Facility. Can. Geotech. J. 2022, 59, 1503–1518. [Google Scholar] [CrossRef]
- Itasca. Fast Lagrangian Analysis of Continua (FLAC), Release 8.1; Itasca Consulting Group, Inc.: Minneapolis, MN, USA, 2019. [Google Scholar]
- Ziotopoulou, K.; Boulanger, R.W. Plasticity modeling of liquefaction effects under sloping ground and irregular cyclic loading conditions. Soil Dyn. Earthq. Eng. 2016, 84, 269–283. [Google Scholar] [CrossRef]
- Boulanger, R.W.; Ziotopoulou, K.; Oathes, T.J. PM4SiltR: A Silt Plasticity Model with Rate Effects for Slope Stability Applications; Report No. UCD/CGM-21/03; Center for Geotechnical Modeling, University of California: Davis, CA, USA, 2022. [Google Scholar]
- Oathes, T.J. Accounting for Viscous Effects in Nonlinear Analyses of Strain Softening Clays. Ph.D. Dissertation, University of California, Davis, CA, USA, 2022. [Google Scholar]
- Oathes, T.J.; Boulanger, R.W.; Ziotopoulou, K. A viscoplastic constitutive model for plastic silts and clays for static slope stability applications. Can. Geotech. J. 2024, 61, 2553–2570. [Google Scholar] [CrossRef]
- Global Industry Standard on Tailings Management (GISTM). Co-Convened by: International Council on Mining and Metals, UN Environment Programme, and Principles for Responsible Investment. 2022. Available online: https://globaltailingsreview.org/ (accessed on 13 March 2025).
- Jefferies, M.; Been, K. Soil Liquefaction: A Critical State Approach, 2nd ed.; CRC Press: London, UK, 2015. [Google Scholar]
- Plewes, H.D.; Davies, M.P.; Jefferies, M.G. CPT based screening procedure for evaluating liquefaction susceptibility. In Proceedings of the 45th Canadian Geotechnical Conference, Toronto, ON, Canada, 26–28 October 1992. [Google Scholar]
- Shuttle, D.A.; Cunning, J. Liquefaction potential of silts from CPTu. Can. Geotech. J. 2007, 44, 1–19. [Google Scholar] [CrossRef]
- PLAXIS. PLAXIS 2D Reference Manual. Bentley Systems International Limited; PLAXIS: Dublin, Ireland, 2019. [Google Scholar]
- Robertson, P.K. Cone penetration test (CPT)-based soil behaviour type (SBT) classification system—An update. Can. Geotech. J. 2016, 53, 1910–1927. [Google Scholar] [CrossRef]
- Martin, T.E.; McRoberts, E.C.; Davies, M.P. A tale of four upstream tailings dams. In Proceedings, Tailings Dams; ASDSO: Las Vegas, NV, USA, 2002. [Google Scholar]
- Mayne, P.W.; Peuchen, J. Evaluation of CPTU Nkt cone factor for undrained strength of clay. In Proceedings of the Fourth Internation Symposium on Cone Penetration Testing, Delft University of Technology, Delft, The Netherlands, 21–23 June 2018. [Google Scholar]
- Paniagua, P.; D’Ignazio, M.; L’Heureux, J.S.; Lunne, T.; Karlrud, K. CPTU correlations for Norwegian clay: An update. AIMS Geosci. 2019, 5, 82–103. [Google Scholar] [CrossRef]
- Nader, A.; Fall, M.; Hache, R. Characterization of sensitive marine clays by using cone and ball penetrometers examples of clays in eastern Canada. Geotech. Geol. Eng. 2015, 33, 841–864. [Google Scholar] [CrossRef]
- Idriss, I.M.; Boulanger, R.W. Soil Liquefaction During Earthquakes. Monograph MNO-12; Earthquake Engineering Research Institute: Oakland, CA, USA, 2008; 261p. [Google Scholar]
- Jamiolkowski, M.; Lo Presti, D.C.F.; Manassero, M. Evaluation of relative density and shear strength of sands from CPT and DMT. In Soil Behavior and Soft Ground Construction; ASCE: Reston, VA, USA, 2003. [Google Scholar] [CrossRef]
- Olson, S.M.; Stark, T.D. Yield strength ratio and liquefaction analysis of slopes and embankments. J. Geotech. Geoenviron. Eng. 2003, 129, 727–737. [Google Scholar] [CrossRef]
- Dafalias, Y.F.; Manzari, M.T. Simple plasticity sand model accounting for fabric change effects. J. Eng. Mech. 2004, 130, 622–634. [Google Scholar] [CrossRef]
- Duncan, J.M.; Wrights, S.G.; Brandon, T.L. Soil Strength and Slope Stability, 2nd ed.; Wiley: Hoboken, NJ, USA, 2014. [Google Scholar]
- United States Army Corps of Engineering. Slope Stability, Engineer Manual 1110-2-1902; USACE: Washington, DC, USA, 2003. [Google Scholar]
- Ladd, C.C. Stability evaluation during staged construction. J. Geotech. Eng. 1991, 117, 540–615. [Google Scholar] [CrossRef]


Disclaimer/Publisher’s Note: The statements, opinions and data contained in all publications are solely those of the individual author(s) and contributor(s) and not of MDPI and/or the editor(s). MDPI and/or the editor(s) disclaim responsibility for any injury to people or property resulting from any ideas, methods, instructions or products referred to in the content. |
© 2025 by the authors. Licensee MDPI, Basel, Switzerland. This article is an open access article distributed under the terms and conditions of the Creative Commons Attribution (CC BY) license (https://creativecommons.org/licenses/by/4.0/).