1. Introduction
Seismic wave attenuation refers to the reduction in wave amplitude due to propagation effects, including both path and local site conditions. This reduction occurs primarily due to internal friction, absorption, and scattering [
1]. Observed seismic attenuation plays a crucial role in seismic hazard assessment and site response analysis, as it helps to estimate the expected acceleration values at specific locations.
The Republic of North Macedonia is a seismically active region with low to moderate seismicity, though some areas exhibit nearly high levels of seismic activity. In the past, numerous earthquakes have struck the country’s territory, with some devastating almost entire cities. Over the years, various studies have been conducted to assess the seismic hazard in this country. However, no study has yet focused on the local attenuation of seismic waves at high frequencies.
To characterize these effects, Anderson and Hough (1984) [
2] introduced the empirical high-frequency decay parameter kappa (k), aiming to explain deviations in the shape of the spectral acceleration curve from the theoretical Brune’s model (1970) [
3] at frequencies higher than the source corner frequency. Using earthquake records with magnitudes greater than 5, they calculated the spectral parameter kappa for different stations by analyzing log-linear spectral space within constrained frequency ranges. Currently, there are many available approaches for estimating kappa [
4], and this parameter is widely used for site characterization, especially given empirical k
0-V
S30 correlations [
4,
5,
6,
7,
8,
9,
10,
11,
12], among other uses such as site amplification [
13], input parameters for creation and calibration of GMPEs, host to target adjustments of GMPEs to different regions [
14,
15,
16], as well as its correlation with engineering parameters like peak ground acceleration (PGA) and Arias intensity [
17].
Previous studies have shown that the high-frequency decay parameter, kappa (k), is primarily influenced by site conditions [
2,
5,
8,
11]. Although some research has investigated its correlation with source characteristics [
18,
19], the impact of source effects is generally considered to be less significant than that of local site effects. Other studies have explored the relationship between kappa and the seismic wave propagation path [
20,
21], while some have examined the role of seismic sensor installation conditions [
22].
The aim and scope of this study is to estimate the high-frequency decay parameter kappa (k), and its site component (k0) for sixteen accelerometric stations installed in North Macedonia. Although numerous studies have investigated k globally, no research has focused on the attenuation characteristics specific to this region. To address this gap, the study provides the first detailed estimation of k0 derived from local strong-motion data. The IZIIS strong motion network, equipped with accelerometers installed across various locations and soil types in North Macedonia, provides valuable data for investigating the high-frequency decay parameter (k). In this study, strong motion records from earthquakes with moment magnitudes (Mw) greater than 3.0 and epicentral distances (Repi) less than 120 km were analyzed. The data were collected from sixteen seismic stations across the country.
The study begins with a brief overview of the study area and the locations of the seismic stations. This includes the collection of strong motion records and the necessary data for station characterization. The records are then systematically organized, processed, and selected for analysis. The method used for kappa calculation is described and applied, and the resulting values are analyzed in relation to parameters such as earthquake magnitude, epicentral distance, average shear-wave velocity in the top 30 m depth VS30, and fundamental site frequency (f0). Finally, the results are presented, discussed, and compared with previous studies to highlight key observations and implications.
2. Study Area and Strong Motion Data
The study area is in the Balkan Peninsula, specifically in the Republic of North Macedonia, between latitudes 40–43° and longitudes 19–23°. This region is characterized by low to moderate seismicity, although certain areas exhibit nearly high levels of seismic activity.
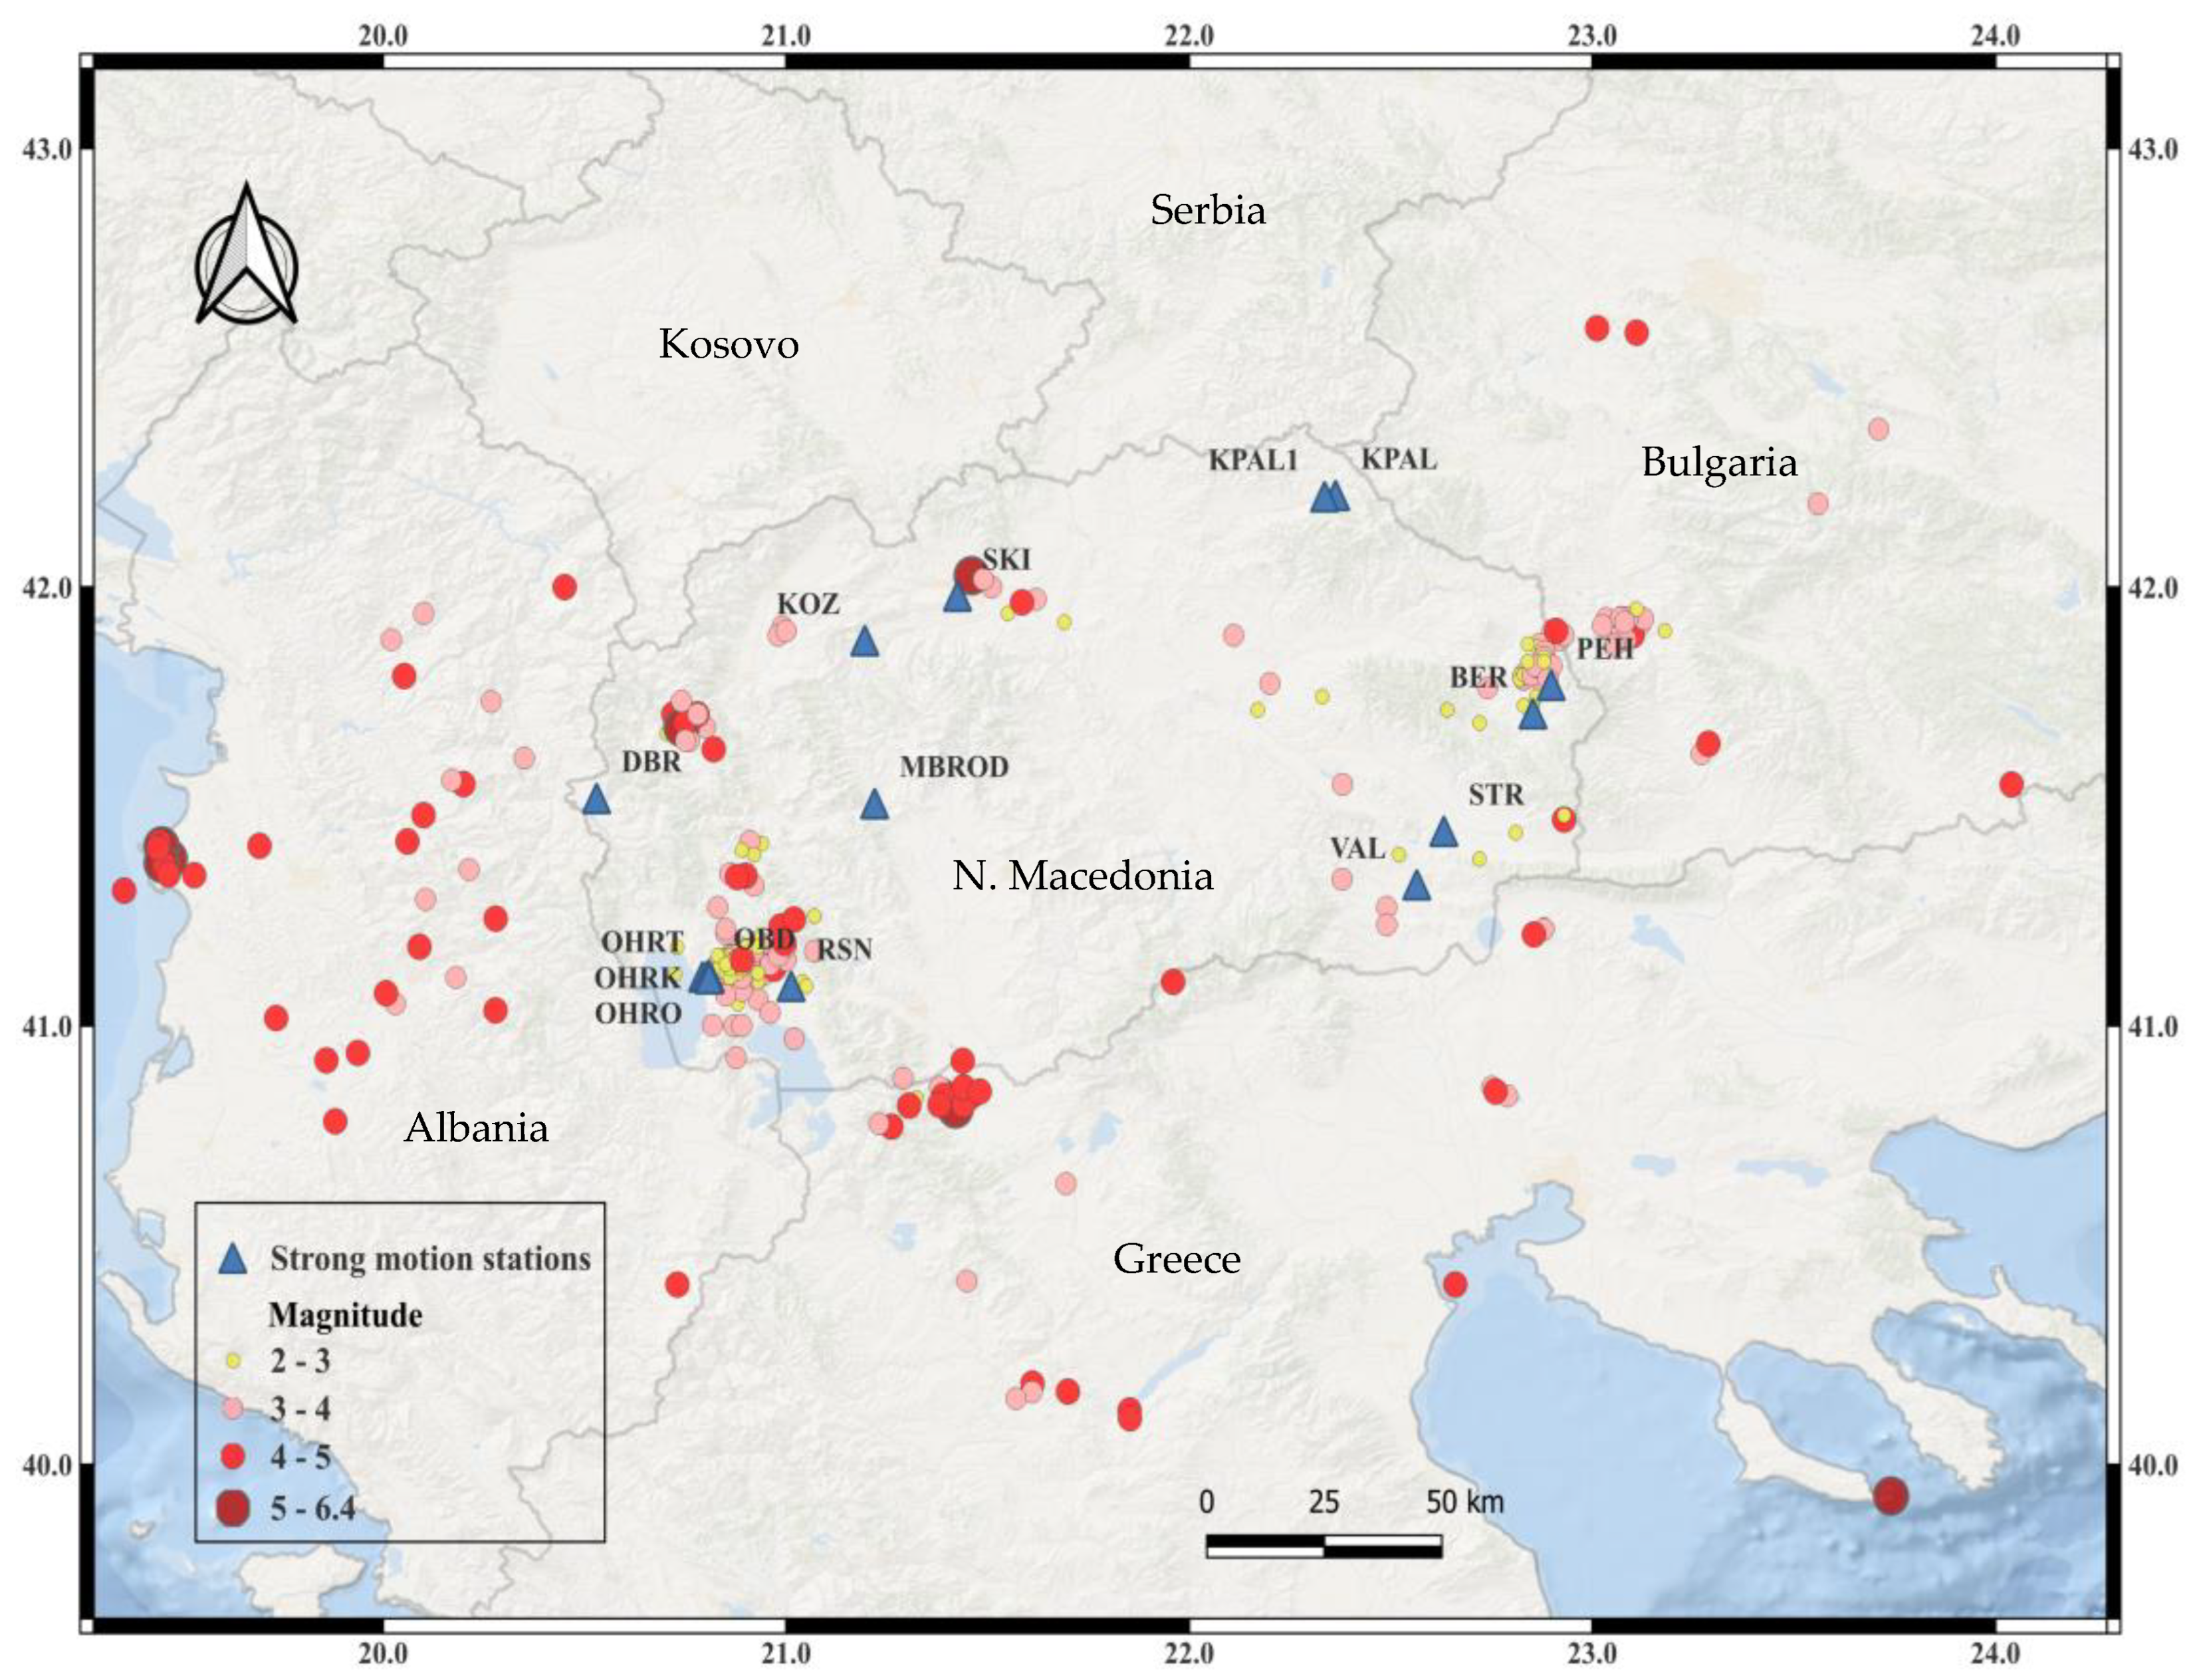
The dataset used in this study is obtained from strong-motion stations that have recorded at least five earthquakes. These stations are part of the UKIM-IZIIS strong-motion network in North Macedonia (
Figure 1). In total, sixteen stations are included in the study, installed on three different types of soil, A, B, and C, according to EC8 [
23]. The records are collected using 200 Hz sampling three-component accelerometers (Guralp CMG-5TD and ETNA-2), which are placed either in free-field conditions or within small structures, typically in the basement or on the ground floor.
Between 2012 and 2024, these stations recorded 336 earthquake events with moment magnitudes (M
w) ranging from 2.1 to 6.4 and epicentral distances (R
epi) from 1.6 to 810 km.
Figure 1 illustrates the spatial distribution of recorded earthquakes and the locations of the strong-motion stations, which are marked with blue triangles.
To characterize local site characteristics of each seismic station, V
S30 values are determined through geophysical measurements [
24,
25,
26,
27,
28,
29] for seven stations (DBR, PEH, SKI, OHR, OHRK, VAL, KPAL), and borehole geotechnical investigations [
30] for three stations (OHRK, OHRT, OBD). The other six stations’ characteristics were obtained from the USGS V
S30 model [
31], and it was followed with a definition of the horizontal-to-vertical spectral ratio (HVSR) using earthquake records.
The HVSR method was used to estimate the predominant site frequency and potential site amplification for all stations [
32]. HVSR (horizontal-to-vertical spectral ratio) was calculated from earthquake records using the smoothed Fourier amplitude spectrum by Konno and Ohmachi (1998) [
33] (b-value = 20).
Figure 2 shows the HVSR derived from earthquakes for all sixteen stations, with the horizontal black line at H/V = 2 representing the non-amplification amplitude, following the SESAME criteria [
34]. According to
Figure 2, the observed predominant site frequencies range from 0.6 to 9 Hz. The wide range of observed predominant site frequencies (0.6 to 9 Hz) across the sixteen stations can be attributed to site-specific geological and geotechnical conditions, as well as site geometry (topography). These include variations in sediment thickness (with thicker sediments typically associated with lower fundamental frequencies and thinner sediments with higher ones), differences in the properties of the deeper soil column, the degree of soil consolidation, and variations in impedance contrast between layers (soft surface layers overlying stiffer sediments and bedrock) with differing shear-wave velocities.
Parolai and Bindi (2004) [
35] demonstrated that resonant effects do not influence the k parameter when the fundamental resonance frequency is below the frequency range used for its calculation, provided that the range is sufficiently wide to average out local peaks caused by site amplification. However, if not properly accounted for, site effects can still bias the selection process and lead to underestimated k values if measured before the resonance peak, and overestimated values when measured after it. To minimize such effects in the k estimation, the lower boundary frequency (f
1min) is set to 10 Hz, as explained in more detail in
Section 3.
Figure 2.
Adapted from Poposka et al., 2025 [
36]. Horizontal to vertical spectral ratios (HVSR) curves from earthquake records using the Konno and Ohmachi (1998) [
33] (b-value = 20) smoothed Fourier amplitude spectrum. Horizontal black line (H/V = 2) represents the “non-amplification” amplitude according to the SESAME criteria [
34].
Table 1 presents the station names and coordinates, the type of soil investigation conducted, and the estimated V
S30 values obtained from both site-specific investigations and the USGS V
S30 Map Viewer [
31]. It also includes the fundamental site frequency determined using the HVSR method with earthquake data. The comparison of V
S30 values from different sources reveals some differences, which remain within acceptable limits. However, it is essential that these values be validated through detailed site investigations, such as geophysical surveys or borehole investigations.
3. Signal Processing and Kappa Calculation
3.1. Signal Processing and Data Systematization
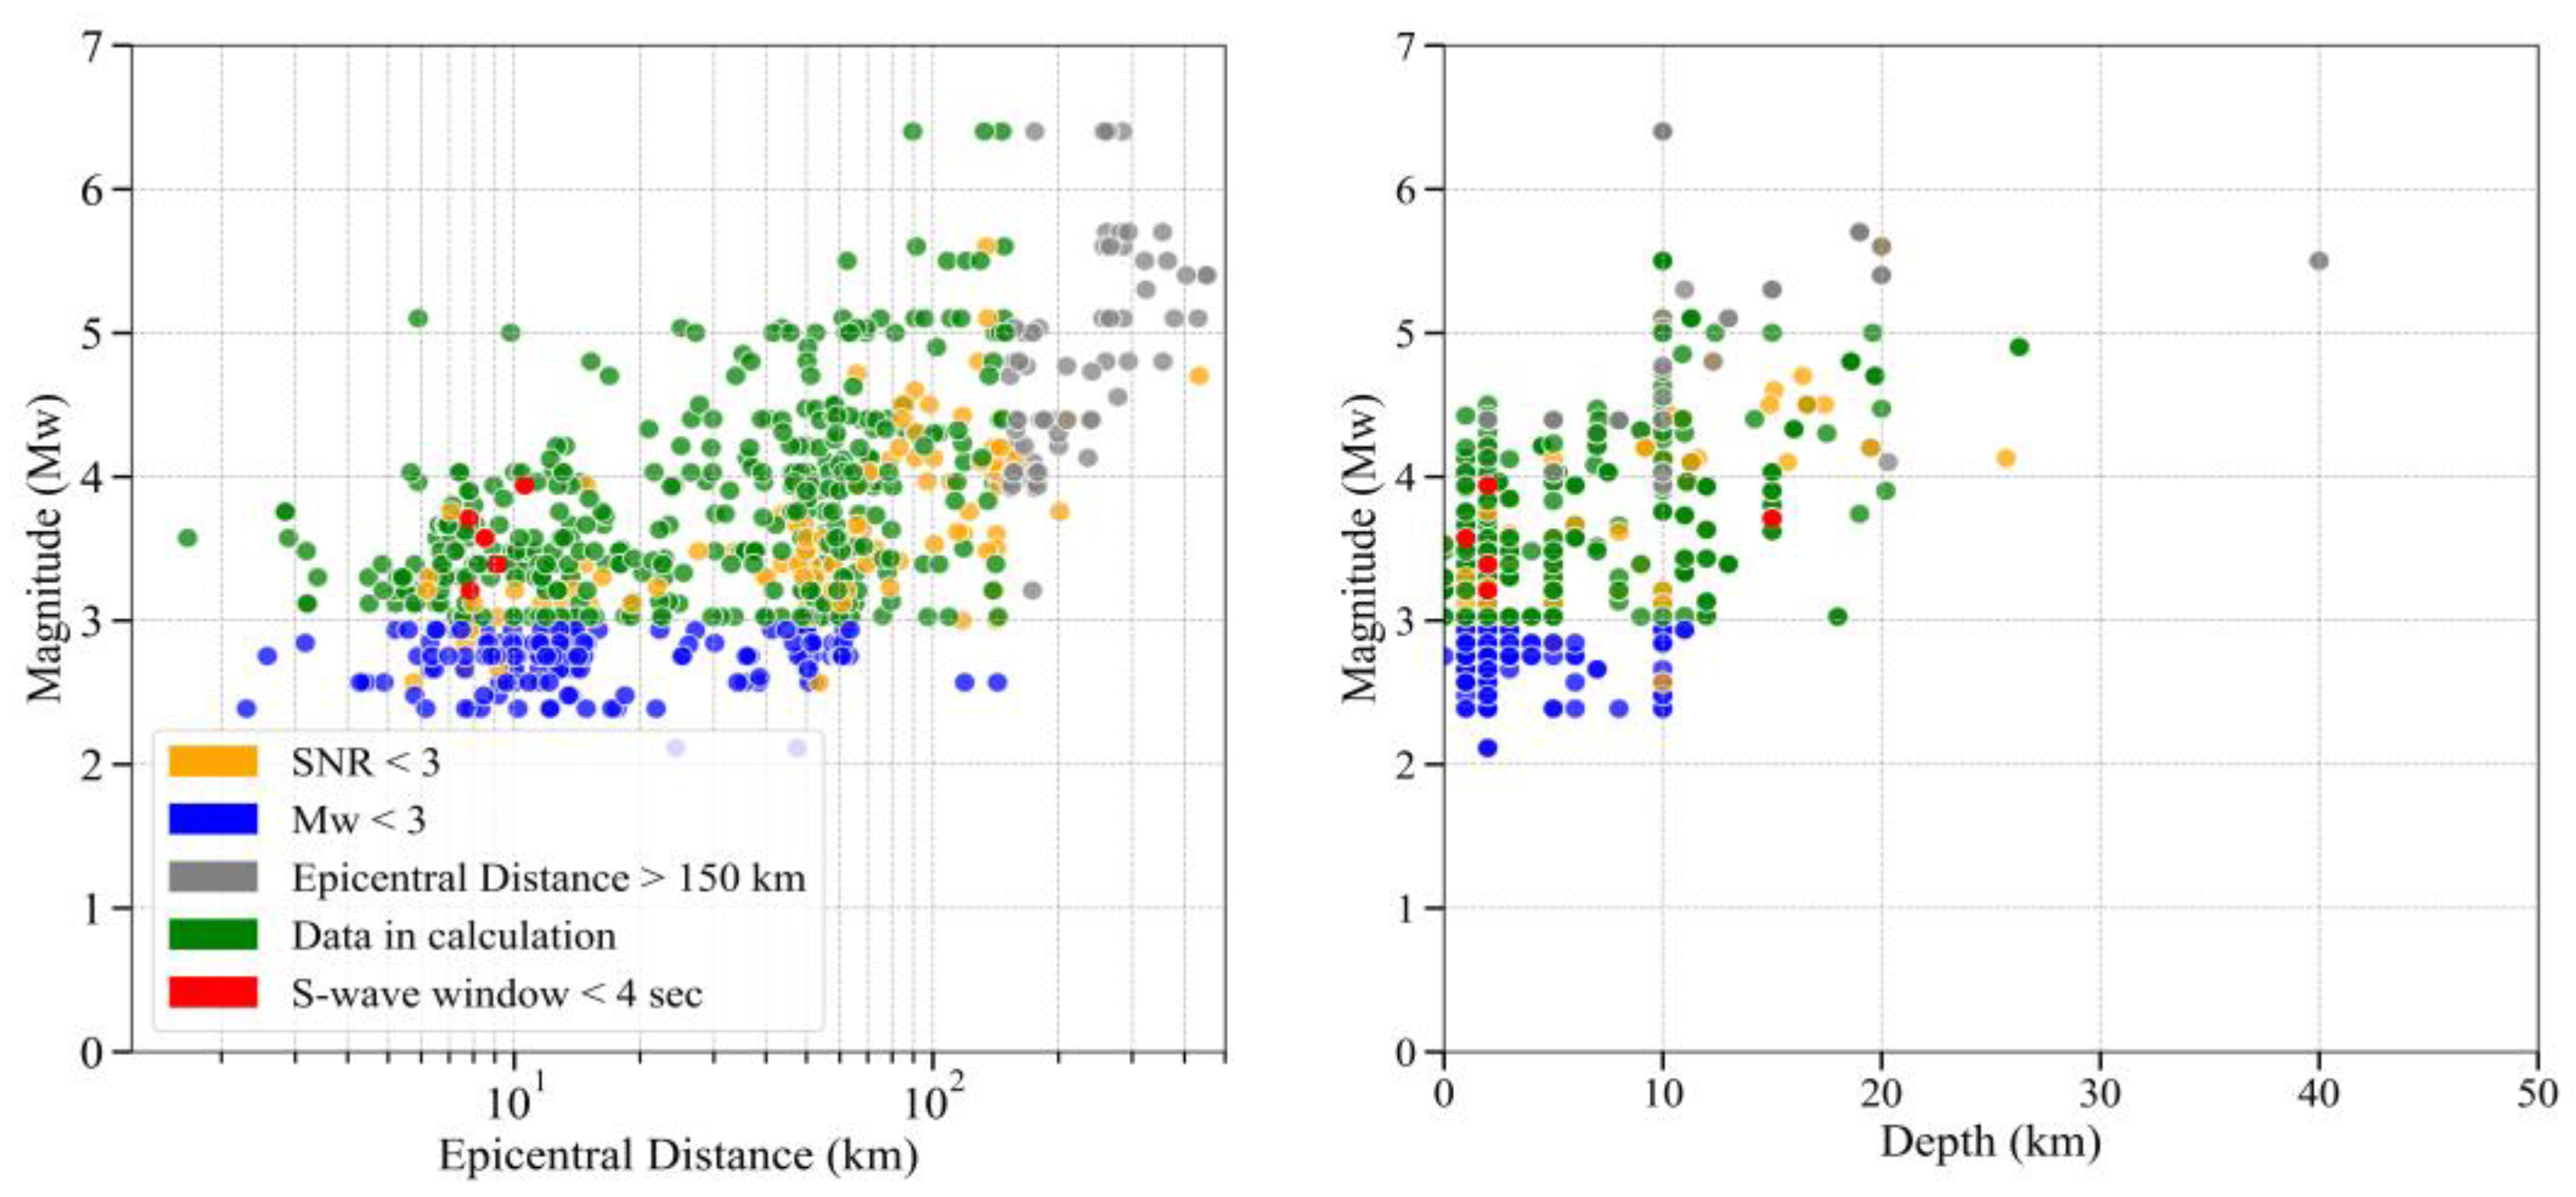
The data selection for this analysis was based on earthquake depth, magnitude, and epicentral distance. The applied selection criteria (depth < 30 km, MW > 3, Repi ≤ 120 km) are important for improving the reliability of kappa value calculations. Limiting the depth to less than 30 km ensures that only shallow earthquakes occurring within the Earth’s crust are considered, as kappa is primarily representative of near-surface attenuation. The magnitude threshold (MW > 3) helps reduce the influence of source effects, as larger magnitude events generally have lower corner frequencies, minimizing potential overlap with the high-frequency range used for kappa estimation. Finally, restricting the epicentral distance to 120 km ensures that the signal is not overly affected by regional attenuation or path effects, allowing for a clearer observation of the site-specific high-frequency decay.
Figure 3 illustrates the classification of strong motion records based on magnitude, epicentral distance, earthquake depth, and S-wave portion duration. Green dots represent the analyzed data, while blue, yellow, grey, and red dots indicate excluded data, corresponding to M
W < 3, R
epi > 120 km, SNR < 3, and S-wave portion < 4 s, respectively.
The data were visually inspected and baseline corrected. The Nyquist frequency for all the recordings is 100 Hz, and a bandpass filter ranging from 0.1 to 100 Hz was applied. Poor-quality data, records with SNR < 3, and those with an S-wave portion shorter than 4 s (to ensure good spectral resolution) were excluded from the analysis.
The N-S and E-W components of accelerograms have been used in the present analysis. A total of 210 earthquakes were available after quality control processing, with 1560 individual horizontal records.
3.2. Kappa Calculation
There are different methods available for kappa (k) calculations, which are listed and explained in Ktenidou et al. (2014) [
4], depending on factors such as the underlying approach, the frequency range over which k is calculated, how distance dependence is handled, and other considerations. For this study, the classical and most commonly used acceleration spectral method, defined by Anderson and Hough (1984) [
2], was employed.
Using earthquake parameters, the corner frequency f
c and the theoretical spectrum, based on Brune’s model [
3], were computed to examine the difference when the attenuation parameter (kappa) is included. The corner frequencies have been estimated using Brune’s method (1970, 1971) [
3] as given by Equation (1):
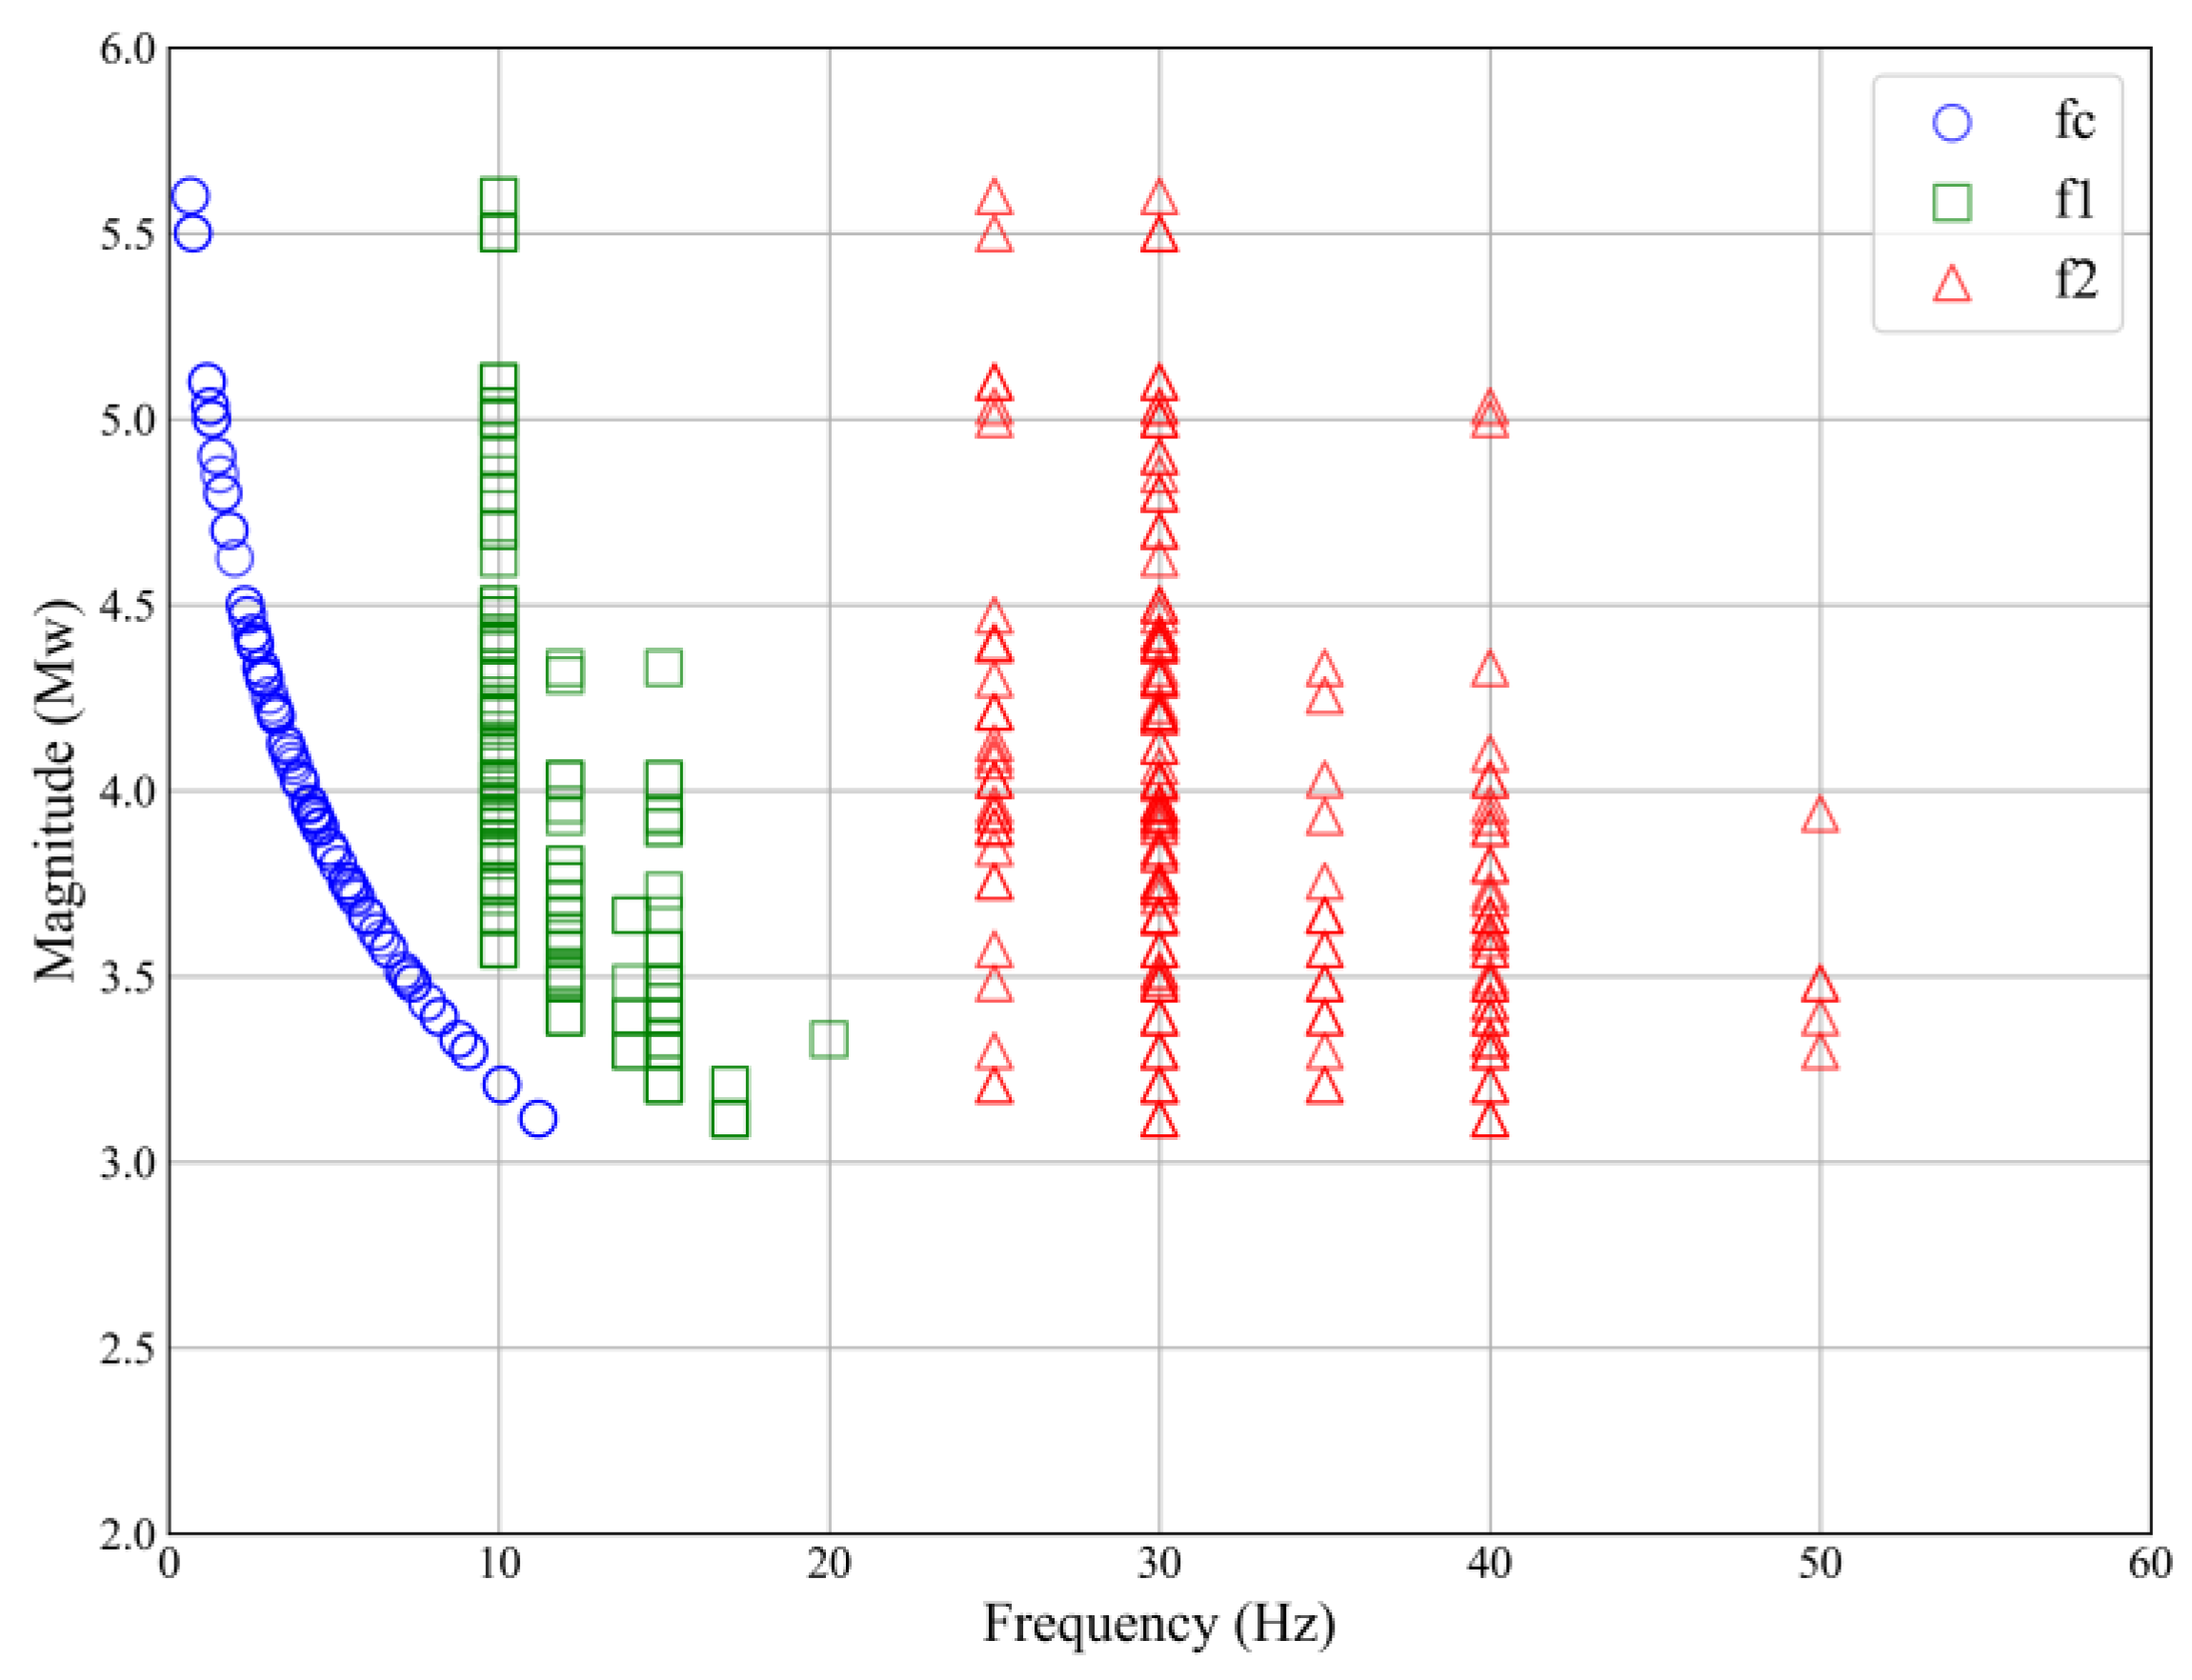
The next step was to define the boundary frequencies, f
1 and f
2, which were manually selected: f
1 was chosen to be greater than 1.5 × f
c to ensure that source effects would not bias the kappa calculation. Additionally, if f
1 < 10 Hz, then f
1 = 10 Hz was used to avoid potential site resonance effects (
Figure 2). f
2 was selected at the point where the spectrum flattens, ensuring that the signal-to-noise ratio (SNR) between the S-wave and noise windows was greater than 3, or up to 50 Hz—above which spectra are considered unreliable (half the Nyquist frequency). The frequency band ∆f had a minimum required width of 10 Hz. Spectra with Δf < 10 Hz were discarded to maintain robustness in the slope computation. Depending on the event magnitude and distance, f
1 ranges from 10 to 20 Hz, while f
2 ranges between 25 and 50 Hz (
Figure 4 shows the distribution of selected frequencies with respect to moment magnitude M
w).
This classical method uses the S-wave window, and the calculation follows the recommended procedure from Ktenidou et al. (2013) [
10]. Initially, good-quality records were manually selected, ensuring a sufficient noise window before the signal and S-wave windows longer than 4 s (
Figure 5, top row). A 5% cosine taper was applied to both windows, and the Fourier amplitude spectrum (FAS) was then calculated for each window (
Figure 5, middle row). The theoretical spectrum based on Brune’s model [
3] is also shown in
Figure 5 (black line).
Within the selected frequency range, data were regressed in log-linear space between f
1 and f
2 (
Figure 4—blue line) using the following equation [
2]:
This procedure was applied to both horizontal components (N-S and E-W), and the average value from the two was computed.
Figure 4 illustrates the kappa calculation procedure for three stations located on different types of soil: A (left), B (middle), and C (right), based on the EC8 soil classification [
23].
Following the procedure for kappa calculation, results from three stations are presented: OHR station, located on soil class A using the horizontal component of an earthquke record with Mw = 3.8 and Repi = 8.01 km, DBR station, located on soil class B using horizontal component of an earthquake record Mw = 3.66 and Repi = 23.5 km, and SKI station, located on soil class C using horizontal component of an earthquake record with Mw = 5.03, Repi = 65.5 km. The obtained kappa values for these records are k = 0.0226 s, k = 0.0407 s, and k = 0.0651 s for the OHR, DBR, and SKI stations, respectively. The slope of the FAS for kappa calculation is steeper for looser soil (stations DBR and SKI), and less steep for rock (OHR station).
4. Results
4.1. York Weighed Regression
The high-frequency decay parameter kappa and its site component (k
0) were calculated for each station using regression with distance. In this study, York weighted regression analysis [
37], which accounts for errors in both variables, was applied. The uncertainties were represented as one standard deviation for kappa and a fixed error of 3 km for R
epi.
Two of the stations, installed on different soil classes, A and B, are shown in
Figure 6, while the results for all sixteen stations are presented in
Table 2. The site component (k
0) was determined both from the regression line extrapolated to zero distance and from the mean value of the records within 25 km, particularly for stations with a majority of nearby data.
Averaged values from the two horizontal components were considered if their difference was less than 25%; otherwise, they were excluded from the regression. Exceptions were made for stations with a limited number of near-distance records, allowing good-quality data with differences greater than 25% to be included.
The regression analysis was performed twice: once using the full dataset (
Figure 6, blue line), and once excluding outliers beyond one standard deviation (
Figure 6, red dashed line). There was no significant difference between the two results, except in the coefficient of determination (
R2). The York regression without outliers yielded higher
R2 values, indicating a better fit.
In
Figure 6, a clear difference is observed between soil classes A and B, particularly in the site component (k
0). Lower local attenuation values were recorded at the station on rock, while higher values were found at the station on looser soil. Regarding regional attenuation analysis, even small variations in the slope of the regression line, on the order of the third or fourth decimal place, can significantly affect the results. These variations in the slopes could be further explored in future investigations, particularly for estimating the quality factor Q. The number of records from the station installed on soil class C is limited, so further studies should be conducted as more data become available.
Table 2 presents the site-specific parameter values obtained for the sixteen stations, including results from both the regression analysis and the mean values within 25 km, along with the number of records used in the analysis. If a station had at least ten records at close distances, the mean value was selected.
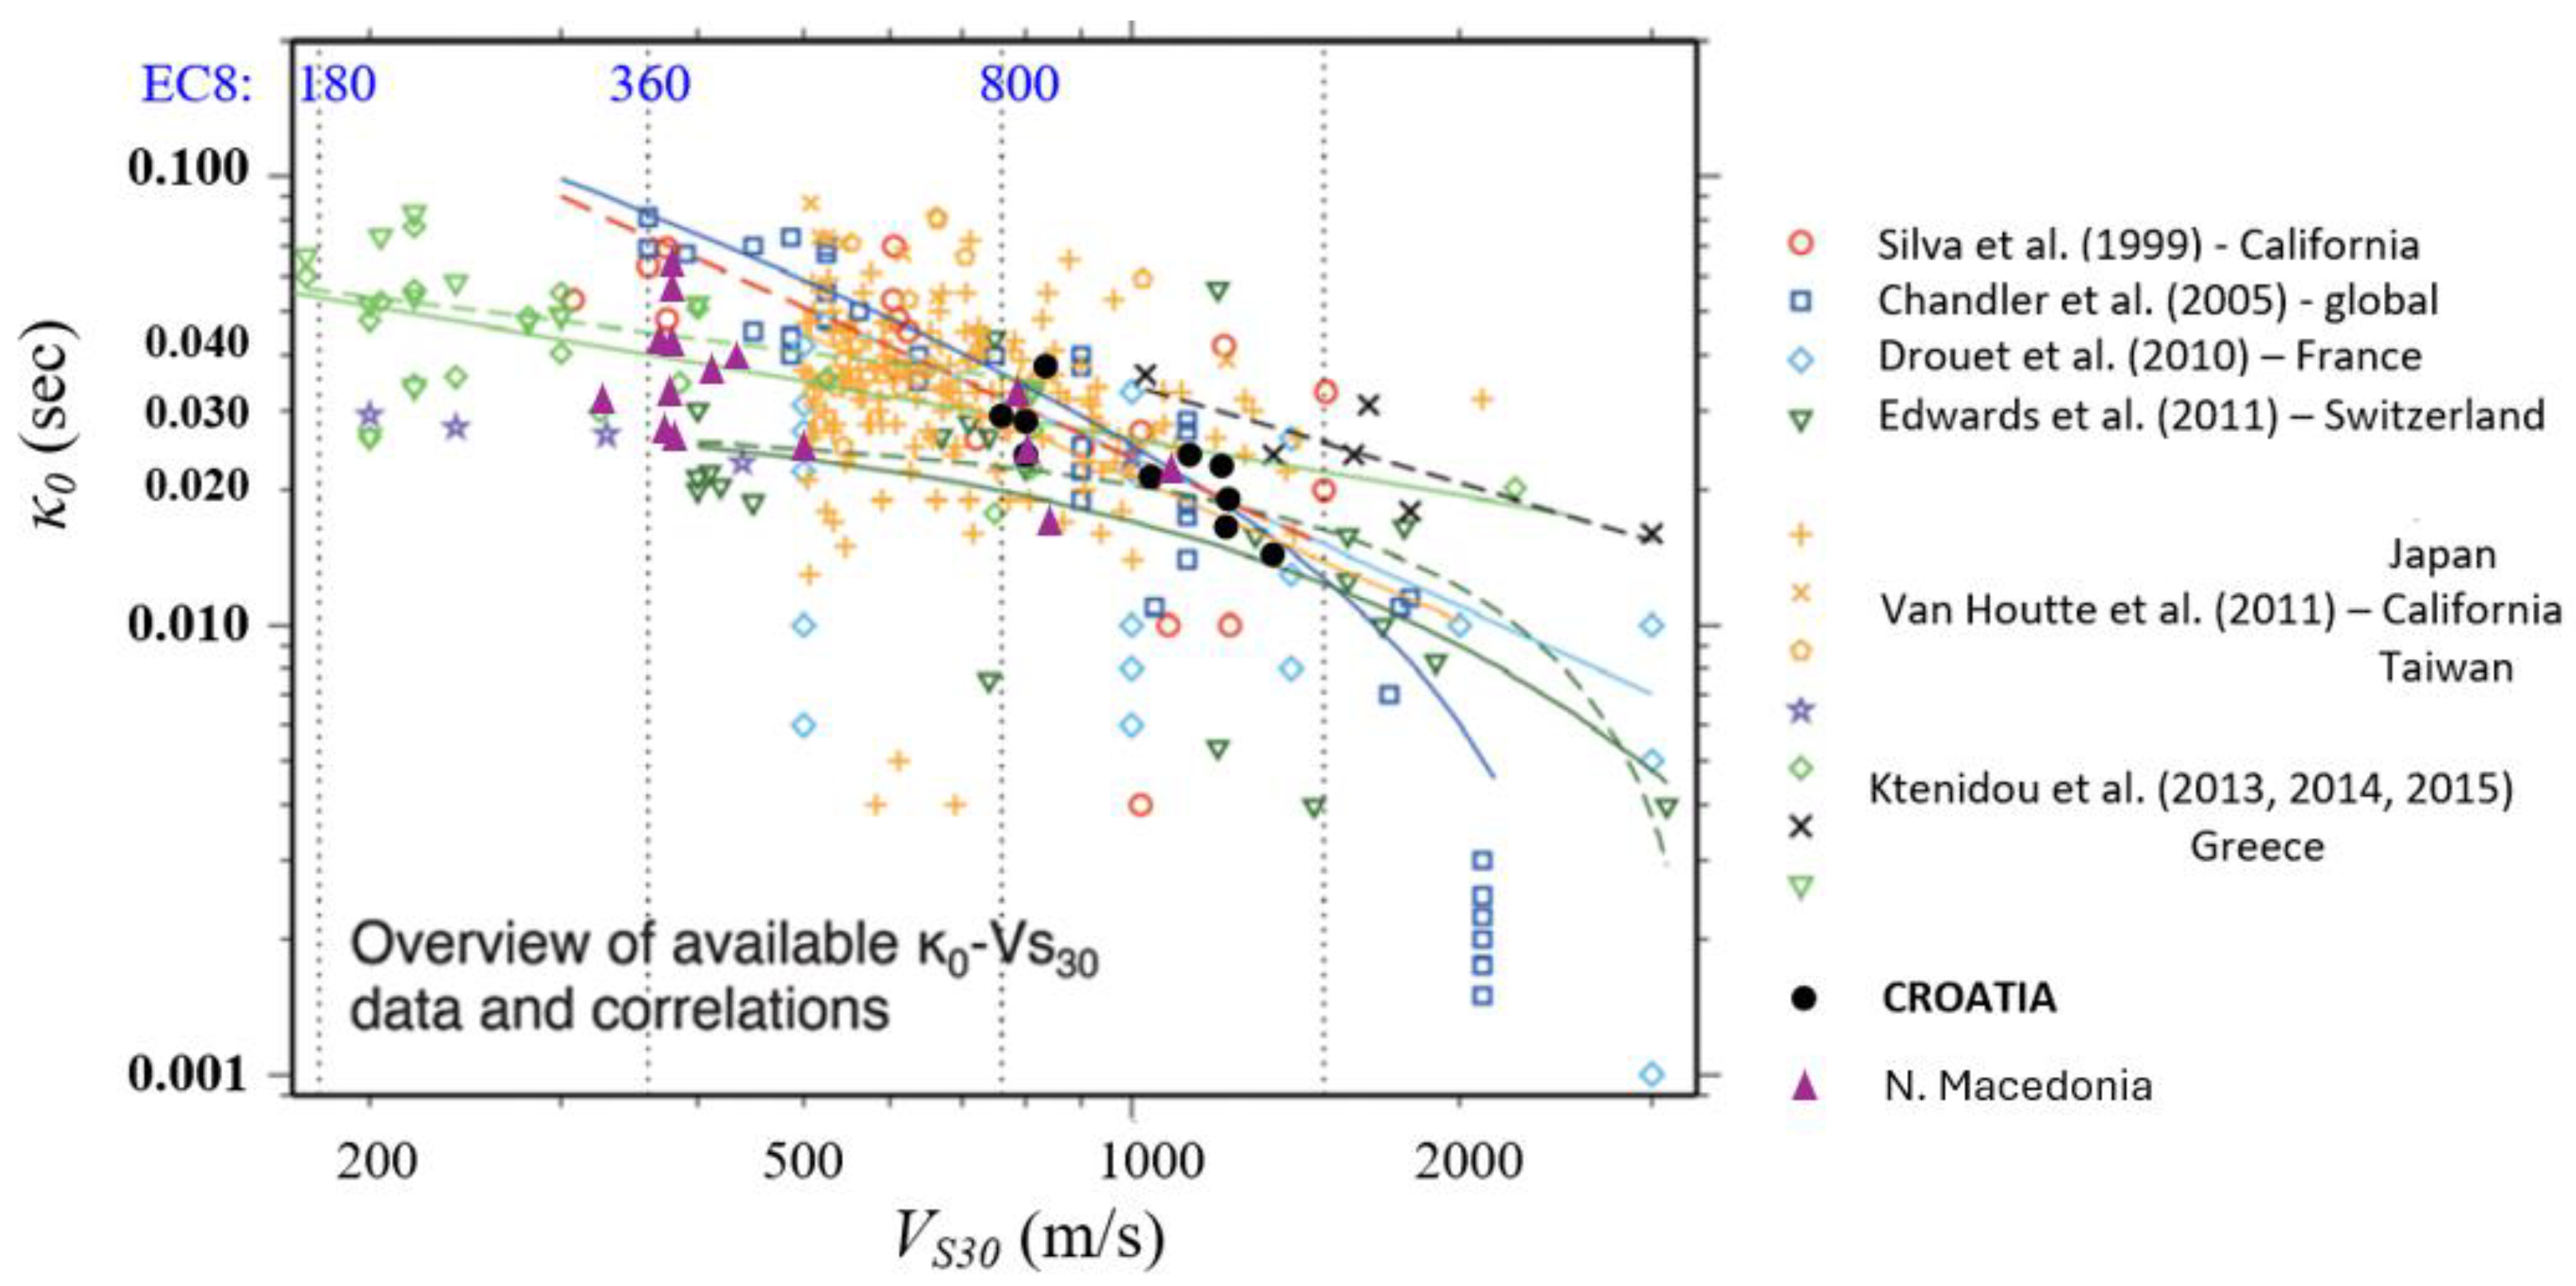
4.2. k0-VS30 Correlation
When there are insufficient data to directly measure k
0, empirical correlations are often used to estimate it. These correlations are primarily based on V
S30, as introduced by Silva et al. (1998) [
5], and later expanded upon by Chandler et al. (2006) [
6], Ktenidou et al. (2014) [
4], among others.
The V
S30 values for the sixteen stations in N. Macedonia range from 330 to 1000 m/s, corresponding to three soil types, A, B and C according to the EC8 classification [
23].
Figure 7 (an updated version based on Ktenidou et al. (2014) [
4] and Stanko et al. (2017) [
12]) presents the compiled k
0-V
S30 values for various global regions where k
0 was calculated using the AH84 method, alongside the measured k
0 and V
S30 values for stations in North Macedonia. Given that k
0 is a site-specific parameter, it is reasonable to expect that stiffer (harder) sites will exhibit lower attenuation, and thus k
0 will decrease as shear-wave velocity increases. However, this expected trend can vary, and a degree of scatter in the results obtained is evident, as shown in
Figure 7.
Ktenidou et al. (2014) [
4] revisited the existing k
0-V
S30 correlations and discussed their scatter and applicability. According to their study, the large scatter is expected due to differences in how V
S30 is calculated (invasive vs. non-invasive methods) and how well it represents the subsurface structure beneath the station. In some cases, a bedrock-based correlation may better approximate the deeper soil structure relevant to k
0. Other contributing factors to the variability include regional differences in the shallow crustal quality factor (Q), as well as the methods and frequency ranges used for calculating kappa and its site component k
0.
In line with this study and previous research, the scatter in κ
0 values remains considerable, making it impractical to assign a single k
0 value to a typical site class. For example, for soil type B (with V
S30 values ranging from 350 to 800 m/s), κ
0 values range from 0.028 s to 0.067 s. Most of the data correspond to site types A and B, and
Figure 7 shows that the near-site attenuation (k
0) values observed at North Macedonian stations are closely aligned with global κ
0 values from previous studies.
There are currently no available data for very hard rock sites or very soft soils (EC8 classes C and D), so future measurements will be important for refining and expanding the k0-VS30 relationship for North Macedonia.
Figure 8 illustrates the site component values in relation to soil classification. The dotted lines represent the boundaries between different site velocities. The correlation coefficient is 40%, indicating a better or similar correlation than previous studies for surface data—for instance, Japan is below 15% [
9], Greece is around 25% [
11], and France is around 38% [
7]—but still a loose correlation. This relatively low correlation has shown that k
0 is influenced not only by the average shear-wave velocity in the upper 30 m (V
S30), but also by deeper velocity structures, site-specific stratigraphy, and other local geological factors not captured by V
S30 alone. Therefore, while V
S30 provides a useful first-order proxy for site conditions, it may not fully explain the variability in k
0 across stations.
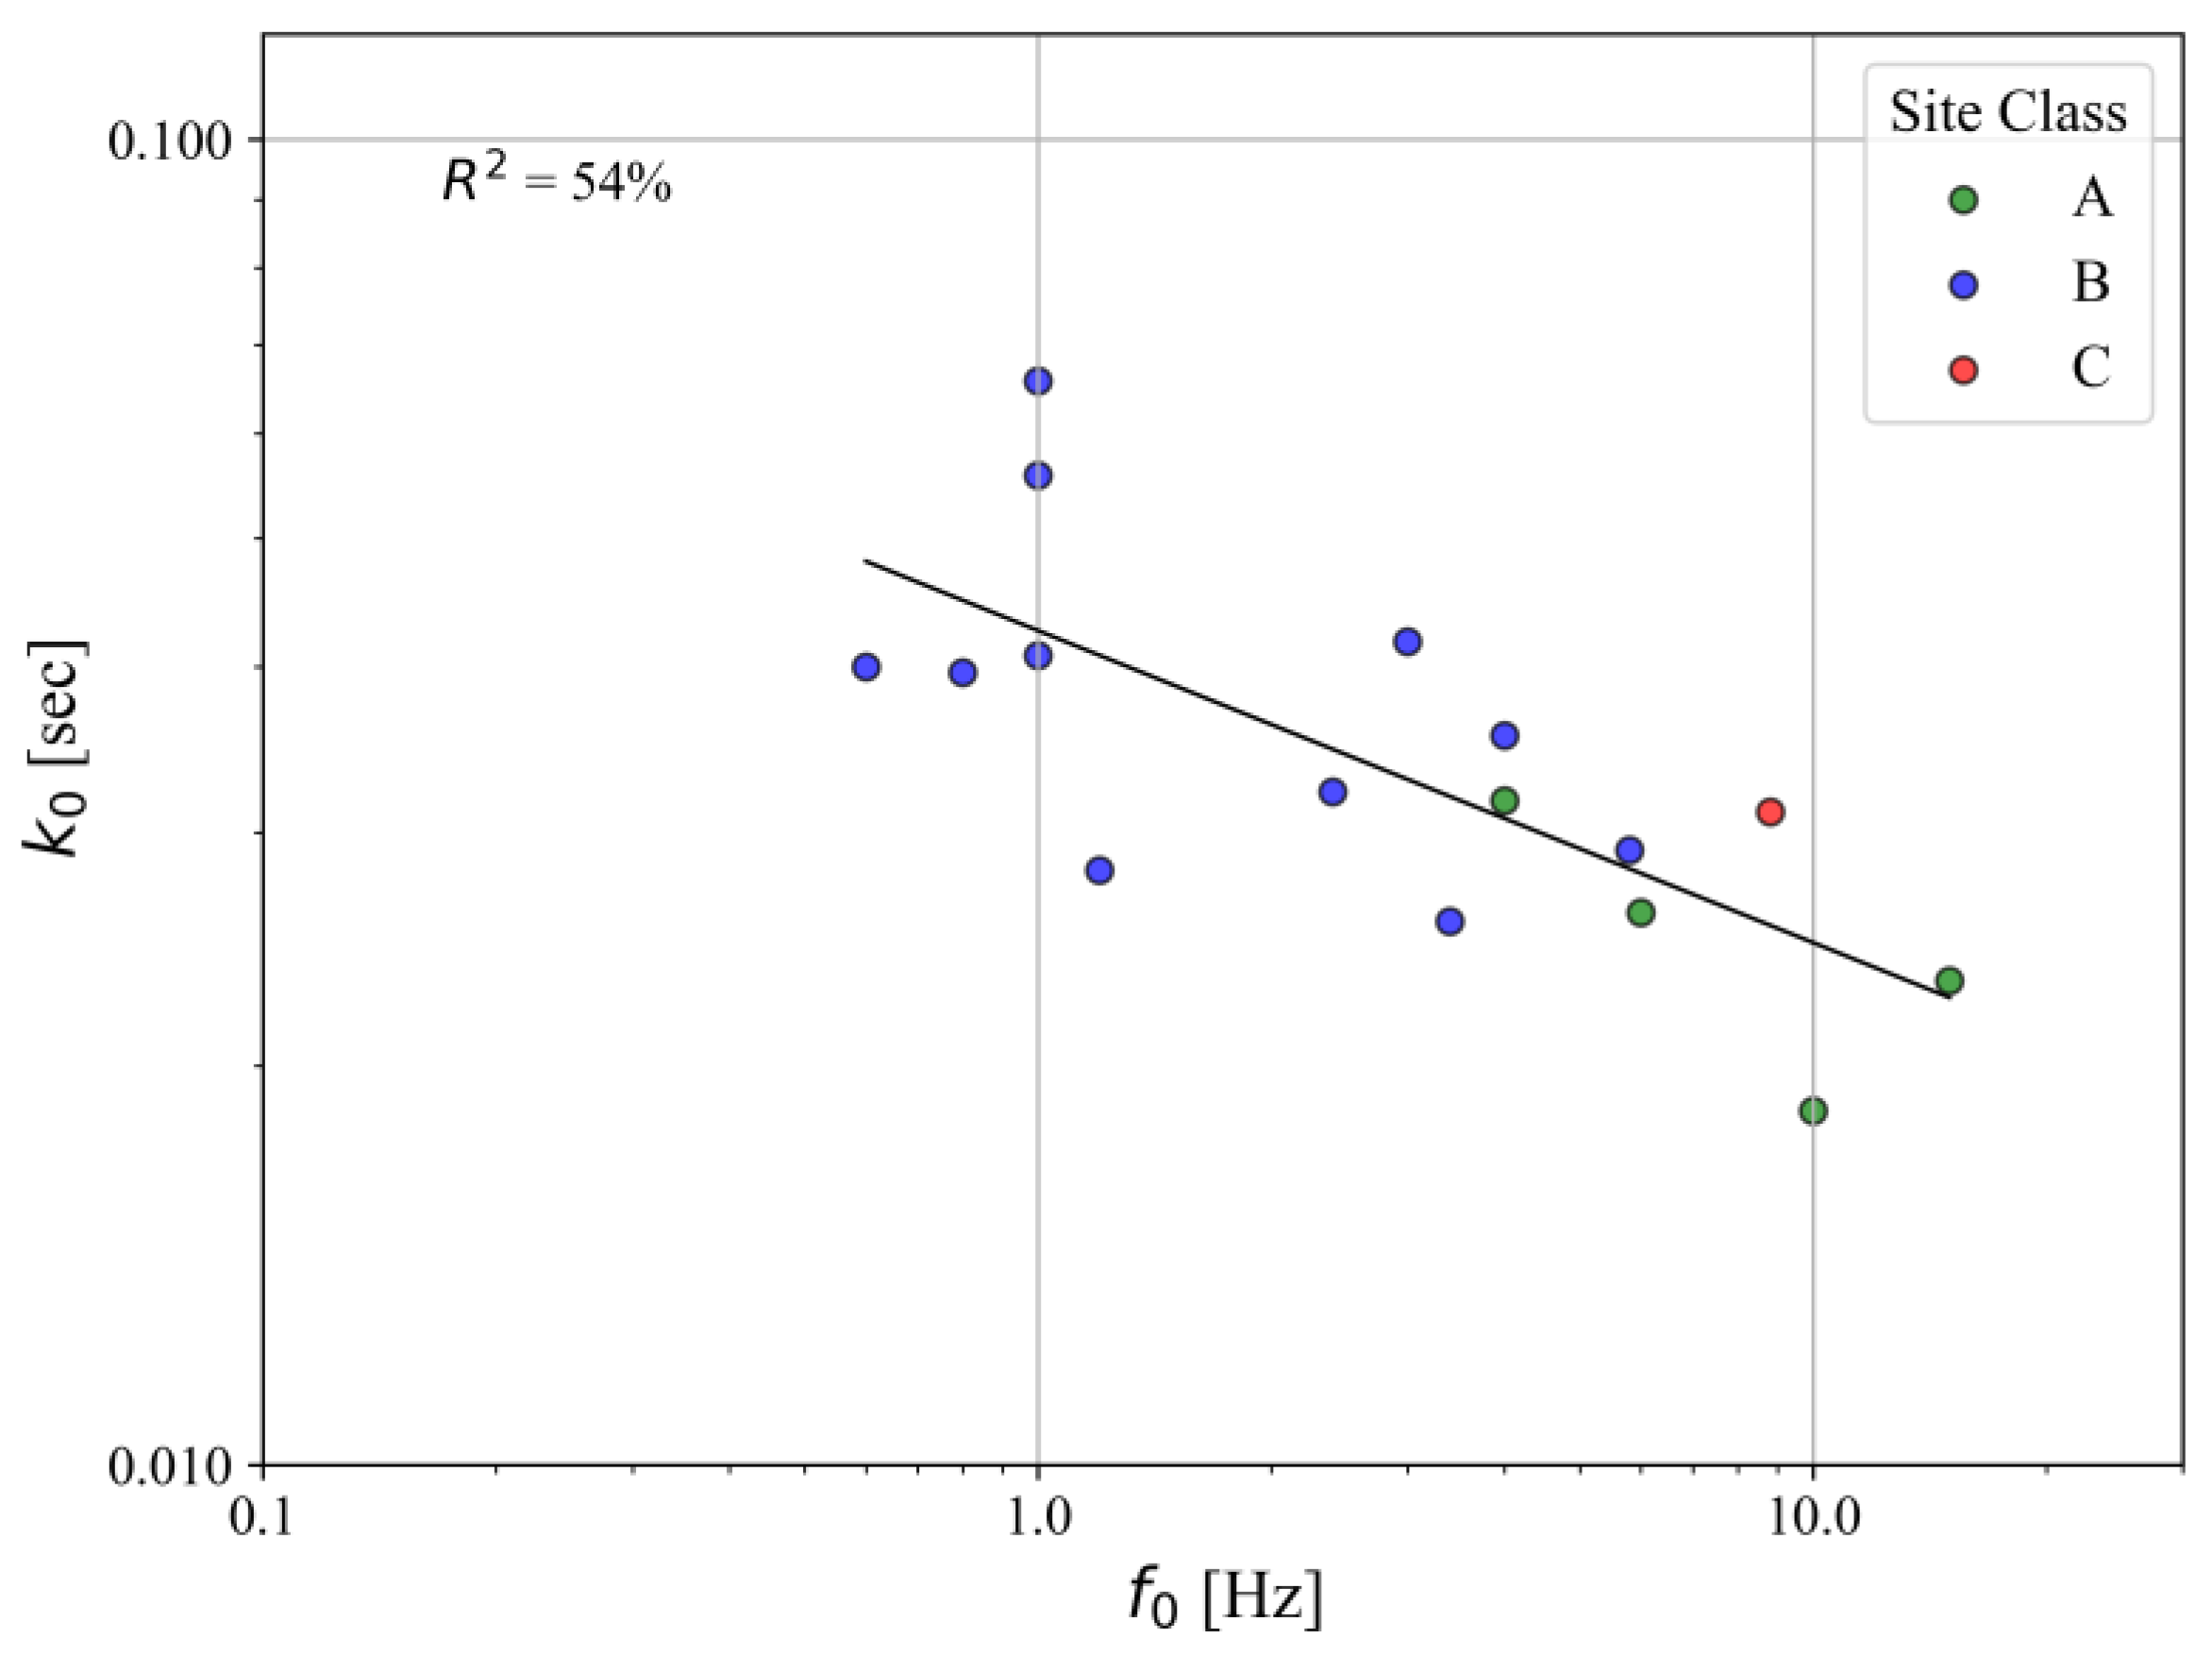
4.3. k0-VS30-f0 Correlation
To improve the correlation between V
S30 and k
0, an additional relationship incorporating the site’s resonance frequency is considered. Since V
S30 values alone may be insufficient for accurate site classification, incorporating the site’s fundamental frequency (f
0) can enhance the classification by accounting for deeper basin structures. Previous studies [
9,
11,
38] have explored the relationship between the site component k
0 and the fundamental site frequency.
Figure 9 shows the correlation between the fundamental site frequency, determined using the HVSR method with earthquake data, and the site component k
0, calculated as described in the previous sections. Different colors indicate soil types—A, B, and C—according to the EC8 classification [
23].
The correlation coefficient is R
2 = 54%, indicating a moderate relationship between the site component κ
0 and the deeper soil basin structure. This correlation is higher than those reported in previous studies conducted in other countries, such as Japan, California, and Taiwan [
9,
38] which found 12.6%, and Northern Greece [
11], which reported 49%.
Overall, the site component k
0 tends to decrease slightly as the site fundamental frequency increases, similar to V
S30 observations (
Figure 7).
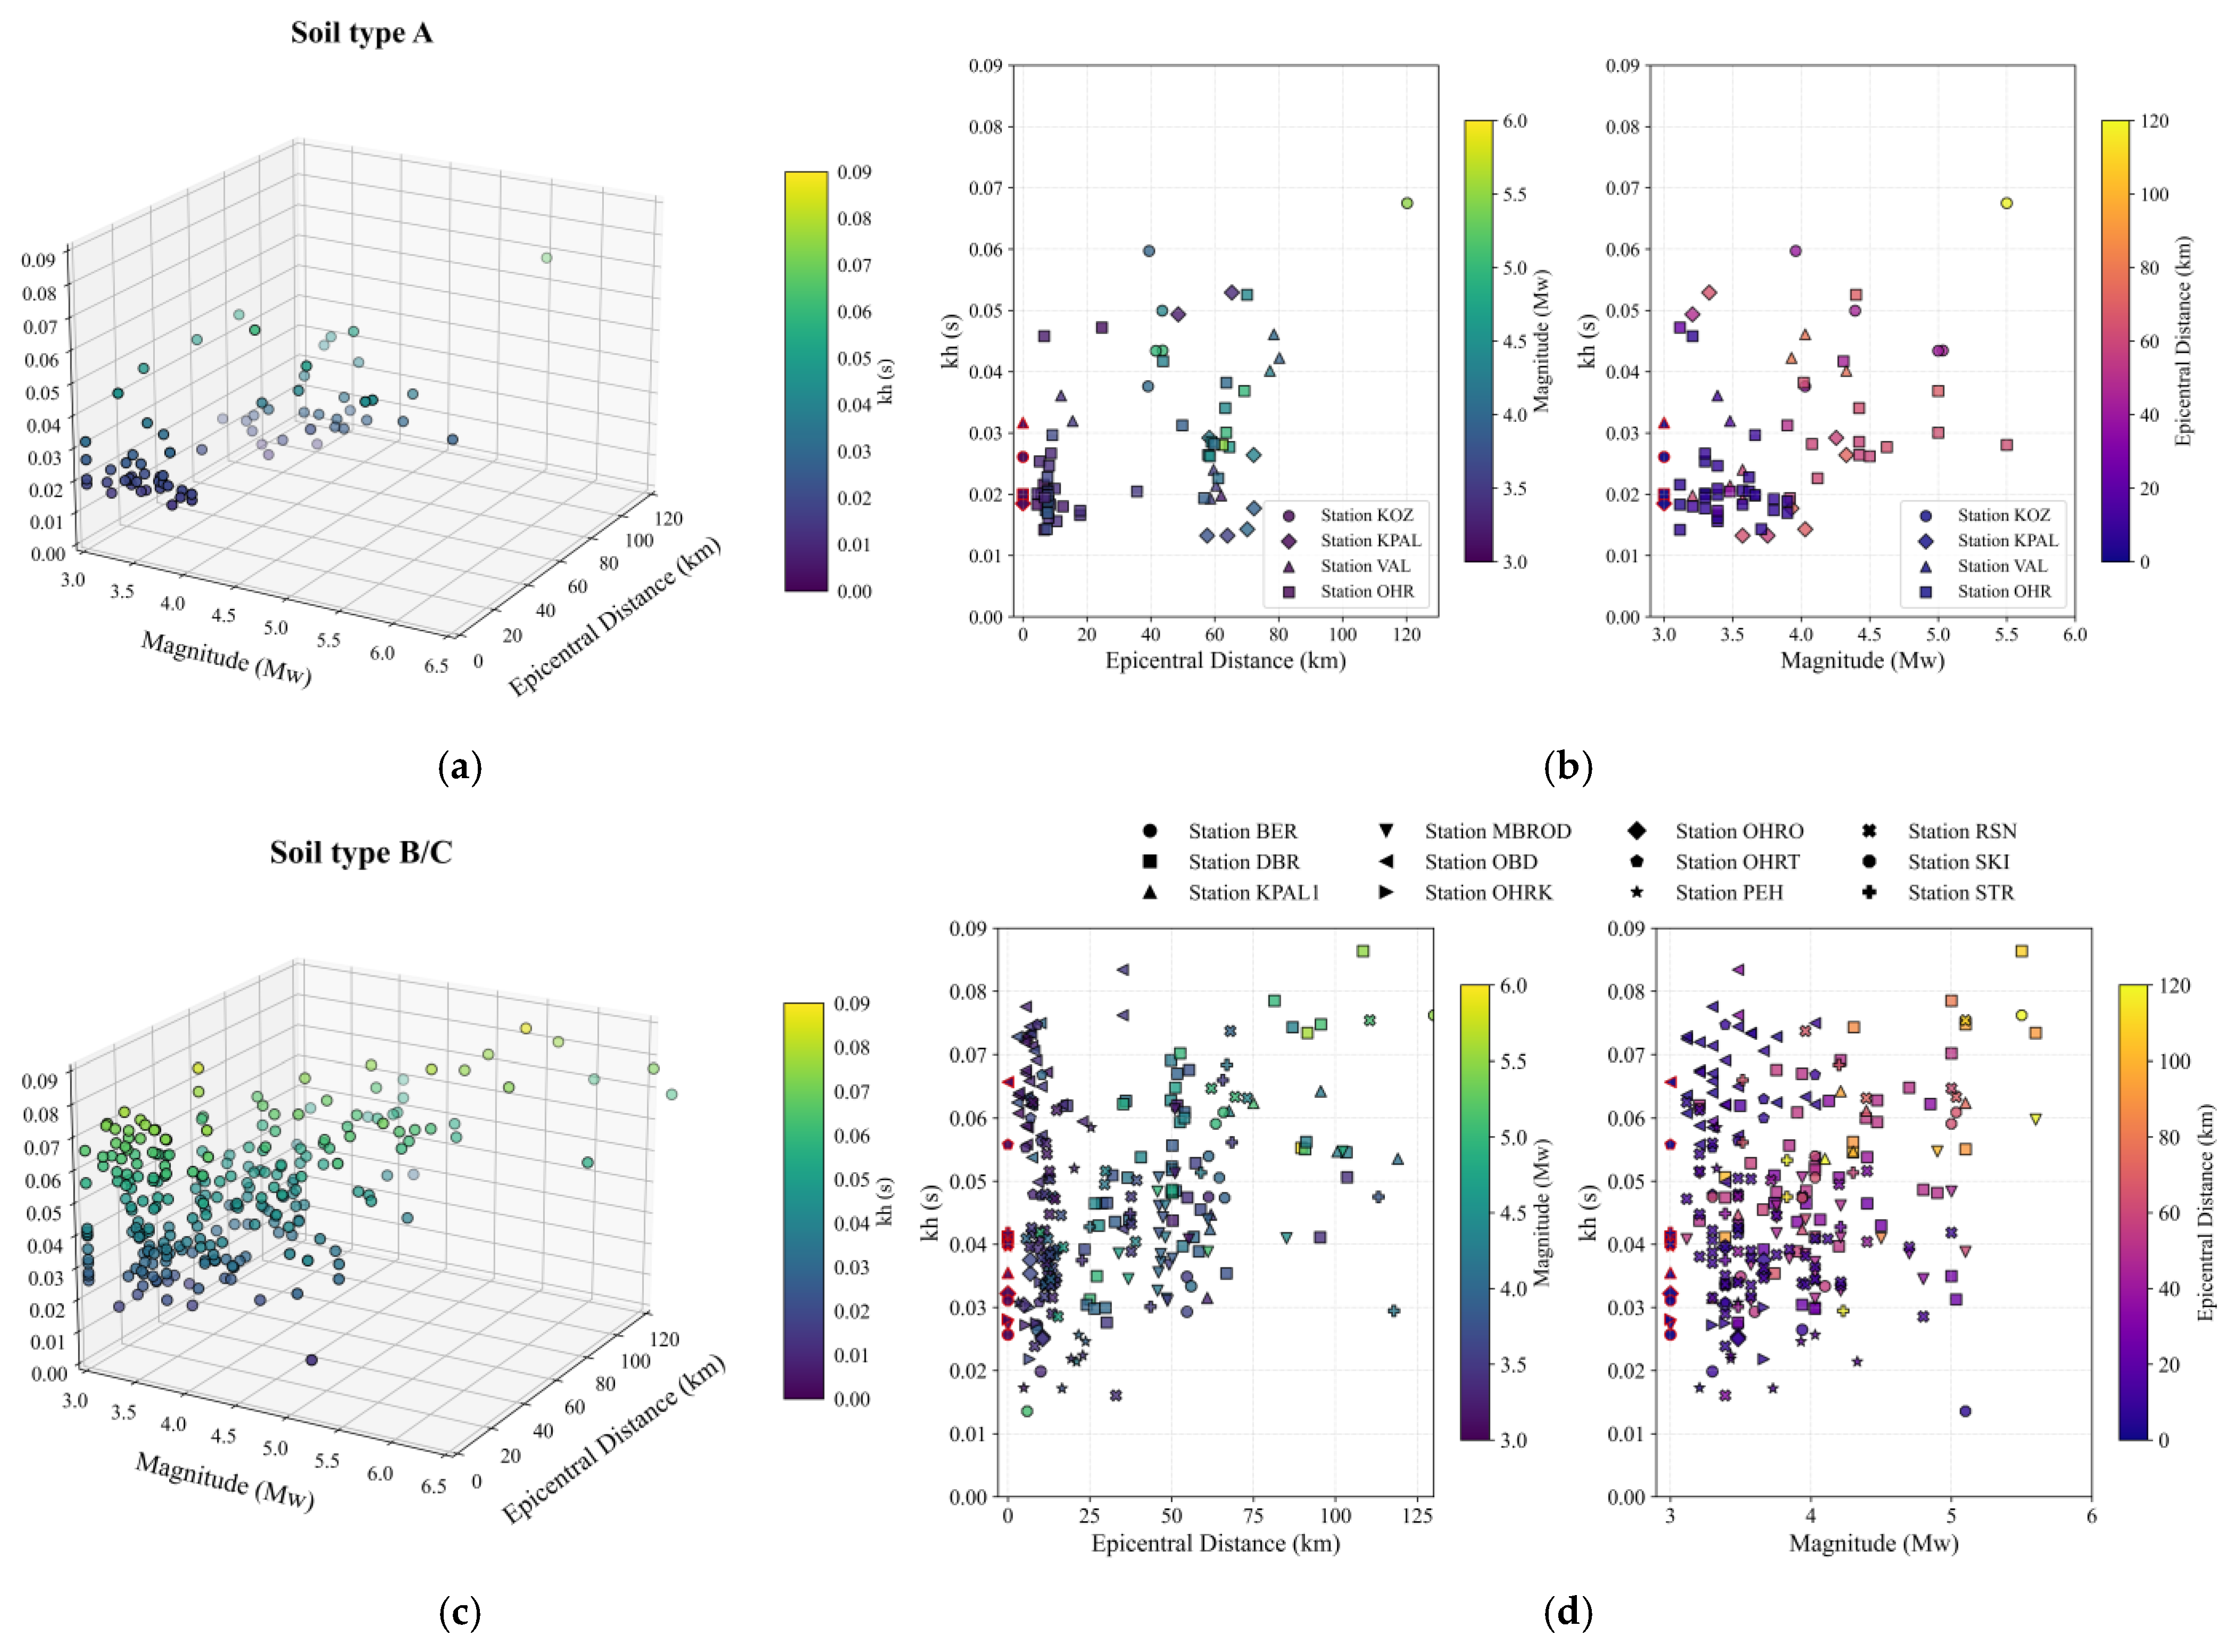
4.4. Kappa Correlation with Epicentral Distance and Magnitude
This chapter investigates the dependence of the high-frequency decay parameter kappa (k) on distance and magnitude.
Figure 10 presents both 3D and 2D plots of kappa values as a function of earthquake magnitude and epicentral distance for stations installed on soil type A (plots a and b) and for stations located on soil types B and C (plots c and d). The site-specific component k
0 for each station is marked as a symbol with a red outline. The site component is noticeably lower for soil type A, as most of the data fall at the lower bound of the plot, while a significant increase is observed for soil type B, with higher values evident. Regarding epicentral distance, the empirical parameter shows clear dependence, increasing with greater distance and decreasing with shorter distance. In terms of magnitude, no clear correlation is observed, especially in the range from 3 to 4. Earthquakes with high magnitudes and short epicentral distances are rare, so the influence of magnitude on kappa at close distances cannot be fully evaluated.
In addition to local attenuation, regional attenuation should also be considered and examined. The results obtained from the regression analysis, where sufficient data and slope calculations are available, should be further incorporated and compared with the analysis of the quality factor Q.
5. Conclusions
This study focuses on determining the high-frequency decay parameter kappa (k) and its site-specific component (k0) for sixteen accelerometric stations in North Macedonia. Only high-quality earthquake records from the IZIIS strong motion network were used for the calculation. The study investigates the parameter’s dependence on epicentral distance, site conditions (including the VS30 parameter and site resonant frequency f0), as well as earthquake magnitude.
A reasonable correlation was observed between k0 and the site parameters (VS30 and f0) of the analyzed locations. Due to geological conditions, sites with higher shear-wave velocity tend to exhibit lower k0 values, while sites with lower share wave velocity show higher values, indicating regions with significant high-frequency attenuation. Regarding site resonance frequency, a slight decrease in the site component is evident with increasing f0.
The estimated values for the site-specific component k0 vary from k0 = 0.0185 s to k0 = 0.0261 s (or 0.0317 s) for stations installed on soil class A, and from k0 = 0.0272 s to k0 = 0.0657 s for stations installed on soil class B/C. The variation in values within the same soil class suggests that it is not feasible to assign a single k0 value to a specific VS30. However, the results are consistent with the expected range reported in previous studies conducted in other countries. It should be noted that for stations where VS30 values were retrieved from the USGS VS30 Map Viewer, additional site-specific investigations (e.g., geophysical surveys or borehole data) are required to validate and refine these estimates.
As a potential extension of this study, it is proposed to refine the estimation of the site-specific component k0 by excluding the path effect through the incorporation of the regional component kappa (kR) and Q-factor correction in the regression analysis.
The findings of this study may contribute to improved ground motion attenuation modeling and the refinement of seismic hazard maps for the region. Specifically, k0 is one of the seismological parameters that can be used to characterize the host region in the context of Ground Motion Prediction Equations (GMPEs). The same parameter should also be available for the target region so that adjustments can be made.
Author Contributions
Conceptualization, M.P. and D.S.; methodology, M.P., D.S. and D.D.; software, M.P.; validation, M.P., D.S. and D.D.; formal analysis, M.P.; investigation, M.P.; resources, M.P.; data curation, M.P.; writing—original draft preparation, M.P.; writing—review and editing, M.P.; visualization, M.P.; supervision, D.S. and D.D. All authors have read and agreed to the published version of the manuscript.
Funding
This research was conducted as part of Marina Poposka’s PhD thesis under the Erasmus+ program, supervised by Davor Stanko at University of Zagreb Faculty of Geotechnical Engineering, Varaždin, Croatia. This research received no external funding.
Data Availability Statement
The data that support the findings of this study are available on request from the corresponding author.
Acknowledgments
This article is a revised and expanded version of a paper entitled: Near-distance spectral parameter kappa calculations for stations installed in N. Macedonia, which was presented at the 3rd Croatian Conference on Earthquake Engineering in Split, 19–22 March 2025. In the conference paper only four stations were analyzed, whereas in the present study, the research has been expanded to include sixteen stations. The authors would like to express their gratitude to tne anonymous reviewers for their constructive comments and valuable suggestions, which have significantly contributed to improving the clarity and overall quality of the work.
Conflicts of Interest
The authors declare no conflicts of interest.
References
- Pilz, M.; Fäh, D. The contribution of scattering to near-surface attenuation. J. Seismol. 2017, 21, 837–855. [Google Scholar] [CrossRef]
- Anderson, J.G.; Hough, S.E. A model for the shape of the Fourier amplitude spectrum of acceleration at high frequencies. Bull. Seismol. Soc. Am. 1984, 74, 1969–1993. [Google Scholar]
- Brune, J.N. Tectonic stress and the spectra of seismic shear waves from earthquakes. J. Geophys. Res. 1970, 75, 4997–5009. [Google Scholar] [CrossRef]
- Ktenidou, O.J.; Cotton, F.; Abrahamson, N.A.; Anderson, J.G. Taxonomy of k: A review of definitions and estimation approaches targeted to applications. Seismol. Res. Letts. 2014, 85, 135–146. [Google Scholar] [CrossRef]
- Silva, W.; Darragh, R.; Gregor, N.; Martin, G.; Abrahamson, N.; Kircher, C. Reassessment of Site Coefficients and Near-Fault Factors for Building Code Provisions, Technical Report Program Element II: 98-HQ-GR-1010. Pacific Engineering and Analysis: El Centro, CA, USA.
- Chandler, A.M.; Lam, N.T.K.; Tsang, H.H. Near-surface attenuation modelling based on rock shear-wave velocity profile. Soil Dyn. Earthq. Eng. 2006, 26, 1004–1014. [Google Scholar] [CrossRef]
- Drouet, S.; Cotton, F.; Guéguen, P. VS30, κ, Regional attenuation and Mw from accelerograms: Application to magnitude 3-5 French earthquakes. Geophys. J. Int. 2010, 182, 880–898. [Google Scholar] [CrossRef]
- Edwards, B.; Fäh, D.; Giardini, D. Attenuation of seismic shear wave energy in Switzerland: Seismic attenuation in Switzerland. Geophys. J. Int. 2011, 185, 967–984. [Google Scholar] [CrossRef]
- Van Houtte, C.; Drouet, S.; Cotton, F. Analysis of the origins of (kappa) to compute hard rock to rock adjustment factors for GMPEs. Bull. Seismol. Soc. Am. 2011, 101, 2926–2941. [Google Scholar] [CrossRef]
- Ktenidou, O.J.; Gelis, C.; Bonilla, L.-F. A study on the variability of kappa (k) in a borehole: Implications of the computation process. Bull. Seismol. Soc. Am. 2013, 103, 1048–1068. [Google Scholar] [CrossRef]
- Ktenidou, O.J.; Abrahamson, N.A.; Drouet, S.; Cotton, F. Understanding the Physics of Kappa (κ): Insights from a Downhole Array. Geophys. J. Int. 2015, 203, 678–691. [Google Scholar] [CrossRef]
- Stanko, D. Analysis of the Local Site Effects on the Amplification of Seismic Ground Motion in Croatia. Ph.D. Thesis, University of Zagreb, Zagreb, Croatia, 2018. [Google Scholar]
- Boore, D.M.; Joyner, W. Site amplifications for generic rock sites. Bull. Seismol. Soc. Am. 1997, 87, 327–341. [Google Scholar] [CrossRef]
- Cotton, F.; Scherbaum, F.; Bommer, J.J.; Bungum, H. criteria for selecting and adjusting ground-motion models for specific target regions: Application to Central Europe and rock sites. J. Seismol. 2006, 10, 137–156. [Google Scholar] [CrossRef]
- Douglas, J.; Bungum, H.; Scherbaum, F. Ground-motion prediction equations for Southern Spain and Southern Norway obtained using the composite model perspective. J. Earthq. Eng. 2006, 10, 33–72. [Google Scholar] [CrossRef]
- Biro, Y.; Renault, P. Importance and impact of host-to-target conversions for ground motion prediction equations in PSHA. In Proceedings of the 15th World Conference of Earthquake Engineering, Lisbon, Portugal, 24–28 September 2012; p. 10. [Google Scholar]
- Mena, B.; Mai, P.M.; Olsen, K.B.; Purvance, M.D.; Brune, J.N. Hybrid broadband ground-motion simulation using scattering green’s functions: Application to large-magnitude events. Bull. Seismol. Soc. Am. 2010, 100, 2143–2162. [Google Scholar] [CrossRef]
- Papageorgiou, A.S.; Aki, K. A specific barrier model for the quantitative description of inhomogeneous faulting and the prediction of strong ground motion. I. Description of the model. Bull. Seismol. Soc. Am. 1983, 73, 693–722. [Google Scholar] [CrossRef]
- Purvance, M.D.; Anderson, J.G. A comprehensive study of the observed spectral decay in strong-motion accelerations recorded in Guerrero, Mexico. Bull. Seismol. Soc. Am. 2003, 93, 600–611. [Google Scholar] [CrossRef]
- Anderson, J.G.; Humphrey, J.R. A least squares method for objective determination of earthquake source parameters. Seismol. Res. Letts. 1991, 62, 201–209. [Google Scholar] [CrossRef]
- Anderson, J.G. A preliminary descriptive model for the distance dependence of the spectral decay parameter in Southern California. Bull. Seismol. Soc. Am. 1991, 81, 2186–2193. [Google Scholar]
- Hollender, F.; Roumelioti, Z.; Maufroy, E.; Traversa, P.; Mariscal, A. Can we trust high-frequency content in strong-motion database signals? Impact of housing, coupling, and installation depth of seismic sensors. Seismol. Res. Letts. 2020, 91, 2192–2205. [Google Scholar] [CrossRef]
- European Committee for Standardization. Eurocode 8: Design of Structures for Earthquake Resistance. Part 1: General Rules, Seismic Actions and Rules for Buildings. CEN: Brussels, Belgium, 2004; EN 1998-1. [Google Scholar]
- Garevski, M.; Gjorgjeska, I.; Dojchinovski, D. Geophysical Investigations-Pede strian Bridge in Ohrid (Center-Kaneo); Report No. 08-39; Pangea Inzenering: Skopje, North Macedonia, 2016. [Google Scholar]
- Stojmanovska, M.; Dojcinovski, D.; Gjorgjeska, I.; Poposka, M.; Chapragoski, G.; Kovilovki, V.; Blazevki, D.; Gjorgjiev, I.; Bogdanovik, A.; Salic, R.; et al. Development and Upgrading of Strong Motion Network, Phase 1: Database, Website, and Unified Approach to Signal Processing; Report IZIIS 2021-66; Pangea Inzenering: Skopje, North Macedonia, 2021. [Google Scholar]
- Bojadzieva, J.; Edip, K.; Sesov, V.; Dojcinovski, D.; Bogdanovik, A.; Stojmanovska, M.; Salic, R.; Vitanova, M.; Kitanovski, T.; Gjorgjeska, I.; et al. IZIIS-In Situ GEO LAB; Report IZIIS 2021-62; Pangea Inzenering: Skopje, North Macedonia, 2021. [Google Scholar]
- Milutinovic, Z.; Salic, R. IZIIS’s Strong Motion Database: Disposition and Geotechnical Characteristics of Strong-Motion Stations; Report IZIIS 2018-50; Pangea Inzenering: Skopje, North Macedonia, 2018. [Google Scholar]
- Gjorgjeska, I.; Stojmanovska, M.; Dojcinovski, D.; Poposka, M.; Chapragoski, G. Geophysical site characterization for strong motion stations: A case study in North Macedonia. In Proceedings of the 1st Croatian Conference on Earthquake Engineering, Zagreb, Croatia, 22 March 2021; pp. 307–310. [Google Scholar]
- Gjorgjeska, I.; Sesov, V.; Stojmanovska, M.; Bojadjieva, J.; Dojchinovski, D.; Edip, K.; Poposka, M. Multi-Method Approach for Seismic Site Characterization. In Proceedings of the 3rd European Conference on Earthquake Engineering and Seismology (3ECEES), Bucharest, Romania, 4–9 September 2022. [Google Scholar]
- Stojkovik, M.; Petrovski, J. Three-Dimensional Network of Instruments for Researching the Influence of Local Soil Conditions and the Behavior of Structures During Earthquakes; Report IZIIS 85-194; Pangea Inzenering: Skopje, North Macedonia, 1985. [Google Scholar]
- Allen, T.I.; Wald, D.J. Topographic Slope as a Proxy for Seismic site-Conditions (Vs30) and Amplification Around the Globe; U.S. Geological Survey Open-File Report 2007-1357; U.S. Geological Survey: Reston, VA, USA, 2007; p. 69. [Google Scholar]
- Poposka, M.; Stanko, D.; Gjorgjeska, I.; Orešković, M.; Stojmanovska, M.; Dojcinovski, D. Site characterization of strong motion stations in North Macedonia. In Proceedings of the International Conference SINARG 2025, Niš, Serbia, 11–12 September 2025. submitted. [Google Scholar]
- Konno, K.; Ohmachi, T. Ground-Motion Characteristics estimated from spectral ratio between horizontal and vertical components of microtremor. Bull. Seismol. Soc. Am. 1998, 88, 228–241. [Google Scholar] [CrossRef]
- SESAME. Guidelines for the Implementation of the H/V Spectral Ratio Technique on Ambient Vibrations Measurements, Processing and Interpretation; SESAME European Research Project WP12; SESAME European Research: Allen, TX, USA, 2004; pp. 1–62. [Google Scholar]
- Parolai, S. Influence of soil-layer properties on k evaluation. Bull. Seismol. Soc. Am. 2004, 94, 349–356. [Google Scholar] [CrossRef]
- Poposka, M.; Stanko, D.; Salic-Makreska, R.; Dojchinovski, D.; Stojmanovska, M. Near-Distance Spectral Parameter Kappa Calculations for Stations Installed in n. Macedonia. In Proceedings of the 3rd Croatian Conference on Earthquake Engineering-3CroCEE, Split, Croatia, 19–22 March 2025. [Google Scholar] [CrossRef]
- York, D.; Evensen, N.M.; Martínez, M.L.; De Basabe Delgado, J. Unified equations for the slope, intercept, and standard errors of the best straight line. Am. J. Phys. 2004, 72, 367–375. [Google Scholar] [CrossRef]
- Chang, S.C.; Wen, K.L.; Huang, M.W.; Kuo, C.H.; Lin, C.M.; Chen, C.T.; Huang, J.Y. The high-frequency decay parameter (kappa) in Taiwan. Pure Appl. Geophys. 2019, 176, 4861–4879. [Google Scholar] [CrossRef]
Figure 1.
Spatial distribution of earthquake and station locations in the research area.
Figure 1.
Spatial distribution of earthquake and station locations in the research area.
Figure 3.
Left: Magnitude–distance (MW-Repi) distribution of the recordings. Right: Magnitude-depth (MW-h) distribution of the recordings. Green dots represent the analyzed data, while blue, yellow, grey, and red dots indicate excluded data.
Figure 3.
Left: Magnitude–distance (MW-Repi) distribution of the recordings. Right: Magnitude-depth (MW-h) distribution of the recordings. Green dots represent the analyzed data, while blue, yellow, grey, and red dots indicate excluded data.
Figure 4.
Distribution of frequencies fc, f1, f2 with respect to Mw.
Figure 4.
Distribution of frequencies fc, f1, f2 with respect to Mw.
Figure 5.
Example of kappa calculation for OHR station—NS component for earthquake event with Mw = 3.8, Re = 8.01 km, k = 0.0226 s and DBR station—NS component for earthquake event with Mw = 3.66, Re = 23.5 km, k = 0.0407 s, SKI station—EW component for earthquake event with Mw = 5.03, Re = 65.5 km, k = 0.0651 s.
Figure 6.
Distribution of individual κappa values and regression with distance for two stations, OHR left, DBR right. Regressed lines plotted ±1 standard deviation presented with blue dotted lines. Vertical error bars show the uncertainty of κappa values for one standard deviation and horizontal error bars show uncertainty in epicentral distances with a standard error set to ±3 km. Blue dots represent data points within one standard deviation, red dots indicate outlires beyond one standard deviation. The blue line corresponds to the regression using the full dataset, and the red dotted line represents the regression with outliers excluded.
Figure 7.
Existing k
0-V
S30 correlations in the literature: Silva et al. (1999) [
5], Chandler et al. (2005) [
6], Drouet et al. (2010) [
7], Edwards et al. (2011) [
8], Van Houtte et al. (2011) [
9], Ktenidou et al. (2013, 2014, 2015) [
4,
10,
11], Stanko (2018) [
12] (colored markers and their fit lines for particular regions are shown in legend). Adapted from Ktenidou et al. (2014) [
4] and Stanko (2018) [
12]. k
0 and V
S30 values for N. Macedonian stations are shown by pink triangles. Site V
S30 classes according to EC 8 (blue numbers) are shown on the plot. Reproduced with permission from the article: Taxonomy of κ: A Review of Definitions and Estimation Approaches Targeted to Applications; published by Seismological Research Letters, 2014 [
4].
Figure 8.
Correlation of site-component k0 and VS30 with EC8 site classes (A, B, C, D) indicated by dotted lines. Additionally, the correlation coefficient (R2) is presented.
Figure 8.
Correlation of site-component k0 and VS30 with EC8 site classes (A, B, C, D) indicated by dotted lines. Additionally, the correlation coefficient (R2) is presented.
Figure 9.
Correlation of site-component k0 and site resonant frequency (f0) obtained from HVSR using earthquake data. Additionally, the correlation coefficient (R2) is presented. Different marker colors present different soil types according to EC8 (green—type A, blue—type B, red—type C).
Figure 9.
Correlation of site-component k0 and site resonant frequency (f0) obtained from HVSR using earthquake data. Additionally, the correlation coefficient (R2) is presented. Different marker colors present different soil types according to EC8 (green—type A, blue—type B, red—type C).
Figure 10.
Adapted from Poposka et al., 2025 [
33]. Three-dimensional plot from obtained kappa results in correlation with M
w and R
epi for stations installed on soil type A (
a) and soil types B/C (
c). Plots (
b) (soil type A) and (
d) (soil type B/C) display corresponding 2D plots illustrating the correlation of the kappa parameter with epicentral distance and magnitude. The site-specific component k
0 for each station is marked as a symbol with a red outline.
Table 1.
Station information, soil investigation type 1—geophysics, type 2—HVSR with microtremors, type 3—HVSR with earthquakes, type 4—borehole investigation, fundamental frequency obtained from earthquake data. The symbol “/” indicates no available data.
Table 1.
Station information, soil investigation type 1—geophysics, type 2—HVSR with microtremors, type 3—HVSR with earthquakes, type 4—borehole investigation, fundamental frequency obtained from earthquake data. The symbol “/” indicates no available data.
| Station | Lat [°] | Lon [°] | VS30 [m/s] | VS30/USGS
[m/s] | Investigation Type | f0 [Hz] |
|---|
| BER | 41.711 | 22.852 | / | 500 | 2, 3 | 3.4 |
| DBR | 41.518 | 20.529 | 400–450 | 450 | 1, 3 | 1.0 |
| KOZ | 41.878 | 21.195 | / | 800 | 2, 3 | 6.0 |
| KPAL | 42.209 | 22.363 | >800 | 850 | 1, 2, 3 | 10.0 |
| KPAL1 | 42.206 | 22.335 | / | 350 | 2, 3 | 3.5 |
| MBROD | 41.506 | 21.219 | / | 380–400 | 2, 3 | 5.8 |
| OBD | 41.114 | 20.807 | 350–400 | 380 | 2, 3, 4 | 1.0 |
| OHR | 41.111 | 20.792 | >1000 | 900 | 1, 2, 3 | 15.0 |
| OHRK | 41.109 | 20.811 | 350–400 | 380 | 1, 2, 3, 4 | 1.4 |
| OHRO | 41.114 | 20.803 | / | 380 | 2, 3 | 2.9 |
| OHRT | 41.107 | 20.809 | 350–400 | 380 | 2, 3, 4 | 1.1 |
| PEH | 41.776 | 22.897 | 380–450 | 420 | 1, 2, 3 | 0.8 |
| SKI | 41.090 | 21.012 | 330 | 400 | 1, 2, 3 | 8.8 |
| RSN | 41.979 | 21.425 | / | 360–400 | 2, 3 | 0.6 |
| STR | 41.443 | 22.631 | / | 350–380 | 2, 3 | 3.0 |
| VAL | 41.321 | 22.564 | 774 | 650 | 1, 2, 3 | 4.0 |
Table 2.
Adapted from Poposka et al., 2025 [
33]. Site component (k
0) values were obtained from regression analysis using error-in-variables and mean values for distances up to 25 km, along with the number of records included in each analysis and V
S30 values for each station. The symbol “/” indicates insufficient data for a reliable regression or mean value analysis.
| Station | k0regression | No. Records | k0 mean up to 25 km | No. Records (0–25 km) | Vs,30 [m/s] |
|---|
| BER | 0.0257 ± 0.004 | 7 | 0.0268 | 4 | 500 |
| DBR | 0.0408 ± 0.006 | 49 | 0.0506 | 2 | 400–450 |
| KOZ | 0.0261 ± 0.008 | 7 | 0.0268 | 2 | 800 |
| KPAL | 0.0185 ± 0.060 | 6 | / | / | >800 |
| KPAL1 | 0.0355 ± 0.018 | 8 | / | / | 350 |
| MBROD | 0.0272 ± 0.006 | | / | / | 380–400 |
| OBD | / | / | 0.0657 | 35 | 350–400 |
| OHR | 0.0181 ± 0.003 | 28 | 0.0232 | 16 | >1000 |
| OHRK | / | / | 0.0281 | 5 | 350–400 |
| OHRO | / | / | 0.0322 | 6 | 350–400 |
| OHRT | / | / | 0.0558 | 9 | 350–400 |
| PEH | 0.0281 ± 0.010 | 10 | 0.0396 | 10 | 380–450 |
| SKI | 0.0311 ± 0.011 | 6 | / | / | 330 |
| RSN | 0.0356 ± 0.002 | 62 | 0.040 | 48 | 360–400 |
| STR | 0.0418 ± 0.008 | 11 | | 2 | 350–380 |
| VAL | 0.0317 ± 0.008 | 9 | 0.0320 | 2 | 774 |
| Disclaimer/Publisher’s Note: The statements, opinions and data contained in all publications are solely those of the individual author(s) and contributor(s) and not of MDPI and/or the editor(s). MDPI and/or the editor(s) disclaim responsibility for any injury to people or property resulting from any ideas, methods, instructions or products referred to in the content. |
© 2025 by the authors. Licensee MDPI, Basel, Switzerland. This article is an open access article distributed under the terms and conditions of the Creative Commons Attribution (CC BY) license (https://creativecommons.org/licenses/by/4.0/).


