Article

Determining Key Parameters in Rock Properties for the Design of Hydroelectric Projects: A Case Study in Morona Santiago, Ecuador

by
Walter David Becerra Moreira
1,
Antonella Zulema Tupac Yupanqui
1,
Maurizio Mulas
1 and
Luis Jorda-Bordehore
2,*
1
Faculty of Engineering in Earth Sciences (FICT), ESPOL Polytechnic University, Km 30.5 Perimetral Road, Guayaquil 090101, Ecuador
2
ETSI Caminos, Canales y Puertos, Universidad Politécnica de Madrid, C/Prof Aranguren s/n, 28040 Madrid, Spain
*
Author to whom correspondence should be addressed.
Geotechnics 2025, 5(2), 32; https://doi.org/10.3390/geotechnics5020032
Submission received: 21 February 2025 / Revised: 14 May 2025 / Accepted: 19 May 2025 / Published: 23 May 2025

Abstract

Subsurface characterisation is a fundamental aspect of the planning and design of hydroelectric projects, as it enables the assessment of the technical and geotechnical feasibility of the proposed infrastructure, ensuring its stability and functionality. This study focuses on the characterisation of rock masses from boreholes in the “Santa Rosa” and “El Rosario” areas, located in Morona Santiago, Ecuador, to determine key parameters for the design of hydroelectric projects. Field and laboratory tests were conducted, including uniaxial compression tests, indirect tensile–Brazilian tests, point load tests, tilt tests, and geomechanical classifications using the RMR and Q systems. The results show that igneous rocks, such as basalt and andesite, exhibit mechanical properties ranging from moderate to high, with uniaxial compressive strengths exceeding 120 MPa in the case of basalt, classifying it as a strong rock. In contrast, metamorphic rocks, such as chert, exhibit lower strength, with values ranging between 69.69 MPa and 90.63 MPa, classifying them as moderately strong. The RMR and Q index values indicate a variable rock mass quality, ranging from excellent in diorite and granite sectors to low in areas with significant discontinuities and alterations. Additionally, variations in basic friction angles were identified, ranging from 18° to 38°, which directly influence the stability of the proposed structures. In conclusion, this study highlights the importance of geomechanical characterisation in ensuring the technical feasibility of hydroelectric projects, providing key information for the design and development of safe and sustainable infrastructure in the region.

1. Introduction

Ecuador has experienced significant growth in its energy demand, driven by economic development and improvements in the quality of life of its population [1]. Hydroelectric power plants represent a viable and ecological solution to achieving energy and environmental goals, reducing dependence on fossil fuels [2]. The implementation of the hydroelectric projects “El Rosario” and “Santa Rosa”, located in the province of Morona Santiago, Ecuador, requires the execution of thorough site investigations to ensure feasibility studies. These investigations help establish the technical, financial, and environmental viability of the proposed infrastructure, particularly the powerhouse, which is designed to generate an approximate total capacity of 49.5 MW each [1]. Field and laboratory tests identify issues and assess the suitability of the sites and materials [2]. The process carefully evaluates the physical and mechanical properties of the site’s rock formations. Among the techniques used are in situ tests, such as the point load test, discontinuity mapping through scanline systems, and permeability tests on rock masses, which determine parameters such as compressive strength, fracture density, and rock mass quality [2,3]. At the laboratory level, uniaxial compression strength (UCS), triaxial tests, and deformation tests are conducted to characterise the material’s response to stress. These data are integrated into rock mass classifications such as Rock Mass Rating and the Q-system [4]. Furthermore, numerical models simulate geomechanical behaviour under different loading and design scenarios, complementing the empirical analyses [5].
This research aims to characterise the rock mass to assign strength and deformability properties to the sectors analysed by collecting and analysing data obtained from two geotechnical field exploration campaigns. The first campaign focuses on the geomechanical characterisation of the rock mass, using core logging techniques and determining parameters such as the RMR (Rock Mass Rating) and the Q index. Complementarily, the second campaign focuses on conducting laboratory tests, including uniaxial compression, Brazilian tensile, tilt, and point load tests (PLTs). Integrating these results aims to enhance the accuracy of predictions regarding the geotechnical behaviour of the studied area. This research provides data and geomechanical parameters of certain rocks abundant in the Andean and Ecuadorian regions, usually characterised by outcrops. It is less common to have in-depth data in geotechnical surveys. One of the objectives of this research is to provide more data that will serve to enrich the database of geotechnical parameters for the design of infrastructure and civil works in the Andean region.

2. Materials and Methods

2.1. Study Area

The study area is in the south of the Republic of Ecuador, in the province of Morona Santiago, Gualaquiza canton, in the parishes of El Rosario and Santa Rosa (Figure 1), defined as Zone 1 and Zone 2, respectively.
The study areas are characterised by varied topography, including steep slopes, narrow valleys, and water bodies that traverse the landscape. This diversity influences the geomorphological processes and the hydrological dynamics of the region [6]. The area is in the southeastern region of Ecuador, with a predominance of jungle and mountainous terrain, at altitudes ranging from 800 to 3400 m above sea level. Regarding water resources, the Bomboiza, Chuchumbleza, and Zamora rivers mainly contribute to the Santiago River basin, a significant tributary of the Amazon River that flows into the Atlantic Ocean [7].

2.2. Geological Background

The region primarily comprises metamorphic and sedimentary formations (Figure 2) ranging from the Paleozoic to the Quaternary. In the site of “El Rosario”, located in Zone 1, rocky outcrops and clayey soils are present, whereas in “Santa Rosa”, located in Zone 2, there is a greater presence of alluvial, eluvial, and colluvial soils resulting from erosion and deposition processes [8].
The oldest rocks in the region correspond to the metamorphic rocks of the Zamora Group, of the Paleozoic, considered the most primitive geological units of the area [9]. Subsequently, the post-Paleozoic units include volcanic rocks, such as the lavas of the Chapiza Formation (Misahualli Member), which outcrop in thicknesses exceeding 100 metres. These rocks comprise lavas, andesites, porphyritic intrusions, red shales, sandstones, and conglomerates. Macroscopically, the andesites and lavas are characterised by being compact rocks with greenish tones, while the lavas exhibit an aphanitic texture with phenocrysts of plagioclase and a grey-green coloration. Additionally, they contain sulphides in veins and are disseminated in specific areas [10].
The sedimentary formations from the Mesozoic and Cenozoic, such as the Hollín, Napo, and Tena, are mainly composed of white quartzitic sandstones with medium to coarse grains, exhibiting a sugary texture and a whitish-yellow coloration. The sandstones show predominant stratification and a moderate to poor classification, occasionally accompanied by veins of coal. Additionally, black shales are interstratified with these sandstones. The Napo Formation, in particular, consists of a succession of black shales, grey to black limestones, and calcareous sandstones, with a thickness ranging from 200 to over 700 m [11]. From the Quaternary, the region shows glacial, colluvial, and alluvial deposits and terraces, reflecting active geomorphological processes in the basin [12]. These stratigraphic units are intruded by granodioritic rocks, attributable to an intrusion during the Cretaceous or Lower Tertiary period. Additionally, the presence of granite rocks in the “Tres Lagunas Unit” is noteworthy [9].
In the study sites (Figure 2), various surface deposits are observed, including glacial deposits in the mountainous regions of the “El Bestión” and “Ortega Alto” ranges to the northeast of Tutupali. The powerful eastern drainages transport all the materials currently eroded in the Real Mountain Range. As these drainages lose their carrying capacity in certain sections, they deposit sediments in lower slope areas, forming alluvial deposits [13]. The migration of rivers and changes in base levels have primarily caused the formation of wide alluvial terraces along the banks of the Gualaquiza, Cuchipamba, Cuyes, and Bomboiza rivers. Additionally, colluvial deposits are found in the slope areas of the valleys, indicating the movement of material along the slope due to erosion and gravitational processes [14].

2.3. Sampling

The selected drilling sites (Table 1) are located within the project’s area of influence and have been designated as the planned locations for the powerhouse. These study areas are part of the El Bestión mountain range and southwest of Morona Santiago province.
The boreholes were drilled using HQ drilling pipes with a diamond bit (Figure 3, item a), a technique employed to recover alluvial deposits and granite and metamorphic rock formations continuously. A detailed borehole log was kept documenting the geological characteristics encountered at each depth (see Figure 3c). The HQ pipe allows for the creation of wells with a diameter of 96.1 mm, obtaining cylindrical cores of 63.5 mm in diameter and approximately 1.5 m in length, which are extracted using a steel barrel and stored in plastic boxes of the same diameter (see Figure 3b–d). During the process, powdered bentonite and biodegradable polymers were used to optimise the performance of the drilling fluid. The operations were carried out in May 2024.
Four boreholes were strategically distributed to obtain a complete lithological sequence and reach the site’s bedrock: two in the Santa Rosa area and two in El Rosario (see Table 1). These boreholes facilitated the geological characterisation by revealing the different lithologies present at each location (see Table 2), providing essential data for the geotechnical analysis of the area.

2.4. Rock Mass Rating (RMR)

The following analysis is based on the 1989 version of the classification [15]. To classify rock masses using the RMR system, the following six parameters are used:
  • Uniaxial compressive strength of the rock material;
  • Rock Quality Designation (RQD);
  • Discontinuity spacing;
  • Condition of the discontinuities;
  • Groundwater conditions;
  • Orientation of the discontinuities.
Five values are presented for each of the six parameters considered, depending on the specific conditions associated with those parameters. The Rock Mass Rating (RMR) classification index is calculated as the sum of the values assigned to each parameter, varying linearly from 0 to 100. This index increases proportionally to the quality of the rock, reaching higher values in materials with better geomechanical characteristics [16].

2.5. Q Index

Barton (1974) proposed a tunnel quality index (Q) based on the evaluation of historical cases of underground excavations, which is used to determine the characteristics of the rock mass and the construction requirements for tunnels [17]. The Q index presents a logarithmic scale variation, with values ranging from 0.001, corresponding to rock masses of very low quality, up to a maximum of 1000, characteristic of rock masses with excellent geomechanical properties. The following expression defines this index:
Q = R Q D J n ( J r J a ) J w S R F
where:
  • R Q D = R o c k   Q u a l i t y   D e s i g n a t i o n ;
  • J n = j o i n t   n u m b e r ;
  • J r = j o i n t   r o u g h n e s s   n u m b e r ;
  • J a = j o i n t   a l t e r a t i o n   n u m b e r ;
  • J w = j o i n t   w a t e r   r e d u c t i o n   f a c t o r ;
  • S R F = s t r e s s   r e d u c t i o n   f a c t o r .

2.6. Uniaxial Compressive Strength (UCS)

The uniaxial compressive strength test is performed on cylindrical rock cores to determine the uniaxial compressive strength (σc), modulus of elasticity (Ei), and axial deformation (ϵ). These data evaluate the rocks’ load-bearing capacity and mechanical behaviour under compression. This test must follow the guidelines outlined in the ASTM D7012-04 standard [18]. The standard indicates that the most suitable length-to-diameter ratio for the sample is 2.00:1.00 (L/D = 2.00), corresponding to intact samples obtained from the boreholes (see Figure 4).
The maximum compressive strength is described as the stress required for the cylindrical core to generate a fracture in its structure. When conducting the test, the fracture will occur at the moment when there is a sudden drop in the applied load. The compressive force produced is in accordance with the ASTM D7012-04 standard [19], corresponding to:
σ c = σ ( 0.88 + 0.222 d t )
where:
  • σ c = c o r r e c t e d   r u p t u r e   s t r e s s
  • σ = f a i l u r e   s t r e s s
  • d = s a m p l e   d i a m e t e r
  • t = s a m p l e   l e n g t h .  

2.7. Indirect Tensile Test or “Brazilian Test”

The indirect tensile test (also known as the Brazilian test) allows for the indirect determination of the tensile strength of cylindrical rock samples (Figure 5a) through diametral tension. The main parameter obtained in this test is the tensile strength (σt), which helps to understand the rock material’s resistance to tensile stresses. The test is conducted by the ASTM D3967-95 standard [19] (Figure 5b).
The test samples are circular disc cores with a thickness-to-diameter (t/D) ratio of between 0.2 and 0.75. The diameter of the sample must be at least 10 times greater than the most significant mineral grain component. A diameter of 50 mm (NX) generally meets this criterion (see Figure 5). According to ASTM D3967-95 standard [20], the tensile strength of the specimen must be calculated as follows:
σ t = 2 P π L D
where:
  • σ t = t e n s i l e   s t r e n g t h ,   M P a   ( p s i ) ;
  • P = m a x . l o a d   a p p l i e d   a s   i n d i c a t e d   b y   t h e   t e s t i n g   m a c h i n e ,   N o   l b f ;
  • L = t h i c k n e s s   o f   t h e   s a m p l e ,   m m   o r   i n c h e s ;
  • D = d i a m e t e r   o f   t h e   s a m p l e ,   m m .

2.8. Point Load Test (PLT)—“Franklin Test”

This test determines a soil’s load-bearing capacity by applying a load through a circular plate placed on the soil’s surface. The parameters obtained include the ultimate load capacity (qu). This test is conducted by applying a load at a point (Figure 6a) and in a uniaxial manner, which gradually increases to measure the strength of the rock specimens (see Figure 6b).
The point load index is calculated using the following equation after recording the force applied by the piston on the rock sample to break it.
I s = P D e 2
where:
  • I s = u n c o r r e c t e d   p o i n t   l o a d   s t r e n g t h ;
  • P = m a x i m u m   l o a d   a p p l i e d   t o   b r e a k   t h e   s a m p l e ;
  • D e = e q u i v a l e n t   d i a m e t e r   o f   t h e   s a m p l e .  

2.9. Tilt Test

This test provides a material’s basic friction angle (ϕb), a key parameter for evaluating the stability of rock slopes and other geotechnical structures. The tilt test, according to ASTM C1444-00 standards [20], is where the contact of the sample must rotate to obtain further data on the failure angle (see Figure 7a,b).

3. Results

3.1. Stratigraphy

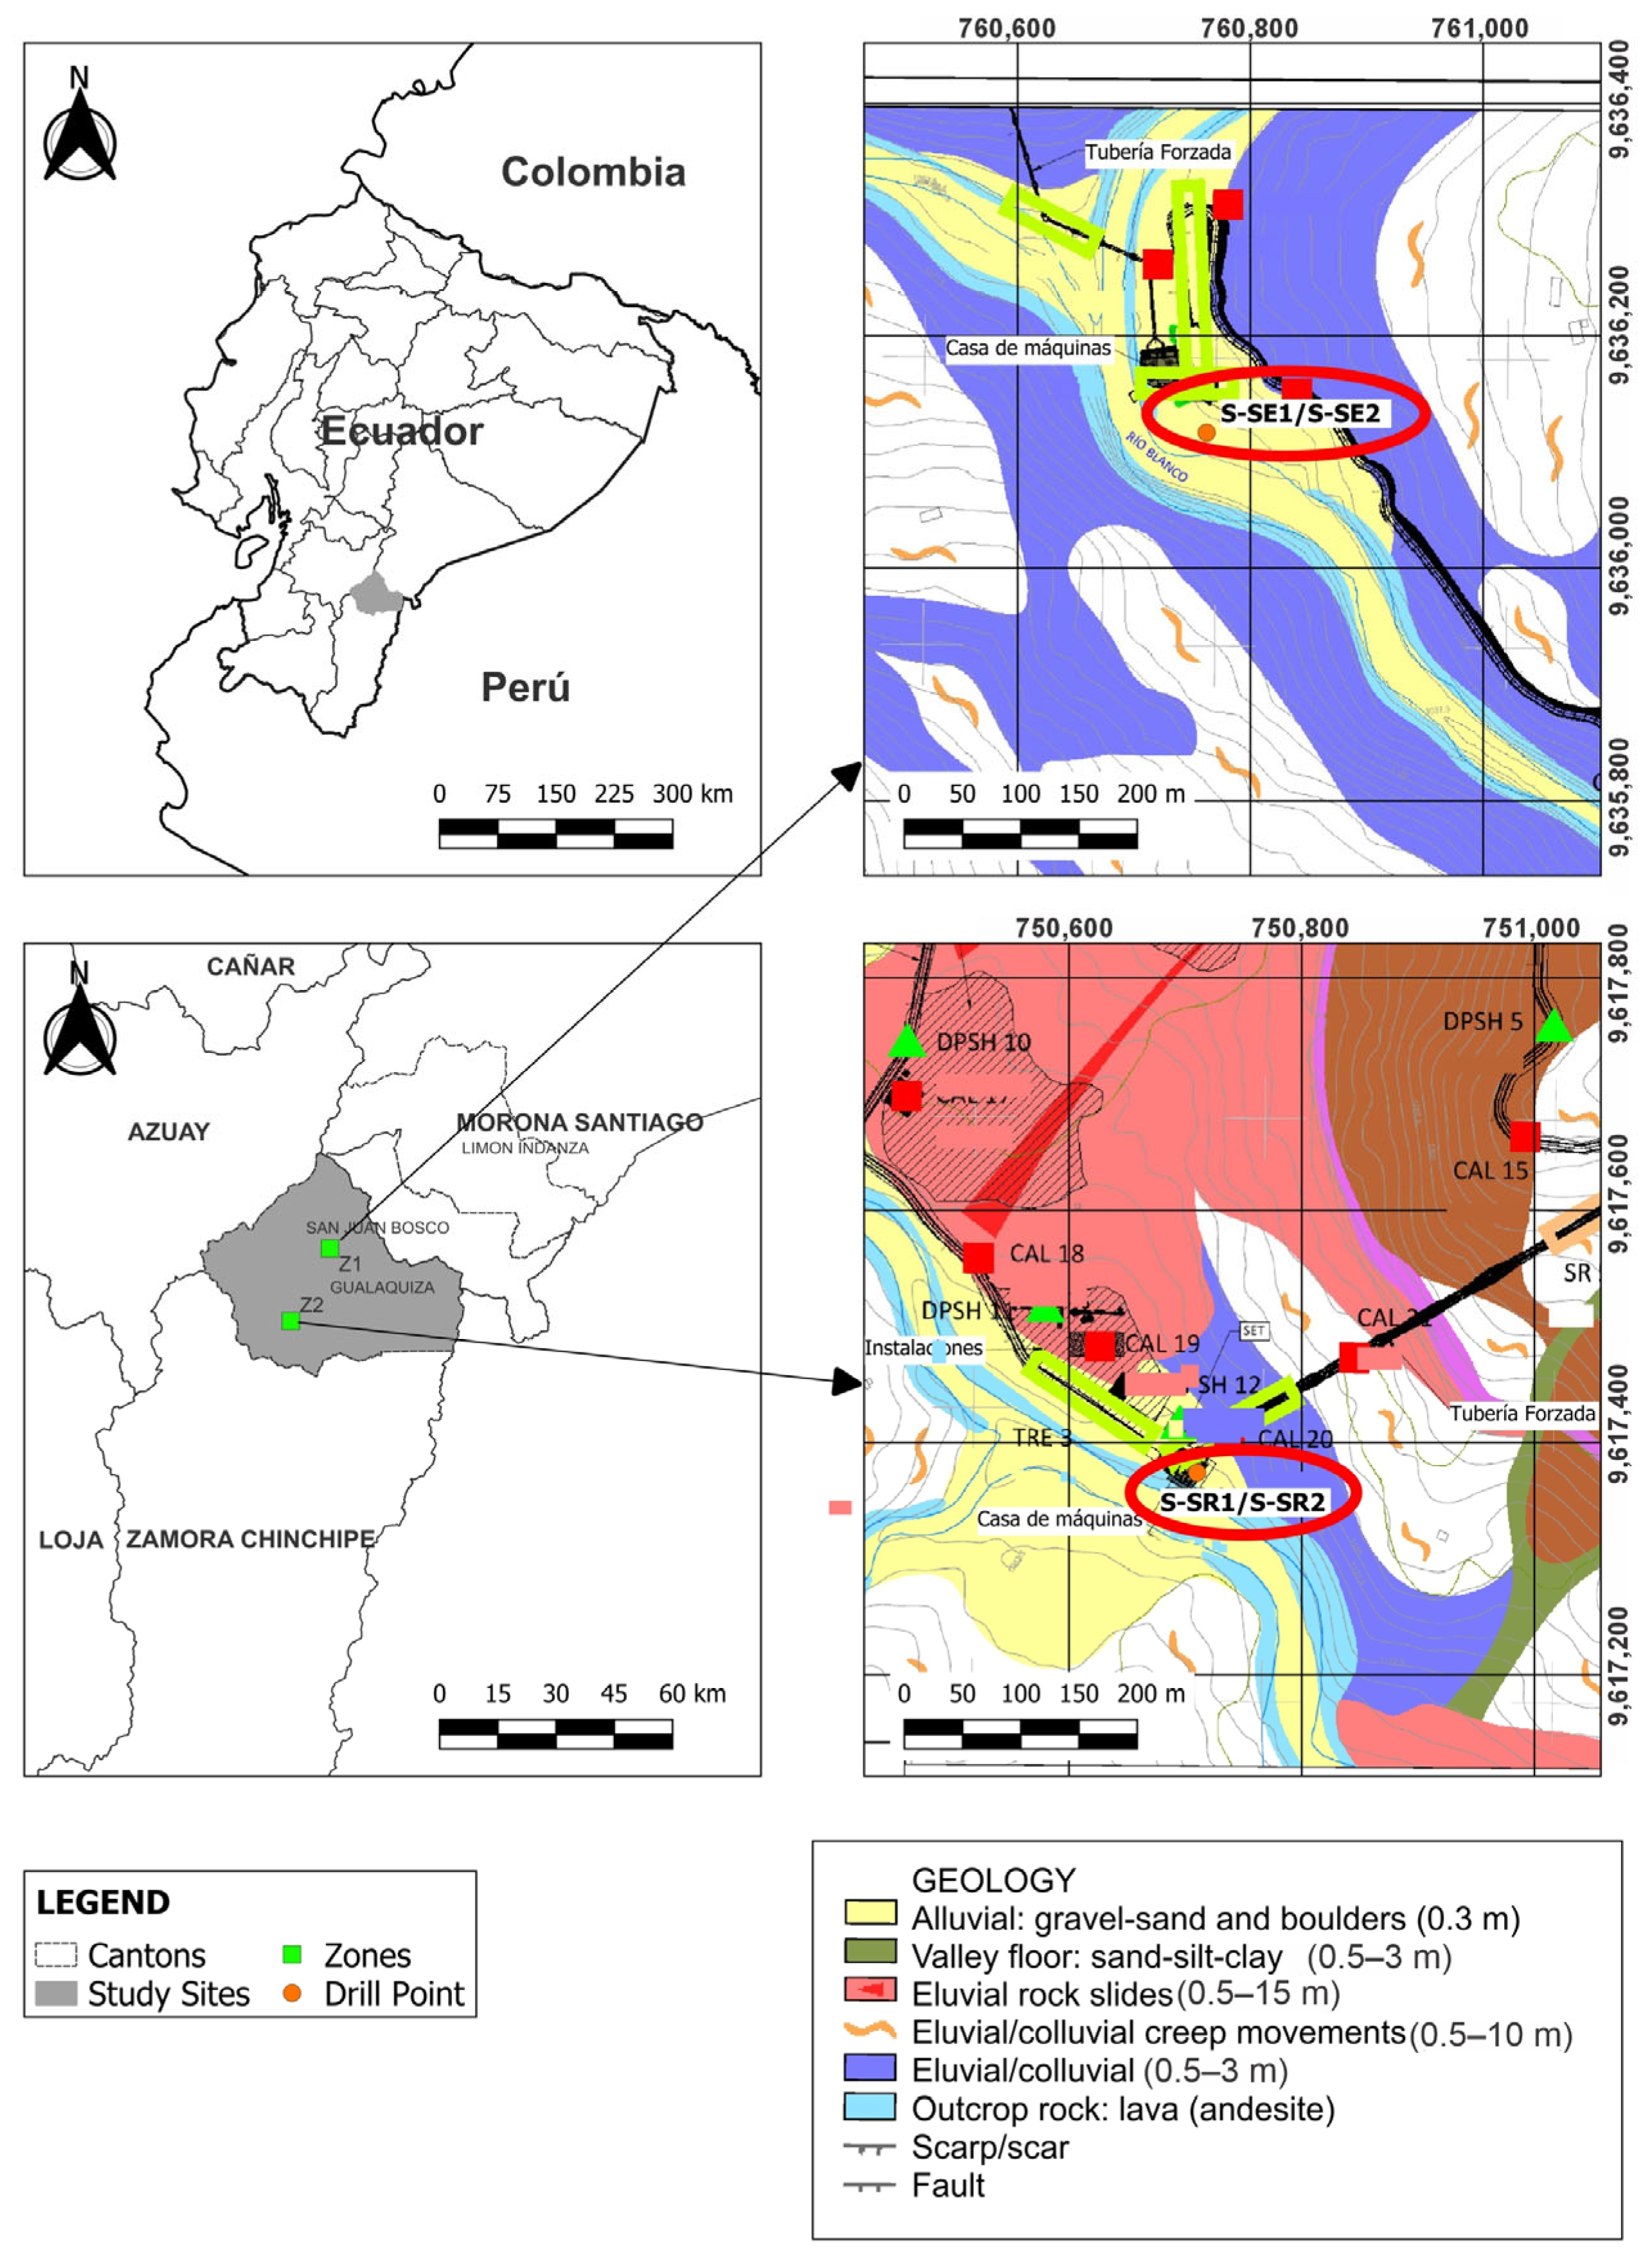
For the characterisation of the obtained drilling cores, a geotechnical logging of the sample boxes was conducted, which allowed for the identification of the lithological and structural characteristics of the materials. In the El Rosario area, intrusive igneous rocks were identified and classified as diorites and granites, while the second borehole predominantly featured volcanic igneous rock, represented by basalt, andesite, and diorite/granite. In the Santa Rosa area, the first borehole revealed a volcanic igneous composition with andesite, diorite/granite, and basalt, followed by a metamorphic rock from the chert subgroup, subsequently accompanied by volcanic igneous rock composed of andesite and basalt, as summarised in Table 2.
Additionally, the samples for laboratory tests were prepared following the procedures established in specific technical standards. For the unconfined compressive strength test, ASTM D7012-14 standard was followed [21], which specifies the methods for determining the uniaxial compressive strength and the modulus of elasticity of rocks. In the case of the indirect tensile test or Brazilian test, the ASTM D3967-16 standard was employed [22], which defines the procedures for measuring tensile strength by applying diametral load. Meanwhile, the point load test was conducted following the guidelines of the ASTM D5731-16 standard [23], which regulates the determination of the strength of rocks through point loads. Finally, the tilt test, used to determine the basic friction angle between the rocks’ contact surfaces, was conducted per the ASTM C1444-00 standard [20].
The preparation of the samples included cutting and conditioning the specimens to ensure their compatibility with each test’s geometric and physical requirements. This process maximised the results’ reliability, providing accurate and consistent data for subsequent geotechnical analysis. Compliance with these standards ensures the standardisation of procedures and contributes to the quality and precision of the studies conducted.

3.2. RMR and Q Index

Based on the geomechanical classifications of the RMR and Q index, the following main characteristics of the evaluated rocks were identified. The diorite/granite at a depth of 11.20 m showed an RMR of 96 and a Q index of 96, classifying it as an excellent-quality rock. Meanwhile, the basalt at 17.35 m achieved an RMR of 60 and a Q index of 5.00, indicating good rock quality. In the case of andesite, at a depth of 26.90 m, an RMR of 83 and a Q index of 190.00 were recorded, also classifying it as excellent quality. Finally, the samples of diorite/granite at 8.90 m exhibited significantly lower values, with an RMR of 23 and a Q index of 0.03, indicating low quality due to discontinuities and alterations.
The results obtained for the El Rosario area are presented in Table 3. These values were obtained from boreholes, not outcrops.
The following results were obtained in Santa Rosa, as shown in Table 4.
Different quality levels were identified in the analysis of the obtained samples according to the RMR and Q index values. The samples with excellent quality, those with a Q index above 10 or an RMR greater than 80, include cases such as sample S-SR-02 at a depth of 20.20 m, which presented a Q index of 12.17 and an unspecified RMR, classifying it as good quality. Simultaneously, another measurement yielded an RMR of 73 and a similarly high Q index of 12.17, placing it in the excellent-quality category. Additionally, sample S-SR-01 at a depth of 24.30 m showed a Q index of 7.78, indicating very high quality.
Regarding igneous rocks, such as diorite/granite and andesite, high RMR and Q index values were observed, as in the case of granite at 11.20 m, with an RMR of 96 and a Q index of 190. These characteristics reflect high strength and low fracturing, classifying them as excellent-quality rocks. On the other hand, igneous rocks like basalt and andesite, with RMR values of between 50 and 80 and Q indices of between 1 and 10, are considered good quality. A representative example is sample S-SE-02 at 26.00 m, which presented a Q index of 26.00, confirming its good mechanical behaviour.
Finally, metamorphic rocks, such as chert, exhibited the lowest RMR and Q index values, as seen in the sample at 15.20 m, which recorded an RMR of 4.56 and a Q index of 0.74. This indicates lower strength and greater susceptibility to fracturing, classifying them as low-quality rocks.

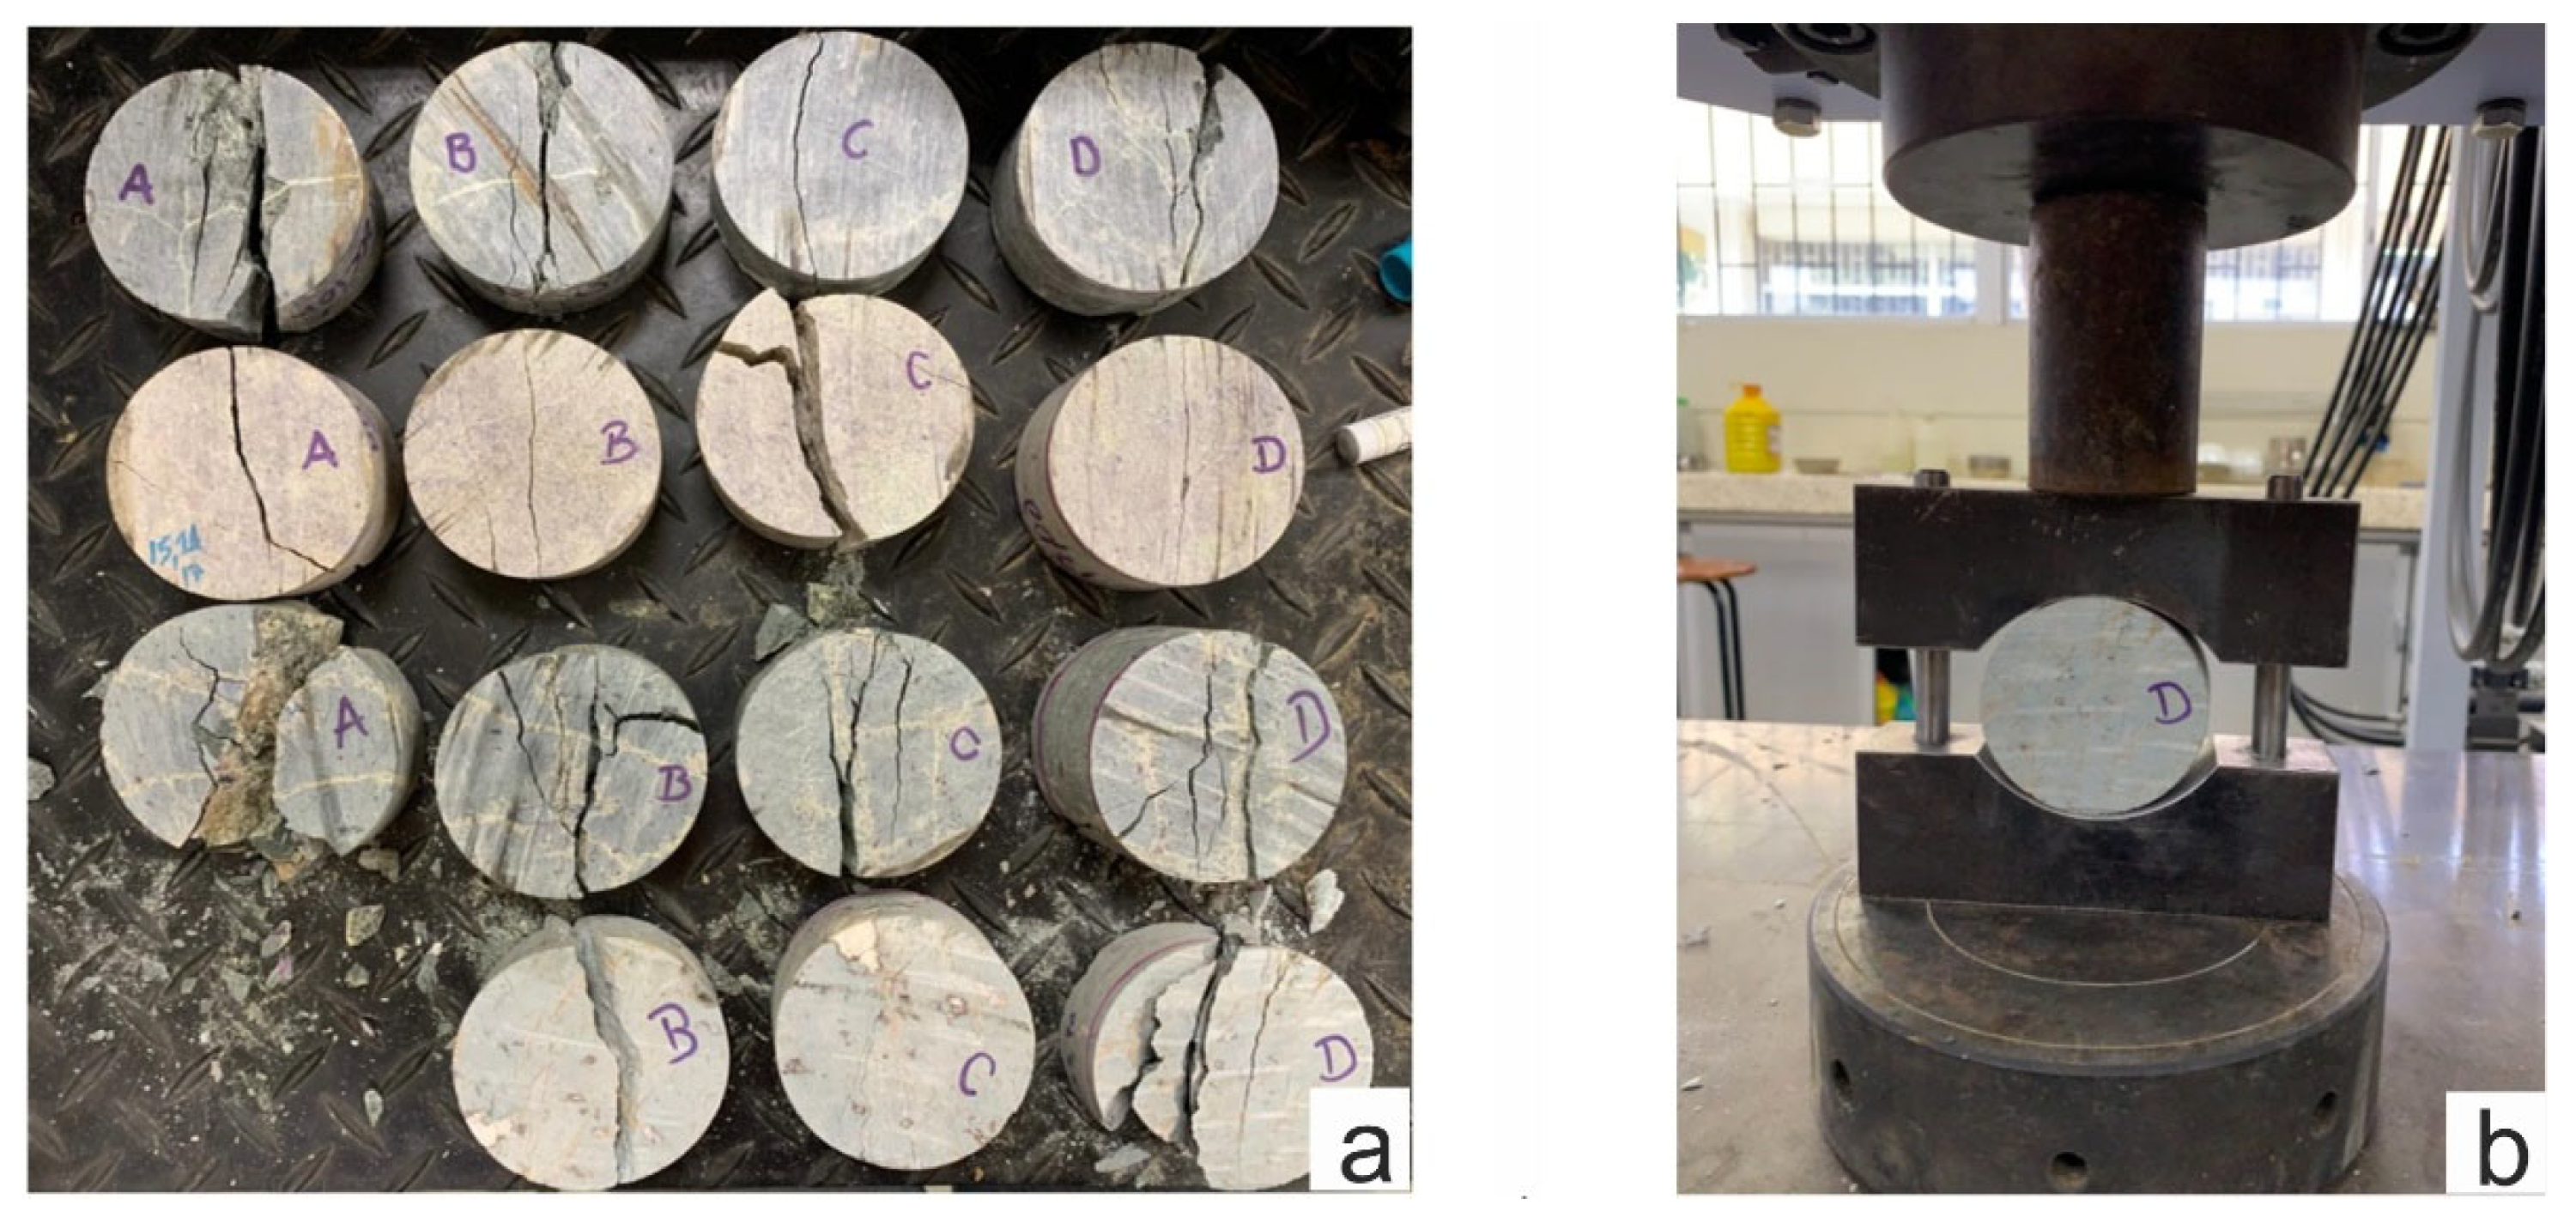
3.3. Unconfined Compression

The unconfined compression test was conducted to determine the uniaxial compressive strength (UCS) of different lithologies in the study areas of “El Rosario” and “Santa Rosa”.
The results, organised in Table 5, show that the intrusive rocks of diorite/granite exhibited a strength that varied between 89.3 MPa and 125.8 MPa, indicating that they are strong rocks, with average applied loads ranging from 279.8 kN to 393.0 kN. On the other hand, the basalt, with a strength exceeding 120 MPa and an average of 131.7 MPa, was classified as a high-strength rock, demonstrating consistency in the quality of the samples, with an average load of 412.0 kN. Andesite exhibited a more variable strength, fluctuating between 41.4 MPa and 90.4 MPa, which classifies it as moderately resistant, with average applied loads reaching up to 250.0 kN. Finally, the metamorphic rock chert had an average compressive strength of 80.1 MPa, with an average load of 251.7 kN, reflecting moderate strength compared to igneous rocks.
In this case, igneous rocks, especially basalt and diorite/granite, are suitable for structural applications in hydropower projects. At the same time, andesite and chert exhibit lower strengths, suggesting the need to consider their behaviour in the design of geotechnical infrastructures, thereby ensuring the stability and viability of projects in the areas above.
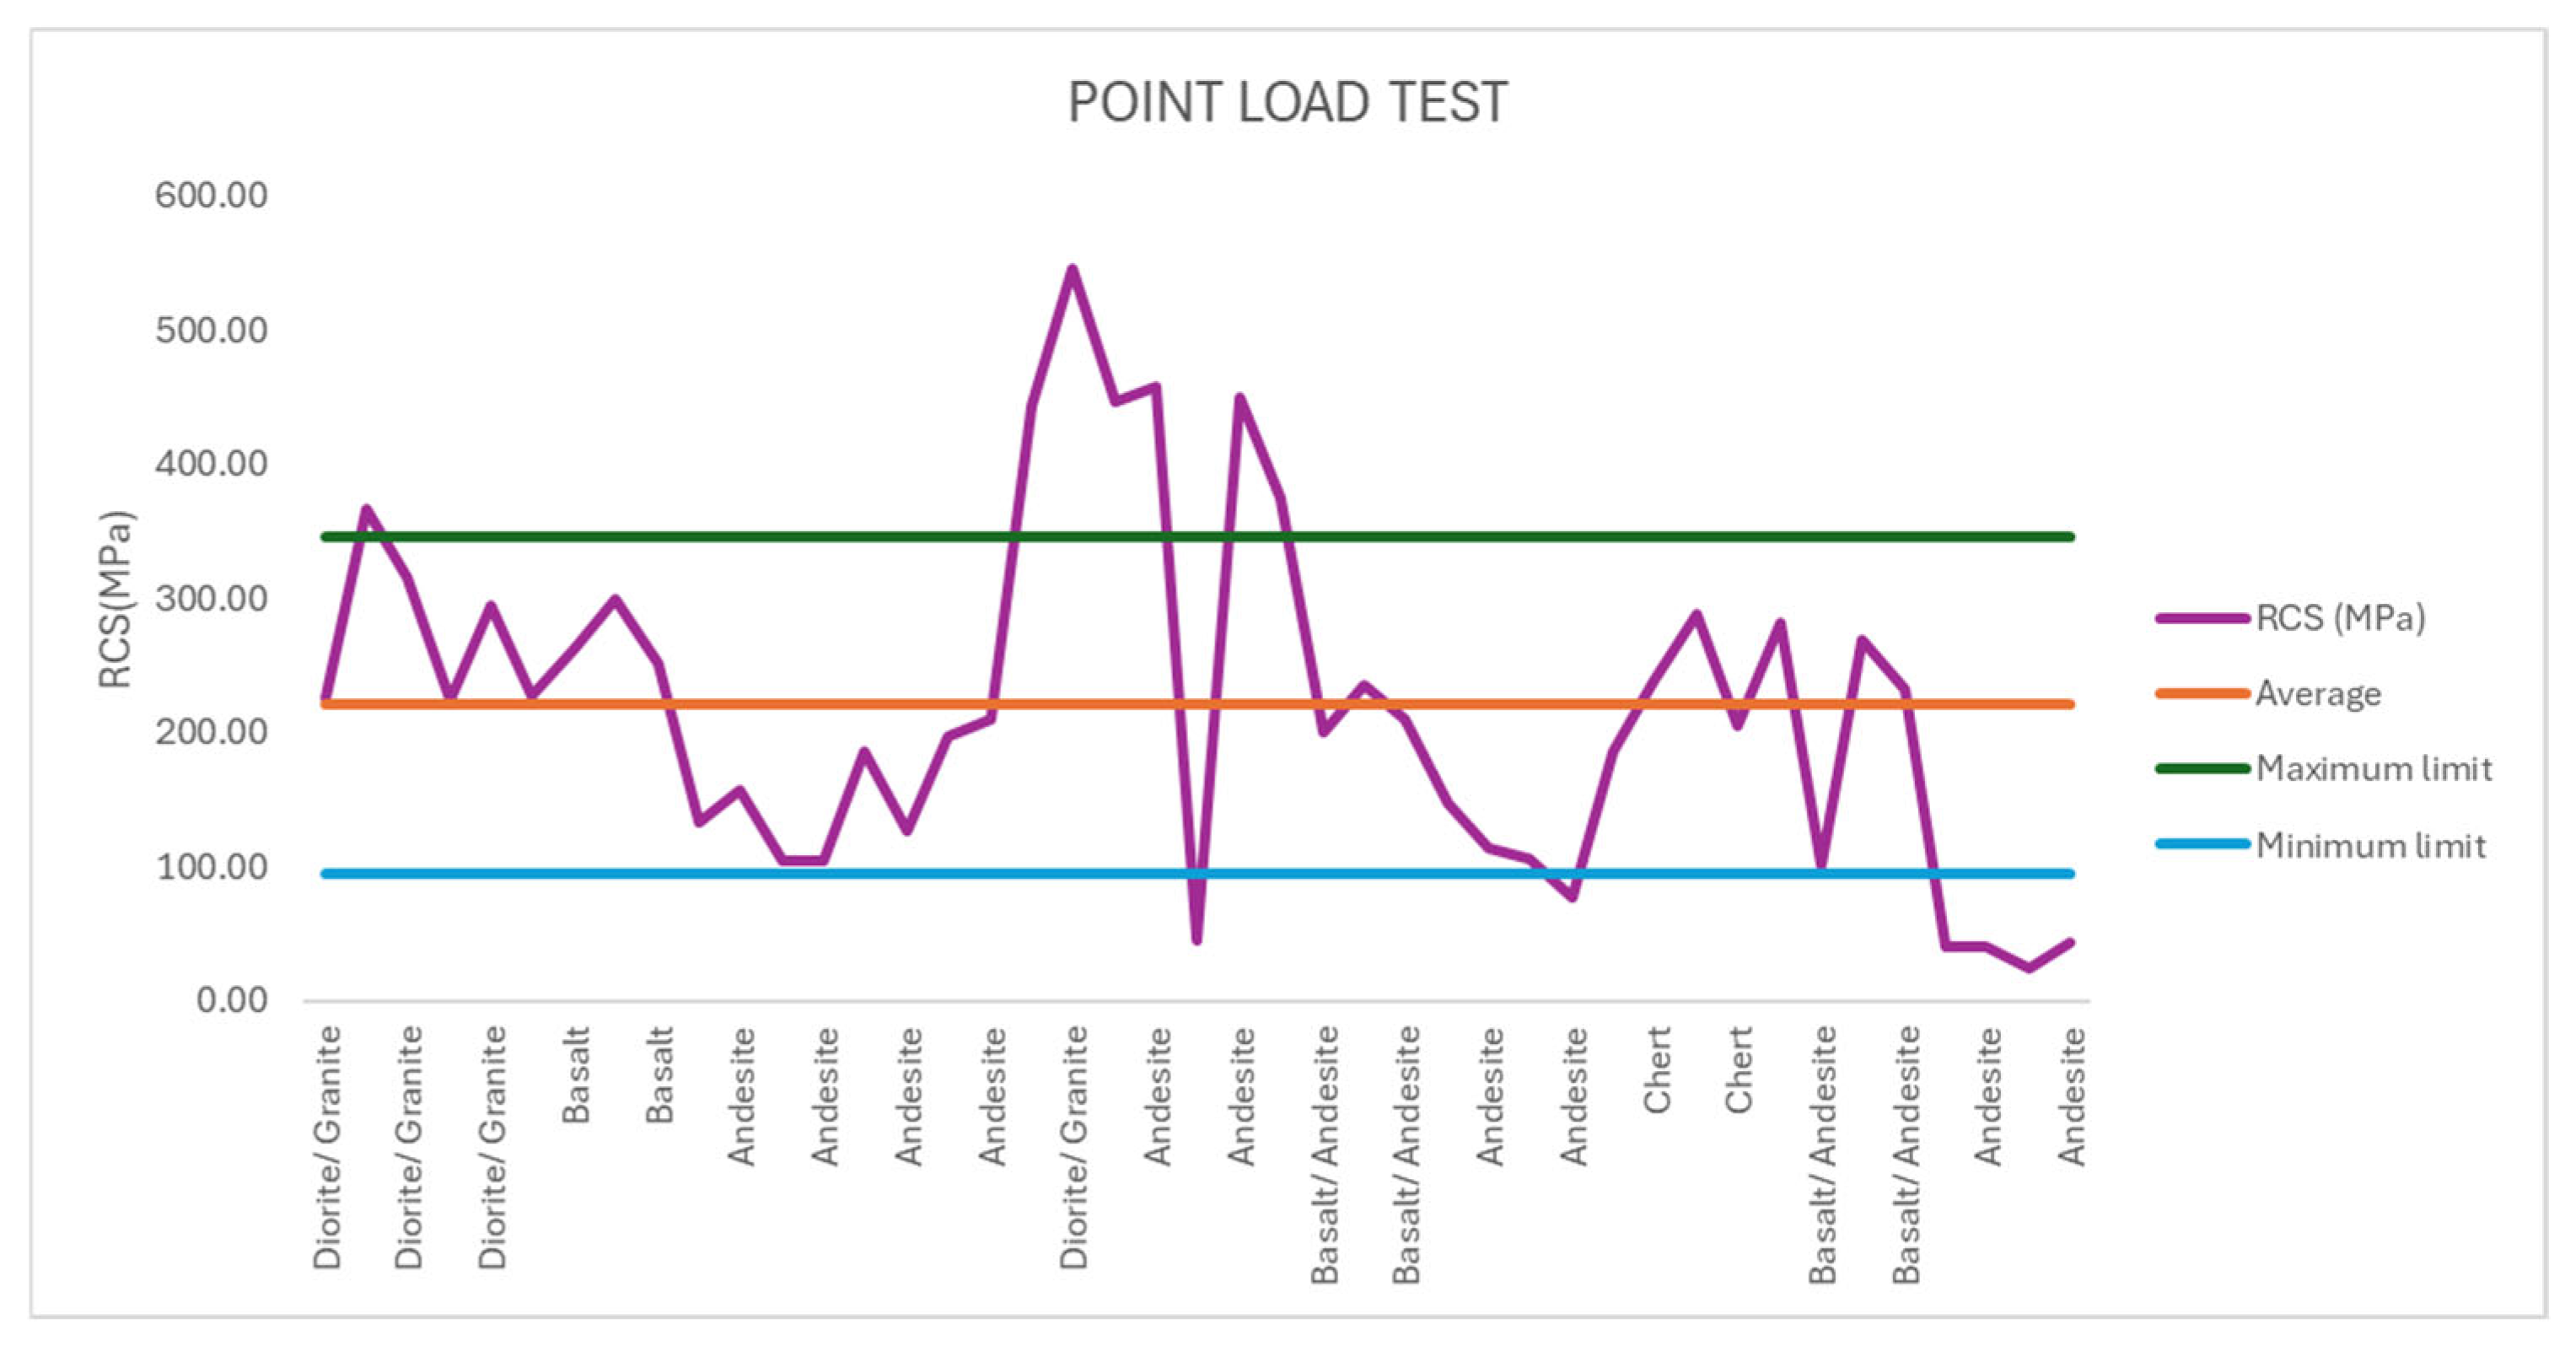
Figure 8 shows the variation in RCS values (in MPa) per sample, according to the rock type and its lithological subgroup. The purple line represents the individual values obtained for each sample. Additionally, three reference lines are indicated: the overall average RCS (75.25 MPa), the maximum limit (110.46 MPa), and the minimum limit (40.03 MPa).
The results show a wide dispersion of values, with some significantly exceeding the maximum limit (notably in the diorite/granite and basalt samples). In contrast, others fall below the minimum limit, particularly in the andesite samples at greater depths. These variations reflect the rock mass’s heterogeneity and the rock type’s influence on mechanical strength.

3.4. Brazilian Indirect Traction

The indirect tensile test, known as the Brazilian test, was conducted to assess the tensile strength of various lithologies in the study areas “El Rosario” and “Santa Rosa”. The results obtained are described below (Table 6). For diorite/granite, which is an intrusive igneous rock, an average load of 30.5 kN was recorded, with a standard deviation of 4.3 kN. The average stress obtained was 10.9 kPa, with a standard deviation of 1.2 kPa, indicating an average tensile strength. In the case of basalt, a volcanic igneous rock, a significantly higher average load was observed, reaching 57.3 kN, with a standard deviation of 13.9 kN. The average stress was 21.7 kPa, with a standard deviation of 4.8 kPa, suggesting a high tensile strength. Andesite, also a volcanic igneous rock, exhibited an average load of 31.3 kN, with a standard deviation of 6.2 kN. Its average stress was 10.5 kPa, with a standard deviation of 2.02 kPa, reflecting a lower tensile strength than basalt. Chert, a metamorphic rock, recorded an average load of 34.8 kN, with a standard deviation of 12.3 kN. Its average stress was 11.8 kPa, with a standard deviation of 4.91 kPa, indicating a moderate tensile strength. The results of the Brazilian test show that basalt had the highest tensile strength, followed by chert, diorite/granite, and, finally, andesite, which had the lowest stress values.
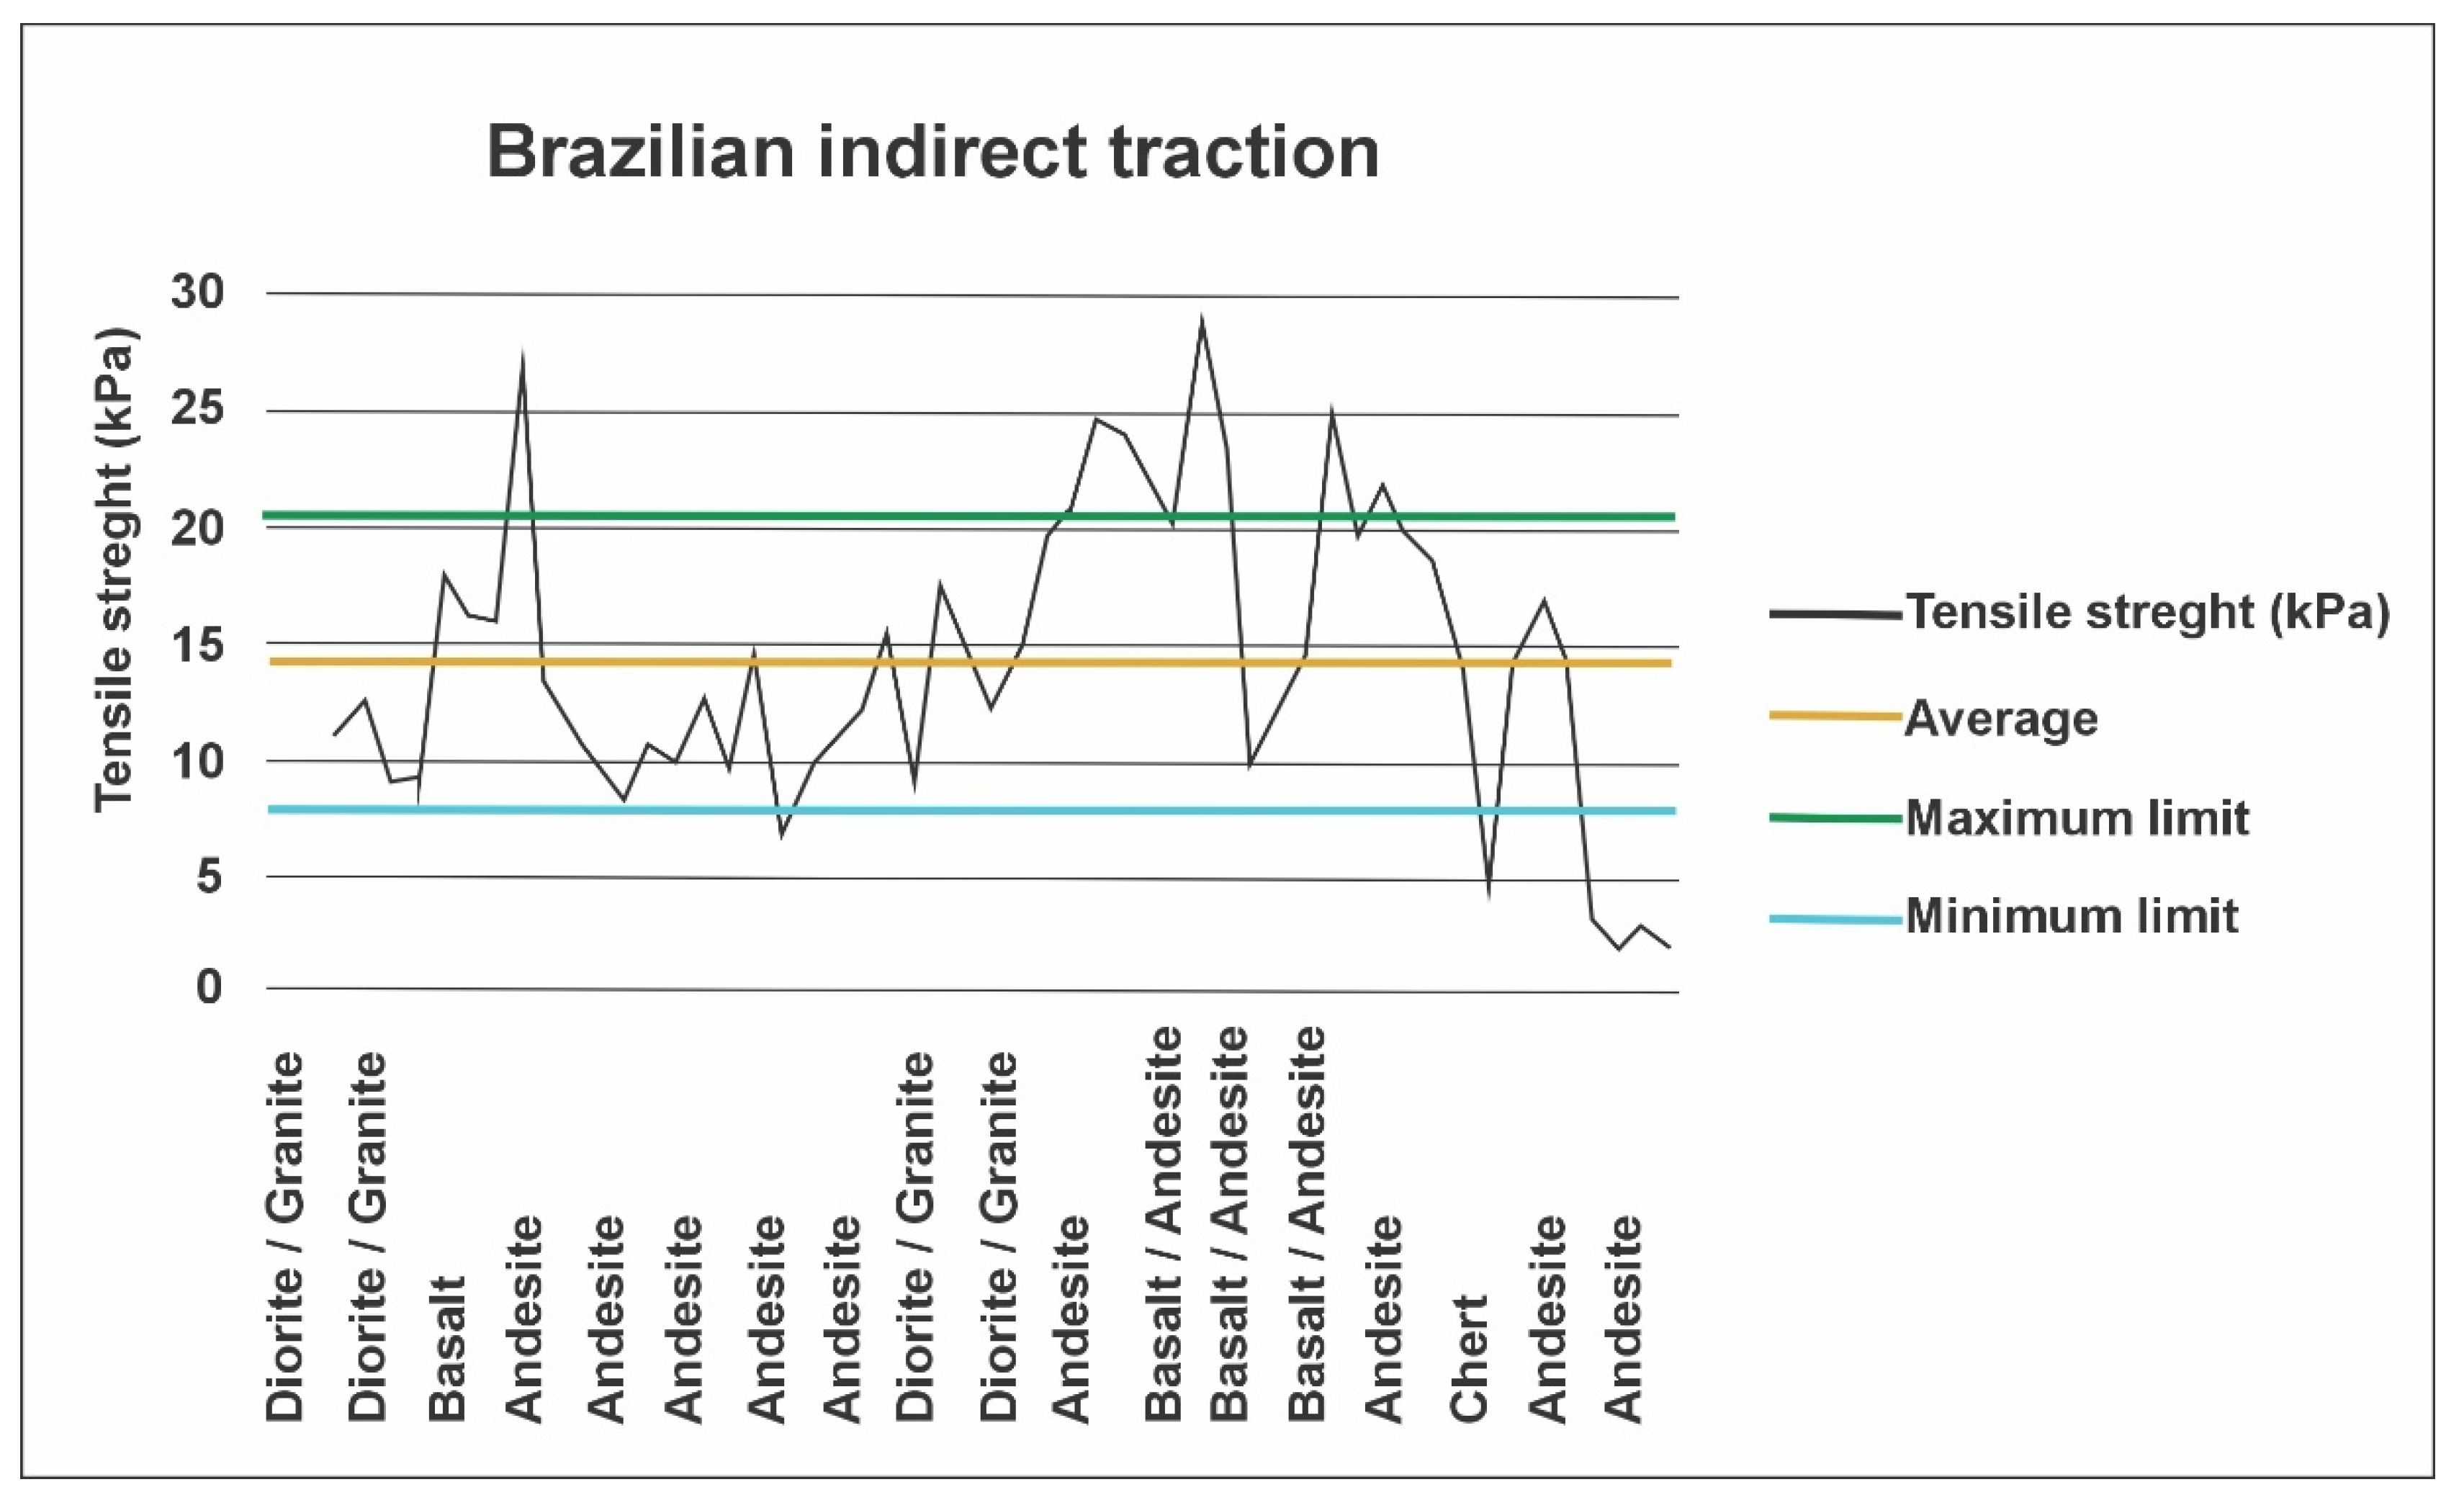
Figure 9 shows the indirect tensile strength of different lithologies, highlighting the considerable variability between samples. Basalt exhibited the highest values, in several cases exceeding the upper limit of 20.50 kPa, indicating its strong mechanical capacity. In contrast, chert showed the lowest values, falling below the minimum limit of 7.84 kPa, reflecting its brittleness. Andesite and diorite/granite displayed intermediate behaviour, with results mostly falling within the acceptable range. Overall, lithology significantly influences strength, making it a key factor in geotechnical analysis.

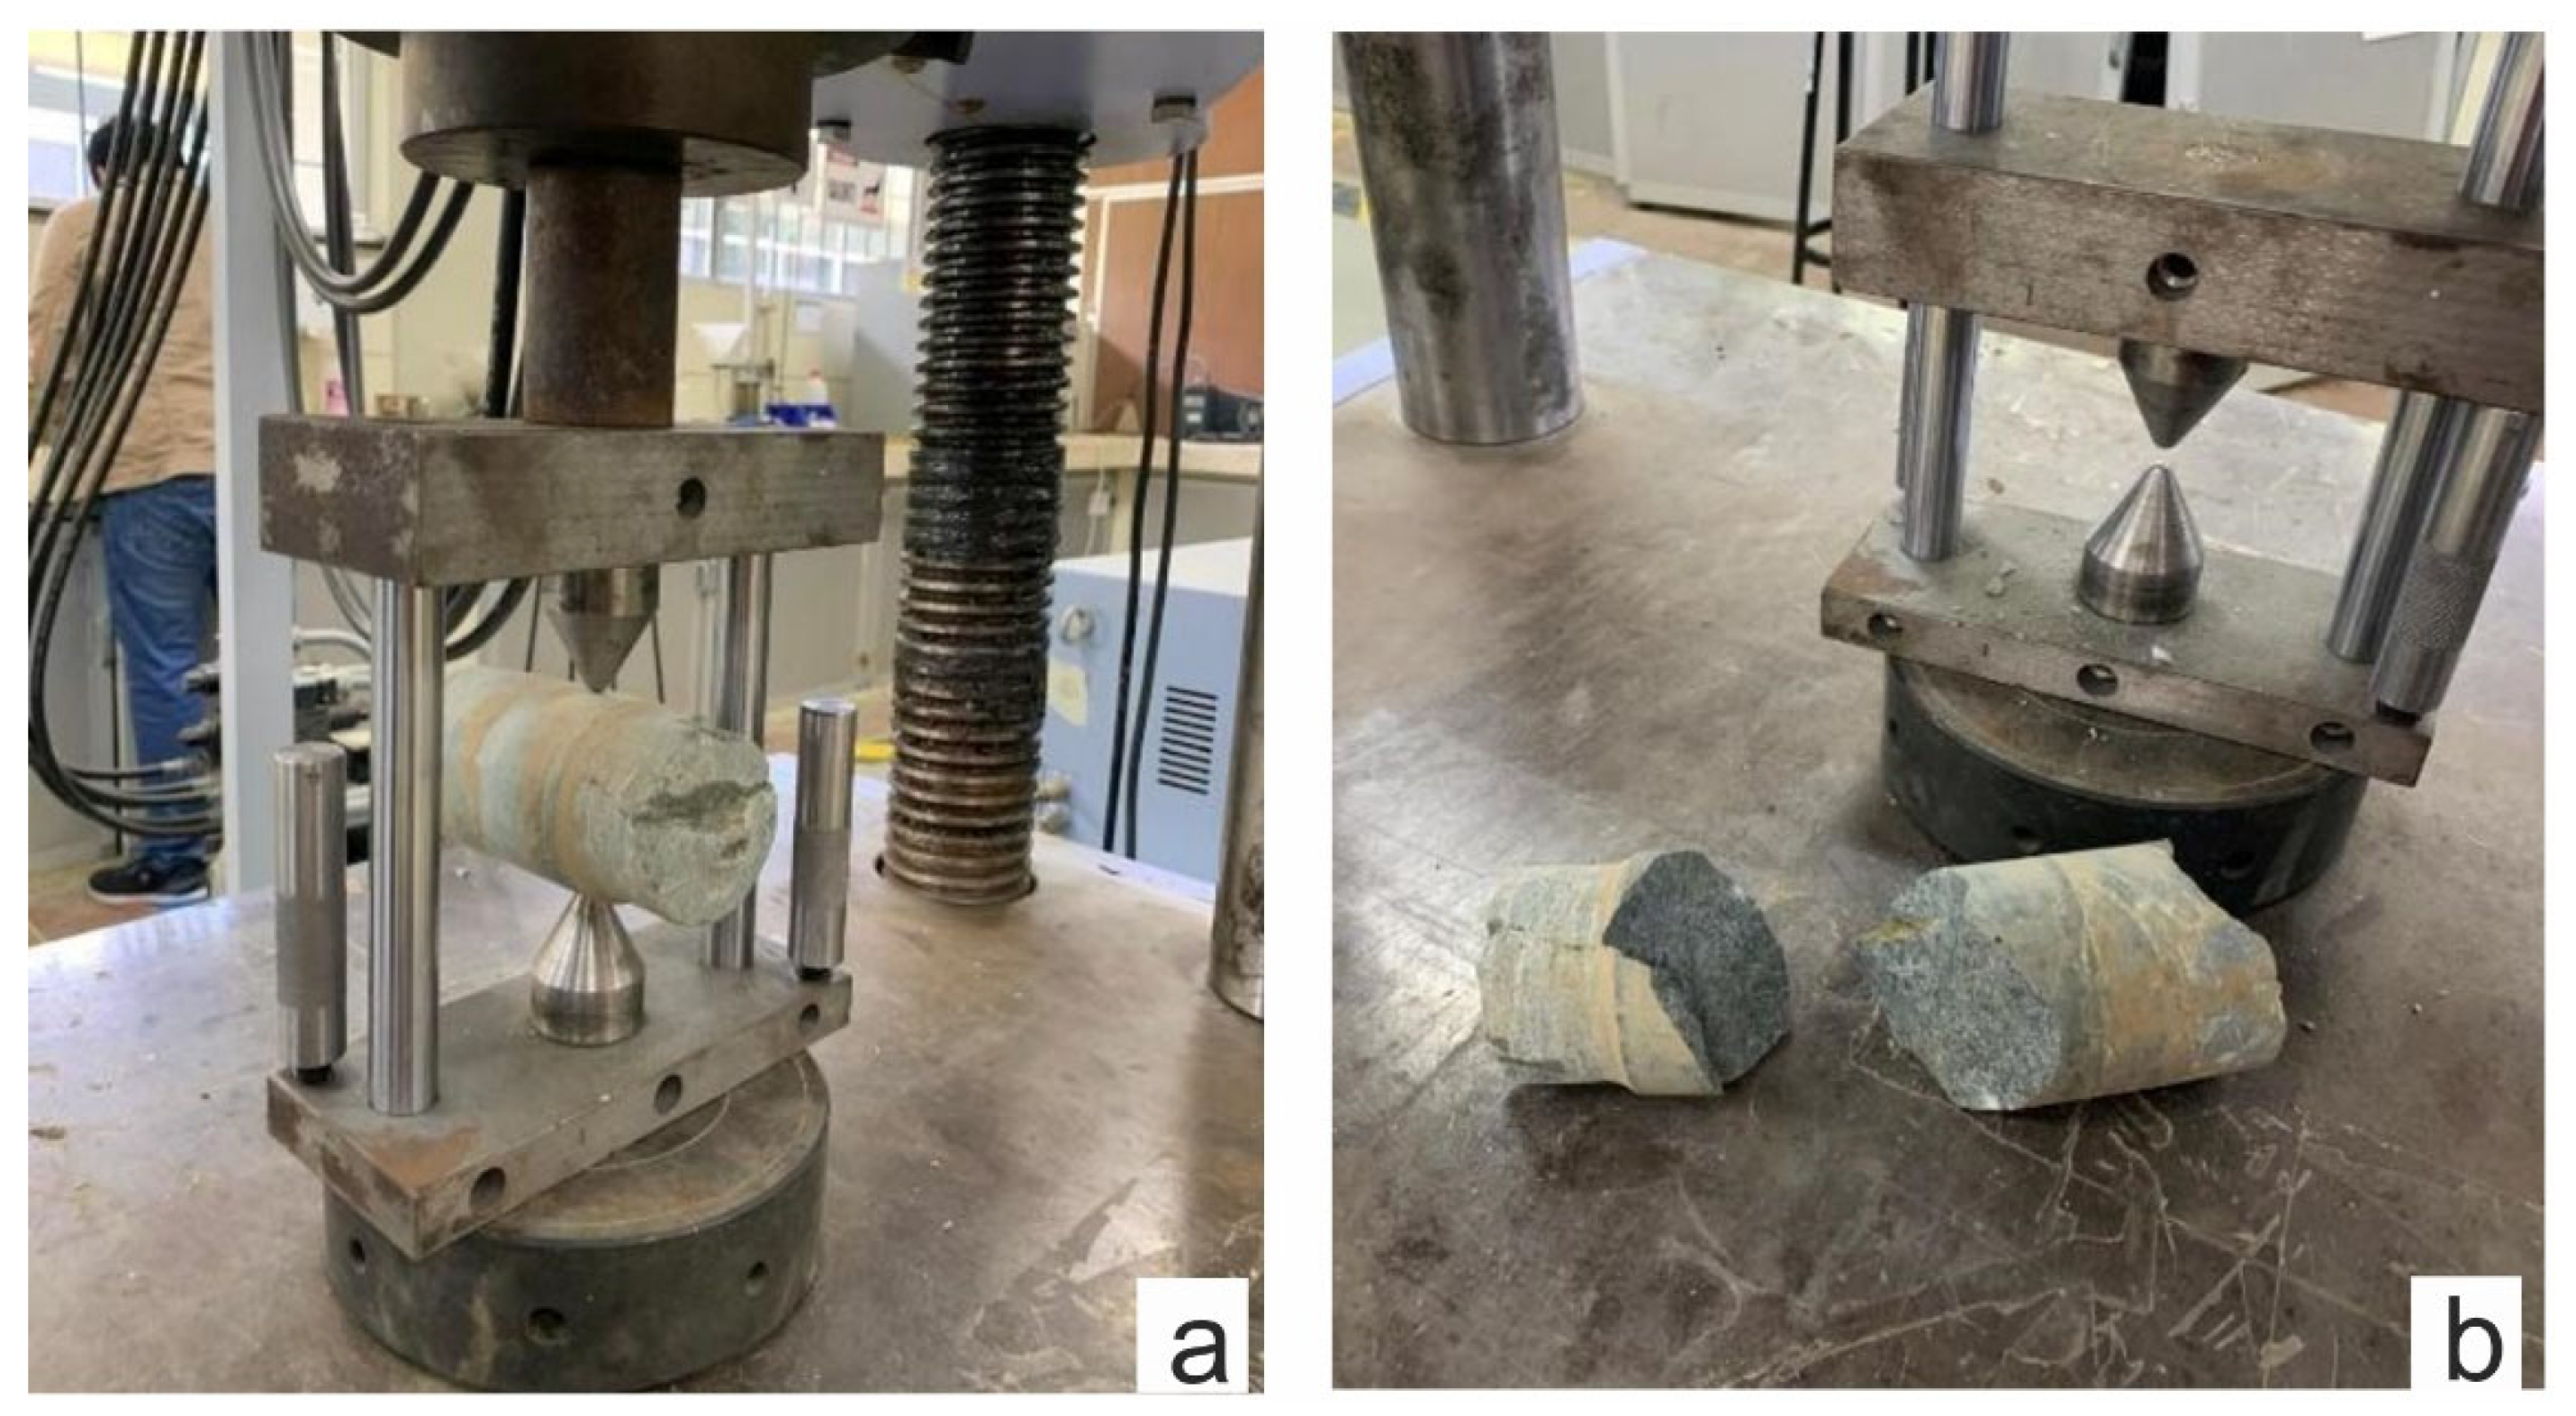
3.5. Point Load Test (PLT)

The point load test was conducted on various rock samples to determine their compressive strength. The results (Table 7) are expressed in terms of Is (point load strength) in megapascals (MPa) and the corrected strength Is(50) at a standard load of 50 mm. For the diorite/granite samples, two depths were recorded in borehole S-SE-01. At a depth of 5.30 m, the Is value was 9.2 MPa, with a correction factor of 1.11, resulting in a corrected strength Is(50) of 225.2 MPa. At 6.20 m, an increase in strength was observed, with Is reaching 18.1 MPa and Is(50) attaining 443.3 MPa. For basalt, also in borehole S-SE-01, two depths were recorded. At 7.60 m, the Is value was 10.75 MPa, which, with the same correction factor of 1.1, resulted in an Is(50) of 263.3 MPa. At 8.00 m, the Is value increased to 11.0 MPa, yielding an Is(50) of 300.1 MPa. Regarding andesite, in borehole S-SE-02, at a depth of 5.30 m, the Is value was 4.2 MPa, with a corresponding Is(50) of 103.64 MPa, using the same correction factor. At 10.50 m, the Is value increased to 11.52 MPa, resulting in an Is(50) of 285.2 MPa. For chert, in borehole S-SE-02, at a depth of 15.20 m, an Is value of 9.7 MPa was recorded, which, with the correction factor of 1.11, resulted in an Is(50) of 238.4 MPa. The diorite/granite samples exhibited high compressive strength, with Is values ranging between 9.19 MPa and 18.10 MPa, and corrected strengths reaching up to 443.3 MPa. Basalt also demonstrated a good load-bearing capacity, with Is values of between 10.7 MPa and 11.0 MPa. Andesite showed Is values of 4.2 MPa to 11.5 MPa, indicating moderate strength. Chert exhibited relatively lower strength than the igneous rocks, with an Is of 9.7 MPa.
These results highlight variations in the compressive strength of the different lithologies analysed, providing valuable information for the geotechnical assessment of the rocks in the study areas.
Figure 10 shows values for various rock samples, compared with the maximum (346.25 MPa), minimum (94.98 MPa), and average (220.62 MPa) limits. Some samples, especially diorite/granite and andesite, exceeded the maximum limit, while others, mostly andesite, were below the minimum.

3.6. Tilt Test

The tilt test results table (Table 8) presents the basic friction angle (φb°) obtained for various rock samples, with measurements taken at six different inclinations for each sample (1 to 6) and the final average for each case.
  • Intrusive Igneous (Diorite/Granite):
    • The friction angles ranged between 32° and 36°, with an average of 33.4°.
    • This rock exhibited a relatively high basic friction, indicating good stability under inclined conditions.
  • Volcanic Igneous (Basalt):
    • The friction angles ranged from 30° to 33°, with an average of 31.7°.
    • Although the friction was slightly lower than that of diorite/granite, it remained stable for structural applications.
  • Andesite:
    • In the first sample (26.90–28.50 m), the friction values ranged from 26° to 32°, with an average of 30.4°.
    • In the second sample (24.00–26.00 m), the friction angle remained constant at 35°, indicating good stability.
    • In the third sample (28.00–30.00 m), friction was also constant at 35°.
  • Metamorphic Rock (Chert):
    • Friction values ranged from 29° to 34°, with an average of 31.1°.
    • This rock exhibited moderate friction, suggesting reasonable but not exceptional stability.
The most critical value corresponds to the diorite/granite sample (S-SR-01, 5.00–6.20 m), where the friction angle dropped to 13–21°, with an average of 18.6°, and a minimum value of as low as 13°. This result suggests that the rock has low frictional resistance, which could lead to potential stability issues.

4. Discussion

The results obtained in this study allow for the interpretation of the geomechanical properties of the rocks in the El Rosario and Santa Rosa areas, providing key information to assess the quality of the rock mass and its behaviour under different geotechnical conditions. The most relevant results are discussed below.

4.1. Persistence of Discontinuities

In Table 4, a persistence value of 0 (continuity greater than 20 m) was assigned to all samples as a conservative measure, given the lack of precise data on the actual extent of the discontinuities. This decision follows the recommendations of Bieniawski (1989), who suggests that, in the absence of detailed information, it is preferable to avoid overestimating the quality of the rock mass [15]. Persistence is a key factor in RMR classification, as a greater continuity of fractures can significantly reduce the overall strength of the rock mass. This conservative approach ensures a more realistic assessment and facilitates the design of appropriate support measures for potentially unfavourable conditions.

4.2. Tensile Strength

Table 9 presents the average values and standard deviations of the tensile strength obtained through the Brazilian test. Below is a simplified summary:
The results indicate that basalt exhibited the highest tensile strength, which aligns with its classification as a strong rock. In contrast, andesite and chert showed lower values, representing moderate strength. When compared to previous studies, such as those by Hoek and Brown [24], who reported tensile strengths for basalts ranging between 15 and 25 kPa and for granites between 10 and 15 kPa, the values obtained in this study are consistent with the expected ranges. This reinforces the reliability of the tests conducted.

4.3. Basic Friction Angle

Barton and Choubey (1977) established typical ranges for the basic friction angle (ϕb) in different rock types, depending on roughness and discontinuity characteristics [25]. The most common values are:
  • Igneous rocks (granites, basalts, andesites): 30–40°.
  • These rocks have rougher surfaces and greater shear strength, which explains their high friction angles.
  • Metamorphic rocks (schists, chert): 25–35°.
  • In these rocks, the roughness of the discontinuities is moderate, which slightly reduces the friction angle.
  • Sedimentary rocks (sandstones, limestones): 20–30°.
  • These rocks typically have smoother and less resistant discontinuities, leading to lower basic friction angles.

4.4. Comparison with Study Results

In this study, the basic friction angle values obtained (Table 8) ranged from 18.58° (diorite/granite in Santa Rosa) to 38.35° (andesite in Santa Rosa). When compared with the typical ranges:
  • The values for basalt (31.7°) and andesite (30.4–38.3°) fell within the expected range for igneous rocks (30–40°), indicating favourable shear strength conditions.
  • However, the lowest value obtained for diorite/granite (18.58°) fell below the typical range for igneous rocks. This could be attributed to highly polished discontinuity surfaces or unfavourable local conditions, reducing shear strength.
Generally, higher basic friction angle values (such as those for basalt and andesite) suggest better stability conditions for slopes and underground structures. In contrast, lower values (such as those in diorite/granite) may indicate that additional support measures are required.

4.5. Implications for Hydroelectric Projects and Future Research

Considering these findings, it can be concluded that the geomechanical characterisation conducted is essential for planning hydroelectric projects in the region. In this study, we focused mainly on rock mass classifications and an empirical approach to the rock mass evaluation; however, if more data about temperature and deep conditions are available, it is recommended to carry out a study on seepage of the rock mass, as stated by Qiu et al. [26], as well as mixed-mode fracturing in the rock for future works [27]. The data on the compressive and tensile strength of different lithologies and the basic friction angle are crucial for assessing the feasibility of constructing infrastructures such as dams and powerhouse facilities in the El Rosario and Santa Rosa areas. The high UCS of basalt (exceeding 120 MPa) and diorite/granite (ranging between 89.38 MPa and 125.80 MPa) suggests that these rock types support the structural loads associated with the dam. Additionally, the relatively high basic friction angle observed in these lithologies indicates favourable stability conditions for slopes and underground structures, which are critical for ensuring the safe construction of dams.
However, areas where weaker rock types, such as andesite and chert, have been identified must be given attention. These may require more careful engineering design and additional support measures. Overall, the results of this study provide a robust foundation for the planning and design of hydroelectric projects in Morona Santiago, ensuring their technical and geotechnical feasibility.
Based on Bieniawski’s approach (1989) [15], the conservative assignment of discontinuity persistence ensures a cautious assessment of the rock mass but may lead to overly conservative and costly designs. To reduce this uncertainty, it is recommended that additional studies be conducted, such as advanced geological mapping using laser scanners or digital photogrammetry, along with in situ tests, to measure the actual extent of discontinuities more accurately. These measures would optimise geotechnical designs, balancing safety and cost-effectiveness in future projects.
This study characterised the geomechanical properties of the rock masses in Santa Rosa and El Rosario, revealing that igneous rocks such as basalt and diorite/granite exhibited high compressive strength, making them suitable for hydroelectric projects. These rocks’ uniaxial compressive strength (UCS) ranged between 89.38 MPa and 125.80 MPa, with basalt exceeding 120 MPa. The data obtained are crucial for assessing the technical and geotechnical feasibility of the proposed infrastructure, ensuring its long-term stability. The basic friction angles also indicate favourable stability characteristics in the igneous rocks. However, some diorite/granite samples exhibited lower values, suggesting that additional support measures may be required to enhance structural integrity.

5. Conclusions

This study identifies key gaps in the literature regarding the geomechanical properties of rock masses in Ecuador, particularly in the Santa Rosa and El Rosario regions. The research objectives aim to assess these rocks’ compressive strength and stability characteristics, focusing on their potential for use in infrastructure development. The methodology involved detailed geotechnical testing on borehole samples, including uniaxial compressive strength (UCS) tests and friction angle measurements. These experimental settings provided a deeper understanding of the mechanical properties of the basalt and diorite/granite rock masses, enabling a more accurate evaluation of their feasibility for hydroelectric projects.
The findings of this study can be summarised as follows:
  • The geomechanical analysis of the rock samples from the El Rosario region, including diorite/granite and basalt, reveals a varied but generally favourable profile for hydroelectric projects. The RMR and Q index values further highlight the suitability of these rocks for structural applications. However, specific diorite/granite samples may need further assessment due to their lower joint persistence and roughness ratings.
  • The RMR and Q index values suggest that, despite some variability in rock properties, the rock masses from Santa Rosa are generally suitable for construction projects, with the potential for further engineering evaluation in specific areas to ensure long-term stability. These findings contribute valuable data for the geotechnical assessment of the region, aiding in the planning and design of future infrastructure projects.
  • Igneous rocks such as basalt and diorite/granite exhibit high compressive strength, with UCS values ranging from 89.4 MPa to 125.8 MPa, and basalts often exceeding 120 MPa.
  • These rocks show favourable stability characteristics, with basic friction angles suggesting a suitable foundation for hydroelectric projects.
  • However, some diorite/granite samples exhibit lower values, suggesting additional support measures may be required to enhance structural integrity.
This research contributes to the database of geomechanical parameters for basalts, andesites, and granites in Ecuador and the Andean region based on borehole data. These data better reflect the rock mass behaviour before excavation, which is frequently characterised, at least in the scientific literature, by slopes, excavations, and outcrops, rather than by depth data from geotechnical boreholes, as in this case.

Author Contributions

Conceptualization, W.D.B.M., A.Z.T.Y., M.M. and L.J.-B.; methodology, W.D.B.M., A.Z.T.Y., M.M. and L.J.-B.; software, W.D.B.M., A.Z.T.Y., M.M. and L.J.-B.; validation, W.D.B.M., A.Z.T.Y., M.M. and L.J.-B.; formal analysis, W.D.B.M. and A.Z.T.Y.; investigation, W.D.B.M. and A.Z.T.Y.; resources, M.M. and L.J.-B.; data curation, W.D.B.M. and A.Z.T.Y.; writing—original draft preparation, W.D.B.M., A.Z.T.Y., M.M. and L.J.-B.; writing—review and editing, W.D.B.M., A.Z.T.Y., M.M. and L.J.-B.; supervision, M.M. and L.J.-B.; project administration, M.M. and L.J.-B.; funding acquisition M.M. and L.J.-B. All authors have read and agreed to the published version of the manuscript.

Funding

This research received no external funding.

Data Availability Statement

Data can be request by email.

Conflicts of Interest

The authors declare no conflicts of interest regarding this study. No personal, financial, or institutional interests have influenced the design, execution, interpretation, or reporting of the research findings. Furthermore, the funding entities played no role in the study design, data collection, analysis, or interpretation, nor in the preparation of the manuscript or the decision to publish the results.

References

  1. Balance-Energetico-Nacional-2020-Web.pdf. Available online: https://www.ambiente.gob.ec/wp-content/uploads/downloads/2021/09/Balance-Energetico-Nacional-2020-Web.pdf (accessed on 17 February 2025).
  2. Vélez Pizarro, A.M.; Marquinez Viscaíno, J.F.; Vega Jaramillo, F.Y.; Vega Granda, A.D.C. Sustainable development of Ecuador through the advancement of Non-Conventional Renewable Energy Sources. RECIMUNDO 2024, 8, 103–113. [Google Scholar] [CrossRef]
  3. Fundamentals of Rock Mechanics. Available online: https://www.mdl2179trialdocs.com/releases/release201310081140006/TREX-144580.pdf (accessed on 17 February 2025).
  4. Comprendre et Interpréter la Délégation, une Application aux Objets Morcelés. ResearchGate. Available online: https://www.researchgate.net/publication/265623773_Comprendre_et_interpr_eter_la_d_el_egation_une_application_aux_objets_morcel_es (accessed on 17 February 2025).
  5. Hoek, E. Practical Rock Engineering; Rocscience: Toronto, ON, Canada, 2006; pp. 160–202. Available online: https://www.rocscience.com/assets/resources/learning/hoek/Practical-Rock-Engineering-Full-Text.pdf (accessed on 12 February 2025).
  6. Phillips, J.D. Landscape evolution space and the relative importance of geomorphic processes and controls. Geomorphology 2009, 109, 79–85. [Google Scholar] [CrossRef]
  7. Case Study 4—Study of the Santiago and Mira River Basins, Ecuador. Available online: https://www.oas.org/usde//publications/Unit/oea72s/ch20.htm#TopOfPage (accessed on 17 February 2025).
  8. Roberts, D.G.; Bally, A.W. Regional Geology and Tectonics: Principles of Geologic Analysis; Roberts, D.G., Bally, A.W., Eds.; Elsevier: Oxford, UK, 2012; Volume 1A, pp. 120–130. [Google Scholar] [CrossRef]
  9. BGS-INEMIN. Primer Informe Anual Cordillera Real SP, 1st ed.; BGS-INEMIN: Quito, Ecuador, 1987; pp. 1–20. Available online: http://archive.org/details/1987-litherland-primer-informe-anual-cordillera-real-sp_202111 (accessed on 17 February 2025).
  10. Sinclair, J.H. Geology of the Eastern Region of Ecuador. Rev. An. 1928, 40, 113–151. [Google Scholar]
  11. Cabrera Pazmiño, A.I.; Cunduri Morocho, J.V. Characterisation of the Conglomerate of the Tiyuyacu Formation in the Oriental Basin of Ecuador in Blocks 7 and 18 for the Adequate Selection of Drill Bits in the 12 1/4” Section. Bachelor’s Dissertation, Central University of Ecuador, Quito, Ecuador, December 2012. [Google Scholar]
  12. Núñez Mantilla, C.N. Quaternary Geology and Tectonic Geomorphology Between Villadora and Bellavista, Guayllabamba River. Bachelor’s Thesis, Escuela Politécnica Nacional, Quito, Ecuador, 2011. Available online: https://www.researchgate.net/publication/277891488_Geologia_del_Cuaternario_y_Geomorfologia_Tectonica_entre_Villadora_y_Bellavista_Rio_Guayllabamba (accessed on 14 February 2025).
  13. Santi Malnis, P.; Colombi, C.E.; Rodríguez-Posatini, N.G.; Rothis, L.M.; Limarino, C.O. Sedimentological Characterisation of an Arid Climate Distributary Fluvial System: Papagayos Stream in the Eastern Foothills of the La Huerta-Imanas, San Juan, Argentina. Andean Geol. 2018, 45, 186. [Google Scholar] [CrossRef]
  14. Ochoa, M.P. Study of Slope Inclinations in Coluvial-Formed Hillsides in the Negro River Basin, Morona Santiago, Ecuador. Rev. Cient. GeoLatitud 2023, 6. Available online: https://geolatitud.geoenergia.gob.ec/ojs/ojs/index.php/GeoLatitud/article/view/143 (accessed on 17 February 2025).
  15. Bieniawski, Z.T. Engineering Rock Mass Classifications: A Complete Manual for Engineers and Geologists in Mining, Civil, and Petroleum Engineering; John Wiley & Sons: Hoboken, NJ, USA, 1989. [Google Scholar]
  16. Geomechanical Classification of Rock Masses: RMR (Bieniawski), Q (Barton) and GSI (Hoek)—Comparison, Limitations, and Applications. Available online: https://www.centrogeotecnico.com/blog-geotecnia-geomecanica/clasificacion-geomecanica-de-macizos-rocosos-rmr-bieniawski-q-barton-y-gsi-hoek-comparacion-limitaciones-y-aplicaciones.html (accessed on 17 February 2025).
  17. Barton, N.R.; Lien, R.; Lunde, J. Engineering Classification of Rock Masses for the Design of Tunnel Support. Rock Mech. Rock Eng. 1974, 6, 189–236. Available online: https://www.researchgate.net/publication/226039636_Engineering_Classification_of_Rock_Masses_for_the_Design_of_Tunnel_Support (accessed on 17 February 2025). [CrossRef]
  18. Standard Test Method for Compressive Strength and Elastic Moduli of Intact Rock Core Specimens Under Varying States of Stress and Temperatures. Available online: https://www.astm.org/d7012-04.html (accessed on 17 February 2025).
  19. Standard Test Method for Splitting Tensile Strength of Intact Rock Core Specimens. Available online: https://www.astm.org/d3967-95a.html (accessed on 17 February 2025).
  20. Standard Test Method for Measuring the Angle of Repose of Free-Flowing Mold Powders (Withdrawn 2005). Available online: https://www.astm.org/c1444-00.html (accessed on 17 February 2025).
  21. Standard Test Methods for Compressive Strength and Elastic Moduli of Intact Rock Core Specimens under Varying States of Stress and Temperatures. Available online: https://www.astm.org/d7012-14.html (accessed on 17 February 2025).
  22. Standard Test Method for Splitting Tensile Strength of Intact Rock Core Specimens. Available online: https://www.astm.org/d3967-16.html (accessed on 17 February 2025).
  23. Standard Test Method for Determination of the Point Load Strength Index of Rock and Application to Rock Strength Classifications. Available online: https://www.astm.org/d5731-16.html (accessed on 17 February 2025).
  24. Brown, E.; Hoek, E. Underground Excavations in Rock, 3rd ed.; CRC Press: London, UK, 1980; pp. 147–189. [Google Scholar] [CrossRef]
  25. Barton, N.; Choubey, V. The shear strength of rock joints in theory and practice. Rock Mech. 1977, 10, 1–54. [Google Scholar] [CrossRef]
  26. Qiu, H.; Zhu, S.; Fang, H.; Lu, X. Study of Seepage Laws of Deep Rock Mass Under Different Water Temperatures Based on Porous Media. Water 2025, 17, 357. [Google Scholar] [CrossRef]
  27. Lu, X.; Yan, G. A Quasi-2D exploration of mixed-mode fracture propagation in concrete semi-circular chevron-notched disks. Buildings 2023, 13, 2633. [Google Scholar] [CrossRef]
Figure 1. Location of “El Rosario” and “Santa Rosa”.
Geotechnics 05 00032 g001
Figure 2. Local geology of “El Rosario” and “Santa Rosa” (source: zonal geological map prepared by Ecoener SA).
Geotechnics 05 00032 g002
Figure 3. Geotechnical exploration campaign and field sampling: (a) drilling on site using the wire-line system; (b) HQ pipe with a diameter of 96.1 mm; (c) detailed on-site logging of the borehole; (d) storage and documentation of field samples for transportation to the laboratory.
Geotechnics 05 00032 g003
Figure 4. Uniaxial compression test: Rock samples tested for uniaxial compression from Santa Rosa and El Rosario.
Geotechnics 05 00032 g004
Figure 5. Indirect tensile test or Brazilian test. (a) S-SR-02 cores, a set of cylindrical rock specimens, are shown, all previously tested using the Brazilian method. Each sample has visible fractures that cross from edge to edge, typical of diametrically induced tensile breakage. Fractures are generally vertical and rectilinear, indicating correct load application and controlled breakage. (b) Apparatus for the Brazilian indirect tensile test supplied to the rock and research laboratory ESPOL. A rock cylinder is placed horizontally between two flat metal plates that apply diametrical loading. The sample is labelled with the letter “D”. This mounting induces tensile stresses along the vertical plane of the specimen and is used to estimate the indirect tensile strength of the rock.
Geotechnics 05 00032 g005
Figure 6. Point load test. (a) Laboratory test using a compression machine equipped with a steel conical tip. The cylindrical rock specimen is positioned vertically between the metal plates of the equipment, right in the centre under the conical tip. (b) Result after the point load test. The cylindrical core of rock has been fractured into two halves by the action of the conical tip.
Geotechnics 05 00032 g006
Figure 7. Tilt test. (a) Samples marked to alternate the contact faces between the rocks; (b) inclination of the equipment during the execution of the test.
Geotechnics 05 00032 g007
Figure 8. Results of the uniaxial compressive strength test for all rock specimens in this study.
Geotechnics 05 00032 g008
Figure 9. Results of Brazilian tensile strength for all rock specimens in this study.
Geotechnics 05 00032 g009
Figure 10. Results of the point load test for all rock specimens in this study.
Geotechnics 05 00032 g010
Table 1. Nomenclature and location of the boreholes.
ZoneBoreholeCoordinates UTM WGS-84
E (m)N (m)Z (msnm)
El RosarioS-SE-01760,762.339,636,116.761050.00
El RosarioS-SE-02760,853.099,636,114.671046.00
Santa RosaS-SR-01750,696.009,617,391.00900.00
Santa RosaS-SR-02750,710.009,617,374.00988.50
Table 2. Lithologies present at each location.
Zone BoreholeDepthLithology
Group Subgroup
El RosarioS-SE-011.70–2.00Intrusive igneousDiorite/granite
5.00–8.00
9.70–11.20
16.75–18.10Volcanic igneousBasalt
24.40–28.50Andesite
S-SE-0223.40–30.00Andesite
Santa RosaS-SR-015.00–6.20Diorite/granite
7.00–8.40Andesite
12.60–23.50Basalt/andesite
S-SR-0210.00–10.50Andesite
15.20–17.00Metamorphic rockChert
22.20–24.30Volcanic igneousBasalt/andesite
34.30–35.90Andesite
Table 3. Factors for obtaining the RMR and Q index in the El Rosario area.
ZONEBOREHOLELITHOLOGYSAMPLE DEPTH RMR PARAMETERS Q INDEX
1. STRENGTH OF SOUND ROCK (MPa)2. RQD RATING3. JOINT SEPARATION4.1 PERSISTENCE4.2 OPENING4.3 ROUGHNESS4.4 FILL4.5 ALTERATION5. PRESENCE OF WATERRMR Basic1. RQD—ROCK QUALITY DESIGNATION2. JN—JOINTING INDEX3. JR—DISCONTINUITY ROUGHNESS INDEX4. JA—DISCONTINUITY ALTERATION INDEX5. JW—WATER REDUCTION FACTOR IN DISCONTINUITIES6. SRF—STRESS REDUCTION FACTORQ INDEX
GROUPSUBGROUP4. JOINTS
EL ROSARIO S-SE-01Intrusive IgneousDiorite/granite5.301513001365043502211137.50
Intrusive IgneousDiorite/granite8.00158000000023351111314.00
Intrusive IgneousDiorite/granite8.90153500300026101514150.03
Intrusive IgneousDiorite/granite9.70153800303032201514150.07
Intrusive IgneousDiorite/granite11.2015201505566072901211596.00
Intrusive IgneousDiorite/granite12.50151380030304250414180.40
Volcanic IgneousBasalt17.351517100436506075221155.00
Volcanic IgneousBasalt18.101513100436505650221153.00
Volcanic IgneousBasalt19.00153800301030202014150.05
Volcanic IgneousBasalt22.00158100456576040321146.67
Volcanic IgneousAndesite24.40158801565105831421135.00
Volcanic IgneousAndesite26.00151310043651571643311326.00
Volcanic IgneousAndesite26.901520150436515839513113190.00
S-SE-02Volcanic IgneousAndesite23.401585015431051311528130.16
Volcanic IgneousAndesite24.40151310015451568613211310.20
Volcanic IgneousAndesite26.00158801345155935423131.50
Volcanic IgneousAndesite27.60158801365156132422132.00
Volcanic IgneousAndesite29.201513801345156452422133.20
Table 4. Factors for obtaining the RMR and Q index in the Santa Rosa area.
ZONEBOREHOLELITHOLOGYSAMPLE DEPTHRMR PARAMETERS Q INDEX
1. STRENGTH OF SOUND ROCK (MPa)2. RATING RQD3. JOINT SEPARATION4.1 PERSISTENCE4.2 OPENING4.3 ROUGHNESS4.4 FILL4.5 ALTERATION5. PRESENCIA DE AGUARMR Basic1. RQD—ROCK QUALITY DESIGNATION2. JN—JOINTING INDEX3. JR—DISCONTINUITY ROUGHNESS INDEX4. JA—DISCONTINUITY ALTERATION INDEX5. JW—WATER REDUCTION FACTOR IN DISCONTINUITIES6. SRF—STRESS REDUCTION FACTORQ INDEX
GROUPSUBGROUP4. JOINTS
SANTA ROSA S-SR-01Volcanic IgneousBasalt/andesite12.6073801366104416612130.44
Volcanic IgneousBasalt/andesite13.7012131001366106151321138.50
Volcanic IgneousBasalt/andesite14.70128801366105430421133.75
Volcanic IgneousBasalt/andesite15.60121310013661061634211310.50
Volcanic IgneousBasalt/andesite17.10735013631038181524130.15
Volcanic IgneousBasalt/andesite18.2043501343103310922130.28
Volcanic IgneousBasalt/andesite19.1012131001365106062322136.89
Volcanic IgneousBasalt/andesite20.40713801365105330422131.88
Volcanic IgneousBasalt/andesite21.4043501345103510322130.83
Volcanic IgneousBasalt/andesite21.7043501346103610322130.83
Volcanic IgneousBasalt/andesite22.00713801365105350422133.13
Volcanic IgneousBasalt/andesite23.5073801365104312622130.50
Volcanic IgneousBasalt/andesite24.8073401343103510922130.28
Volcanic IgneousBasalt/andesite25.7073401343103510922130.28
Volcanic IgneousBasalt/andesite26.8073401343103510922130.28
Volcanic IgneousBasalt/andesite27.70785013631043371223130.51
Volcanic IgneousBasalt/andesite28.7073401343103510922130.28
Volcanic IgneousBasalt/andesite29.8073401343103510922130.28
S-SR-02Volcanic IgneousBasalt/andesite20.2071310013651560734211312.17
Volcanic IgneousBasalt/andesite21.80435013651542131521130.58
Volcanic IgneousBasalt/andesite22.7078801365155339621134.33
Volcanic IgneousBasalt/andesite24.3043501365154210921130.74
Volcanic IgneousAndesite25.4043501365154210921130.74
Volcanic IgneousAndesite27.00435013631035101224130.14
Volcanic IgneousAndesite27.8023501361103110922130.37
Volcanic IgneousAndesite28.7043501363103510921130.74
Volcanic IgneousAndesite29.7048501365154733921132.44
Volcanic IgneousAndesite30.0043501365154210922130.37
Volcanic IgneousAndesite30.7043501365154210922130.37
Volcanic IgneousAndesite31.70235013631033101223130.19
Volcanic IgneousAndesite32.80413100136515577223137.78
Volcanic IgneousAndesite33.30413801363155351423132.83
Volcanic IgneousAndesite34.3048801365155041623131.52
Table 5. Average results and standard deviation of the unconfined compression test by lithology.
GroupSubgroupBoreholeDepth (m)LithologyAverage Load (kN)Standard Deviation Load (kN)Average UCS (MPa)Standard Deviation UCS (MPa)
Igneus rockIntrusiveS-SE-019.70–11.20Diorite/granite279.846.189.316.8
S-SR-015.00–6.20Diorite/granite393.039.1125.812.2
VolcanicS-SE-0116.75–17.35Basalt412.023.0131.77.7
S-SE-0126.90–28.50Andesite130.029.841.49.1
S-SE-0224.00–30.00Andesite138.138.745.513.8
S-SR-017.00–8.40Andesite341.053.0108.816.4
S-SR-0112.60–14.70Basalt/andesite292.431.490.410.2
S-SR-0210.00–10.50Andesite250.026.879.73.4
S-SR-0220.20–21.80Basalt/andesite264.951.584.817.9
S-SR-0234.30–35.90Andesite56.30.417.01.7
Metamorphic rockChertS-SR-0215.20–17.00Chert251.732.180.110.4
Table 6. Average results and standard deviation of the Brazilian tensile test (source: author’s own work).
GroupSubgroupBoreholeDepth (m)Diameter (mm)LithologyAverage Load (kN)Load Deviation (kN)Average Stress (kPa)Stress Deviation (kPa)
Igneous rockIntrusiveS-SE-019.70–11.2063.3Diorite/granite30.54.310.91.2
VolcanicS-SE-0116.75–17.3563.3Basalt57.313.919.74.8
S-SE-0124.40–26.0063.3Andesite31.36.210.52.0
S-SE-0224.00–26.0063.3Andesite33.76.311.22.1
S-SE-0226.00–30.0063.3Andesite40.89.513.63.1
IntrusiveS-SR-015.00–6.2063.3Diorite/granite45.68.915.13.2
VolcanicS-SR-017.00–8.4063.3Andesite68.512.322.24.5
S-SR-0112.60–14.7063.3Basalt/andesite61.510.220.44.1
S-SR-0210.00–10.5063.3Andesite53.811.317.34.2
Metamorphic rockMetamorphicS-SR-0215.20–17.0063.3Chert34.812.311.84.9
Igneous rockVolcanicS-SR-0234.30–35.9063.3Andesite7.82.32.60.8
Table 7. Results obtained from the point load test.
GroupSubgroupBoreholeDepth (m)Average Is (MPa)Correction FactorAverage Is(50) (MPa)
Intrusive igneousDiorite/graniteS-SE-015.00–5.309.11.11225.2
Diorite/graniteS-SR-015.00–6.2018.11.11443.3
Volcanic igneousBasaltS-SE-017.60–8.0010.71.11263.3
AndesiteS-SE-024.00–5.304.21.11103.6
AndesiteS-SR-0210.00–10.5011.51.11285.2
Basalt/andesiteS-SR-0220.20–21.8011.51.11285.2
Metamorphic rockChertS-SR-0215.20–17.009.71.11238.4
Table 8. Results of the tilt test with the characteristics (source: author’s own work).
Borehole Depth (m)Lithology Tilt TestBasic Friction Angle (°)
GroupSubgroup123456
S-SE-019.70–11.20Intrusive igneousDiorite/granite36313534333233.4
16.75–18.10Volcanic igneousBasalt33313130323331.7
26.90–28.50Andesite30263232323130.4
S-SE-0224.00–26.00Volcanic igneousAndesite35353535353535.0
26.00–28.0042434035394140.2
28.00–30.0035353635353535.0
S-SR-015.00–6.20Intrusive igneousDiorite/granite21222216131718.5
12.60–14.70Volcanic igneousBasalt/andesite25252830303228.2
19.10–20.4026272831272927.9
22.00–26.5030322829302629.1
S-SR-0210.00–10.50Volcanic igneousAndesite33303031302930.6
15.20–17.00MetamorphicChert29343031323031.0
20.20–21.80Volcanic igneousBasalt/andesite34363631342833.2
22.70–24.30Volcanic igneousBasalt/andesite35383839373236.6
34.30–35.90Volcanic igneousAndesite38393940373738.3
Table 9. Average values and standard deviations of the Brazilian tensile test.
LithologyAverage Load (kN)Load Deviation (kN)Average Stress (kPa)Stress Deviation (kPa)Observations
Diorite/granite30.54.3111.2Average tensile strength
Basalt57.313.921.74.9High tensile strength, the most consistent
Andesite31.36.210.52.0Moderate tensile strength, with lower variability
Chert34.812.311.84.9Low tensile strength, high variability
Disclaimer/Publisher’s Note: The statements, opinions and data contained in all publications are solely those of the individual author(s) and contributor(s) and not of MDPI and/or the editor(s). MDPI and/or the editor(s) disclaim responsibility for any injury to people or property resulting from any ideas, methods, instructions or products referred to in the content.

