Article

Using Expert Knowledge to Assess Resistance to Internal Erosion of Levees with Tree Vegetation

INRAE, RECOVER, Aix Marseille University, 13182 Aix-en-Provence, France
*
Author to whom correspondence should be addressed.
Geotechnics 2025, 5(2), 30; https://doi.org/10.3390/geotechnics5020030
Submission received: 24 April 2025 / Revised: 13 May 2025 / Accepted: 15 May 2025 / Published: 21 May 2025

Abstract

The breaching of river levees can have dramatic economic and human impacts. In many countries, including France, laws and regulations require the assessment and inspection of hydraulic structures. Methods are required to carry out these missions. The following article presents a method for assessing the impacts of tree vegetation on the resistance of river levees to internal erosion. Indeed, the presence of trees—particularly following the decomposition of their roots—may cause damage in the structure through contact erosion, concentrated erosion, backward erosion or suffusion. The proposed method takes into account the possible presence of trees and especially roots in different parts of the levee. The method is based on the formalization and aggregation of expert knowledge. It permits the calculation of a performance indicator, which is obtained by aggregating criteria determined using formalized status indicators. The entire method is available in the article. The method was tested on two real cases.

1. Introduction

There are hundreds of thousands of levees in the world, some of which were built several centuries ago. The failure of these structures can have dramatic economic and human consequences. Several mechanisms can damage levees: overflow, scouring, internal erosion, slope instability, and so on. Among them, internal erosion is one of the most common causes of levee failure [1,2,3]. There is a need to improve their performance in terms of resistance. Performance is defined as “a judgement, at a given moment, of the ability of a structure to fulfil the functions for which it designed”. By extension, the performance of a function indicates the “level of achievement of a function” [4]. The performance of a levee is difficult to ascertain due to the complexity of the involved mechanisms, the heterogeneity of the structures and the need to combine different types of data, which are not always available [5]. Indeed, as levees are often very old, little is known about their construction and few data are available [6]. This explains why the assessment of levee performance relies heavily on expert judgment during diagnostics. Numerical models are not always feasible or do not make it possible to evaluate all the parameters required to assess the performance of levees with regard to their internal erosion mechanisms [7]. Based on the available data and models, expert judgment can be used to assess the performance of levees. The engineer must examine the available data and identify and carry out additional investigations until they obtain sufficient information to provide a good assessment of the performance of levees according to their expert judgment [8]. These expert assessments are based on heterogeneous inputs: visual observations, instrument data, geotechnical data and the results of hydraulic or mechanical calculations [8]. Thus, knowledge-based methods, which aim at reproducing expert reasoning, are relevant for assessing the performance of levees. Different works have led to the development of this type of method for hydraulic structures [4,9]. They rely on knowledge-based methods, which are based on the collection and formalization of the theoretical and heuristic knowledge of domain experts by cognitive scientists [10,11]. These methods have the ability to reproduce the reasoning of an expert and are capable of reasoning through drawing on knowledge of diverse origin and nature [4].
Among these works, some have led to the development of a knowledge-based method for assessing the performance of river levees [4,9]. This method has a three-level structure, and it outputs an indicator of performance against a given failure mechanism. It is obtained by aggregating criteria, which are determined from status indicators that constitute the inputs of the assessment system. This method takes into account hydraulic, geotechnical and geometrical status indicators of the structure to model its failure mechanisms [9].
The work presented in this article is based on these previous works and focuses on the assessment of the performance of a levee in relation to internal erosion. Two innovative contributions stem from this work: firstly, it improves the existing method [9] by formalizing all the status indicators and determining the aggregation structures used to assess the criteria; secondly, it takes into account the influence of tree root systems on the internal erosion mechanism through the definition and formalization of new state indicators specific to tree root systems.
Many earthfill levees are covered more or less densely by tree vegetation [12,13], which makes them particularly vulnerable to internal erosion mechanisms, particularly during the decomposition of root systems after the death of a tree [8,14,15,16,17]. When a tree dies, the decomposition of its root system—depending on the nature and cohesion of the soil—can lead to the creation of ducts through the embankment, which are likely to initiate concentrated internal erosion. It is therefore important to estimate the rate of decomposition of woody roots in order to prioritize the action to be taken according to the risk regarding the safety of the structure [18]. Work has been carried out on certain tree species to estimate the decomposition rate of their woody roots [19]. The death of a tree can also lead to an increase in the overall permeability of the embankment area or its foundation, through the decomposition of a large root volume [18,20].
The knowledge-based method proposed in this study considers the presence of roots in different parts of the levee, as root decomposition can lead to the occurrence of weak zones in all the components of the levee. It is based on the formalization of specific status indicators to account for vegetation on the structures. This method is designed for geotechnical and civil engineering engineers and technicians specialized in the domain of hydraulic works and levees. However, engineers and technicians specialized in hydraulic work are not specialists in vegetation and the risks associated with the decomposition of woody roots in embankment structures. This method will enable these engineers to assess the performance of a levee with regard to the mechanism of internal erosion. This method will also enable novice engineers and technicians to assess the performance of levees against internal erosion, whether or not they are subject to root development.
Section 2 of this paper presents the materials and methods adopted for this study. It includes an analysis to contextualize the influence of vegetation on different types of internal erosion mechanisms and a description of the knowledge-based method used to assess performance. Section 3 presents the results, starting with the extension and improvement of the performance assessment method developed before this work [21] and then describing two case studies implementing the proposed method to assess the performance of levees with tree vegetation. A discussion of the method and the obtained results is developed in Section 4. Section 5 concludes this article.

2. Materials and Methods

2.1. Internal Erosion and Tree Vegetation: Analysis of the Influence of Tree Vegetation

The type of root structure is considered in the literature to be a compromise between genetic inheritance and plasticity depending on the local environmental conditions of the tree [22]. Recent research by [18,23] has shown that, depending on soil type and access to water and nutrients, a tree can adopt a different type of root structure in hydraulic structures. Plasticity in response to local environmental conditions therefore plays a key role in determining the type of root structure of a woody species. However, some species are more problematic than others, such as poplars and black locusts. Indeed, following cutting at the base of the trunk, these species can produce shoots at the stump or suckers. In this case, the size of the tree does not provide any indication of the size and age of the root system. Furthermore, when the tree dies, their roots decompose more quickly than those of other tree species such as conifers. The analysis must therefore be carried out on a case-by-case basis depending on the species, the type of material used to construct the levee, access to water and nutrients and the climate.
In the literature [23], four types of root systems have been identified and classified (Figure 1):
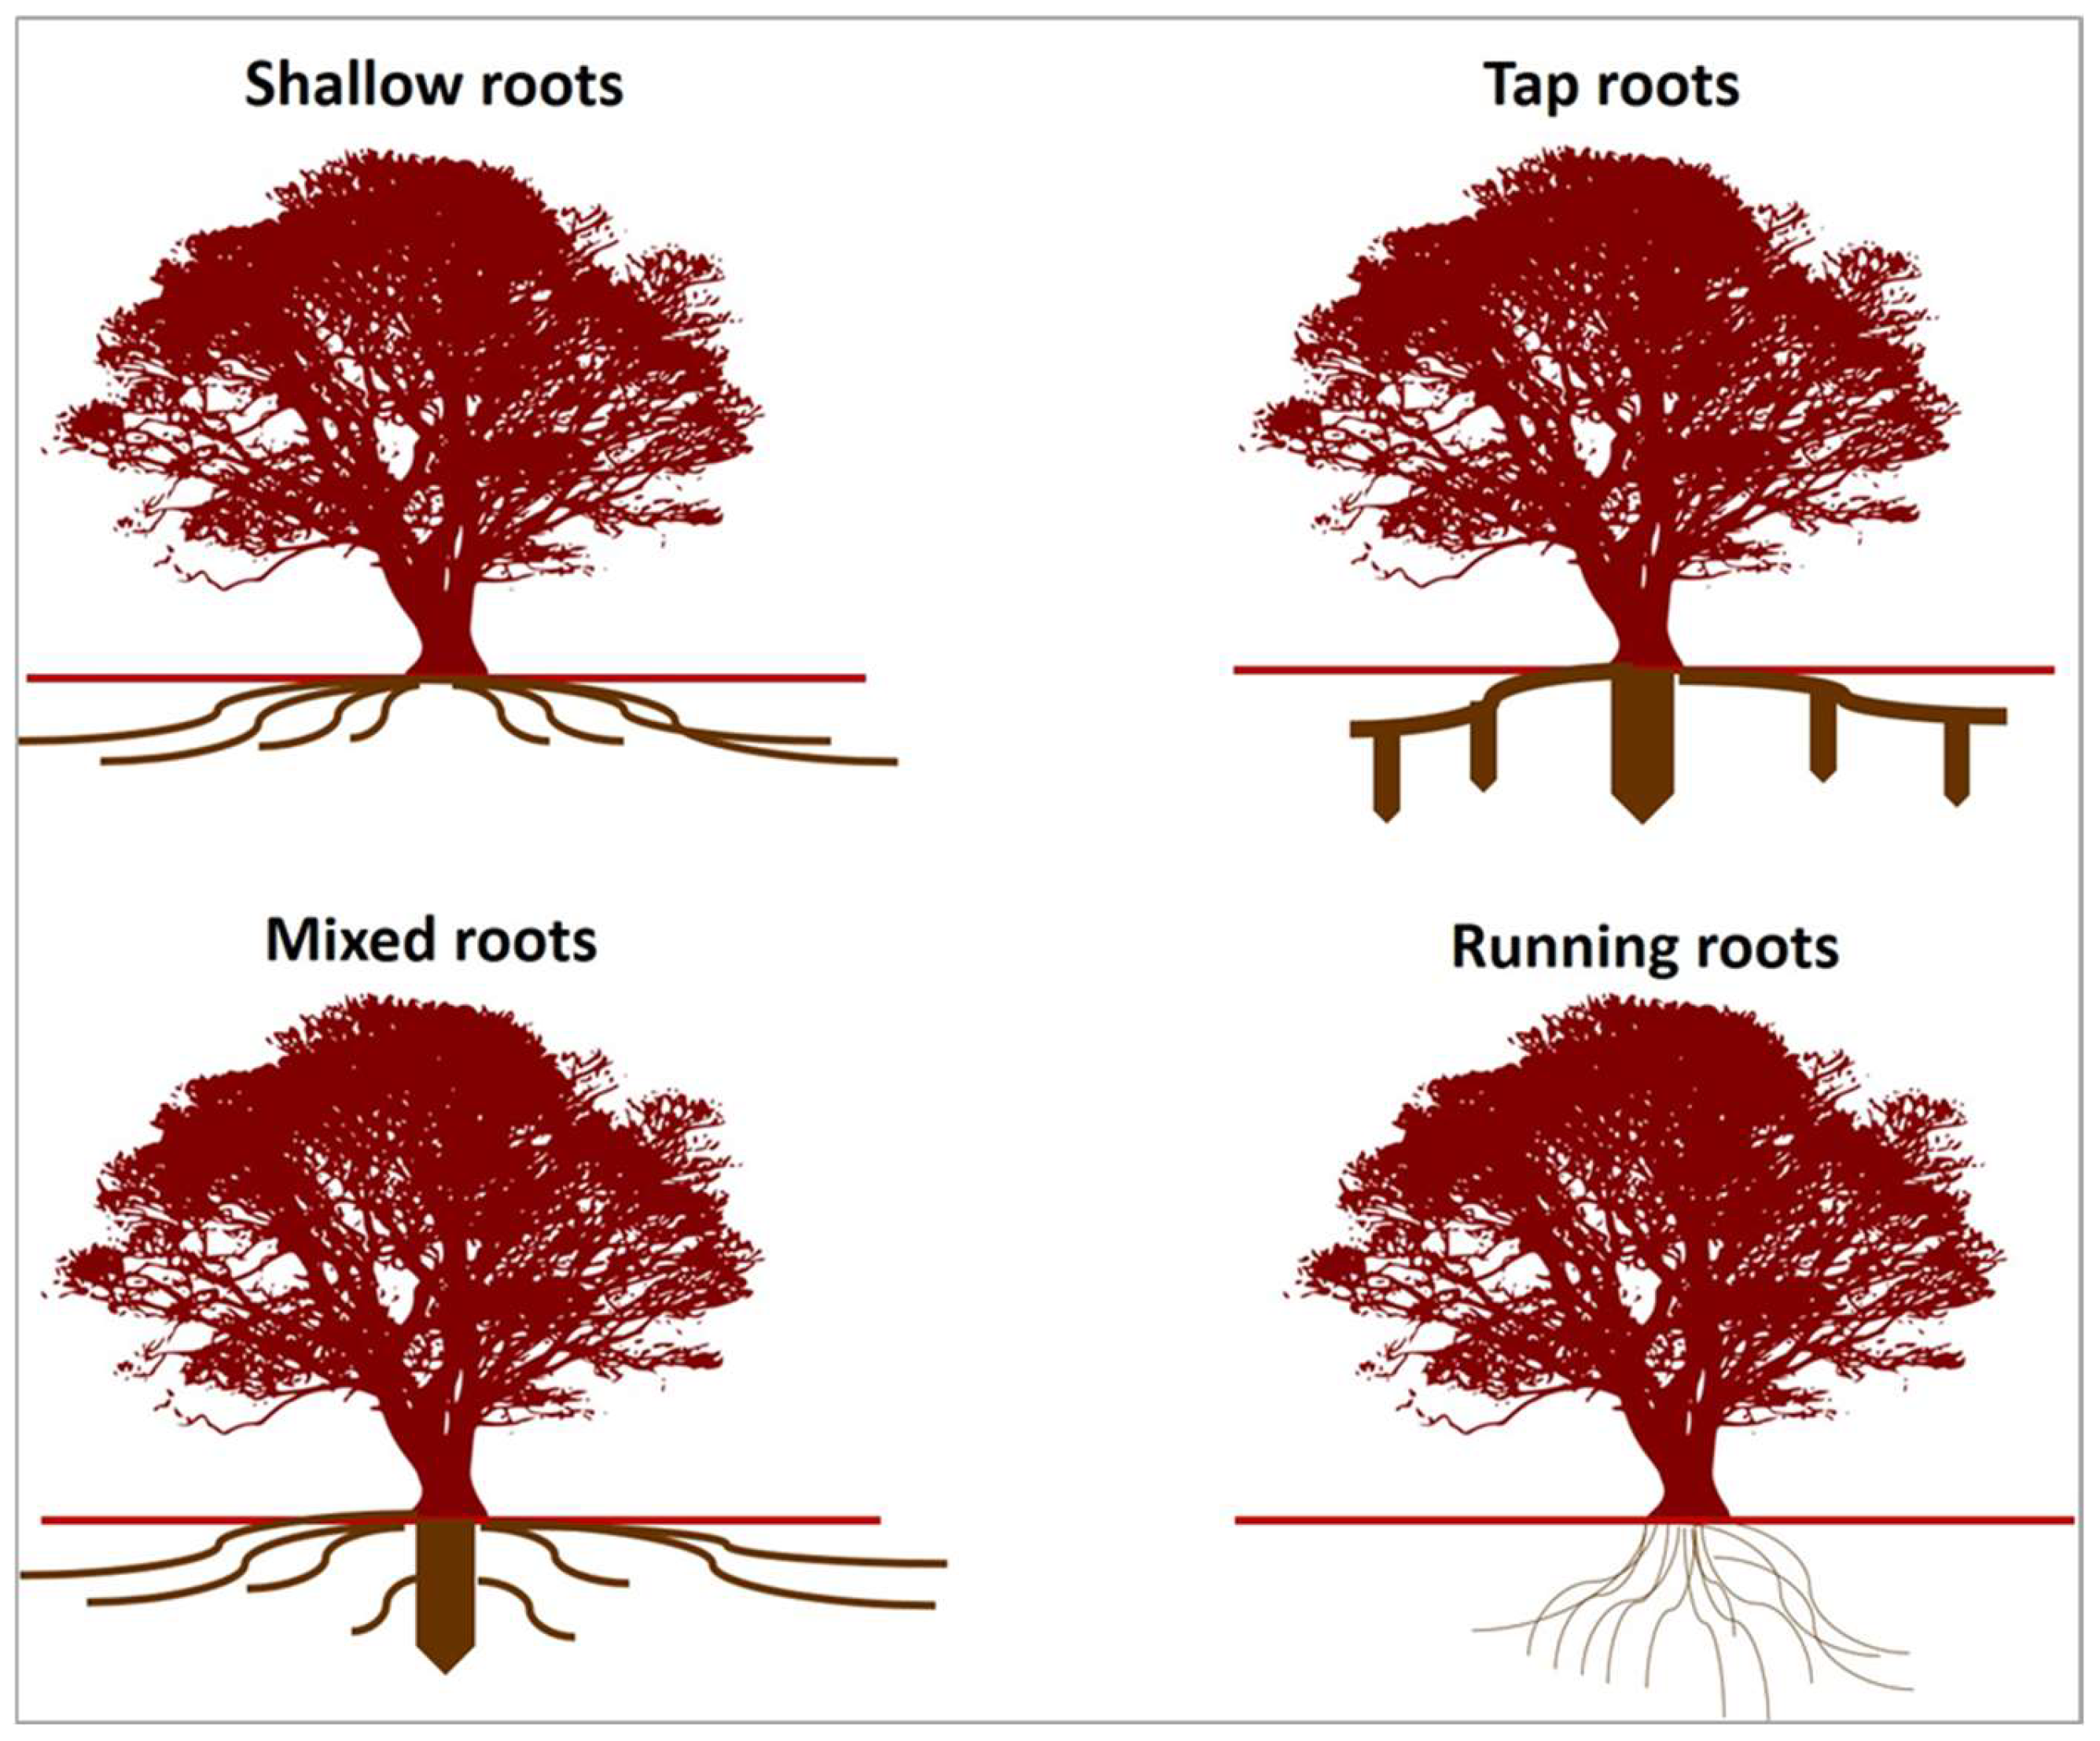
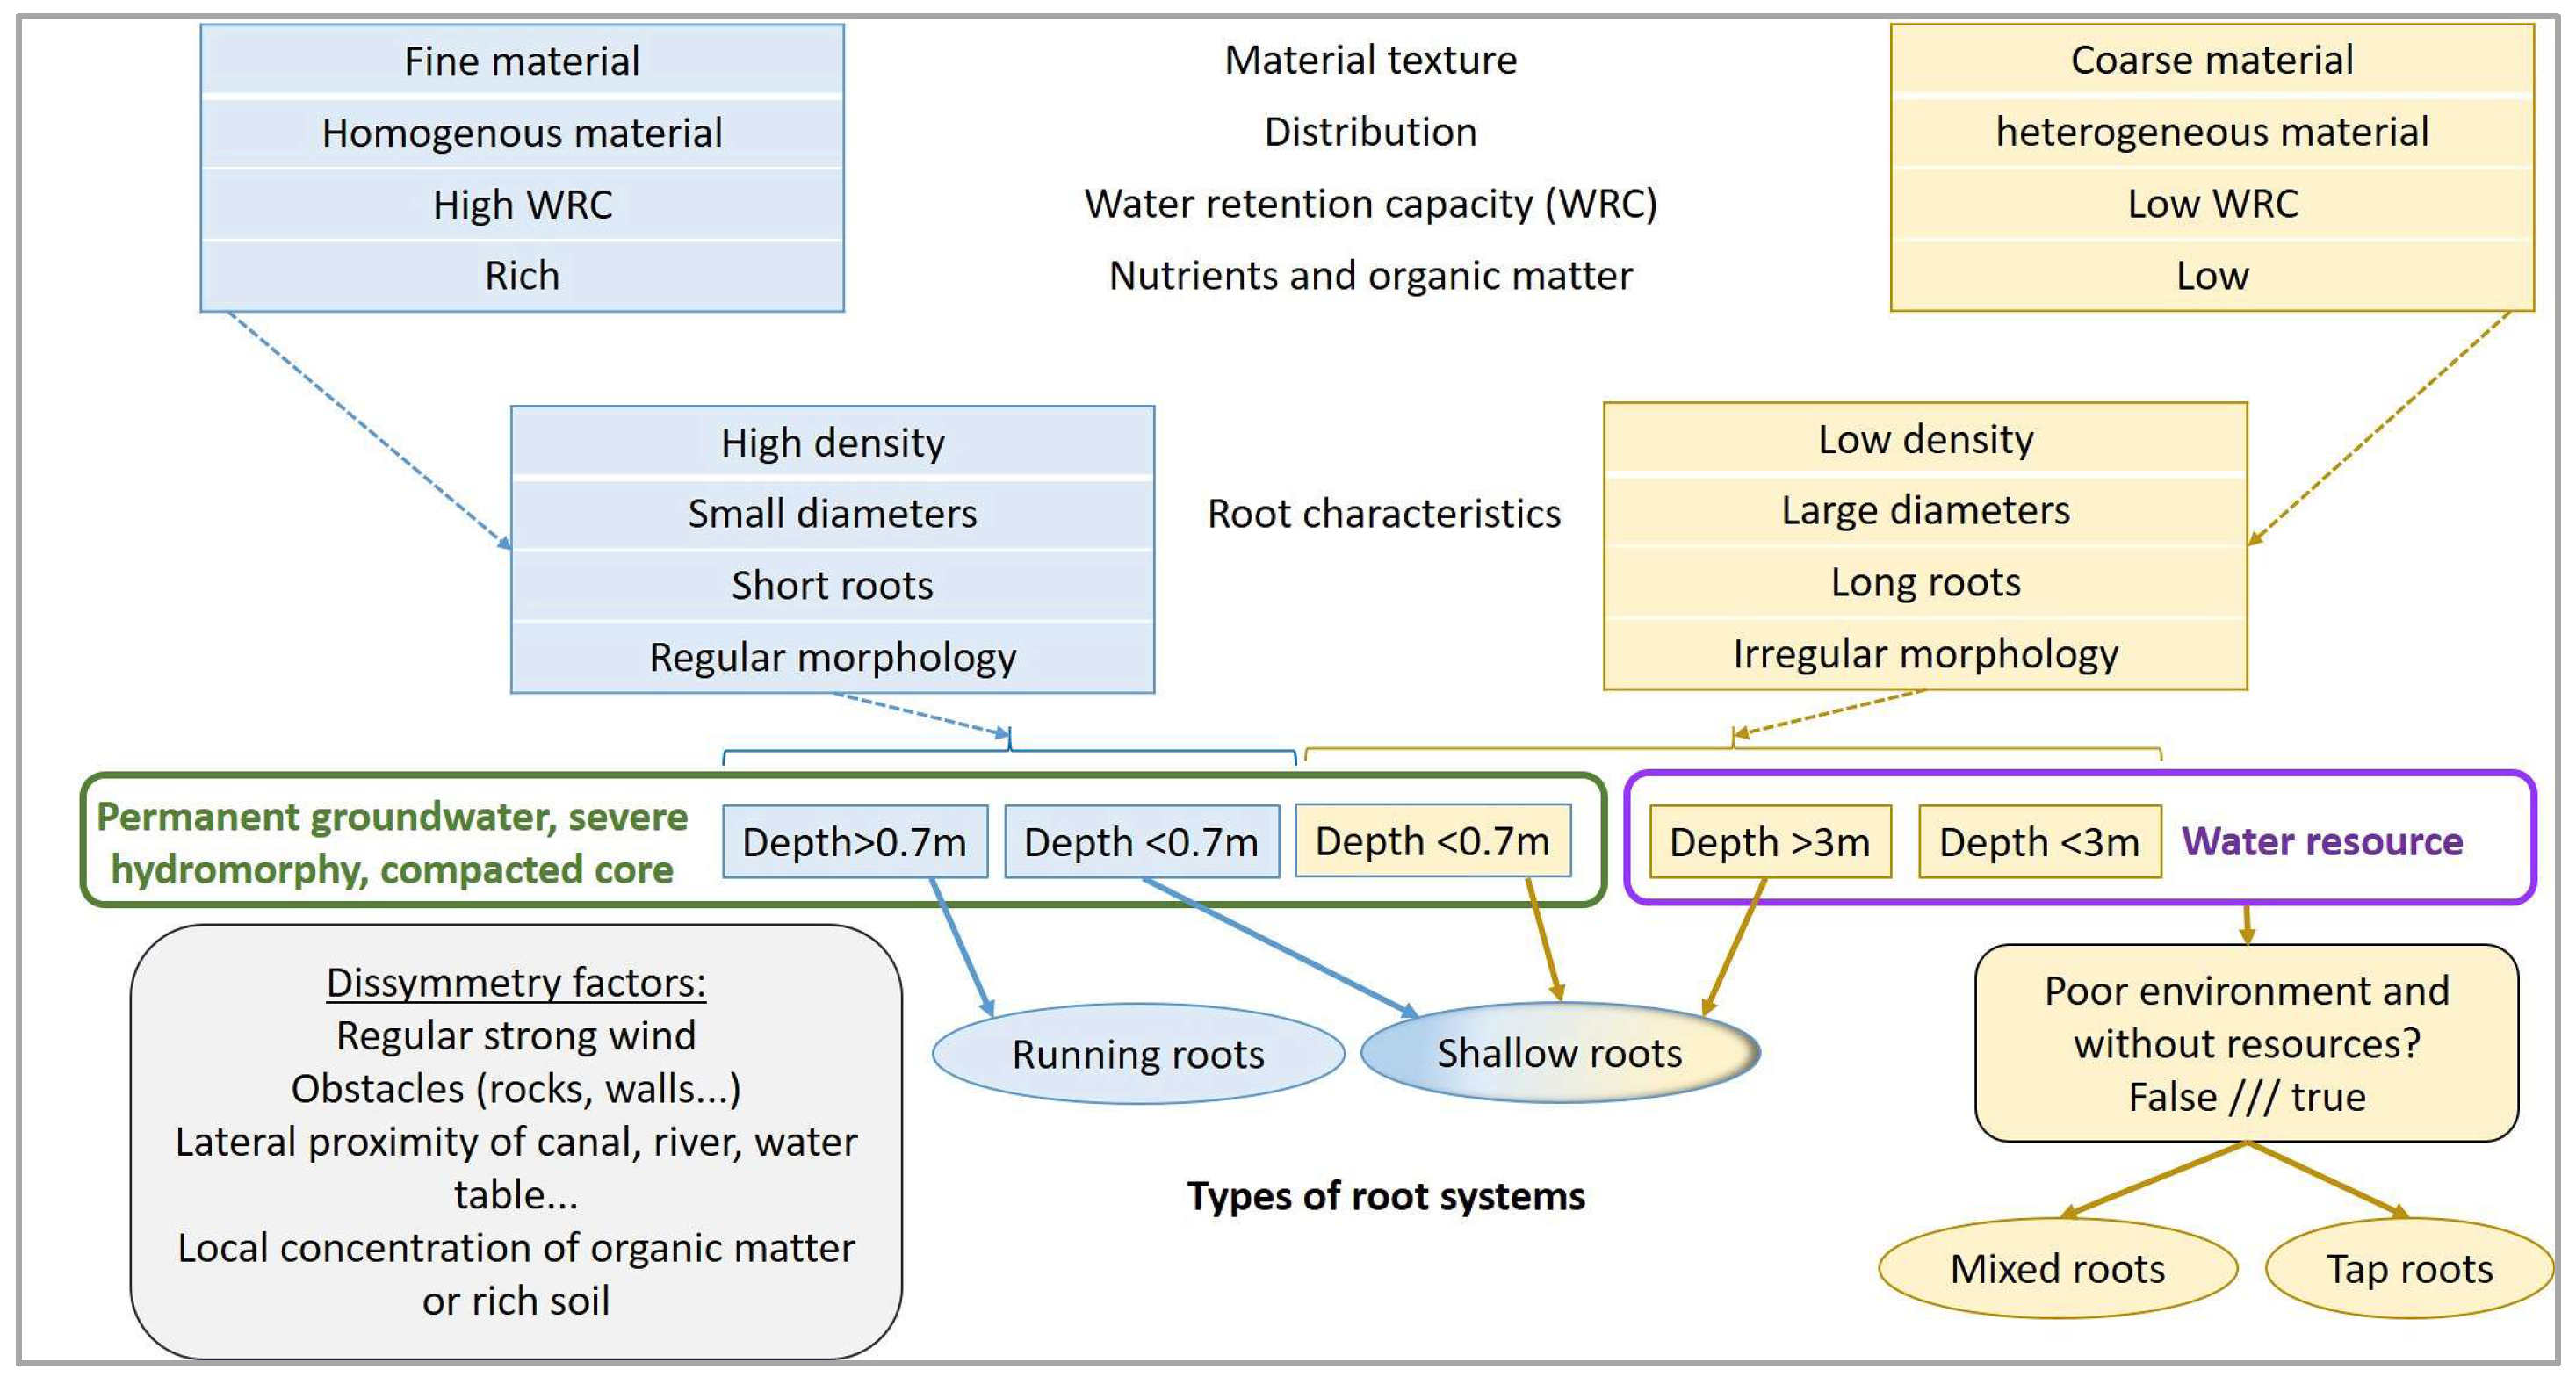
  • Shallow roots: long horizontal roots close to the surface of the soil, liable to cross the structure from upstream to downstream and vice versa;
  • Tap roots: large vertical roots that can penetrate deep into the earthfill;
  • Mixed roots: grouping shallow and tap roots;
  • Running roots: numerous roots in all directions, horizontal and vertical, generally of small diameter.
These four types of root systems influence the initiation or aggravation of the internal erosion mechanism, particularly during the decomposition of roots.
Internal erosion is erosion inside soil that is liable to lead to a total or partial breach [6]. This degradation process requires two conditions: the detachment of elementary particles of a granular material that compose the earthfill or its foundation and their transport under the effect of a flow. It can involve the body of an earthfill structure and/or its soft subgrade. This phenomenon tends to concentrate along preferential flow percolation paths.
The presence of tree vegetation—and, more specifically, tree root systems—is typically an example of a fault in the structure. Here, we study the effect of different types of root systems on the four main types of internal erosion mechanisms [6]: contact, concentrated, backward and suffusion erosion (Figure 2).
Two effects can be distinguished: a potentially triggering effect of the mechanism or a potentially exacerbating effect.

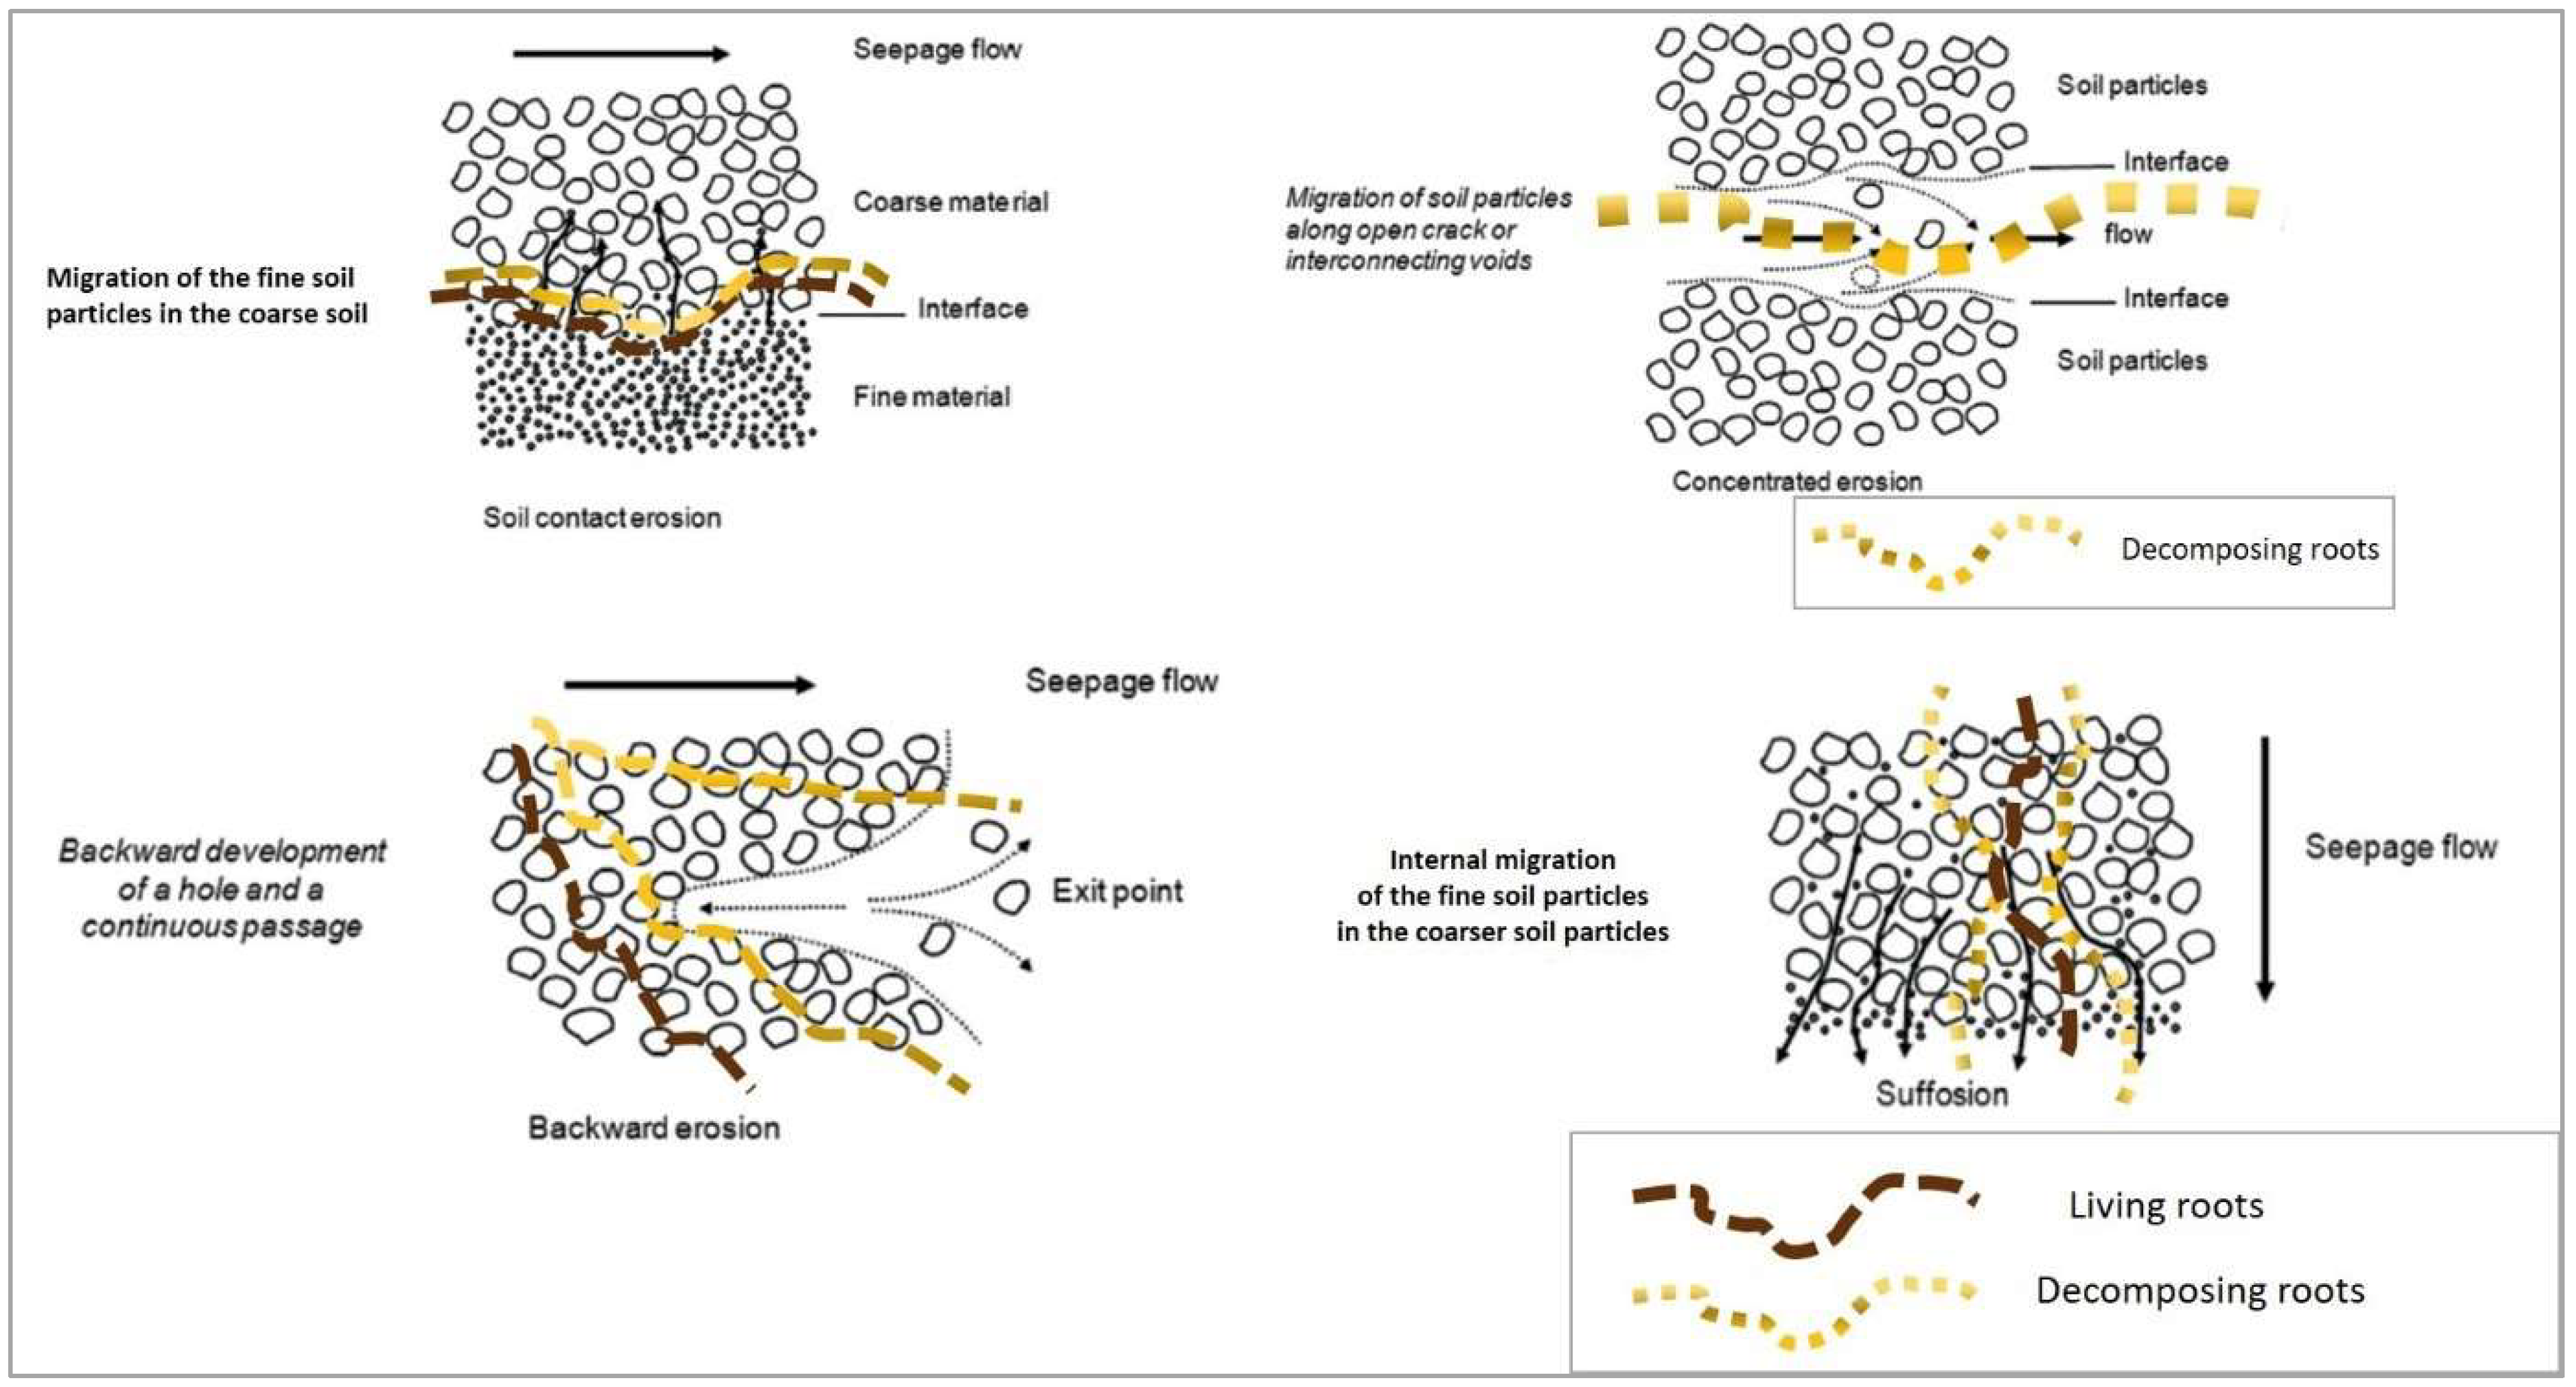
2.1.1. Contact Erosion

Contact erosion occurs at the interface between two layers of different soils—fine and coarse—under the effect of a flow perpendicular to this interface; for example, in the case of a rise in the groundwater level (Figure 2). The fine particles are detached and carried through the pores and constrictions of the coarser layer. It occurs in foundations with layers having different grain sizes or at the earthfill–foundation interface if the grain sizes between the materials of the earthfill and the foundation are heterogeneous [6].
The decomposition of the roots at the level of these interface zones can increase the permeability of these zones and thus increase exposure to contact erosion (exacerbating factor). This zone is favorable to root growth (Figure 3) as it is potentially humus-bearing (if the soil was not stripped deeply before construction), and also because the thickness of the levee protects the foundation from drying [19].

2.1.2. Concentrated Erosion

Concentrated erosion is the erosion of particles lining the walls of a pipe or a series of cavities crossed by a preferential flow (Figure 2). Concentrated erosion is driven by heterogeneities and faults within the structure [24] such as voids and ducts produced by the decomposition of ligneous roots (Figure 4).
This fault is traversing (from upstream to downstream) or almost traversing: running, mixed or branched roots are therefore concerned. Root decomposition can therefore be considered as an initiating factor of concentrated erosion. The interface zone between the earthfill and the foundation, potentially favorable for root growth, must be considered in the analysis. Contact and concentrated erosion mechanisms may be coupled.

2.1.3. Backward Erosion

Backward erosion is triggered by the departure of particles at the downstream outlet of a diffuse flow. The particles are transported downstream of the flow, whereas the surface of the erosion returns upstream [6] (Figure 2). Root decomposition can lead to diffuse flow zones, which are liable to pass downstream (initiating factor) or result in a void that receives eroded particles (exacerbating factor). Coupling between backward erosion and concentrated erosion is then possible [19].

2.1.4. Internal Erosion by Suffusion

Internal erosion by suffusion is the selective erosion of the fine particles of a material with heterogenous grain sizes through pores and constrictions formed by the matrix of coarser particles (Figure 2). Its characteristics are similar to those of contact erosion but within a single material with heterogeneous grain size. The eroded fine particles must find a non-filtered outlet [6], such that the phenomenon of internal erosion by suffusion is triggered and can lead to the failure of the levee.
In a material where the grain size is dispersed, the almost continuous growth and decomposition of small roots increases the number of pores, the permeability of the material and thus the ability of the fine particles to move. This is also the case when a tree dies, leading to the decomposition of its root system. The initiation process and then the progression of internal erosion by suffusion could be accelerated (exacerbating factor) [19] by increasing soil permeability and by increasing seepage velocity.

2.1.5. Synthesis

This analysis provides an understanding of the types of internal erosion mechanisms induced or aggravated by the root systems of tree vegetation.
The method used to assess the performance of levees impacted by tree vegetation does not distinguish between these four types of internal erosion mechanisms, providing a simplification by combining these 4 mechanisms into a single assessment.

2.2. Knowledge-Based Method for Assessing Performance

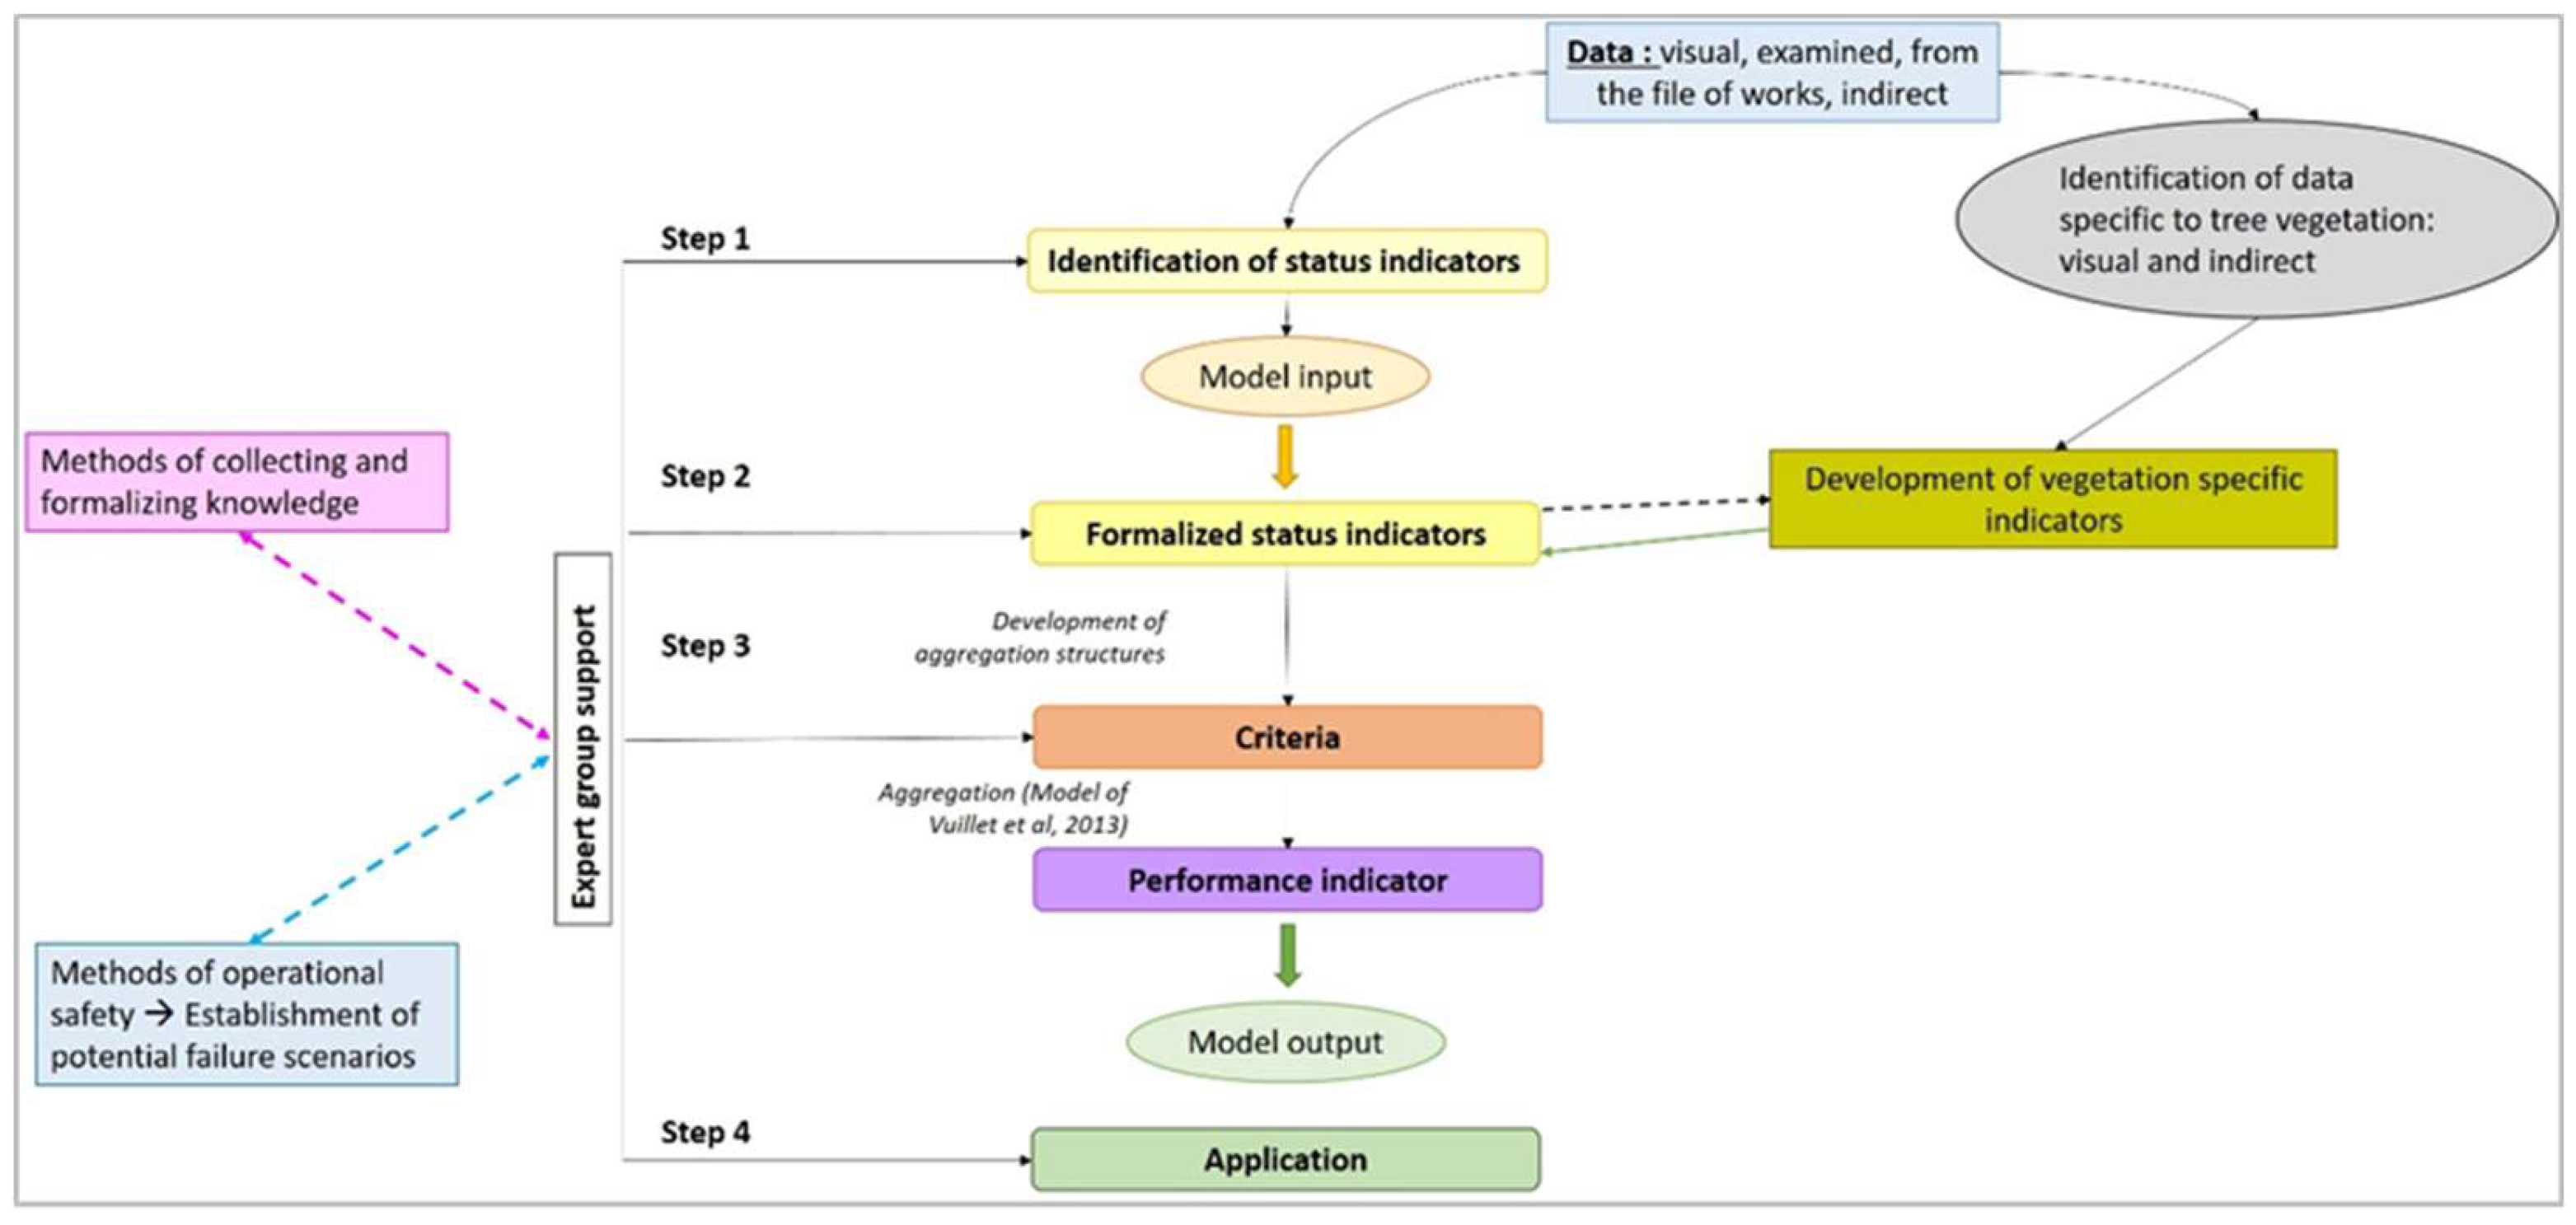
2.2.1. General Framework

The method used in our study, derived from the work of [19], has a three-level structure (Figure 5):
  • Status indicators (SI.i) comprise the first step in the method. They can be filled in using the following input data: visual observations (e.g., “Leakage, leakage index”), instrument measurements (e.g., “Material permeability”), geotechnical data (e.g., “Sensitivity to internal erosion for the design flood”), the results of hydraulic or mechanical calculations (e.g., “Duration of flood”) or other data derived from design and construction (e.g., “Geometry of levee body”).
  • The criteria (C.i) allow assessing the performance of a given function (e.g., “Permeability of levee body”). They are obtained by aggregating the status indicators or are directly assessed by the expert.
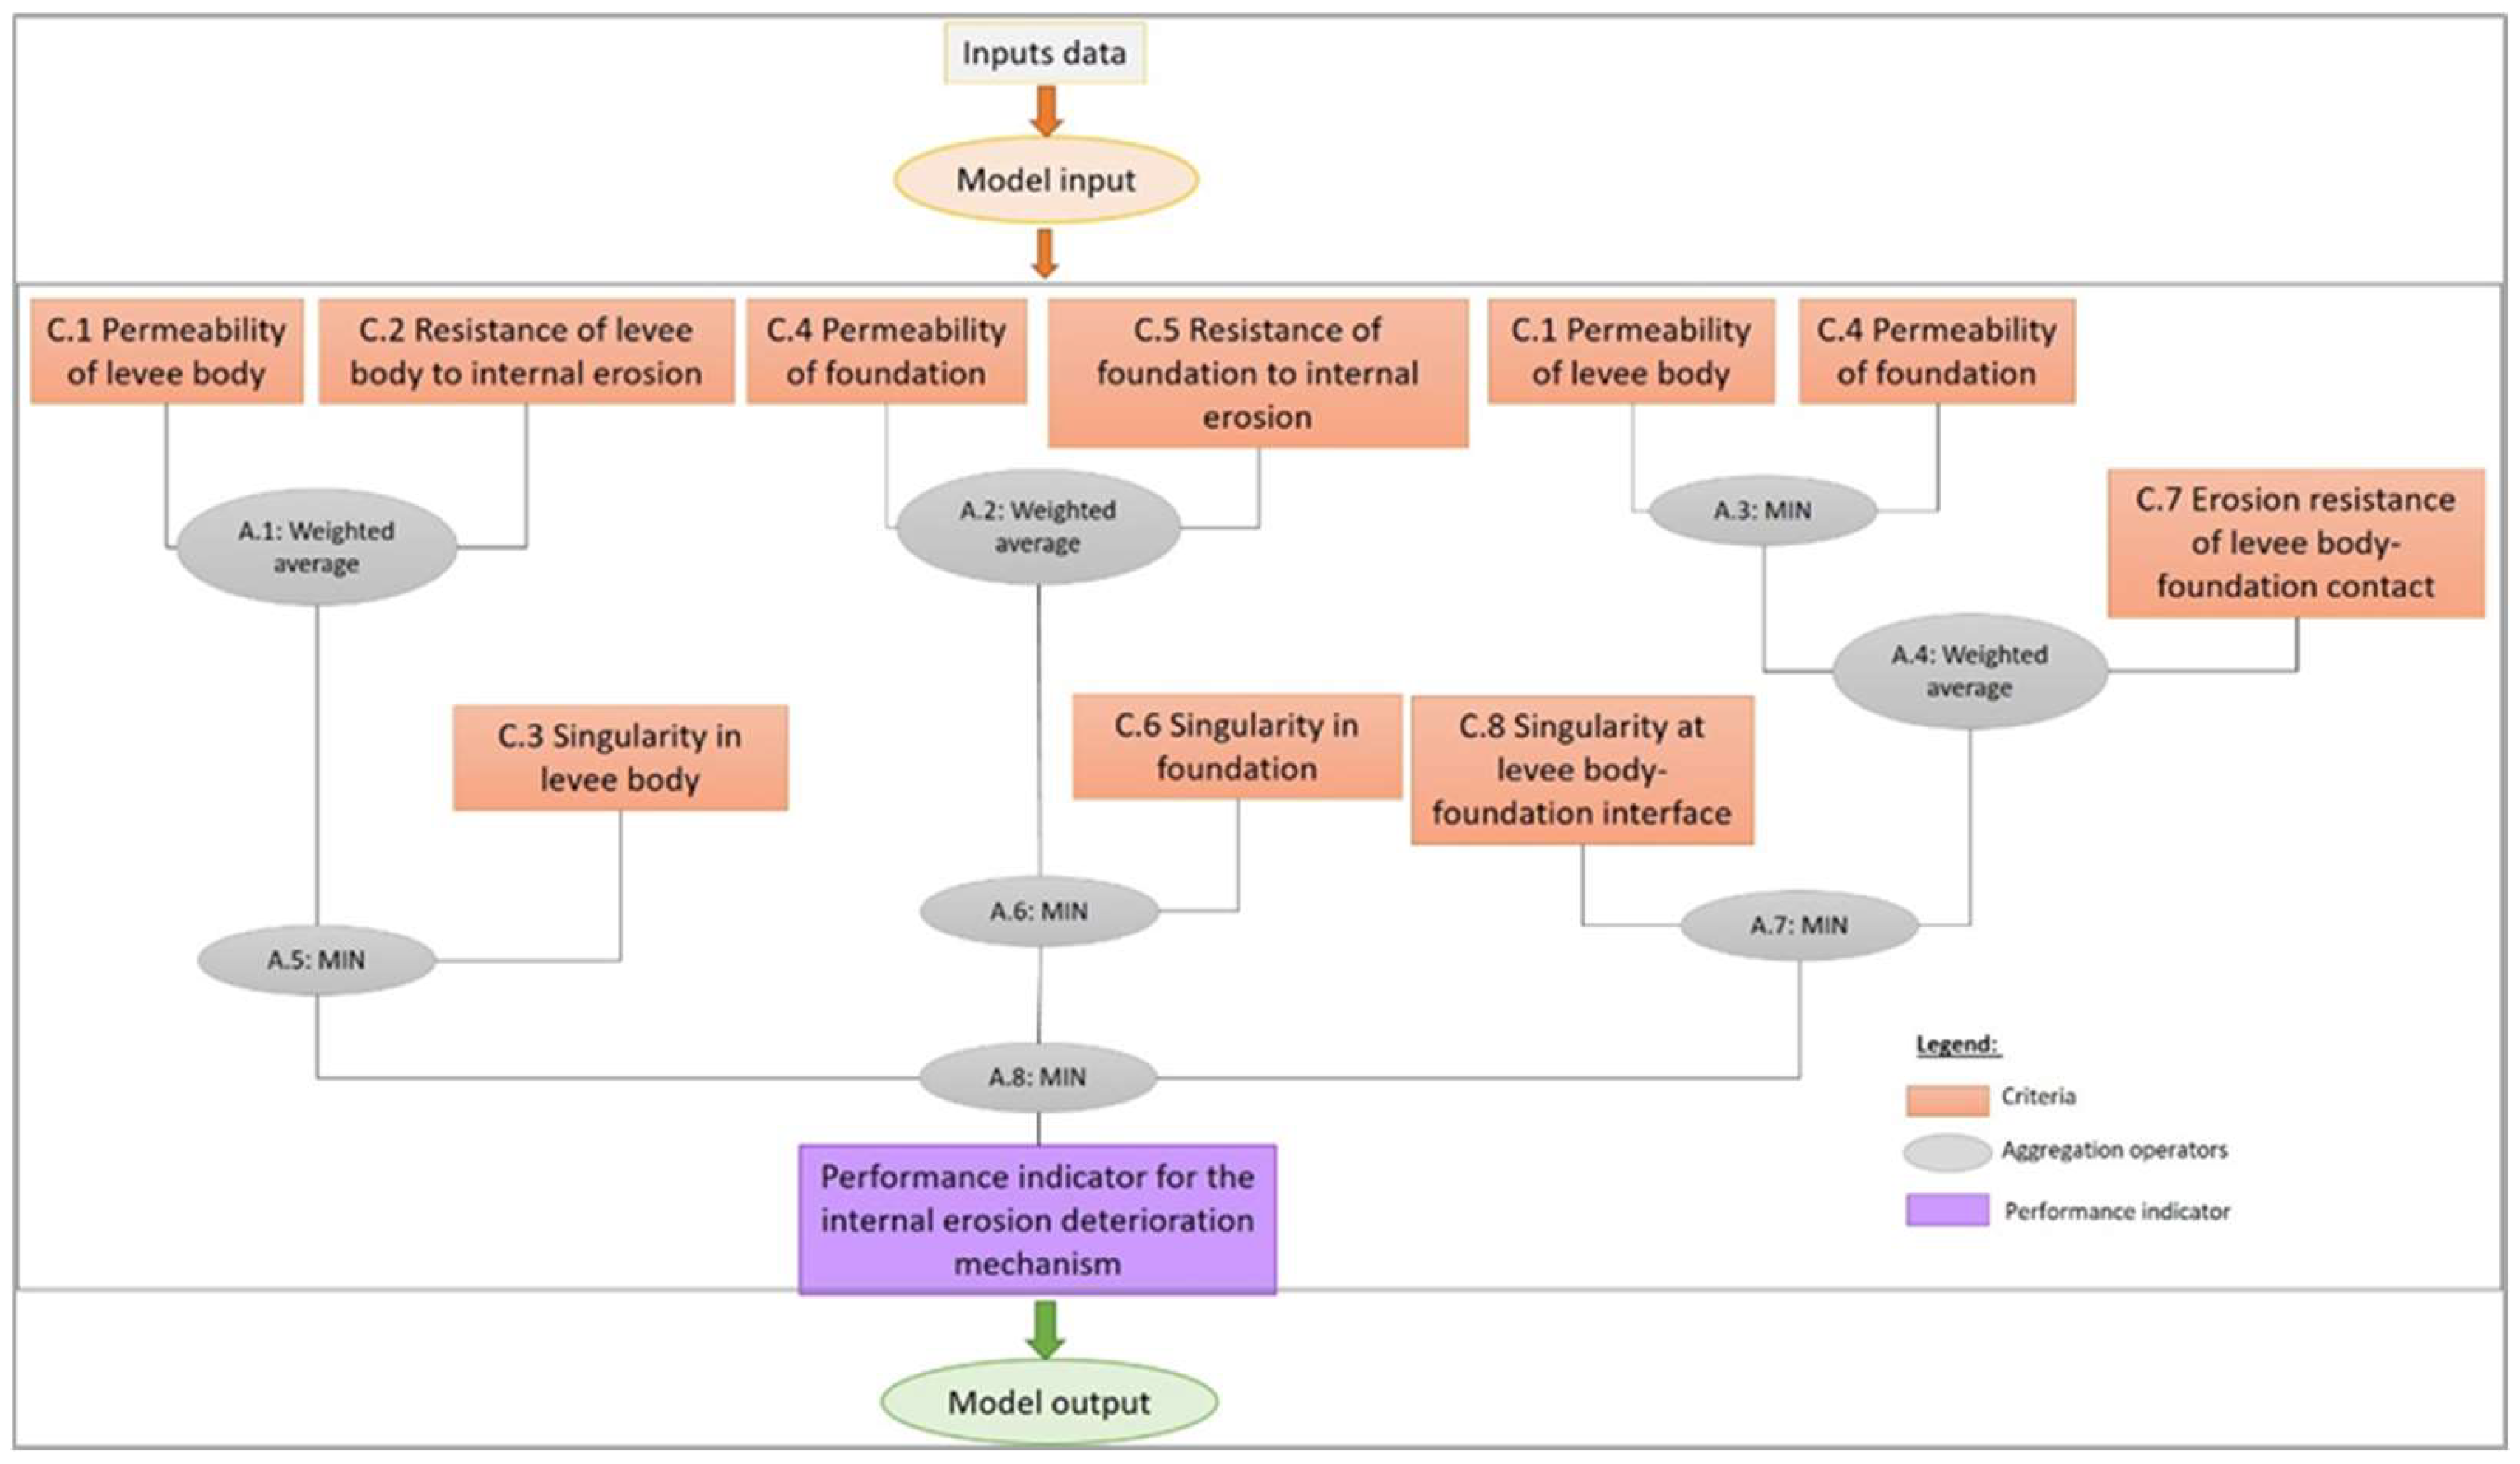
  • The performance indicator is the output of the method and is obtained by aggregating criteria.

2.2.2. Functional Model for Evaluating the Performance of the Internal Erosion Mechanism

To assess the performance of a levee with respect to the internal erosion mechanism, eight criteria (C.i) are required (Figure 6).
They allow for the assessment of each component of the structure: the levee body, the foundation and the levee body–foundation interface. The levee body is assessed using three criteria: C.1, “Permeability of levee body”; C.2, “Resistance of levee body to internal erosion”; C.3, “Singularities in levee body”. The same applies to the foundation (C.4, C.5 and C.6). The assessment of the levee body–foundation interface is based on C.1 and C.4, supplemented by two criteria assessed specifically at this interface (C.7 and C.8). C.3, C.6 and C.8 are assessed directly by the expert performing the assessment. These are criteria specific to the potential singularities present within the structure, such as traversing structures like ducts.
These criteria are aggregated using mathematical operators such as weighted average or minimum (MIN) to obtain the performance indicator (Figure 6). These aggregations come directly from the model detailed in [21]. This model was developed with the help of experts, who translate phenomena using minimum or weighted sum operators. Evaluation of the levee profile yields a qualitative performance value and a numerical value on the evaluation scale. The chosen levee profile generally varies between 10 and 100 m in length. This variation depends on the homogeneity of the profile (geometry, constituent materials, singularity observed, etc.). It includes all parts of the structure: the levee body, foundation and levee–foundation interface. Ultimately, the performance indicator score is obtained by aggregating all the criteria (Figure 6).

2.2.3. Determination of State Indicators Involved in the Internal Erosion Mechanism Related to Tree Vegetation

The methodology adopted of the performance assessment incorporating the presence of vegetation is based on knowledge collection from experts in the field of levees. To be considered an expert, it is mandatory to have both theoretical and advanced practical knowledge and to be recognized by peers in the field. Thanks to their experience, experts are expected to hold specific skills enabling them to provide expert opinions. In this study, a group of 3 experts specialized in the diagnosis of hydraulic structures was set up. They have each carried out numerous studies and expert appraisals. These experts are members of the technical support center for hydraulic structures of the French Ministry of Environment (peer acknowledgement). One of them is also an expert in forestry and in the impact of tree vegetation on hydraulic structures and the associated management methods. The sessions—or workshops—were based on structured interviews, prepared in advance by the panel moderator. Sessions with the three experts were organized at each stage in the construction of the method: (i) the identification of state indicators based on failure mode and effects analysis (FMEA), more particularly with regard to indicators specific to tree vegetation, which had never been identified before; (ii) the aggregation of status indicators; (iii) the verification of the use of the method via test cases in the room and verification via two real cases (presented in Section 3.2). Following each session with the experts, the moderator formalized the collected knowledge and analyzed it to identify any gaps or inconsistencies that may be addressed at the beginning of the next session.
This methodology is specific to this study (number of experts, assessment scale, rules for aggregating status indicators) and is inspired by previous work [4,8,9].
Our research approach includes 4 steps, as shown in Figure 7.
Step 1 is the identification of status indicators specific to tree vegetation. This step is based on dependability analysis (functional analysis and failure mode and effects analysis) and is presented in [8]. The other status indicators related to the technical characteristics of the structure are taken from the work of [21]. The proposed status indicators are derived from one or more data sources relevant to a given criterion.
Step 2 concerns the formalization of status indicators. The objective is to obtain a precise description of the measures and assessments. To this end, we used a grid with 6 fields [4]: name of the status indicator, definition, operating mode, measurement scale and references (different possible statuses of the status indicator), spatial characteristics (sampling location and measurement location) and temporal characteristics (time step of the status indicator measurement and trend analysis of this measurement). The procedure specifies the type of data used by the status indicator and the protocol used to assess it (Table 1).
A rating scale of 0 (unacceptable) to 10 (very good) has been established. The assessment is conducted using the quantitative scale (0 to 10) associated with a qualitative scale (“unacceptable” to “very good”) (Figure 8).
Step 3 establishes the aggregations, making it possible to assess each criterion from the associated status indicators. Different aggregations are proposed: the minimum operator and IF-THEN rules presented in the form of truth tables. A truth table is a mathematical table used in logic, which sets out the functional values of logical expressions for each of their functional arguments, that is, for each combination of values taken by their logical variables. These truth tables were constructed during working sessions with the experts. In our case, experts build each IF-THEN rule, because they have the knowledge of the phenomena that can occur in the levee and their severity. Figure 9 shows an example of a truth table.
The aggregations are implemented to represent the assessed phenomena and reproduce the experts’ reasoning. Experts build each IF-THEN rule because they have the knowledge of the phenomena that can occur in the levee and their severity. Various scenarios are then considered, particularly extreme cases for the construction of these tables. For example, if the engineer assigns a score of 2 to status indicator SI1.4 “Density of individuals” and a score of 5 to status indicator SI1.5 “Root volume per individual”, then the aggregation of these two status indicators will give a score of 3. Various test cases, carried out in the room with the experts, made it possible to verify the robustness and repeatability of the established formalization grids and the aggregation rules between the different state indicators (truth table) [19].
Step 4 corresponds to the verification step based on the method’s application to two segments of levee in southeast France. This step enables the method to be used in real conditions and to verify its robustness compared to a direct expert assessment based on the information and visual observations of the levee. The experts who participated in the construction of the method are the same as those who tested the method in real conditions. The assessment of the status indicators by the user (in this case the experts) is guided by the formalization grids for each indicator, which reduce the subjectivity of the method user. Finally, the obtained performance results are used to check the robustness of the assessment method. The assessment is carried out by consensus between the various experts, since the experts always work in teams of at least 2, with different skills, each bringing his or her own knowledge and know-how. Their contributions are therefore complementary.

3. Results

3.1. Proposition of Method Based on Qualitative Indicators for Levees with Respect to Internal Erosion in the Presence of Tree Vegetation

3.1.1. Identification of Status Indicators

Table 2 lists the 27 status indicators we identified [19,21].
They were identified based on a failure mode and effects analysis and then approved during a session with the experts. Twenty-three state indicators (excluding tree vegetation) had already been identified in the thesis work of [21], which were validated by the three experts. These 23 indicators focus on the geometric, geotechnical and hydraulic aspects of the levee. Here, we define four specific status indicators for tree vegetation, which are the main novelty of this study:
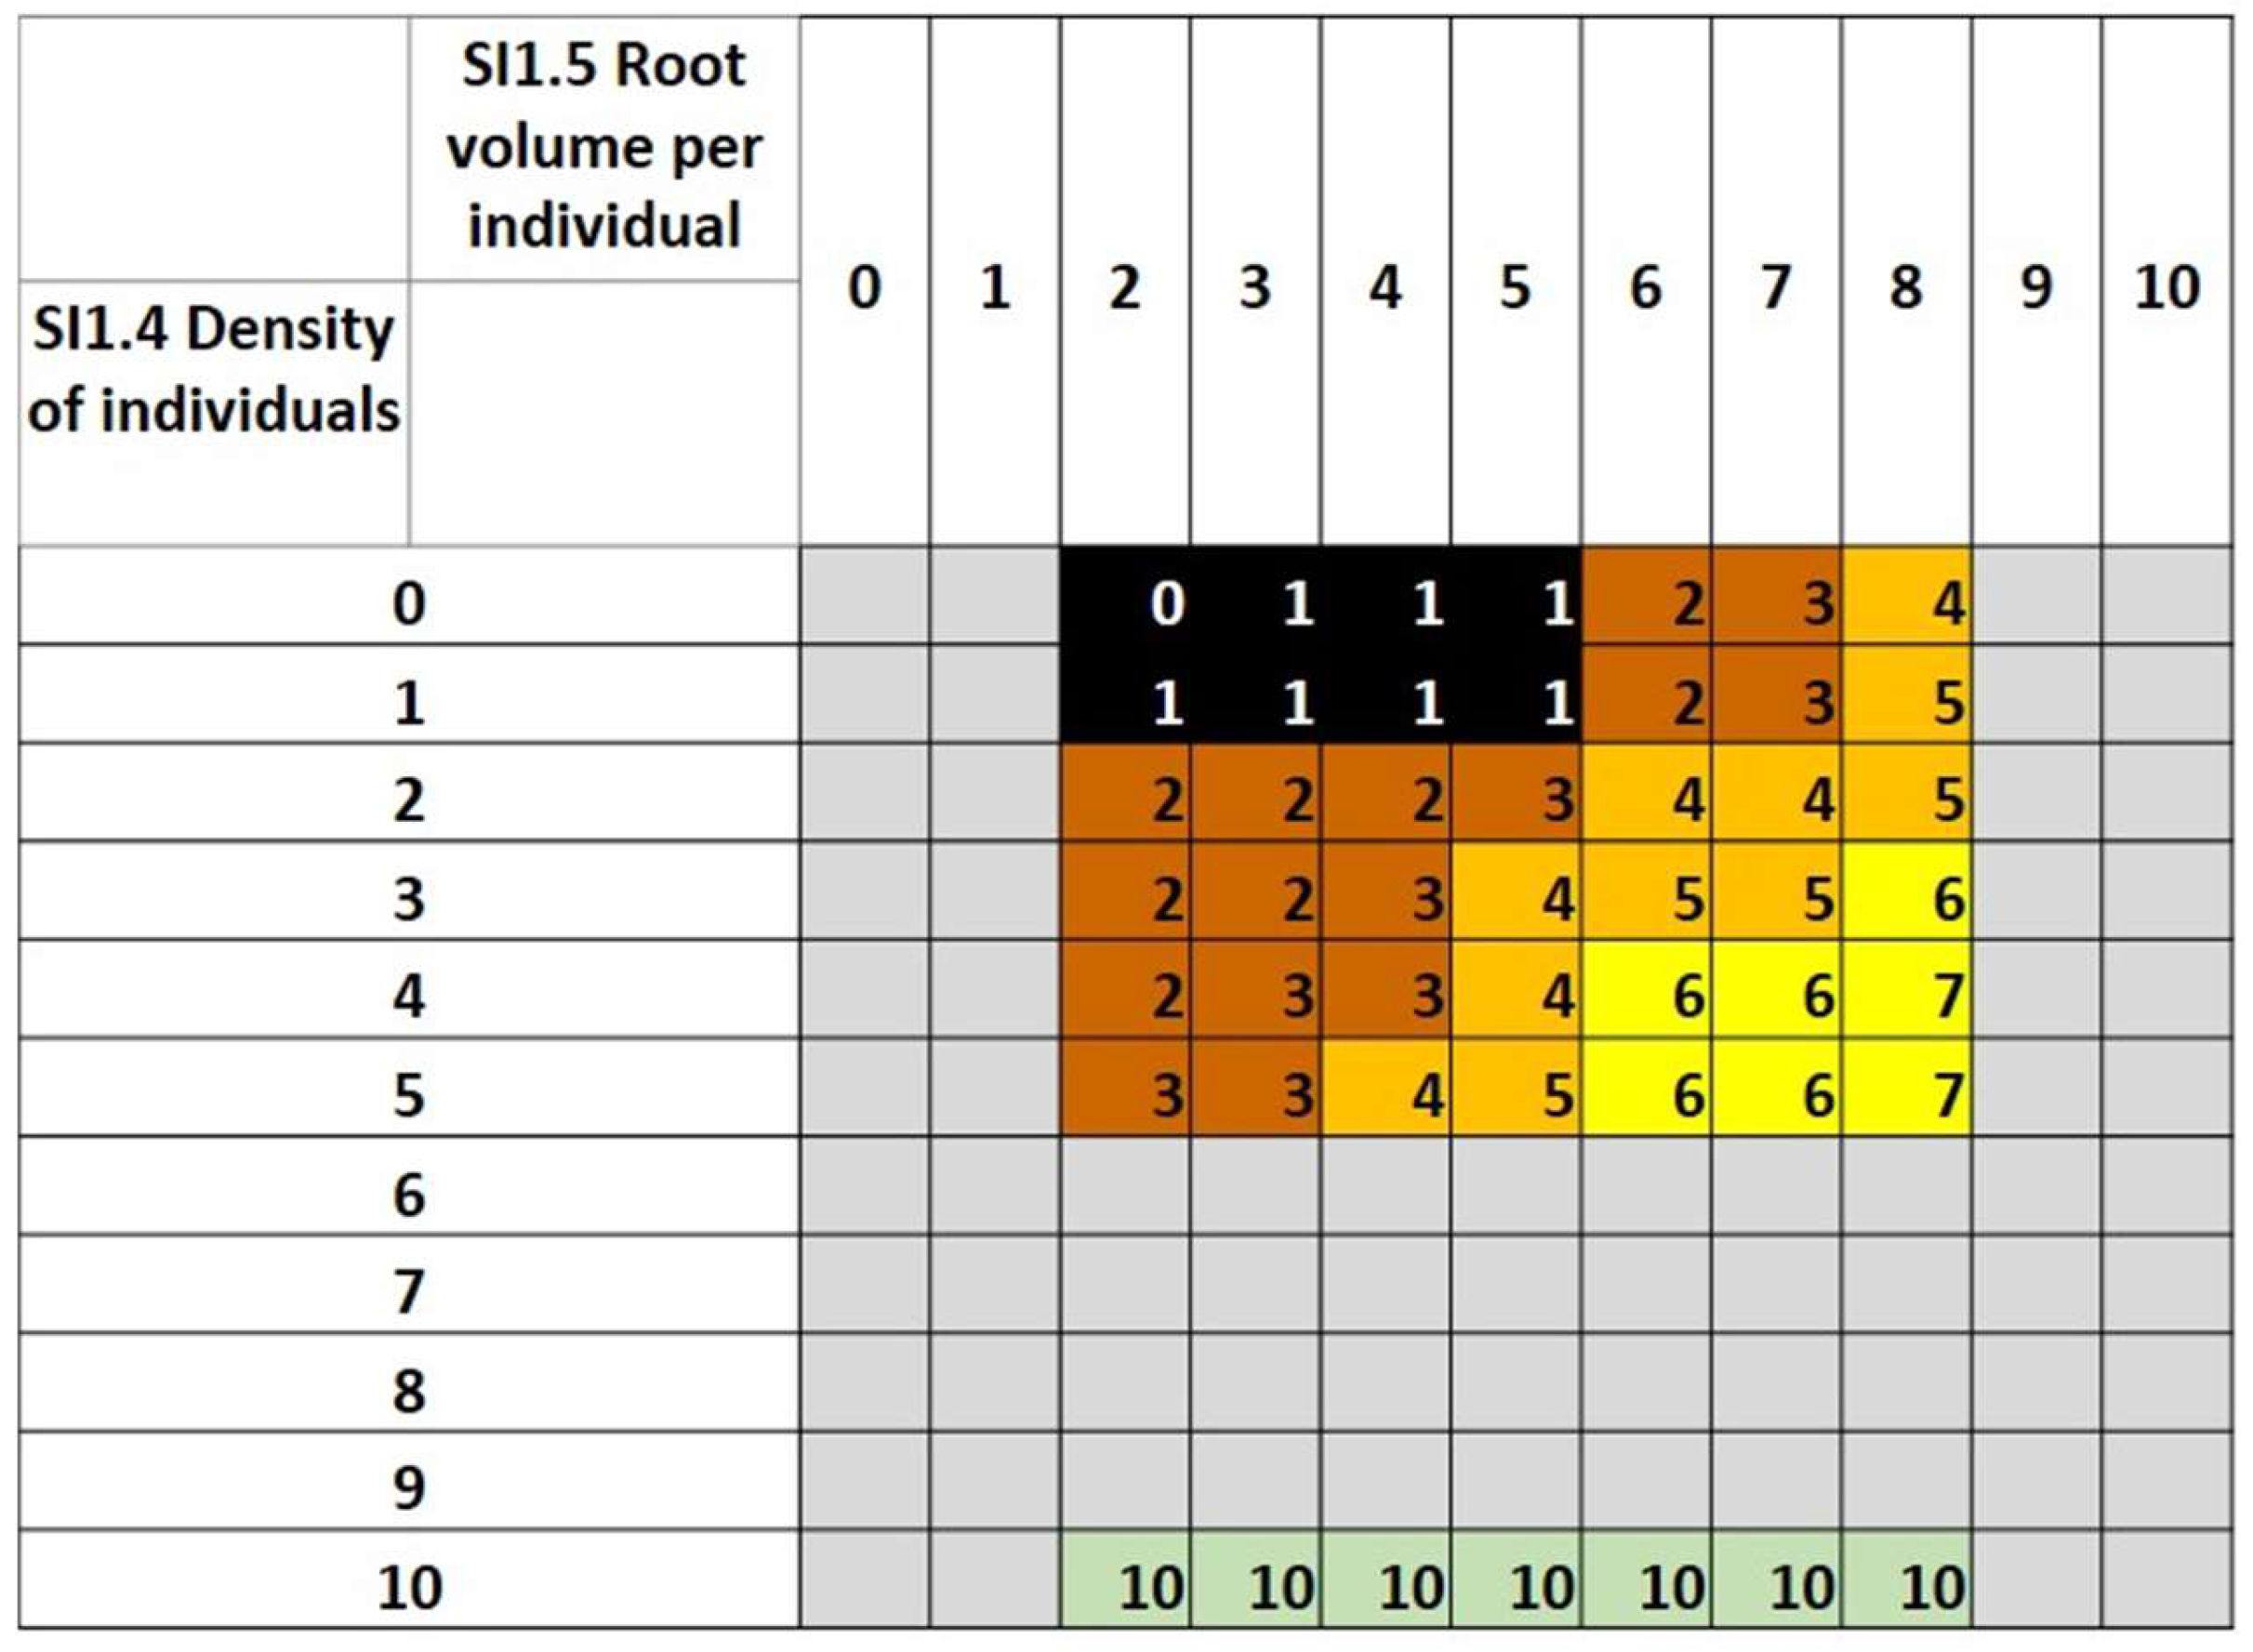
  • “Density of individuals” (trees or stumps) for the levee body (SI1.4) and for the foundation (SI4.4);
  • “Root volume per individual” for the levee body (SI1.5) and for the foundation (SI4.5);
  • “Type of root structure of individuals” for the levee body (SI1.6) and for the foundation (SI4.6);
  • “Degree of decomposition of the stump or woody roots of an individual” for the levee body (SI1.7) and for the foundation (SI4.7).

3.1.2. Formalization of Status Indicators Specific to Tree Vegetation

All 27 status indicators were formalized as a step of this study, and we present the formalizations concerning the indicators specific to tree vegetation below.
The “Density of individuals” (SI1.4 and SI4.4) is a visual status indicator resulting from qualitative assessments: the person in charge of the performance assessment assesses it visually on site on the basis of the description grid (Table 3).
The density of the individuals present on the analyzed structure indirectly testifies to the extent of the roots in the embankment or its surroundings. SI1.4 and SI4.4 are therefore the first status indicators to be taken into account with regard to vegetation. If no individual (tree or stump) is present on the structure, a score of 10 is given to this indicator and there will be no point in focusing on other status indicators specific to tree vegetation. In the case where tree vegetation is present, the user will choose the worst profile, where the density of trees is the highest. Trees present on each part of the levee (levee body, foundation, levee–foundation interface) are considered. Trees at the foot of the downstream levee whose root systems are likely to cross the structure are also considered. Scoring is carried out according to the number of individuals present out of 10 m2.
“Root volume per individual” (SI1.5 and SI4.5) is then assessed (Table 4).
Together with the “Density of individuals” (SI1.4 and SI4.4), these indicators allow us to understand the overall root volume present on the analyzed profile. Knowing that root systems grow as trees age, an individual with a large circumference stump suggests a large root volume. The circumference at the base of the tree or stump is thus measured in the field (Figure 10).
The rating scale provides a score based on circumference. This parameter is important for predicting the consequences in terms of the overall increase in the in permeability of the fill when the root system decomposes.
The “Type of root structure of individuals” (SI1.6 and SI4.6) is to be understood by the user in order to have a global root characterization in the analyzed part of levee. The root structure of trees can be qualified as opportunistic with respect to constraints related to soil characteristics and root access to water and nutrients. The different types of root structures can be more or less detrimental to the internal erosion mechanism during the decomposition of woody roots. For example, a root system with long horizontal roots that can potentially penetrate the earthfill will be particularly problematic. The decomposition of such roots will likely create a channel through the earthfill (depending on the type of material), which may initiate internal conduit erosion. SI1.6 and SI 4.6 are assessed in conjunction with the different parameters influencing the structure of the root system (type of soil, access to water, etc.). We use a key proposed by [18] to help identify the root structure that a tree is likely to have developed (Figure 11).
This key ranks the different “external” parameters that potentially determine the type of root structure. Thus, we find the granulometry of the material (fine or coarse), which is a preponderant parameter with respect to the orientation of the root system to adopt a type of structure, as it influences the water retention capacity of the soil and its capacity to accumulate nutrients and organic matter. For example, based on the numerous observations made during the work of [18,23], running root systems are not found in earthfills made of coarse materials, and tap root systems have never been observed in fills made of fine materials. Furthermore, in coarse material fills, tap or mixed root systems are only found where access to water and nutrients is possible at depth. In the literature, the type of root structure is considered to be a compromise between genetic inheritance and plasticity, depending on the type of conditions in the tree’s local environment [22]. Recent research has shown that, depending on the type of soil and access to water and nutrients, a tree can adopt a different type of root structure in hydraulic structures [18,23]. Depending on the types of root structures that are identified, the user will refer to the references established in the formalization grid (Table 5).
The “Degree of decomposition of the stump or woody roots of an individual” (SI1.7 and SI4.7) is important for assessing the flow propensity in a levee. Experimental devices were designed to monitor the aging of woody roots from different tree species (coniferous and deciduous). Samples were taken at different time steps and then analyzed by qualitative and quantitative methods to assess the decomposition of these roots [8]. Using these results, we were able to formalize this indicator from these indirect measures (Table 6).
The use of qualitative methods is based on woody root decomposition classes from visual and tactile criteria [25,26] or based on woody root decomposition classes from a criterion of resistance to blade penetration in wood [27]. Additionally, the use of quantitative methods based on the estimation of the loss of density of samples over time, then based on near-infrared spectrometry and chemometric methods [8,19], uncovered a trend in the temporal evolution of root decomposition for different plant species and under different climatic conditions. The obtained results allowed establishing proposals for the assessment of SI1.7 and SI4.7 (Table 6), which depend on the following:
  • The geographical zone and thus the type of climate.
  • The time of decomposition: It is necessary to know the date of death of the tree. Currently, we have information on the state of decomposition of woody roots after up to 6 years of decomposition for species from semi-continental environments and 4 years of decomposition for species from mountain environments.
  • The tree species to be assessed: currently, we have information available on the decomposition of six species (oak, ash, black locust, poplar, larch and Scots pine).

3.1.3. Aggregation of Status Indicators to Obtain Criteria

After identifying and formalizing the status indicators, it is essential to establish the appropriate aggregations to evaluate each criterion based on the associated status indicators. The status indicators specific to tree vegetation are necessary to assess C.1, “Permeability of levee body”, and C.4, “Permeability of the foundation” (Figure 6). In this paragraph, we describe the aggregation of SI1.4, SI1.5, SI1.6 and SI1.7 to obtain the assessment of C.1 (Figure 12).
SI1.4, SI1.5, SI1.6 and SI1.7 thus make it possible to assess the propensity of flow due to the presence of tree vegetation: they are aggregated according to a phenomenological rationale. We first try to obtain the global root volume by the combination 1 (SI1.4 and SI1.5). Then, we aggregate the result of this first combination with SI1.6 in order to obtain an initial global characterization of the root systems (combination 2) present in the levee body of the analyzed segment. Finally, we combine this result with SI1.7, which allows for estimation of the flow propensity (combination 3) in the levee body affected by the presence of tree vegetation. All of these combinations are obtained using IF-THEN rules, grouped in truth tables that were defined during the sessions with the expert group (Figure 9). Finally, the propensity to flow due to the presence of tree vegetation (combination 3—Figure 12) will contribute to the assessment of C.1.
C.1 is assessed by IF-THEN rules given in the truth tables (TTs) TT1 to TT5. These tables are defined to obtain (i) the intrinsic permeability of levee body without considering the vegetation (TT1), (ii) an estimate of flow propensity due to the presence of vegetation (TT2, TT.3 and TT4) and (iii) the assessment of C.1 (TT5). The principle of the rules defined in TT5 is to downgrade the assessment of C.1 due to the presence of tree vegetation. Interested readers can find the entire method (formalization grid for state indicators and aggregation rules-truth table) in the Supplementary Materials, which include:

3.2. Application of Performance Assessing Method

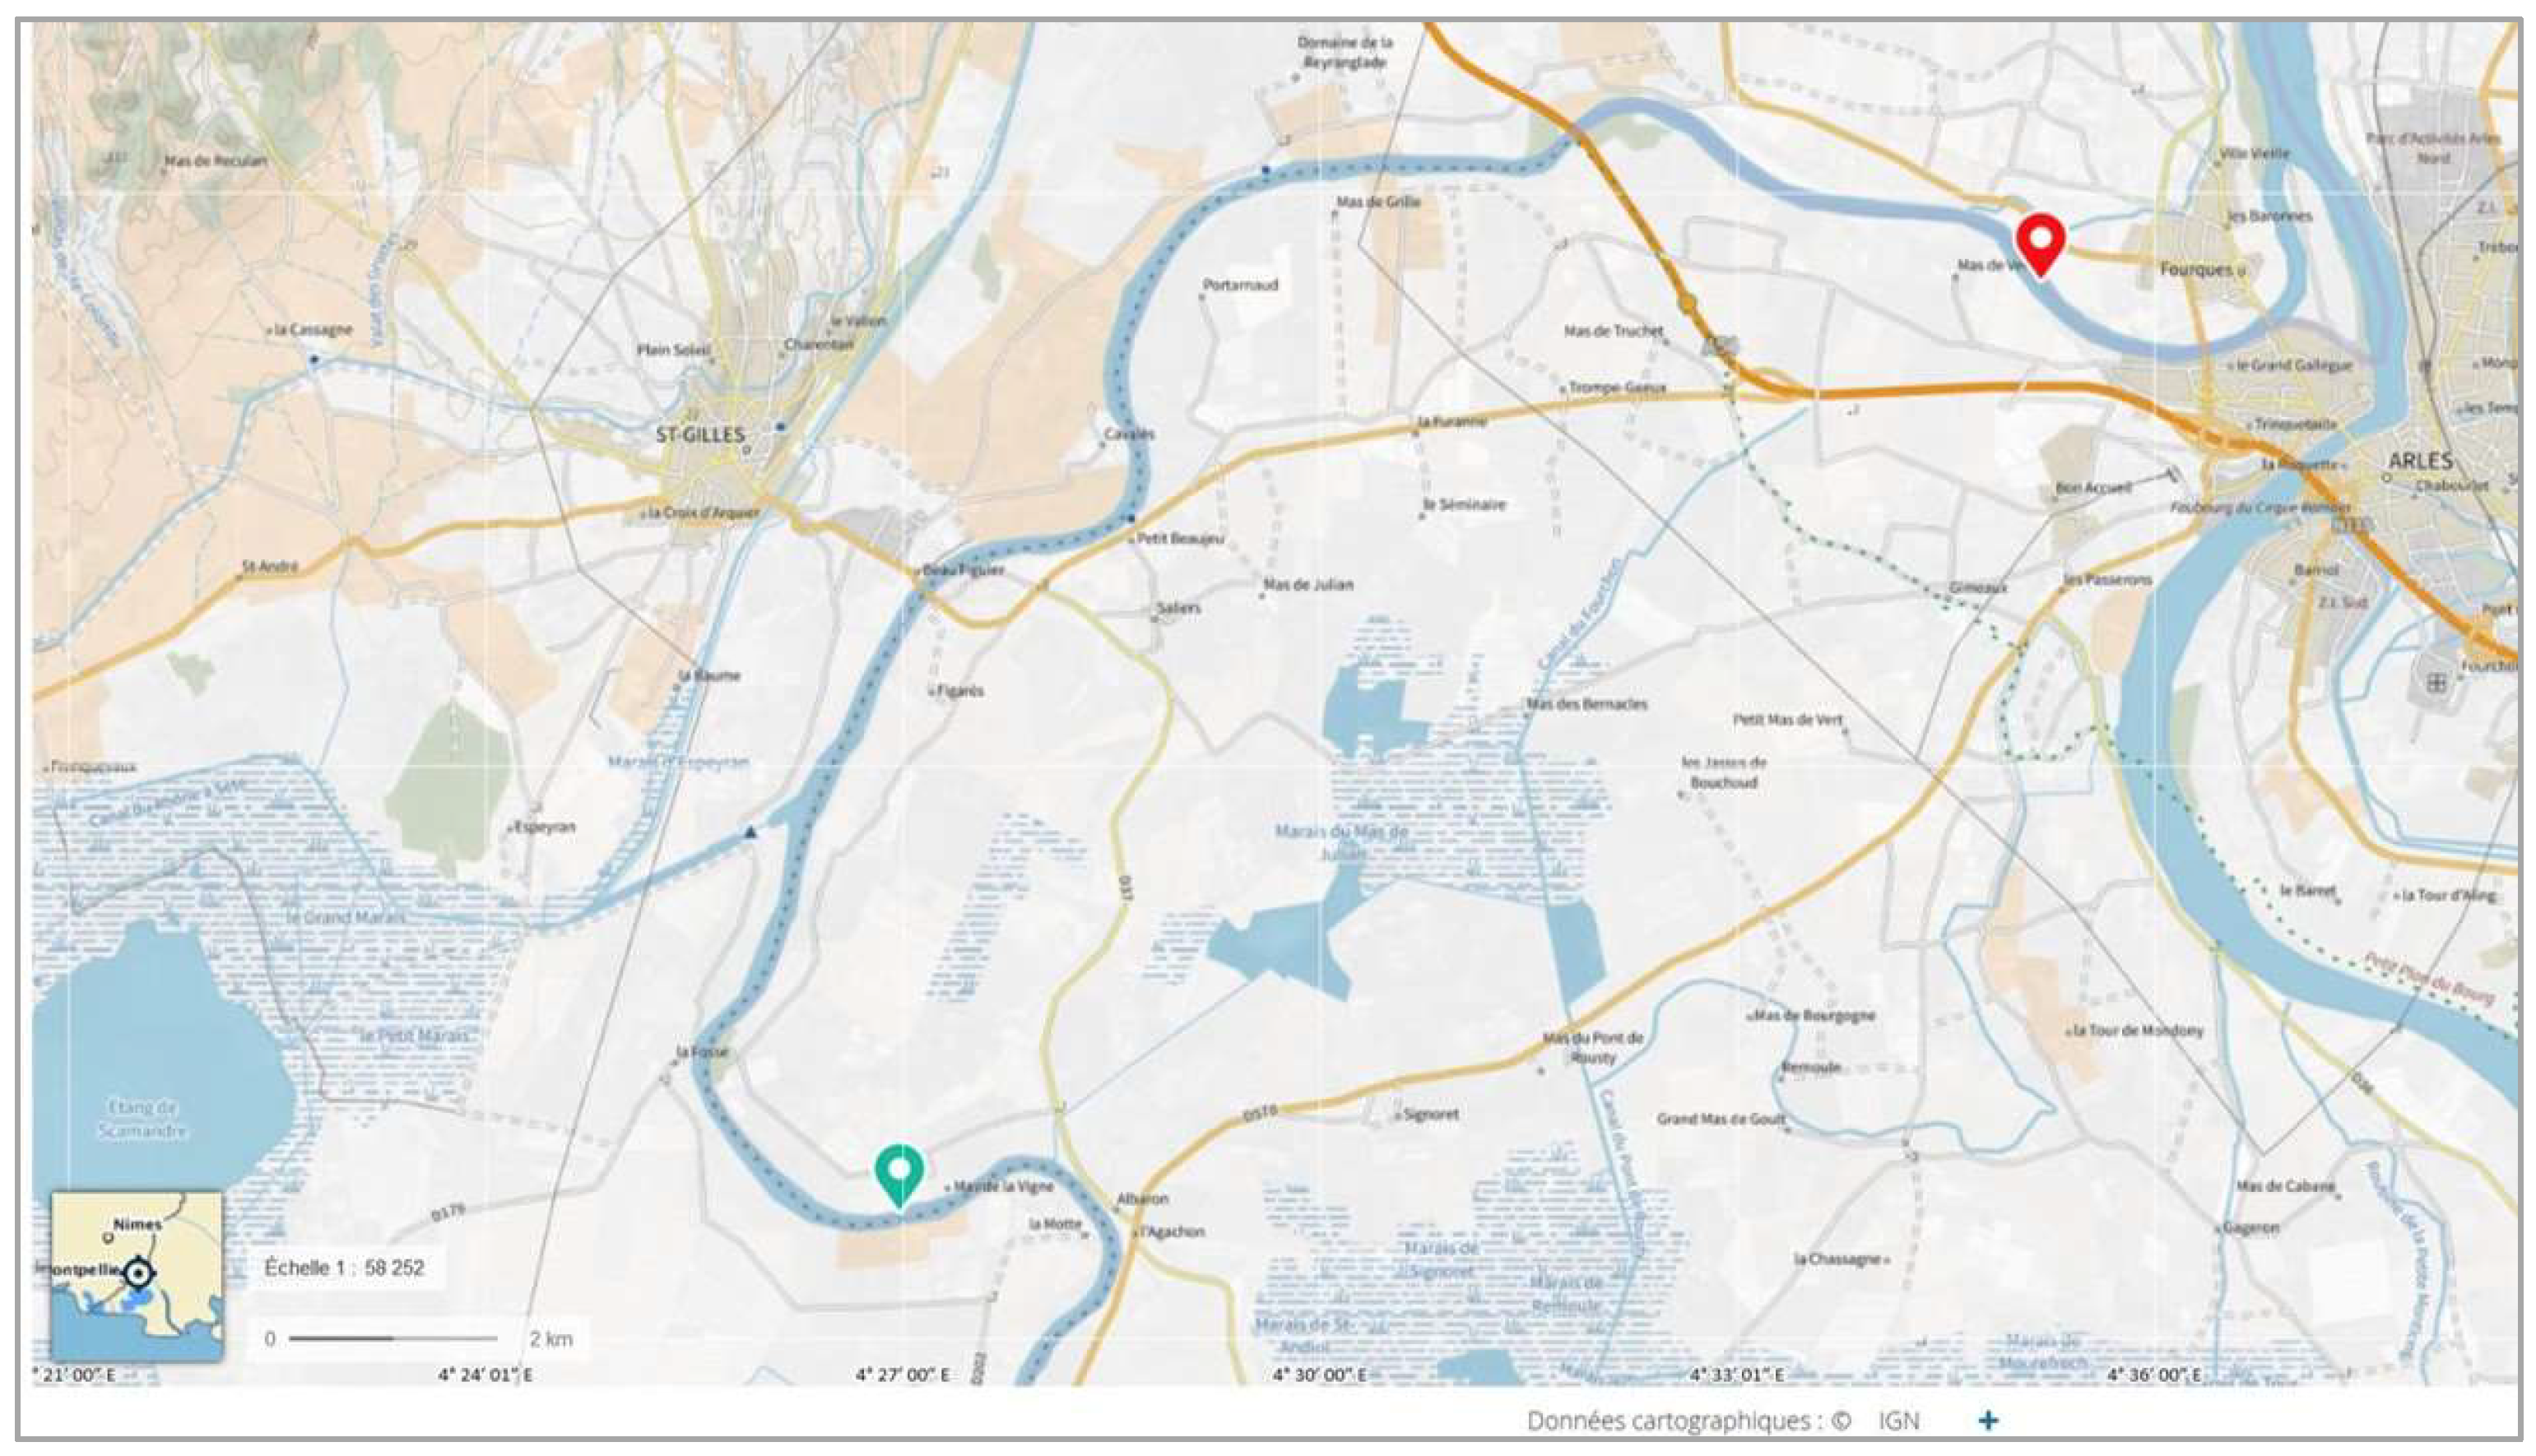
3.2.1. Presentation of the Case Study

The developed method has been applied operationally on flood protection levees in the south of France along the Rhone river (Mediterranean climate). For these structures, we have a set of recent data from the studies carried out for their reinforcement. The main geotechnical characteristics of the levee and the foundation for the two segments are known from geotechnical tests provided by the manager: core drilling, penetrometric testing, particle size analysis, Atterberg limits and permeability testing (Nasberg test). This provides precise knowledge on the type of soil, its grain size, cohesion, angle of friction and permeability. A synthetic file was created and given to the engineers to evaluate. For the assessment, the expert engineers had a scoring grid for each of the condition indicators to be assessed and a file containing the formalization grids for each indicator to guide the scoring. The scores obtained in the field were then used to implement the evaluation method in order to obtain the performance indicator. A session with the three experts was organized to discuss the consistency of the obtained results. Two applications were carried out on two levee segments (referred to as segments 1 and 2; Figure 13).
The two selected segments were considered homogeneous over their entire length (approximately 30 m for both segments) from the point of view of their geometric, geotechnical, hydraulic and biological characteristics (Figure 14).
The main characteristics of the two segments are as follows:
  • Segment 1: The heights of the structure on the water side and on the protected side are between 2 and 3 m. The slopes of the levee are 2.5/10 and 3/10 on the water and protected side, respectively. The width of the crest is 4.30 m (Figure 14a). The width between the levee and the low water channel is mostly less than 7 m. The levee overflows during 50-year floods. It is mainly made of clay–silt materials. The tree vegetation is mainly present at the foot of the levee on the water side and on the protected side, although a few individuals can be found in the middle of the slope on the water side. The main species is poplar.
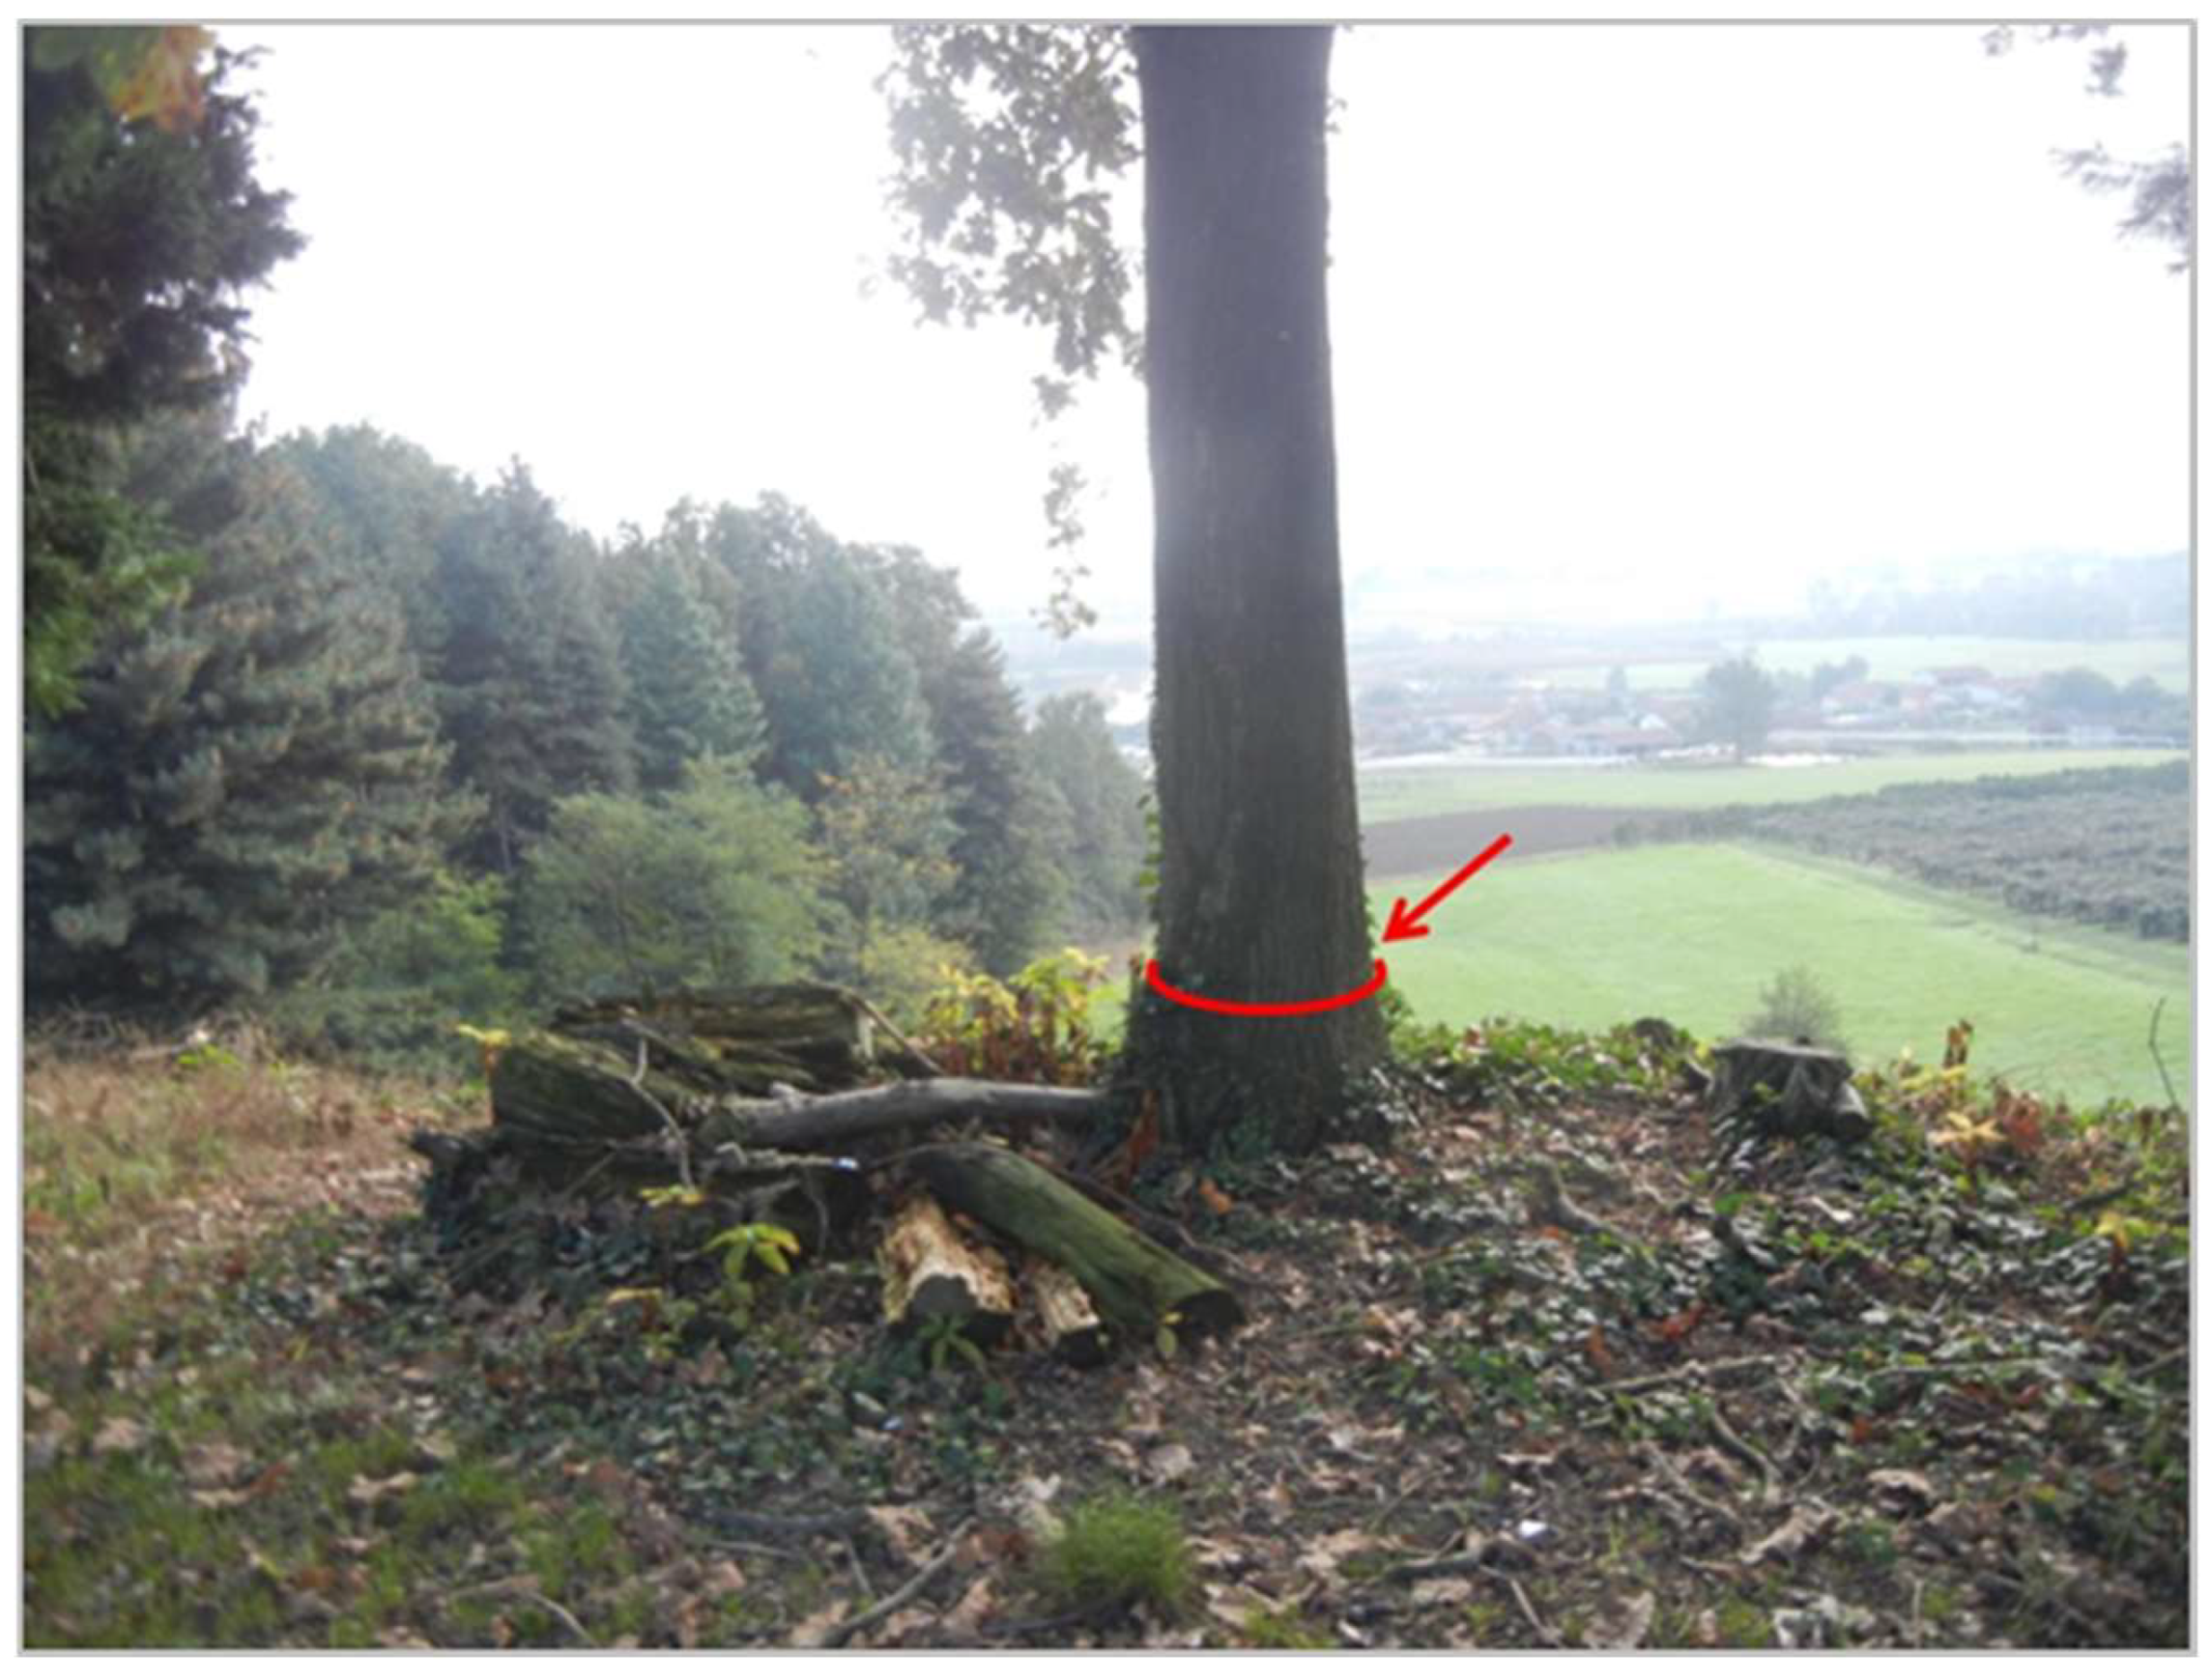
  • Segment 2: It has been reinforced and has a crest and berm width of approximately 9 m. The heights of the structure on the water side and on the protected side are about 4 m. The slopes of the two slopes are 3/10. The average distance between the levee and the low flow channel of the Rhone river is more than 50 m. Up to the 100-year flood line, the water line does not overflow and there is a safety margin of 0.50 m. The levee is mainly made of sandy–silt materials. The vegetation is present mainly at the foot of the levee and on the slope on the water side (Figure 14b). There are also a few trees at the foot of the slope, but these have no impact on the structure given the width of the segment. The present trees are mature. In the field, we observed a few cut trees, of which no trace of rejection was noted. The date of felling these trees was not known. The main species is poplar.
The main difference between these two profiles is that segment 2 includes decomposing tree stumps. This implies that the root system, which is not visible to the naked eye, is decomposing within the fill. In contrast, the trees in segment 1 are all in good health.

3.2.2. Assessment and Aggregation of Status Indicators

Table 7 presents the scores of the experts (same ones as for method construction) for the two segments that were studied.
This table summarizes the scores given to each of the status indicators. These methods do not show the direct status indicators (in bold in Table 2) that were not activated on the day of the assessment in the field.
Below, we describe the steps taken by the experts to assign scores to the state indicators and the aggregation results obtained for each criterion considering the presence of vegetation. This description is given for segment 1.
For C.1 (“Permeability of levee body”), SI1.2 (“Permeability of material”) was assessed as good (score of 8). Indeed, according to the core samples, the body of the levee is clayey–silty, providing the material with low permeability. The geometry of the levee was considered using the average score for SI1.3, “Geometry of levee body”, and was therefore assessed as fair (score of 6). The presence of tree vegetation was then assessed. SI1.4, “Density of individuals”, was assessed as poor (score of 5) because of the presence of one individual per 10 m2. SI1.5, “Root volume per individual”, was assessed as poor (score of 2). Indeed, a tree located on the representative segment of the levee had a trunk base circumference well above 30 cm. SI1.6, “Type of root structure of an individual”, was rated as poor (score of 4). These species, due to their genetic predisposition, tend to produce shallow or mixed roots. Finally, SI1.7, “Degree of decomposition of stump or woody roots of an individual”, was assessed as very good (score of 10). Indeed, the assessors identified no stumps or dead trees.
The aggregations to assess C.1 were performed using truth tables (example of table in Figure 9) and according to the aggregation diagram shown in Figure 12. First, the intrinsic permeability of the levee body was assessed by aggregating SI1.2 and SI1.3, obtaining an assessment considered “good” (score of 8). Then, the flow propensity due to the presence of tree vegetation (combination 3) was calculated by the method as poor (score of 5). Finally, C.1 was equal to 6, i.e., “fair” performance (Table 8—with vegetation).
For C.2 (“Resistance of levee body to internal erosion”), SI2.3 (“Sensitivity of levee body to internal erosion for the permanent load of the design flood”) was assessed as fair (score of 7). The experts rated SI2.5, “Duration of flood”, as unacceptable (0), as the most unfavorable flood was estimated to be long, given the size and permeability of the structure. The status indicator SI2.4 represents potential discontinuities within the earthfill. These discontinuities may be due to the construction of the earthfill (change in materials), the different stages of construction or even historical changes in the construction of the earthfill over time (repairs, raising, etc.). No discontinuity of the earthfill due to raising the structure or filling of a breach was present. SI2.4, “Sensitivity of discontinuity for the permanent load of the design flood”, was therefore rated as very good (score of 10). The first aggregation step was performed using truth tables (between SI2.3 and SI2.5 and, SI2.4 and SI2.5) and then the MIN operator was used to obtain the score of C.2. This criterion thus obtained a fair performance (score of 6; Table 8—with vegetation).
For C.4 (“Permeability of foundation”), SI4.2 (“Permeability of material”) was rated as fair (score of 7), while SI4.3 (“Geometry of foundation layer horizon of interest to levee”), relating to the geometry at the foundation horizon, was considered poor (score of 4). The rating of the status indicators necessary to assess the flow propensity of the foundation due to the presence of tree vegetation was of the same order of magnitude as that for the levee body, as most of the trees were located at the levee toe. However, there was a one-point difference between the combination (“Overall root volume”) of C.1 and C.4.
The aggregations to assess C.4 were performed using truth tables (example of table in Figure 9). First, the intrinsic permeability of the foundation was assessed by aggregating SI4.2 and SI4.3, and it obtained a “poor” assessment (score of 5). The propensity for flow due to the presence of tree vegetation assessed as “poor” (score of 4). C.4 was finally rated as poor (score of 3; Table 8—with vegetation).
For C.5 (“Resistance of foundation to internal erosion”), the potential for internal erosion resulted from the combination of SI5.3 (“Sensitivity of foundation to internal erosion for the permanent load of the design flood”, score of 8), and SI5.5 (“Duration of flood”, score of 0), thus obtaining a score of 8. No discontinuities were present in the foundation, so SI5.4 obtained a score of 10. The first aggregation step was performed using the truth tables TT1 for C5 and TT2 for C5. Combinations 1 and 2 were used to assess whether the susceptibility of each foundation to internal erosion was equal. The MIN operator was used to obtain the score of C.5, which was therefore considered to have good performance (score of 8; Table 8—with vegetation).
Regarding C.7 (“Resistance to levee body-foundation contact erosion”), SI7.2 (“Sensitivity to contact erosion at interface for the permanent load of the design flood”) was considered fair (score of 7). For the worst-case flood, SI7.3 (“Duration of flood”) was considered unacceptable (score of 0).
Table 7 shows the scores assigned to the status indicators SI7.2 and SI7.3, which were aggregated by TT1 and C7. The performance of C.7 was considered fair (score of 6; Table 8—with vegetation).
The experts, on the levee segment, observed no singularities. Consequently, C.3, C.6 and C.8 were assessed as very good (score of 10; Table 8—with vegetation).

3.2.3. Aggregation of Criteria to Obtain the Performance Indicator for the Two Segments

Table 8 summarizes the results of the assessments of the set of criteria as well as the final result corresponding to the performance of the segments with respect to the internal erosion deterioration mechanism. We obtained poor performance (score equal to 5) for segments 1 and 2 when taking into account the presence of vegetation. These two segments obtained the same score, but we can observe differences between them with regard to the evaluation of the criteria. Segment 2 scored poorly in criterion 1 due to the presence of decaying stumps (SI1.7) within the body of the levee. Segment 1 scored poorly in criterion 4 because of the geometry of the foundation (SI4.3). Aggregation of the criteria gave the same performance score for both segments, but the advantage of the method is that it can be traced back to the status indicators that gave rise to the score and thus to target the diagnosis to be carried out.
Finally, we want to underline that the assessment of a segment required 30 min to 1 h.

4. Discussion

The aim of this study was to develop a method that takes into account the presence of tree vegetation on levees or near levees. To this purpose, an analysis of the impact of the presence of tree vegetation on the internal erosion mechanism (Section 2.1) was carried out, followed by an improvement of the existing levee performance assessment method (Section 2.2). This work has a strong applicative vocation and was carried out considering the practices of the profession.
Few studies have sought to understand and assess the impact of tree vegetation on hydraulic structures [8,14,17,20,23]. In this study, we analyze more precisely the impact of tree vegetation on the internal erosion mechanism (see Section 2.1). However, other deterioration mechanisms, such as sliding instabilities or external erosion, which are also initiated or aggravated by the presence of trees, are not taken into account in this study and will be the subject of ongoing work. Other improvements could also be made, particularly considering other factors such as burrowing animals and contact erosion along ducts. In the future, we would eventually like to propose performance assessment methods for all the potential mechanisms of levee deterioration. Indeed, this type of method can be used to assess the performance of levees in relation to other failure modes, such as scouring, external erosion, internal erosion caused by burrowing animals, ducts and so on.
The work was performed in France. However, the formalized indicators can be applied to other locations around the world. In fact, we tested the method with Italian experts in hydraulic engineering, who found it relevant. More generally, the geometric, geotechnical and hydraulic indicators reflect the management practices used in many countries. The vegetation indicators (density of individuals, root volume per individual, type of root structure of individuals, degree of decomposition of stump or woody roots of an individual) are also relevant for applications elsewhere in the world, as their aggregation (Figure 12) represents the flow propensity due to the presence of vegetation. The indicators have been formalized for four species classified as mountainous (oak, ash, Scots pine, larch) and semi-continental (poplar, black locust), and this method can potentially be used for structures containing such species elsewhere in the world. If other species are present on the levee, the evaluation grid for indicator SI1.7 (degree of decomposition of the stump or woody roots of an individual (levee body)) should be redefined.
It is interesting to analyze the influence of tree vegetation on the performance rating of the structure. Table 8 presents the calculations performed with and without taking vegetation into account (to obtain the “without vegetation” scores, SI1.4, SI1.5, SI1.6 and SI1.7 as well as SI4.4, SI4.5, SI4.6 and SI4.7 were given a score of 10 by default). We observe that considering vegetation improves the sensitivity of the method, and taking tree vegetation into account has a non-negligible influence on C.1 (“Permeability of levee body”) and C.4 (“Permeability of foundation”) concerning vegetation as well as on the score of the performance indicator. Thus, if we compare the segments, we can see differences in the assessment due to vegetation being taken into account. For C.1, the scores are 6 (segment 1) and 2 (segment 2) when taking vegetation into account, whereas they are, respectively, 8 and 9 without taking it into account. Similarly, for C.4, the scores are 3 (segment 1) and 6 (segment 2) when taking vegetation into account, whereas they are, respectively, 5 and 9 without it. Finally, for the performance indicator against internal erosion, the scores are 5 for both sections when taking vegetation into account, while they are 6 (segment 1) and 7 (segment 2) without it. The performance of the two levee segments then goes from “fair” performance without considering vegetation to “poor” performance when considering it. The inclusion of tree vegetation in the method for assessing the performance of the internal erosion mechanism thus makes it possible to refine the method and bring it closer to the real performance of a levee. The fact that the result moves from one qualitative category to another is important and relevant. The experts who carried out the ratings consider that this change in class coincided well with the assessments they would have made without the method. Therefore, this method makes it possible to simulate expert reasoning by guiding the user through the formalization of state indicators, reduces the subjectivity of assessments and adds robustness to the elicitations made by the users.
The advantage of this method is that it can be applied to any homogeneous segment of a levee at different time steps (performance monitoring over time); for instance, according to tree growth.
Furthermore, this assessment method has the advantage of analyzing the weak points of the levee before they experience flooding and before potential failures lead to damage in protected areas. The weak points are determined through the assessment of the performance of its different parts: the levee body, foundation and levee body–foundation interface. In our example, we noticed that the performance of segment 1 was weaker at the levee body/foundation interface, while the performance of segment 2 was weaker for the levee body than segment 1. If we then analyze the scores of each of the criteria and the scores attributed to each of the status indicators, we can then target the causes of the loss of levee performance and, thus, the maintenance or repair actions to carry out.

5. Conclusions

The method proposed in this study is intended to be used as a decision aid for engineers and managers to assess the performance of levee segments and prioritize maintenance actions between several segments. The main interest of this method is the ability to target the weak points of a levee. The poor scores of the status indicators that lead to a poor performance score mainly reflect these weak points. This advantage makes it possible to design targeted interventions for structural repair to prevent rupture in the event of floods.
The main contribution of this work is the identification of four status indicators specific to vegetation, accounting for the influence of the presence of trees on the levee, which can be factors that initiate or aggravate internal erosion mechanisms. The proposed method allows such situations to be taken into account in detail, firstly in terms of the amount of vegetation that has an impact, through two status indicators—“Density of individuals” and “Root volume per individuals”—and then in terms of the severity of the mechanism, with two other status indicators: “Type of root structure” and “Degree of decomposition”. Finally, these different status indicators allow us to assess the “Propensity to flow linked to the presence of vegetation”. The results of the application tests demonstrated that this method is sensitive to the presence of vegetation and that it is able to efficiently represent the situations of levees with tree vegetation encountered in the field.
This method is also proposed for use by non-expert engineers and technicians, allowing them to assess the performance of levees with regard to internal erosion deterioration mechanisms regardless of whether the levees are subject to tree development or not. Interested readers can find the entire method (formalization grid for state indicators and aggregation rules-truth table) in the additional materials.
A future direction relating to the research in this work would be to propose a technical guide explaining the complete methodology for assessing the performance of a section of a levee with regard to internal erosion. In addition, the guide could provide a catalog of the most problematic plant species. These could be classified based on field data according to the structure of their root systems in relation to the type of environment, their lifespan and the rate of decomposition of large roots after the tree’s death.

Supplementary Materials

The following supporting information can be downloaded at https://www.mdpi.com/article/10.3390/geotechnics5020030/s1, Figure S1. Hierarchical structure of the method; Figure S2. Diagram of aggregation of status indicators for the assessment of criterion C.1 “Permeability of levee body” (SIi: status indicator; C.i: criterion; TT.i, C.i: truth table); Table S1. Grid formalizing the status indicator SI1.1 “Leaks, evidence of leaks (clear water)”; Table S2. Grid formalizing the status indicator SI1.2“Permeability of material”; Table S3. Grid formalizing the status indicator SI1.3“Geometry of levee body”; Table S4. Grid formalizing the status indicator SI1.4 “Density of individuals”; Table S5. Grid formalizing the status indicator SI1.5 “Root volume per individual”; Table S6. Grid formalizing the status indicator SI1.6 “Type of root structure of individuals”; Figure S3. Decision tree for determining the type of root structure; Table S7. Grid formalizing the status indicator SI1.7 “Degree of decomposition of stump or woody roots of an individual”; Figure S4. Truth table of expert TT.1 for the aggregation of indicators SI1.2 and SI1.2 of criterion C.1 “Permeability of levee body”. The colors used correspond to the rating scale (Figure 8 in the manuscript). The gray lines correspond to values deemed non-pertinent or possible for the status indicator; Figure S5. Truth table of expert TT.3 (case 1: Running roots or mixed roots) for the aggregation of combination 1 “Overall root” and SI1.6 of criterion C.1 “Permeability of levee body”. The colors used correspond to the rating scale (Figure 8 in the manuscript). The gray lines correspond to values deemed non-pertinent or possible for the status indicator; Figure S6. Truth table of expert TT.3 (case 2: Taps roots or shallow roots) for the aggregation of combination 1 “Overall root” and SI1.6 of criterion C.1 “Permeability of levee body”. The colors used correspond to the rating scale (Figure 8 in the manuscript). The gray lines correspond to values deemed non-pertinent or possible for the status indicator; Figure S7. Truth table of expert TT.4 for the aggregation of combination 2 “Root Characterization” and SI1.7 of criterion C.1 “Permeability of levee body”. The colors used correspond to the rating scale (Figure 8 in the manuscript). The gray lines correspond to values deemed non-pertinent or possible for the status indicator; Figure S8. Truth table of expert TT.5 for the aggregation of “Intrinsic permeability” and combination 3 “Flow propensity” of criterion C.1 “Permeability of levee body”. The colors used correspond to the rating scale (Figure 8 in the manuscript). The gray lines correspond to values deemed non-pertinent or possible for the status indicator; Figure S9. Diagram of aggregation of status indicators for the assessment of criterion C.2 “Resistance of levee body to internal erosion” (SIi: status indicator; C.i: criterion; TT.i, C.i: truth table; MIN: Minimum); Table S8. Grid formalizing the status indicator SI2.1 “Sinkhole, collapse cone”; Table S9. Grid formalizing the status indicator SI2.2 “Loaded leaks, indications of loaded leaks”; Table S10. Grid formalizing the status indicator SI2.3 “Sensitivity of levee body to internal erosion for the permanent load of the reference flood”; Table S11. Grid formalizing the status indicator SI2.4 “Sensitivity of discontinuity for the permanent load of the reference flood”; Table S12. Grid formalizing the status indicator SI2.5 “Duration of flood”; Figure S10. Truth table of expert TT.1 for the aggregation of indicators SI2.3 and SI2.5 of criterion C.2 “Resistance of levee body to internal erosion”. The colors used correspond to the rating scale (Figure 8 in the manuscript); Figure S11. Truth table of expert TT.2 for the aggregation of indicators SI2.4 and SI2.5 of criterion C.2 “Resistance of levee body to internal erosion”. The colors used correspond to the rating scale (Figure 8 in the manuscript); Figure S12. Diagram of aggregation of status indicators for the assessment of criterion C.4 “Permeability of foun-dation” (SIi: status indicator; C.i: criterion; TT.i, C.i: truth table); Table S13. Grid formalizing the status indicator SI4.1 “Leaks (water) or signs of leaks (damp areas) in the foundation”; Table S14. Grid formalizing the status indicator SI4.2 “Permeability of foundation material”; Table S15. Grid formalizing the status indicator SI4.3 “Geometry of the foundation horizon”; Table S16. Grid formalizing the status indicator SI4.4 “Density of individuals (foundation)”; Table S17. Grid formalizing the status indicator SI4.5“Root volume per individual (foundation)”; Table S18. Grid formalizing the status indicator SI4.6“Type of root structure of individuals (foundation)”; Table S19. Grid formalizing the status indicator SI4.7 “Degree of decomposition of the stump or woody roots of an individual (foundation)”; Figure S13. Truth table of expert TT.1 for the aggregation of indicators SI4.2 and SI4.3 of criterion C.4 “Permeability of foundation”. The colors used correspond to the rating scale (Figure 8 in the manuscript). The gray lines correspond to values deemed non-pertinent or possible for the status indicator; Figure S14. Truth table of expert TT.2 for the aggregation of indicators SI4.4 and SI4.5 of criterion C.4” Permeability of foundation”. The colors used correspond to the rating scale (Figure 8 in the manuscript). The gray lines correspond to values deemed non-pertinent or possible for the status indicator; Figure S15. Truth table of expert TT.3 (case 1: Running roots or mixed roots) for the aggregation of combination 1 “Overall root” and SI1.6 of criterion C.4 “Permeability of foundation”. The colors used correspond to the rating scale (Figure 8 in the manuscript). The gray lines correspond to values deemed non-pertinent or possible for the status indicator; Figure S16. Truth table of expert TT.3 (case 2: Taps roots or shallow roots) for the aggregation of combination 1 “Overall root” and SI1.6 of criterion C.1 “Permeability of foundation”. The colors used correspond to the rating scale (Figure 8 in the manuscript). The gray lines correspond to values deemed non-pertinent or possible for the status indicator; Figure S17. Truth table of expert TT.4 for the aggregation of combination 2 “Root Characterization” and SI1.7 of criterion C.4 “Permeability of foundation”. The colors used correspond to the rating scale (Figure 8 in the manuscript). The gray lines correspond to values deemed non-pertinent or possible for the status indicator; Figure S18. Truth table of expert TT.5 for the aggregation of “Intrinsic permeability” and combination 3 “Flow propensity” of criterion C.4 “Permeability of foundation”. The colors used correspond to the rating scale (Figure 8 in the manuscript). The gray lines correspond to values deemed non-pertinent or possible for the status indicator; Figure S19. Diagram of aggregation of status indicators for the assessment of criterion C.5 “Resistance of foundation to internal erosion” (SIi: status indicator; C.i: criterion; TT.i, C.i: truth table); Table S20. Grid formalizing the status indicator SI5.1 “Sinkhole, collapse cone (foundation)”; Table S21. Grid formalizing the status indicator SI5.2 “Loaded leaks, indications of loaded leaks – foundation”; Table S22. Grid formalizing the status indicator SI5.3 “Sensitivity of foundation to internal erosion for the permanent load of the design flood”; Table S23. Grid formalizing the status indicator SI5.4 “Sensitivity of foundation heterogeneities or discontinuities to the permanent load of the reference flood–foundation”; Table S24. Grid formalizing the status indicator SI5.5 “Duration of flood–Foundation”; Figure S20. Truth table of expert TT.1 for the aggregation of indicators SI5.3 and SI5.5 of criterion C.5 “Resistance of foundation to internal erosion”. The colors used correspond to the rating scale (Figure 8 in the manuscript); Figure S21. Truth table of expert TT.2 for the aggregation of indicators SI5.4 and SI5.5 of criterion C.2 “Resistance of foundation to internal erosion”. The colors used correspond to the rating scale (Figure 8 in the manuscript); Figure S22. Diagram of aggregation of status indicators for the assessment of criterion C.7 “Erosion resistance of levee body-foundation contact” (SIi: status indicator; C.i: criterion; TT.i, C.i: truth table); Table S25. Grid formalizing the status indicator SI7.1 “Leaks, resurgence, water inflow–interface between the body levee and the foundation”; Table S26. Grid formalizing the status indicator SI7.2 “Sensitivity to contact erosion at the interface for the permanent load of the reference flood”; Table S27. Grid formalizing the status indicator SI7.3 “Duration of flood–interface levee body and foundation”; Figure S23. Truth table of expert TT.1 for the aggregation of indicators SI7.2 and SI7.3 of criterion C.7 “Erosion resistance of levee body-foundation contact”. The colors used correspond to the rating scale (Figure 8 in the manuscript); Figure S24. Diagram of aggregation of criteria for the assessment of performance indicator for the internal ero-sion deterioration mechanism (C.i: criterion; Ai: aggregation by MIN: minimum; Ai: aggregation by weighted average: [(1/3) C.i; (2/3) C.j]; i, j: index).

Author Contributions

Conceptualization, C.C. and L.P.; methodology, G.B., C.C., L.P., and R.T.; validation, L.P. and R.T.; formal analysis, G.B., C.C., L.P., and R.T.; investigation, G.B.; resources, C.C., L.P., and R.T.; writing—original draft preparation, G.B.; visualization, G.B.; supervision, C.C.; project administration, C.C. and L.P.; funding acquisition, C.C. and L.P. All authors have read and agreed to the published version of the manuscript.

Funding

The authors thank Provence-Alpes-Côte d’Azur Region and European Union for their financial support. The authors also thank all partners of the RISBA project (RISque des BArrages–Interreg Alcotra project 2007–2013), which allowed many Franco-Italian applications.

Data Availability Statement

The data presented in this study are openly available in the article and in the Supplementary Material.

Acknowledgments

The authors thank the SYMADREM for its involvement and for having allowed us to carry out our applications on their structures.

Conflicts of Interest

The authors declare no conflicts of interest. The funders had no role in the design of the study; in the collection, analyses or interpretation of data; in the writing of the manuscript; or in the decision to publish the results.

Abbreviations

The following abbreviations are used in this manuscript:
C.iCriterion
SI.i.iStatus indicator
MINMinimum
TT.iTruth table

References

  1. Girolami, L.; Bonelli, S.; Valois, R.; Chaouch, N.; Burgat, J. On Internal Erosion of the Pervious Foundation of Flood Protection Dikes. Water 2023, 15, 3747. [Google Scholar] [CrossRef]
  2. Bridle, R. Internal Erosion Mechanics and Risk Estimation Based on ICOLD Bulletin 164; ASCE Publishing: Reston, VA, USA, 2017. [Google Scholar]
  3. International Commission on Large Dams (ICOLD). Internal Erosion of Existing Dams, Levees and Dikes, and Their Foundations: Case Histories, Investigations, Testing, Remediation and Surveillance; CRC Press: London, UK, 2025. [Google Scholar]
  4. Curt, C.; Peyras, L.; Boissier, D. A Knowledge Formalization and Aggregation-Based Method for the Assessment of Dam Performance. Comput.-Aided Civ. Infrastruct. Eng. 2010, 25, 171–184. [Google Scholar] [CrossRef]
  5. Özer, I.E.; van Damme, M.; Jonkman, S.N. Towards an International Levee Performance Database (ILPD) and Its Use for Macro-Scale Analysis of Levee Breaches and Failures. Water 2020, 12, 119. [Google Scholar] [CrossRef]
  6. CIRIA. The International Levee Handbook; CIRIA: London, UK, 2013. [Google Scholar]
  7. Rivera-Hernandez, X.A.; Ellithy, G.S.; Vahedifard, F. Integrating Field Monitoring and Numerical Modeling to Evaluate Performance of a Levee under Climatic and Tidal Variations. J. Geotech. Geoenviron. Eng. 2019, 145, 05019009. [Google Scholar] [CrossRef]
  8. Bambara, G.; Curt, C.; Mériaux, P.; Vennetier, M.; Vanloot, P. Modular assessment of the performance of embankment dams. Eur. J. Environ. Civ. Eng. 2018, 22, 315–337. [Google Scholar] [CrossRef]
  9. Vuillet, M.; Peyras, L.; Carvajal, C.; Serre, D.; Diab, Y. Levee performance evaluation based on subjective probabilities. Eur. J. Environ. Civ. Eng. 2013, 17, 329–349. [Google Scholar] [CrossRef]
  10. Akerkar, R.; Sajja, P. Knowledge-Based Systems; Jones & Bartlett Publishers: Burlington, MA, USA, 2009. [Google Scholar]
  11. Booker, J.M.; McNamara, L.A. Solving black box computation problems using expert knowledge theory and methods. Reliab. Eng. Syst. Saf. 2004, 85, 331–340. [Google Scholar] [CrossRef]
  12. Shield, F.; Gray, D. Effects of Woody Vegetation on Sandy Levee Integrity. Water Resour. Bulletin. 1992, 28, 917–931. [Google Scholar] [CrossRef]
  13. Haselsteiner, R.; Kerres, D. The Rehabilitation of Levees with Large Trees by Equivalent Static Systems. In Proceedings of the Symposium on Sustainable Development of Dams and River Basins, New Delhi, India, 24–27 February 2021. [Google Scholar]
  14. FEMA. Technical Manual for Dam Owners: Impacts of Plants on Earthen Dams (Fema 534/September 2005); Books Express Publishing, US Department of Homeland Security: Washington, DC, USA, 2005. [Google Scholar]
  15. Laasonen, J. Risk of the trees and stumps to the embankment dam safety. Experimental study. In Proceedings of the International Economic Conference, Sibiu, Romania, 17–18 May 2013. [Google Scholar]
  16. Martinez Santamaria, J.M.; Fernandez Serrano, R. Geotechnical impact on small earth dams caused by vegetation growth as a result of inadequate maintenance activity. In Dam Maintenance and Rehabilitation II; CRC Press: Boca Raton, FL, USA, 2011; pp. 229–236. [Google Scholar]
  17. Meriaux, P.; Vennetier, M.; Aigouy, S.; Hoonakker, M.; Zylberblat, M. Diagnosis and management of plant growth on embankment dams and dykes. In Proceedings of the ICOLD, 22nd Conference on Large Dams, Barcelona, Spain, 18–23 June 2006; pp. 1–20. [Google Scholar]
  18. Zanetti, C.; Vennetier, M.; Mériaux, P.; Provensal, M. Plasticity of tree root system structure in contrasting soil materials and environmental conditions. Plant Soil 2015, 387, 21–35. [Google Scholar] [CrossRef]
  19. Bambara, G. Evaluation De La Performance Des Ouvrages Hydrauliques En Remblai Soumis À La Présence De Végétation Arborescente. Ph.D. Thesis, Aix-Marseille University, Marseille, France, 2016. [Google Scholar]
  20. Zanetti, C.; Vennetier, M.; Mériaux, P.; Royet, P.; Provansal, M. Managing woody vegetation on earth dikes: Risks assessment and maintenance solutions. Procedia Environ. Sci. 2011, 9, 196–200. [Google Scholar] [CrossRef]
  21. Vuillet, M. Élaboration D’un Modèle D’aide à la Décision Probabiliste Pour L’évaluation de la Performance Des Digues Fluviales. Ph.D. Thesis, Paris Est University, Créteil, Val de Marne, France, 2012. [Google Scholar]
  22. Kostler, J.N.; Bruckner, E.; Bibelriether, H. The Root Systems of Forest Trees; CABI: Wallingford, UK, 1968. [Google Scholar]
  23. Vennetier, M.; Zanetti, C.; Meriaux, P.; Mary, B. Tree root architecture: Lessons from a comprehensive study on dykes. Plant Soil 2015, 387, 81–101. [Google Scholar] [CrossRef]
  24. Courivaud, J.R.; Fry, J.J.; Deroo, L.; Bonelli, S. Risk analysis of internal erosion in embankment dams: Operational and under development methods. In Colloque CFBR: « Justification Des Barrages: Etat De L’Art Et Perspectives»; Colloque CFBR: Chambéry, France, 2019. [Google Scholar]
  25. Sandström, F.; Petersson, H.; Kruys, N.; Ståhl, G. Biomass conversion factors (density and carbon concentration) by decay classes for dead wood of Pinus sylvestris, Picea abies and Betula spp. in boreal forests of Sweden. For. Ecol. Manag. 2007, 243, 19–27. [Google Scholar] [CrossRef]
  26. Tobin, B.; Black, K.; McGurdy, L.; Nieuwenhuis, M. Estimates of decay rates of components of coarse woody debris in thinned Sitka spruce forests. Forestry 2007, 80, 455–469. [Google Scholar] [CrossRef]
  27. Renvall, P. Community structure and dynamics of wood-rotting Basidiomycetes on decomposing conifer trunks in northern Finland. Karstenia 1995, 35, 1–51. [Google Scholar] [CrossRef]
Figure 1. Types of root structures [19].
Geotechnics 05 00030 g001
Figure 2. Principles of the four main internal erosion mechanisms. Figure adapted from the ILH [6].
Geotechnics 05 00030 g002
Figure 3. Development of roots at the interface of the levee body–foundation of the Cuxac canal (France) favoring contact erosion (photo: Mériaux P.).
Geotechnics 05 00030 g003
Figure 4. Example of a pipe left by a large ligneous root after its decomposition in a structure (photo: Zanetti, C.).
Geotechnics 05 00030 g004
Figure 5. Hierarchical structure of the method in [4,19].
Geotechnics 05 00030 g005
Figure 6. Method for assessing the performance of a river levee with respect to the internal erosion deterioration mechanism (C.i: criterion; A.i: aggregation; MIN: minimum; weighted average: [(1/3) C.i; (2/3) C.j]; i, j: index)—adapted from [9,21].
Geotechnics 05 00030 g006
Figure 7. Approach of the knowledge-based method [9].
Geotechnics 05 00030 g007
Figure 8. Double rating scale chosen to assess the performance of levees subject to the presence of tree vegetation.
Geotechnics 05 00030 g008
Figure 9. Truth table of expert TT.2 for the aggregation of indicators SI1.4 and SI1.5 of criterion C.1 “Permeability of levee body”. The colors used correspond to the rating scale (Figure 8). The gray lines correspond to values deemed non-pertinent or possible for the status indicator.
Geotechnics 05 00030 g009
Figure 10. Measure of the trunk base (in red) for rating the status indicator “Root volume per individual” (photo: Bambara G.).
Geotechnics 05 00030 g010
Figure 11. Key to aid identification of the root structure of an individual taken from [18,23].
Geotechnics 05 00030 g011
Figure 12. Diagram of aggregation of status indicators for assessment of criterion C.1, “Permeability of levee body” (SIi: status indicator; C.i: criterion; TT.i, C.i: truth table).
Geotechnics 05 00030 g012
Figure 13. Map showing the locations of the segments (red dot: segment 1; green dot: segment 2) (© IGN 2023—all rights reserved—Géoportail, the national portal to territorial knowledge).
Geotechnics 05 00030 g013
Figure 14. Photographs of the two segments (Photograph: Bambara G. and Curt C.). (a) Segment 1; (b) Segment 2.
Geotechnics 05 00030 g014
Table 1. Grid formalizing the status indicator “Geometry of levee body”.
NameSI1.3—Geometry of Levee Body
DefinitionThe geometric characteristics of a levee are defined by its height, base width and crest width. It is a ratio of the base width to crest height.
According to the ILH [6], an average levee is about 4 m at the crest.
Operating modeThe determination of the levee geometry results from elements of the design and build file or, by default, topographical surveys during an inspection.
Scale and references 8–10: wide geometry
6–7: average geometry
2–5: narrow geometry
Characteristic of locationThe cross-section of the analyzed homogeneous levee.
Characteristic of time Once during design or according to need via topographical survey.
Table 2. Indicators related to the different criteria necessary to assess the performance of a homogeneous earthfill levee in the case of internal erosion. Direct indicators are marked in bold and status indicators specific to tree vegetation are marked in green and bold.
CriteriaIndicators
C.1: Permeability of levee bodySI1.1: Leaks, evidence of leaks (clear water)
SI1.2: Permeability of material
SI1.3: Geometry of levee body
SI1.4: Density of individuals
SI1.5: Root volume per individual
SI1.6: Type of root structure of individuals
SI1.7: Degree of decomposition of stump or woody roots of an individual
C.2: Resistance of levee body to internal erosion SI2.1: Sinkhole, collapse cone
SI2.2: Loaded leaks, indications of loaded leaks
SI2.3: Sensitivity of levee body to internal erosion for the permanent load of the design flood
SI2.4: Sensitivity of discontinuity for the permanent load of the design flood
SI2.5: Duration of flood
C.4: Permeability of foundation SI4.1: Leaks or evidence of leaks (clear water)
SI4.2: Permeability of material
SI4.3: Geometry of foundation layer horizon of interest to levee
SI4.4: Density of individuals
SI4.5: Root volume per individual
SI4.6: Type of root structure of individuals
SI4.7: Degree of decomposition of the stump or woody roots of an individual
C.5: Resistance of foundation to internal erosion SI5.1: Sinkhole
SI5.2: Leaks, resurgences, evidence of loaded leaks
SI5.3: Sensitivity of foundation to internal erosion for the permanent load of the design flood
SI5.4: Sensitivity of heterogeneities or discontinuities for the permanent load of the design flood
SI5.5: Duration of flood
C.7: Resistance to levee body–foundation contact erosion SI7.1: Leaks, resurgences, evidence of loaded leaks
SI7.2: Sensitivity to contact erosion at interface for the permanent load of the design flood
SI7.3: Duration of flood
Table 3. Grid formalizing the status indicator “Density of individuals present in levee body”.
NameSI1.4—Density of Individuals (Levee Body)
DefinitionThe higher the density of individuals, the greater the number of heterogeneities of permeability can appear in the earthfill, notably during the decomposition of root systems (this indicator primarily concerns large trees).
Source of data acquisitionThe measurement of this indicator is carried out in the field by recording (for each homogeneous section analyzed) the number of individuals present per plot of 10 m2.
Scale and reference10: absence of individuals
5–4: presence of an individual per 10 m2
3–2: presence of 2 to 5 individuals per 10 m2
1–0: presence of >5 individuals per 10 m2
Characteristic of locationSection of levee analyzed composing the levee body.
Characteristic of timeMeasure performed during a visual inspection focused on qualifying the vegetation present on the structure.
Table 4. Grid formalizing the status indicator “Root volume per individual (levee body)”.
NameSI1.5—Root Volume per Individual (Levee Body)
DefinitionThe root system grows as the tree ages. Thus, an individual whose stump has a large circumference leads to the assumption of a large root volume and thus of a considerable hold of the root system in the structure. It is important to know this parameter to predict consequences in terms of the global increase in the permeability of the earthfill during the decomposition of the root system.
Source of data acquisition The measure of this indicator is performed on site by measuring the circumference of the base of the tree.
Scale and reference 8: small stump circumference—small root volume (circumference < 10 cm)
7–6: 10 < circumference < 15 cm
5–4: 15 < circumference < 30 cm
3–2: circumference > 30 cm
Characteristic of location Section of homogeneous levee composing the levee body.
Characteristic of time Measure performed during a visual inspection focused on qualifying the vegetation present on the structure.
Table 5. Grid formalizing the status indicator “Type of root structure of individuals (levee body)”.
NameSI1.6—Type of Root Structure of Individuals (Levee Body)
DefinitionThe type of tree root structure is determined genetically for each species but is nevertheless qualified as opportunistic with respect to constraints related to soil characteristics and root access to water and nutrients.
Two types of root structures can be distinguished: the shallow roots/mixed root structure and the tap root/running root structure.
Note that a mixed root structure is one that includes a pivot but also tracer roots.
The structure of the root systems depends, as mentioned above, on several more or less preponderant factors. We can organize them in the following hierarchical manner: granulometry (texture of the materials), access to water and nutrients (more organic soil layer), slope and species (genetic character).
Source of data acquisition Measuring this indicator requires several data:
  • Knowledge of the granulometry of the structure (measure by instrument or information from a design–build file);
  • Access to water (measure by instrument—position of groundwater, its rise and fall);
  • Position of the tree on the levee (visual observations);
  • Species—genetic predisposition (visual observations).
After obtaining these different data, decision tree permits accessing information on the root structure of the studied tree.
Scale and reference Case 1: presence of shallow or mixed roots as a function of the different zones of the levee.
5–4: presence of shallow or mixed roots on the slope and upstream toe of the levee as well as on the crest zone.
3: presence of shallow or mixed roots on the slope and downstream toe of the levee.
Case 2: presence of tap or running roots depending on the different zones of the levee.
6–5: presence of tap or running roots on the upstream slope of the levee and on the crest zone.
5–4: presence of tap or running roots on the downstream slope of the levee.
Characteristic of location Homogenous section of analyzed levee composing the levee body.
Characteristic of time Measure performed during a survey to qualify the vegetation present on the structure.
Table 6. Grid formalizing the status indicator “Degree of decomposition of the stump or woody roots of an individual (levee body)”.
NameSI1.7—Degree of Decomposition of the Stump or Woody Roots of an Individual (Levee Body)
DefinitionThe degree of decomposition of the stump or woody roots of a dead individual is assessed by the stage of decomposition to which the root belongs. A methodology has been implemented to obtain this category by indirect measurements.
The use of this status indicator requires knowing the date of death of the tree and the environment in which the levee is located (plain, mountain). The time elapsed in years after the natural death of the stump, the woody roots or the felling of the tree is noted as T+i.
Source of data acquisition The data are obtained using indirect measurements developed specifically to inform this indicator.
Scale and reference 10: healthy wood (initial status), recent felling
9–8: semi-continental plain environment or mountain environment, T+1 to T+2, oak, ash, Scots pine, larch
7–6: semi-continental plain environment or mountain environment, T+3 to T+4, oak, ash, Scots pine, larch
5–4: semi-continental plain environment, T+1 to T+2, poplar, black locust
3–2: semi-continental plain environment, T+3 to T+4, poplar, black locust
Characteristic of location Homogeneous section of analyzed levee composing the levee body.
Characteristic of time This indicator results from indirect measurements.
Table 7. Consensus scores between experts (NP = not provided).
Criteria Number of IndicatorsConsensus Scores
Segment 1Segment 2
C.1SI1.1NP NP
SI1.287
SI1.363
SI1.454
SI1.522
SI1.644
SI1.7104
C.2SI2.11010
SI2.2NP NP
SI2.377
SI2.41010
SI2.500
C.4SI4.1NP NP
SI4.278
SI4.349
SI4.434
SI4.532
SI4.644
SI4.71010
C.5SI5.11010
SI5.2NP NP
SI5.389
SI5.41010
SI5.500
C.7SI7.1NPNP
SI7.278
SI7.300
Table 8. Assessment of criteria and performance indicators relating to the internal erosion mechanism, with or without taking into account tree vegetation. Segments of the levee of the Petit Rhone.
LocationC.1C.2C.3C.4C.5C.6C.7C.8Performance Indicator
Vegetation Without Vegetation VegetationWithout Vegetation VegetationWithout Vegetation
Segment 1686103581061056
Segment 22 96106981081057
Disclaimer/Publisher’s Note: The statements, opinions and data contained in all publications are solely those of the individual author(s) and contributor(s) and not of MDPI and/or the editor(s). MDPI and/or the editor(s) disclaim responsibility for any injury to people or property resulting from any ideas, methods, instructions or products referred to in the content.

