Article

Landslide Prediction Validation in Western North Carolina After Hurricane Helene

1
Department of Civil and Environmental Engineering, University of North Carolina at Charlotte, Charlotte, NC 28223, USA
2
Department of Earth, Environment and Geographical Sciences, University of North Carolina at Charlotte, Charlotte, NC 28223, USA
*
Author to whom correspondence should be addressed.
Geotechnics 2024, 4(4), 1259-1281; https://doi.org/10.3390/geotechnics4040064
Submission received: 18 November 2024 / Revised: 7 December 2024 / Accepted: 12 December 2024 / Published: 14 December 2024

Abstract

Hurricane Helene triggered 1792 landslides across western North Carolina and has caused damage to 79 bridges to date. Helene hit western North Carolina days after a low-pressure system dropped up to 254 mm of rain in some locations of western North Carolina (e.g., Asheville Regional Airport). The already waterlogged region experienced devastation as significant additional rainfall occurred during Helene, where some areas, like Asheville, North Carolina received an additional 356 mm of rain (National Weather Service, 2024). In this study, machine learning (ML)-generated multi-hazard landslide susceptibility maps are compared to the documented landslides from Helene. The landslide models use the North Carolina landslide database, soil survey, rainfall, USGS digital elevation model (DEM), and distance to rivers to create the landslide variables. From the DEM, aspect factors and slope are computed. Because recent research in western North Carolina suggests fault movement is destabilizing slopes, distance to fault was also incorporated as a predictor variable. Finally, soil types were used as a wildfire predictor variable. In total, 4794 landslides were used for model training. Random Forest and logistic regression machine learning algorithms were used to develop the landslide susceptibility map. Furthermore, landslide susceptibility was also examined with and without consideration of wildfires. Ultimately, this study indicates heavy rainfall and debris-laden floodwaters were critical in triggering both landslides and scour, posing a dual threat to bridge stability. Field investigations from Hurricane Helene revealed that bridge damage was concentrated at bridge abutments, with scour and sediment deposition exacerbating structural vulnerability. We evaluated the assumed flooding potential (AFP) of damaged bridges in the study area, finding that bridges with lower AFP values were particularly vulnerable to scour and submersion during flood events. Differentiating between landslide-induced and scour-induced damage is essential for accurately assessing risks to infrastructure. The findings emphasize the importance of comprehensive hazard mapping to guide infrastructure resilience planning in mountainous regions.

1. Introduction

Western North Carolina is part of the Appalachian Mountain range that stretches from northern Maine to southern Alabama. The Appalachian Mountain Range is the product of several orogenic events beginning with the formation of the supercontinent Rodina, which occurred about 1 billion years ago [1,2]. The subsequent orogenies are known as the Taconic, Acadia, and Alleghenian orogenies, the last of which occurred about 300 million years ago when Africa and North America collided during the assembly of the supercontinent Pangea. Pangea persisted until 200 million years ago when the North American and African continents started to drift apart. Figure 1 shows the topography of the western mountain region in North Carolina. The region’s distinctive landscape of valleys and ridges, combined with its climate, creates ideal conditions for landslides due to continuous weathering and erosion [3,4]. Landslides are particularly common in western North Carolina, especially following periods of heavy rainfall. Because hurricanes can produce large amounts of precipitation, they pose a significant threat. Where these hazards occur together, their combined impact intensifies the overall damage. Therefore, landslides pose significant hazards in mountainous areas impacted by hurricanes.
On 25–28 September 2024, Hurricane Helene traveled through the western mountain regions of North Carolina and triggered thousands of landslides. Hurricane Helene, which originated in the Caribbean Sea, started on 22 September as a tropical low-pressure disturbance and within a short period intensified to a Category 4 hurricane (26 September). By the time Helene arrived in Georgia, it was downgraded to a post-tropical cyclone and eventually reached the western mountain region of North Carolina following the path shown in Figure 2. In western North Carolina alone, Helene resulted in 102 deaths, caused excessive flooding and landslides, and destroyed infrastructures, including numerous bridges and roadways throughout the western part of the state [5]. The storm impacted a significant portion of the southeastern continental US and became one of the most severe hurricanes in recent US history [6].
Prior to Hurricane Helene, heavy rainfall events have caused significant flooding and landslides in western North Carolina and the surrounding region in the past, including 10 times from 1924 to 2013, giving an average frequency of about 9 years [3]. A common factor amongst the worst of these past storms was heavy rainfall from a hurricane in addition to multiple storms occurring within a short period of time. In 1916, 1940, and 2004, multiple storms, at least one of which was a hurricane, occurred within days to weeks of each other, causing significant rainfall on already saturated soil, generating widespread flooding and hundreds to thousands of landslides. Hurricane Helene was similar to these past events. Helene hit western North Carolina days after a low-pressure system dropped up to 254 mm of rain in some locations in western North Carolina (e.g., Asheville Regional Airport). The already waterlogged region experienced devastation as significant additional rainfall occurred during Helene, where some areas like Asheville and Bat Cave received more than 350 mm of additional rain [7]. Like the past multi-storm events to impact western North Carolina, Hurricane Helene and its preceding storm produced thousands of landslides, a majority of which are classified as debris flows. Debris flows, which are the most common form of landsliding in western North Carolina [3], are fast-moving mixtures of water, saturated soil, rock, and organic material that rapidly traverse downslope, often triggered by intense rainfall (within two days, the accumulated rain intensity was reported as between 305 mm and 508 mm). At the time of the writing of this article, the USGS Helene landslide dashboard (2024) reports 1792 landslides were initially identified as debris flows, landslides, and unknowns [8].
To assess the landslide susceptibility in the region, we used machine learning (ML) and parameters that may trigger a landslide to generate a landslide risk map [9,10]. ML is a rapidly developing technique for handling large datasets, especially in the fields of classification and feature identification that are too tedious for human operations. Geospatial modeling has increasingly leveraged machine learning techniques to predict extreme events, such as landslides, wildfires, floods, and earthquakes [11,12,13]. Our risk map considers multi-hazard scenarios including landslide, earthquake, wildfire, and flooding. Figure 3 shows the different counties that are considered in the study. Wildfire is included in the study because it can result in soil losing moisture retention capability and make the slopes more susceptible to sliding [14,15,16,17]. The affecting variables included distance to rivers, the digital elevation model (DEM) and its derivatives (different aspect parameters such as slopes and orientation of slopes), soil types, rainfall, forest cover, distance to faults, distance to high population density areas, and annual temperature. Two algorithms were considered: random forest (RF) and logistic regression (LR), where RF is a machine learning technique that uses supervised learning from a set of decision trees created from a bootstrap sampling approach [18,19]. RF has been previously used in landslide susceptibility analysis [20,21,22]. LR has been used by several researchers for landslide susceptibility analysis, including Regmi et al. [23], Sun et al. [24], and Rasanen and Maurer [25].
These landslide susceptibility models for the western North Carolina mountains are also used to determine the flooding risks to highway bridges, since landslides can result in significantly raised water and cause flooding damage to the bridges [9]. To quantify flooding potential, bridge-to-water clearance is defined as an assumed flooding potential (AFP), which is the computed mid-span height of a bridge structure. AFP is used to determine if a bridge is in a valley and if it has high flooding potential.
This paper compares landslides (reported by the state agencies) as a result of hurricane Helene in western North Carolina with the landslide susceptibility models [9]. The results are further compared to field observations made by the authors after Hurricane Helene. This is the first validation report on landslide susceptibility mapping based on newly documented landslides that the model was not trained upon. Finally, this paper reports the damage to the bridge structures from the landslides and flooding caused by Hurricane Helene, which brings to light some unique phenomena that need further studies, such as the issue of differentiating landslide versus scour near a flooding river.

2. Study Area and Methods

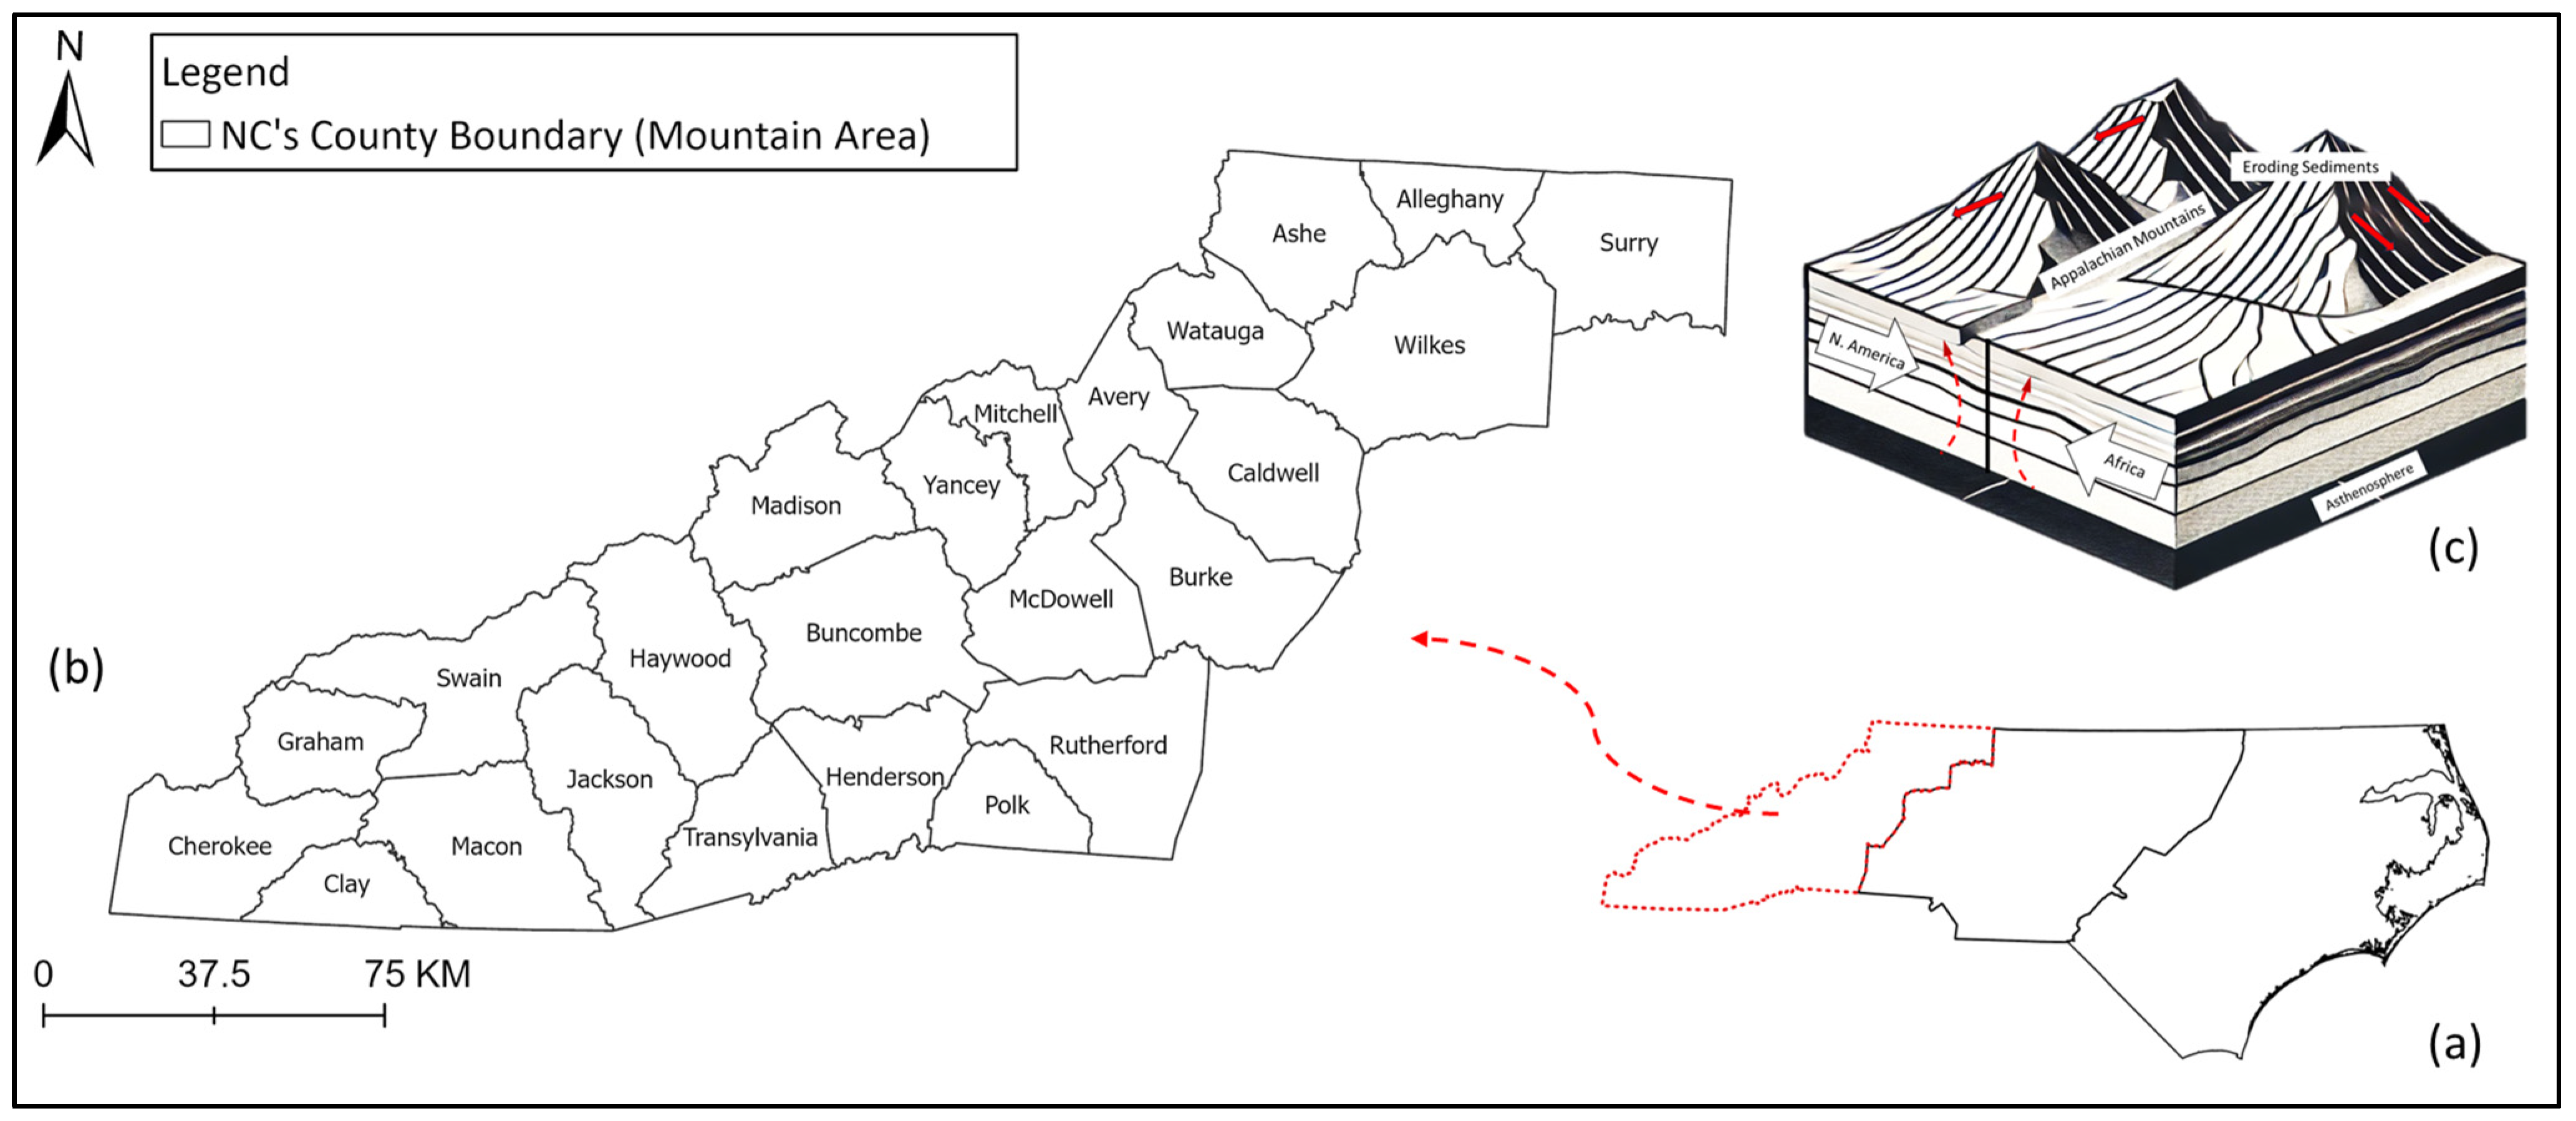
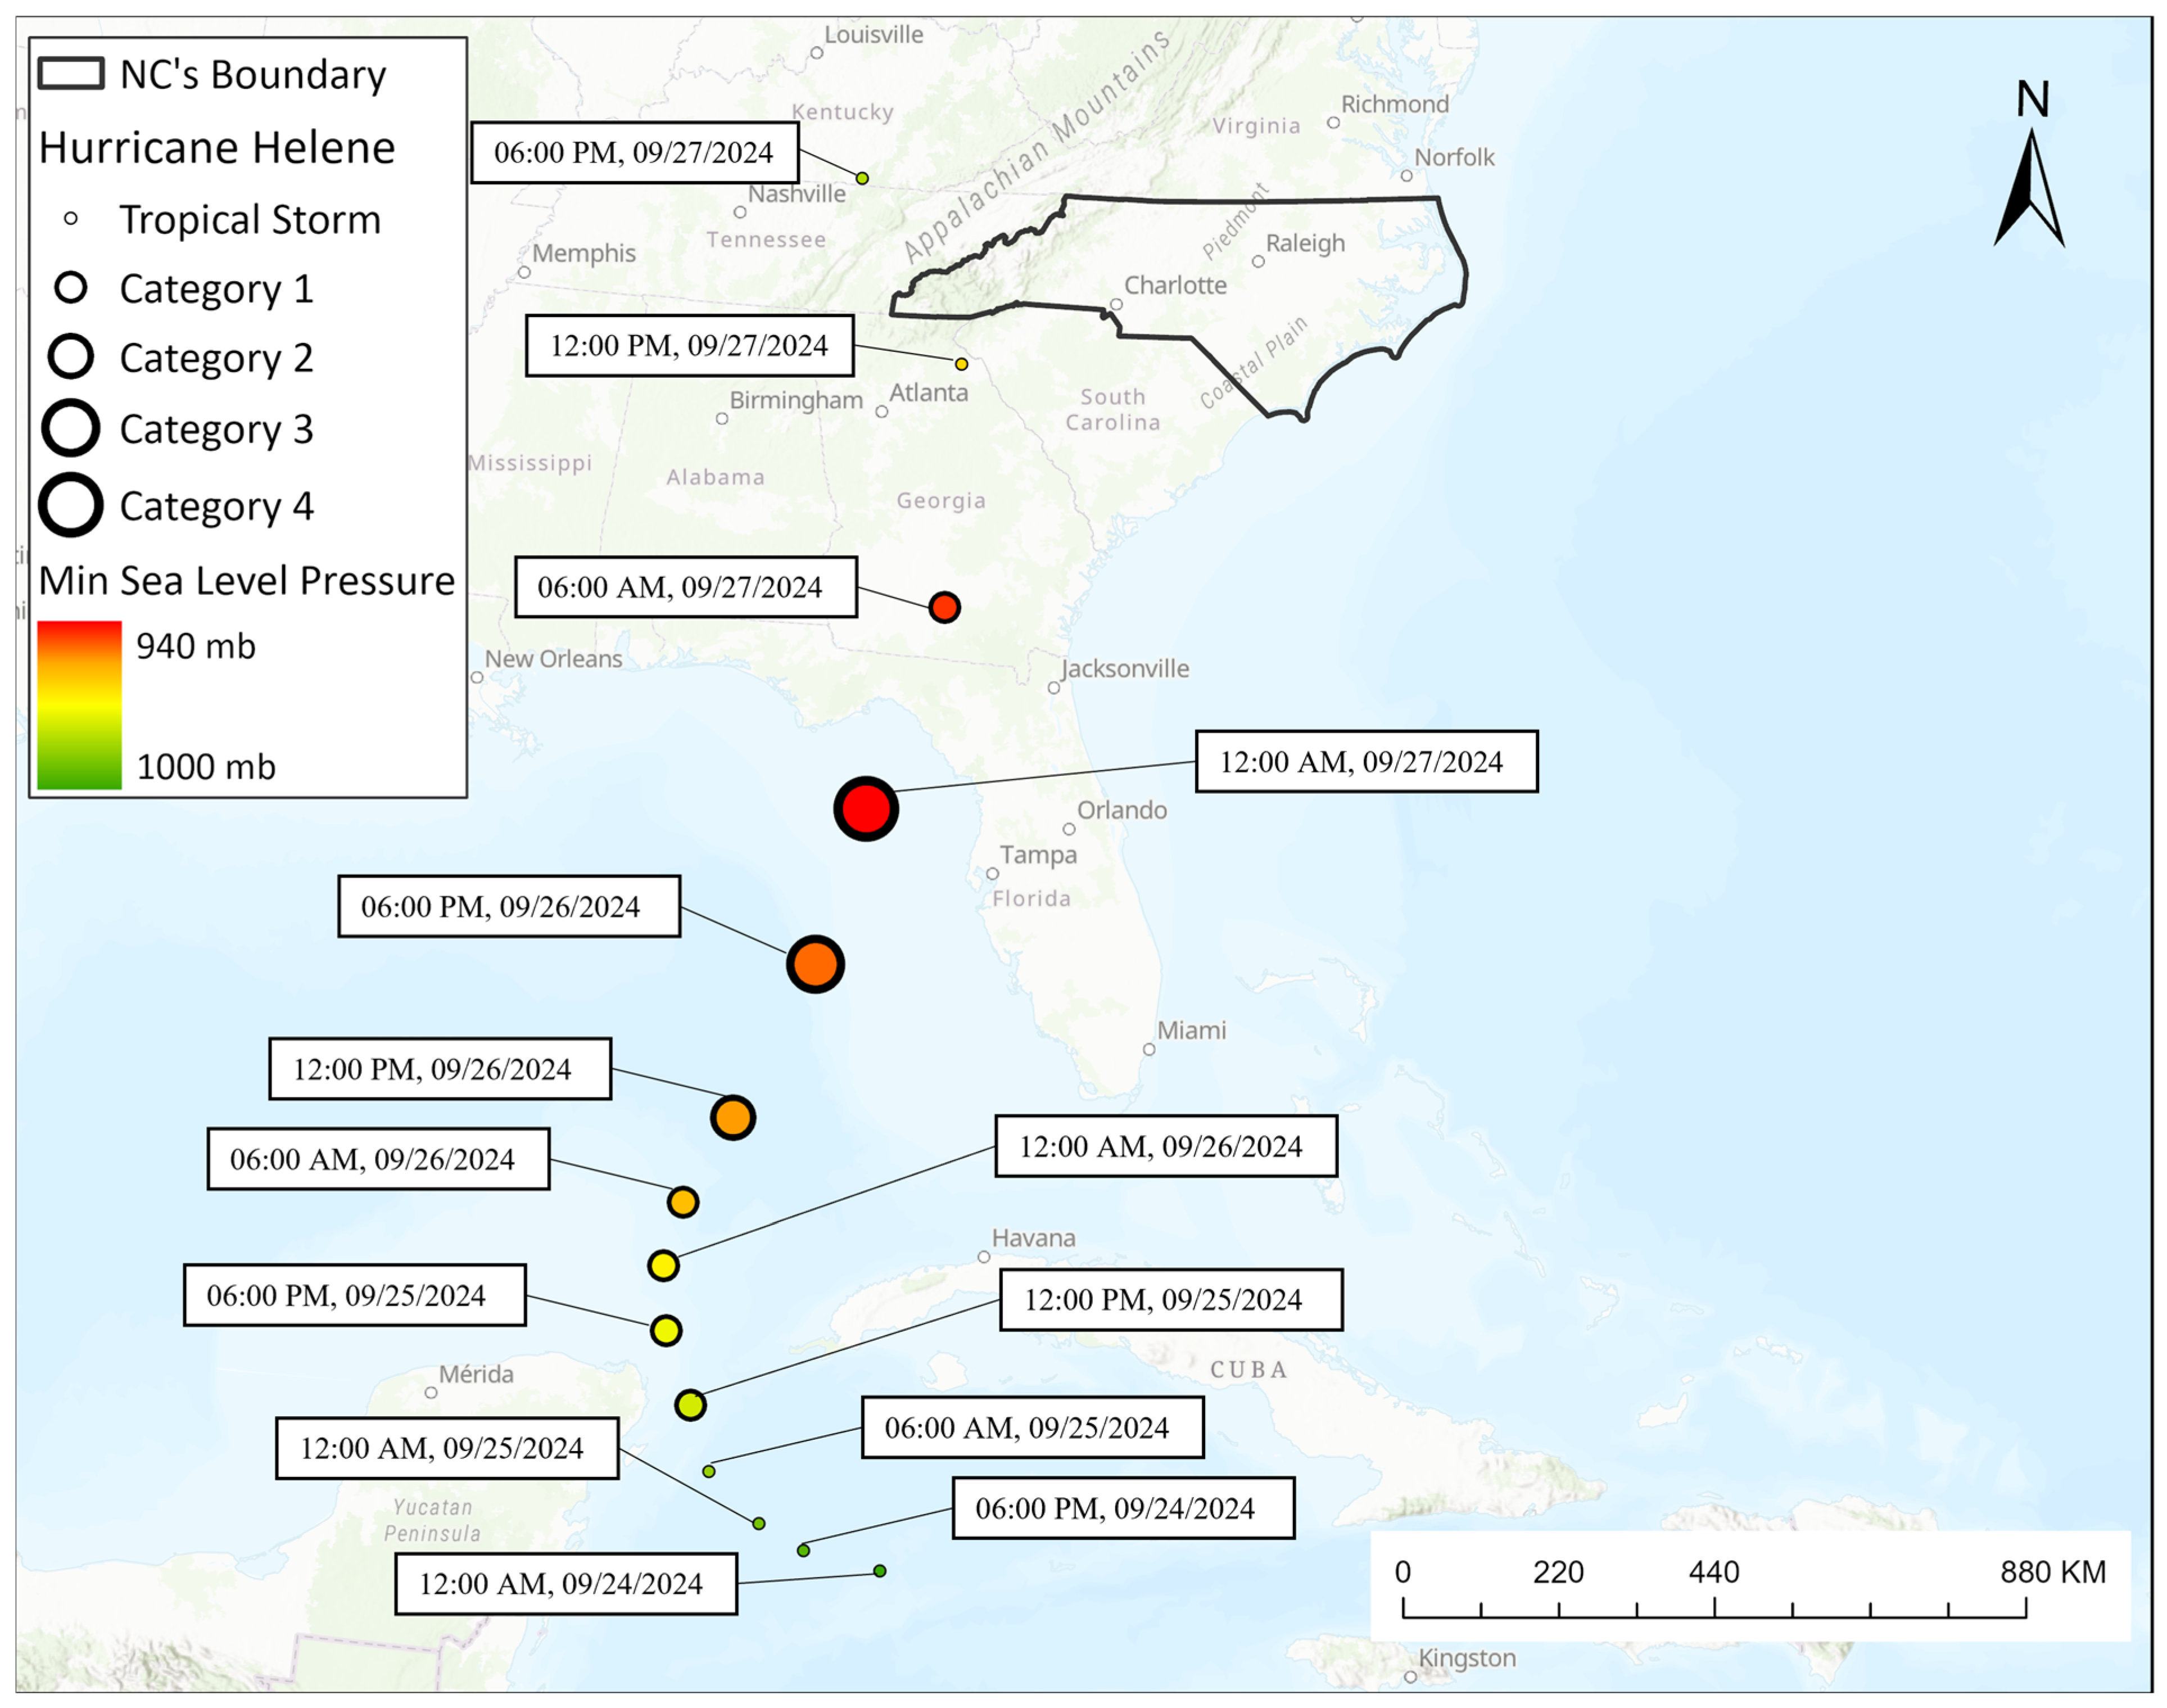
2.1. Study Area and Effects from Helene

Figure 3 shows the study regions covering an area of 26,572 km2 in the Appalachian Uplands [26]. Also shown in Figure 3 are the state-reported landslide locations and damaged bridges after Hurricane Helene [8,27]. The highlighted boundaries in Figure 3 are the ground truthing regions covered by the research team. Figure 4 shows some typical landslides from Hurricane Helene with size descriptions using NASA’s slide identification technique [28]. It should be noted that the disaster caused by Helene extended beyond North Carolina and included Tennessee, Georgia, Florida, South Carolina, and Southern Virginia. However, the scope of study reported in this paper only considers the mountain region of western North Carolina.

2.2. Landslide Susceptibility Modeling

Historical landslide data were retrieved from the US national database, and the landslide susceptibility modeling followed the confidence rule system and used susceptibility values ranging from 5 (a confidence of a consequential landslide at a given location) to 8 (high confidence in extent or nature of landslide) [29]. The resulting landslide database included 4794 landslides and 6653 polygons.
For multi-hazard modeling, a nested approach is used: We assume that the risk of landslide is the critical risk-of-interest and consider other hazards, including earthquake, rainfall, and forest fire, as contributing factors.
For multi-hazard modeling, wildfire data from the wildfire database of the U.S. Department of Agriculture (USDA) were collected [30]. Considering only human-induced and natural wildfire events, our wildfire database consists of 112,454 events in NC. The other wildfire-related variables include annual temperature (°F/year), rainfall, forest cover, distance to roads, distance to high population density, elevation, and slope. Forest cover only considers cover and non-cover types and is extracted from the NC OneMap 2016 dataset [31].
Some soil types are more receptive to loss of moisture and can increase the susceptibility of landslides [32]. Our approach to wildfire risk in landslide modeling first included modeling wildfire susceptibility and then used the computed risk factor as a variable in landslide susceptibility modeling [10]. Due to limited available data, our wildfire susceptibility modeling is not as comprehensive as some other modeling reports [33,34]. However, our wildfire susceptibility model has an accuracy of 72%, which is reasonably close to other more accurate models (including more variables such as wind speed, surface roughness, fire history, minimum and maximum annual temperatures) such as the 85.46% using a convolutional neural network (CNN) by Bjånes et al. [35].
During model development, the multi-hazard landslide susceptibility model also included earthquake hazards via a distance to faults metric because the global landslide database that the landslide susceptibility model was trained upon included both seismic and aseismic landslides [29]. While the landslides caused by Hurricane Helene were aseismic, recent research [36] in western North Carolina suggests that fault movement is currently destabilizing slopes. Therefore, some slopes in western North Carolina—those closer in distance to faults—seem to indicate some correlation between distance to fault and landslides. However, this could just be because faults are located at locations where the mountains are at a greater elevation. Furthermore, it is important for a multi-hazard landslide susceptibility model to also include earthquake hazards, especially considering seismic activity has drawn increased attention to the Carolina region. Notable examples include the 2011 moment magnitude (Mw) 5.8 Mineral, Virginia, and 2020 Mw 5.1 Sparta, North Carolina, earthquakes, which garnered national attention due to their damage and the significant population across the eastern U.S. that was exposed. The 2020 Sparta earthquake, for example, triggered rockfalls and a slope bulge (pre-slide land deformation) in the Little River Valley region [37]. In addition to these recent events, paleoseismic evidence indicates that the region has experienced significant seismic activity in the past, such as the ~Mw 7–7.5 1886 Charleston, South Carolina, earthquake [38]. Moreover, the introduction of anthropogenic activities, such as increased natural gas production in Virginia, raises concerns about the potential for fracking-induced earthquakes in the future. Thus, while including an earthquake prediction variable in a landslide susceptibility model is important in North Carolina, it currently has a relatively small influence on the predictions for aseismic landslides and may indirectly serve as a predictor for them given the link of fault movements to slope destabilization.
Both LR and RF modeling were conducted using RStudio, and 9794 sample points were used for the RF and LR modeling (4794 for historical landslide occurrences and 5000 for no landslide occurrences). In our dataset, we used the random points tool in ArcGIS Pro.
Furthermore, to automate the computation of the flooding potentials of bridges over water, ArcGIS Pro was used. A bridge’s flooding potential is defined as the assumed flooding potential (AFP), which is computed as:
B i = E 1 i + E 2 i 2 E L i
where Bi denotes the bridge’s AFP, i represents the bridge’s ID, E1i and E2i represent the elevations on the two sides of the bridge, while ELi denotes the elevation of the river. AFP is, in essence, the average clearance of the bridge from the river level. State DEM data were used to quantify bridge embankment heights using a 30 m radius around a bridge. Several ArcGIS tools, including the split line to points tool, extract multi-values to points tool, bearing distance to line tool, buffer tool, and zonal statistics tool, were used in the calculation of the bridge’s AFP.
The modeling workflow is shown in Figure 5, and the results (landslide susceptibility maps) are shown in Figure 6 and Figure 7 for landslides considering wildfire effects and no wildfire effects, respectively. The comparison between LR and RF modeling has been published by Lin et al. [9], where RF results are shown to be more accurate than LR results. Hence, hereafter, only the RF results will be used for Helene landslide validation.

2.3. Ground Truthing and Landslide Validation

Several field trips were made two weeks after the departure of Hurricane Helene. The site visits included both mountain regions and valley regions. As shown in Figure 3, the visited areas include Macon, Henderson, Rutherford, Polk, and Buncombe Counties. These trips visited several reported landslide sites and damaged bridge sites.

3. Results

In the following, we will first discuss the state-reported landslide locations and the comparisons to the two multi-hazard susceptibility maps. We then discuss detailed observations from field investigations.

3.1. Model and Helene Landslide Comparisons

Figure 8 shows the locations for the 1792 landslides reported by the state superimposed on the multi-hazard susceptibility maps for (a) not considering wildfire effects and (b) considering wildfire effects, respectively. The figures show that the landslide sites are clustered mostly in the central portion of western North Carolina and overlap several of the highly probable landslide susceptibility sites. The clustering of the landslides is probably due to the mountain range trapping the storm and forcing large amounts of precipitation in the region. Unfortunately, the meteorological record of Hurricane Helene did not have sufficient information to indicate the precise storm path through the mountain range. To better represent the prediction for each landslide site, the results are reversely presented using color coding for the landslide susceptibility at the location of each slide as shown in Figure 9. This helps in processing the quantitative analysis of the landslide validation.
Figure 9a,b show the landslides with different susceptibility probabilities for the multi-hazard scenarios of landslides, with and without wildfire effects, respectively. The susceptibilities are reported in 10% intervals, such as 0–10%, 10–20%, and so on. In cases with and without wildfire effects, the landslides of different susceptibilities are shown to be uniformly distributed throughout the middle region of the study area. Critical counties with a significant number of landslides are Allegheny, Ashe, Watauga, Avery, Mitchell, Yancey, McDowell, Rutherford, Madison, Buncombe, Henderson, Polk, and Haywood.
The difference between the models with and without wildfire effects is presented in Figure 9c, indicating that it is difficult to conclude if one case is more frequent than the other case. Both cases seem to be distributed at the same locations. This observation indicates that wildfire is currently not a significant landslide factor for western North Carolina.
To show a better contrast between the number of slides in the two scenarios, a bar chart is presented in Figure 9d, which shows that the biggest differences between the two scenarios are in the probability ranges of 0 to 10% and 60 to 70%. Figure 9d also shows that Helene landslides occurred in all the susceptibility ranges, with the most cases in the probability range of 60% to 70%.

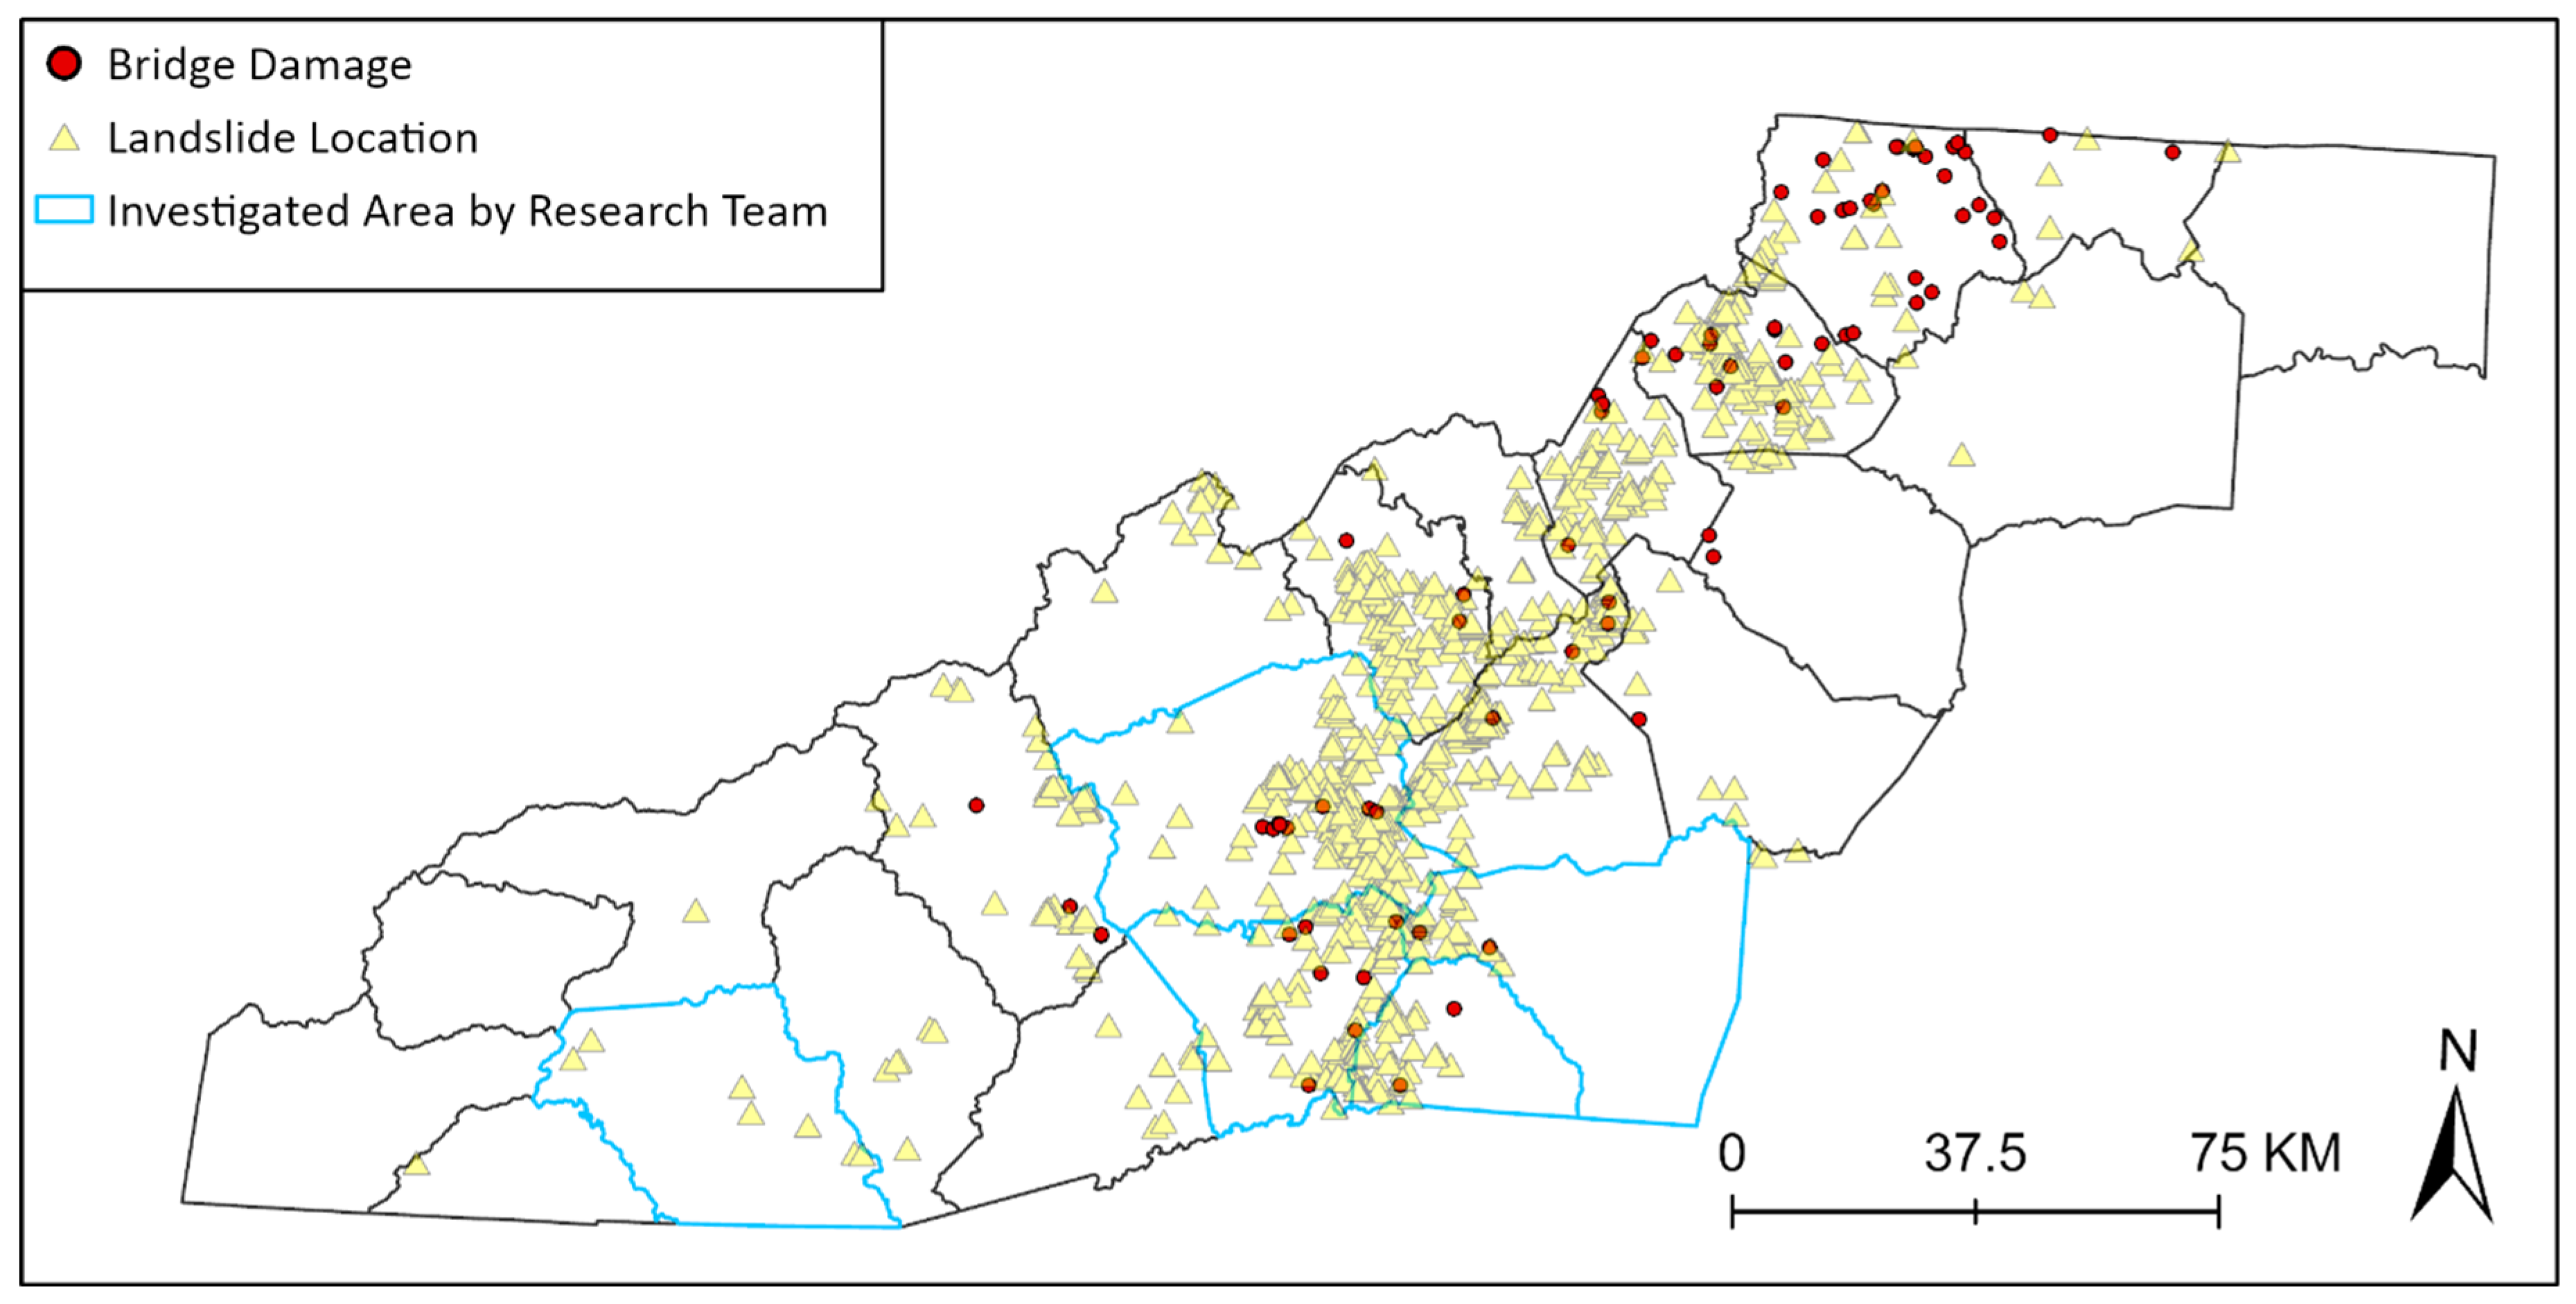
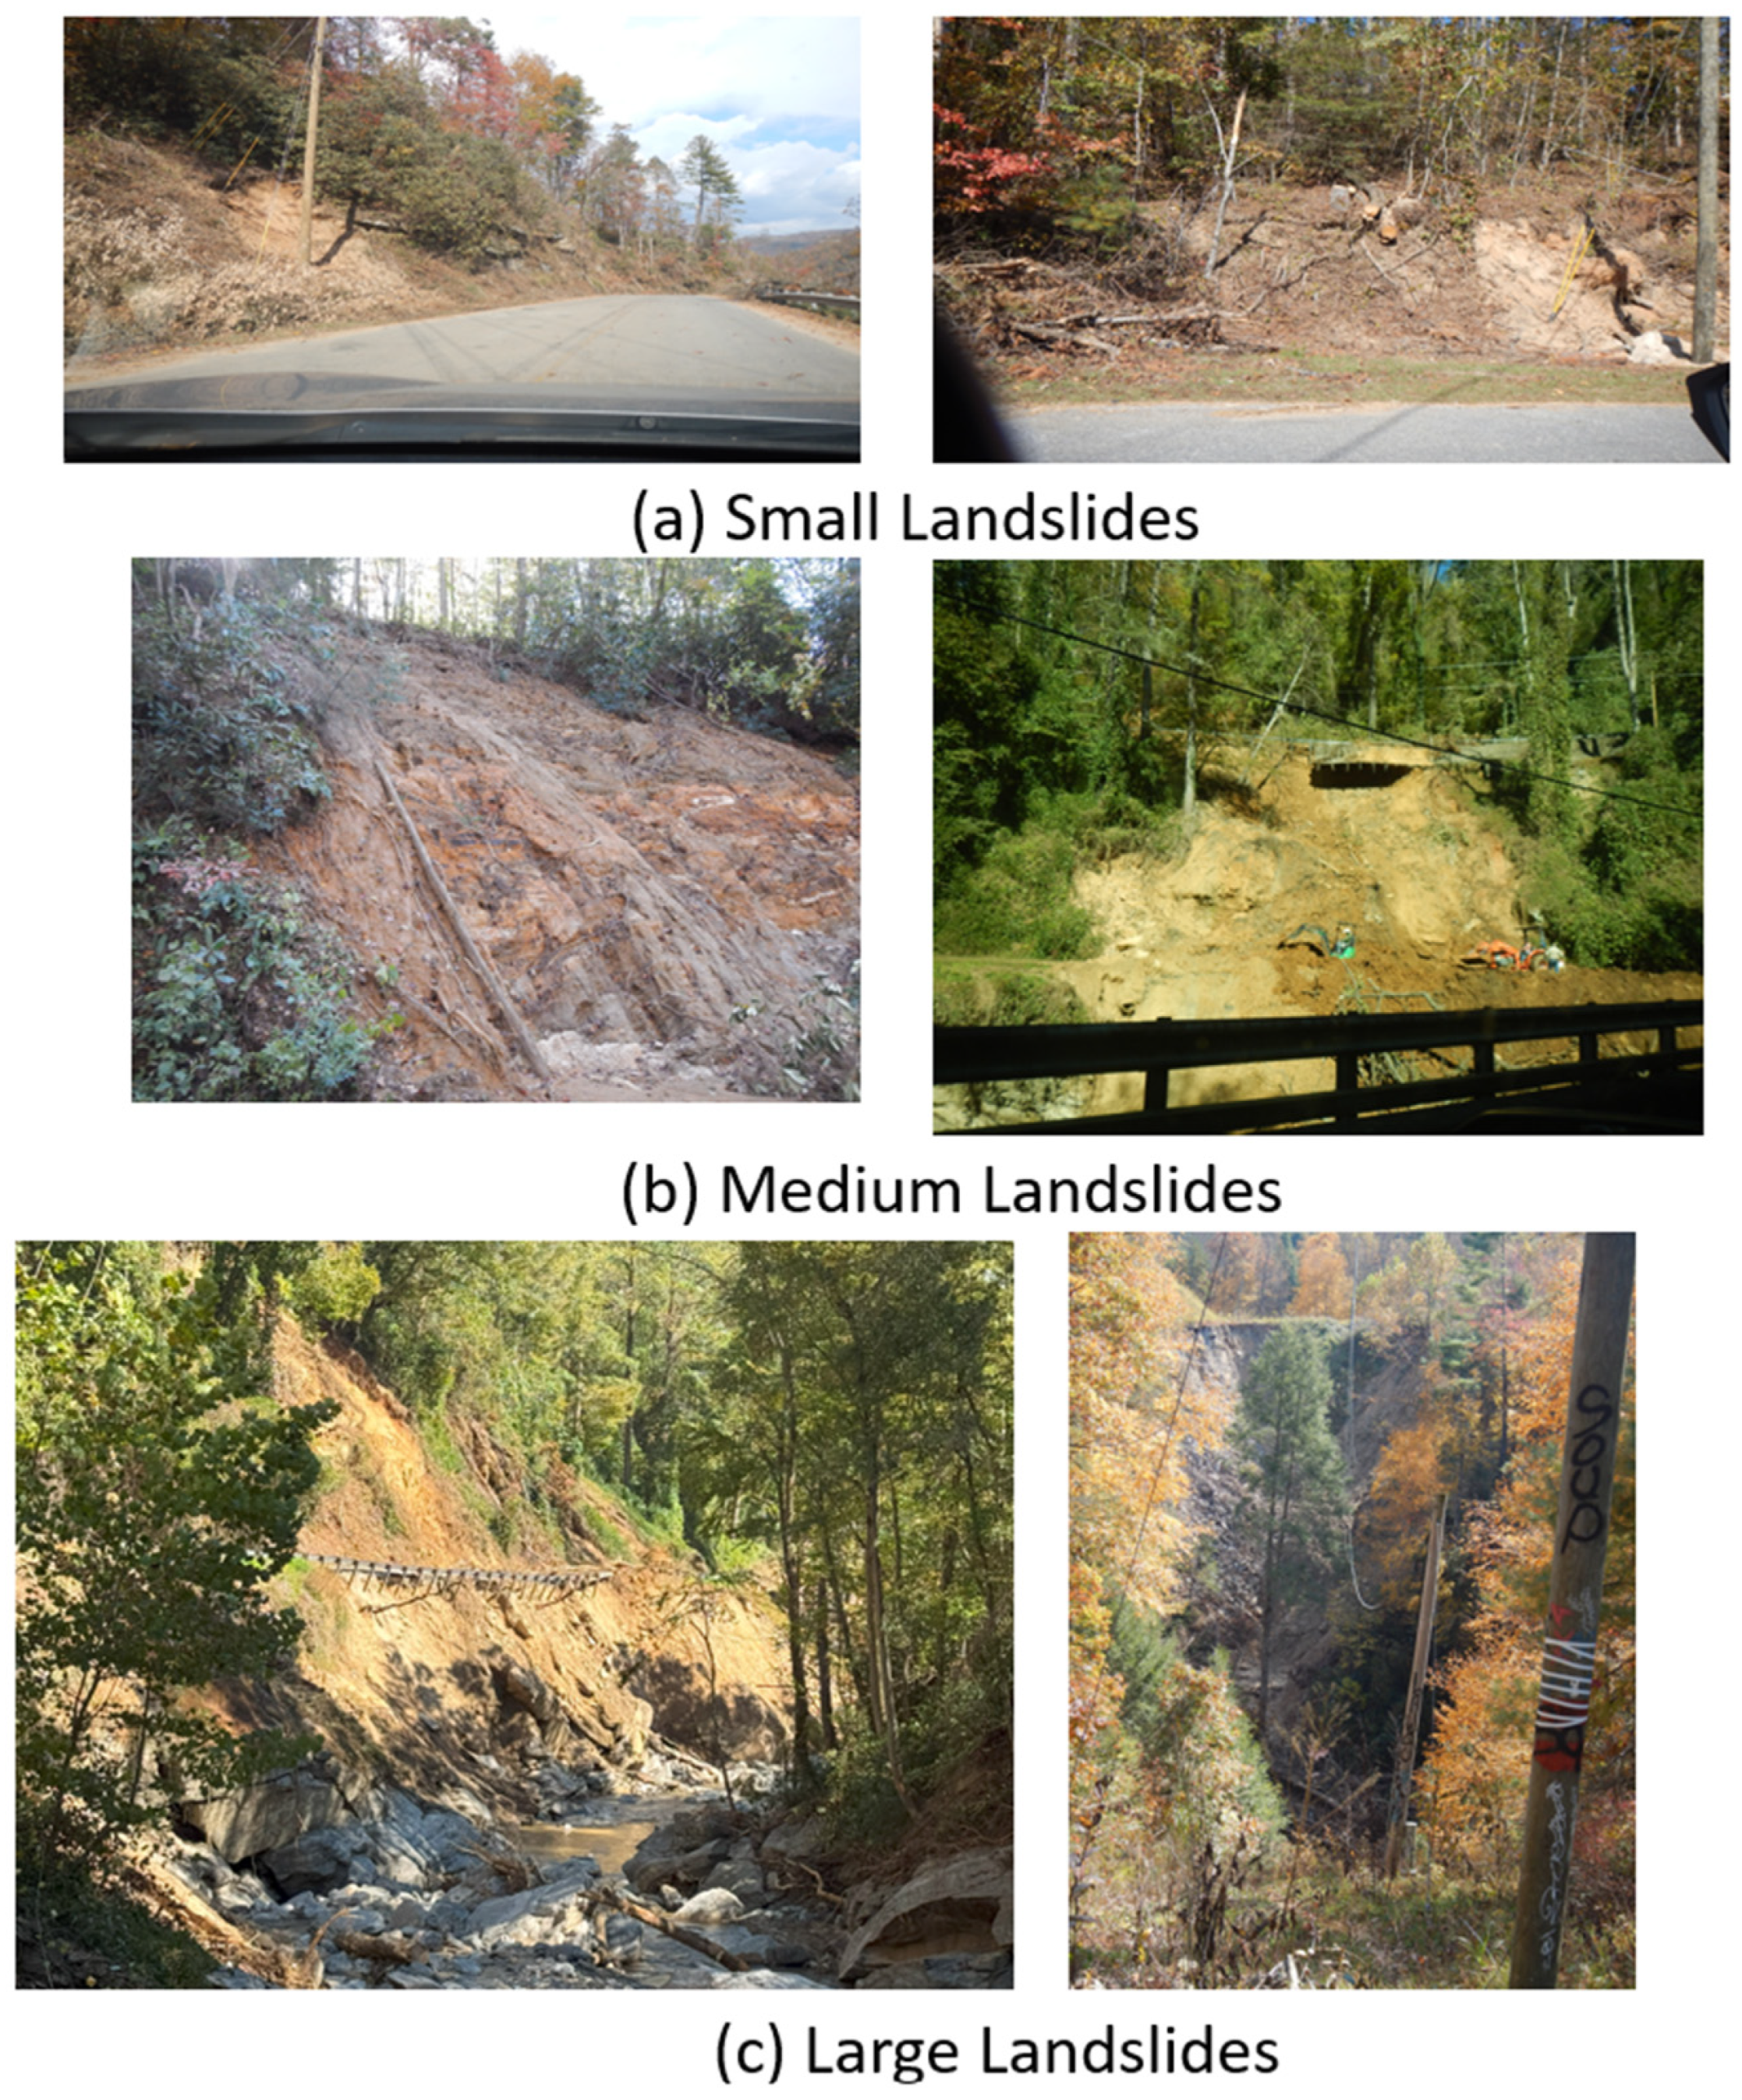
3.2. Ground Observations of Landslides and Damage to Transportation Infrastructures

Field investigation of the landslides shows a mixture of different extents of landslides, from small roadside runoffs to large sections of mountain slope with rolling rocks and debris flows (Figure 4). Several of the landslides resulted in damage to roadways and parking facilities (Figure 10) and endangered bridge structures (Figure 11). Markings in Figure 10 and Figure 11 are added to show the likely boundary of the landslide.
Damage to bridge structures showed a critical issue in differentiating landsliding versus river water scouring. Landslides, specifically debris slides in the case of mountainous western North Carolina, are typically described as the ground movement due to an increase in soil moisture, which reduces the soil strength and results in land mass flow [39], whereas scour is described as “Erosion of streambed or bank material due to flowing water” [40]. Due to the rapid accumulation of rainwater during Helene, many of the roadway embankments experienced rapid runoff of rainwater that traveled downslope into the river, first forming gullies and eventually triggering slides that converged with the rapid river flow. As a result of the significant number of landslides in the mountains, severe debris flows emptied into rivers and streams and resulted in the massive erosion of riverbanks, such as in the case of Chimney Rock Village, NC.
Figure 12 shows a section of the Broad River (near Chimney Rock Village) that was washed away by the massive flooding during Hurricane Helene. Figure 12a shows the site of the washed-away bridge on Chimney Rock Scenic Road over the Broad River, and Figure 12b–d show different views of the eroded riverbanks and floodplains of the Broad River. The entire Broad River basin, from Bat Cave and Chimney Rock Village to Lake Lure, experienced severe riverbank erosion.

4. Discussion

Most ML-based landslide susceptibility studies are validated based on sampled historical data only; rarely does one have the opportunity to verify their prediction based on actual events [14,15,20,21,22,41,42,43]. On the other hand, most of the field surveys of landslides are performed to define unique events [44]. Hence, the current research team was given a rare opportunity to validate its study with actual landslide events.
The objectives of this paper are two-fold: (1) to evaluate the performance of the landslide susceptibility mapping in the western mountain regions of North Carolina with the landslides that resulted from the severe rainfall due to Hurricane Helene; (2) to report the disaster that pertains to the landslides and the associated damage mechanisms affecting the bridges. As such, we will divide our discussion into the following two subsections.

4.1. Landslide Susceptibility Mapping Validation

One of the challenges in ML modeling for landslide susceptibility assessment is the issue of sampling [45]. Using the rigorous technique, different sampling and modeling approaches may result in different susceptibility probabilities. Hence, the interpretation of what validates an ML-based susceptibility map is difficult to answer. This issue is further complicated by actual field investigation of landslides, since the interpretation of what a landslide is can be difficult due to the significant number of variables, both internal (i.e., lithology, slope angle, slope aspect, and slope profile) and external (e.g., rainfall and anthropogenic actions), that are required to characterize a landslide [46].
As mentioned in Section 3.1, the landslides resulting from Hurricane Helene matched different land susceptibility values, and the outcomes are very similar for both with and without wildfire effects, indicating that wildfire effects may be minimal. Figure 8a,b seem to indicate that there is not a big contrast between the wildfire-affected landslides and the non-wildfire-affected landslides. Both maps show that the landslides are clustered around the central regions of the maps, with the most significant regions being in the Buncombe, Ash, and Watauga Counties. Since the state database does not recognize the size of the landslides, it is hard to determine the extent of the landslides. Hence, to decide what degree of susceptibility qualifies as a “positive” prediction, Figure 13 shows the accumulated distributions of susceptibility values for both with and without wildfire effects. As shown, more than 50% of the landslides have higher than 60% landslide susceptibility values. If we define a 50% susceptibility value as a good prediction of landslide, then the confirmed landslides for Hurricane Helene are more than 50%.
A closer look at the landslide data shows that only one landslide has a 0% prediction (in Wilkes County), which may be interpreted as a false prediction. There is also one case for 100% prediction (Polk County) for the model not considering wildfire effects. There are 9 cases and 18 cases of landslides that have more than 99% predictions for the L+E and L+W+E cases, respectively. Figure 14 shows the locations of these landslides, which are predominantly in Watauga, Henderson, and Polk counties, with one landslide in Avery County for the model not considering wildfire effects.
We further plot the landslides against the landslide modeling variables, including elevation, slope, aspect, soil type, rainfall, temperature, forest cover, distance to rivers, distance to faults, distance to roads, distance to high population densities, and probability of wildfires, in Figure 15. The results show that the landslide distribution is most consistent with rainfall distribution, indicating that rainfall may be the most critical independent variable for Hurricane Helene. However, more detailed information from Helene should be included for more precise analysis.

4.2. Observations of Helene Landslides

Hurricane Helene triggered close to 2000 landslides, which contributed significant waste to the raised river water and flooded several valleys and lowlands in the mountain regions and damaged several bridges. To investigate the damage to the bridges, we computed the AFP described in Section 2.2 to determine the flooding potential at each bridge. As shown in Appendix A, most of the damaged bridges have an AFP of less than 10 m, except bridge ID. 050026 over the North Toe River, which has an AFP of 11.91 m. The lowest AFP reported is bridge ID. 040342, which is 0.5 m. With such low AFP, it is very probable that most of the damaged bridges were submerged under the heavy debris-ladened floodwater in the river and may have experienced scours at both bridge embankments and bridge piers, which can result in the destabilization of both the bridge super and substructures and ultimately, the bridge may collapse due to deck failure.
To illustrate the damaging effects of scour, Figure 16 shows the likely scouring of bridge structures during flooding: Figure 16a shows potential scour occurring at both bridge piers and bridge embankments, which can lead to increased stresses at the supporting soil medium around the bridge piers and cause instability to the superstructure (Figure 16b). It is important to point out that most scour prediction models are either for clear water or for live beds (Figure 16c). The dashed line in Figure 16 represents the possible scour from the heavily debris-ladened floodwater from Helene. However, the hydrodynamic effects on the bridge-supporting soil medium remain to be investigated. Pregnolato et al. investigated the flooding impacts on bridge substructures and suggested that some of the flooding forces can damage beam supports and suggested that the consequences of bridge failure should be assessed by the number of days of closure [47].
Finally, to illustrate the difference between landslides and scouring bridge embankments, we use a landslide at the Big Hungry River, Flat Rock, NC, as an example. Figure 17 shows the landslide with the whole view of the mass movement (County route 1889, Figure 17a) and our attempted indication of the debris slide (there is an indication of a slip surface) and the scour recognized as the deposition of waste (logs and large rocks) near the riverbed (Figure 17b). To differentiate between landslides and scour, Wu et al. [48] used Figure 17c to define a landslide, which ends at a distance, “b”, that extends from the slide toe to the stream edge. Similarly to the deep-seated landslides in the Kaoping Watershed region, Taiwan, the debris slide at the Big Hungry Road Bridge site also involves a long slip plane [48]. Not shown in the figure is a continuation of the slide above Route 1889. However, because of the deposition of debris, it is hard to distinguish the slide toe of the scoured river zone of the Big Hungry River.
Figure 18 shows the washed-out Big Hungry Road Bridge (ID: 440055) over the Hungry River (upstream from the landslide). As shown, the bridge has severe scours at both abutments, and the bridge deck was washed out. At the time of the photograph, construction is underway, and it is shown that the existing bridge abutments were damaged, but the pile foundation remained intact, although the bridge superstructure is gone.

5. Conclusions

Hurricane Helene caused a significant disaster in western North Carolina (NC) during September 2024 from which the region is still recovering. This event triggered numerous landslides and flooding due to the heavy rainfall (508 mm accumulated) and strong winds brought by the hurricane. Reports and platforms documented 1792 landslides, 79 damaged bridges, and 102 fatalities, based on data from the USGS, NCDOT, and NC Department of Health and Human Services (NCDHHS) as of November 10th [5,8,27]. We used data on landslides and damaged bridges to validate our susceptibility maps and conducted ground observations to support the results.
Although our two multi-hazard susceptibility maps (Figure 6 and Figure 7) yield similar results, placing the landslide locations from the USGS platform reveals a notable difference in probability ranges of 0 to 10% and 60 to 70% between the maps. Our multi-hazard susceptibility maps include various variables (elevation, slope, aspect, soil type, rainfall, temperature, forest cover, distance to rivers, distance to faults, distance to roads, distance to high population densities, and probability of wildfires). The distribution of documented landslide locations appears to be strongly correlated to rainfall. The rainfall factor does not include data from 25 to 28 September. Therefore, incorporating these data would enhance the accuracy of our future research.
Ground observations have been made in Macon, Polk, Henderson, Rutherford, and Buncombe counties. The observations confirmed those landslides not only damaged roadways and parking facilities but also posed significant threats to bridge stability, underscoring the vulnerability of infrastructure in high-risk areas. Our investigation revealed that bridge damage in the region was caused by both landslides and river scours. For most bridges, the damage is at bridge embankments. While landslides, particularly debris flows, resulted from increased soil moisture leading to slope destabilization, river scours resulted from the erosive power of floodwater, exacerbated by debris-ladened current. This dual threat contributed to widespread riverbank erosion and infrastructure damage, as observed along the Broad River near Chimney Rock Village. The extensive erosion and sediment deposition at bridge sites highlighted the interaction between landslide debris flows and flooding during Hurricane Helene.
We further observed that bridges with low average flood potential (AFP) were especially vulnerable to submersion and scour. According to the NCDOT damaged bridges report, most of the damaged bridges have an AFP less than 10 m.
Differentiating between landslide-induced and scour-induced damage is essential for understanding the mechanisms that threaten transportation infrastructure in mountainous regions. Finally, our findings demonstrate that assessing and mapping susceptibility to landslides can improve risk management strategies and inform the design of more resilient infrastructure. Future research should focus on refining susceptibility models to incorporate real-time rainfall and hydrological data, enabling more accurate predictions and preventive measures in vulnerable regions.

Author Contributions

Conceptualization, S.L., S.C., R.A.R. and W.T.; methodology, S.L., S.C., R.A.R., N.B., W.T., C.A. and J.D.; validation, S.L., S.C., Q.Z. and N.S.; formal analysis, S.L., S.C., R.A.R. and N.B.; investigation, S.L., S.C., Q.Z., V.C. and N.S.; resources, W.T.; data curation, S.L., S.C., R.A.R., Q.Z. and V.C.; writing—original draft preparation, S.L., S.C., R.A.R., W.T. and N.B.; writing—review and editing, C.A. and J.D.; visualization, S.L., Q.Z., R.A.R. and S.C.; supervision, W.T. and C.A.; project administration, W.T.; funding acquisition, W.T., C.A. and J.D. All authors have read and agreed to the published version of the manuscript.

Funding

This research was funded by the North Carolina Department of Transportation (NCDOT project number: FHWA/NC/2019-03 and RP 2022-18).

Institutional Review Board Statement

Not applicable for studies not involving humans or animals.

Informed Consent Statement

Not applicable.

Data Availability Statement

Some or all data, models, or code that support the findings of this study are available from the corresponding author upon reasonable request.

Acknowledgments

The authors owe thanks to the Steering and Implementation Committee, including Dana Magliola, John W. Kirby, Mike Schoen, Mark Johnston, Tysean Wooten, Austin Chamberlain, Nazia Sarder, Chris Palsgrove, Patrick Flanagan, Josh Kellen, Karyl Fuller, James Salmons, Meredith McDiarmid, Nastasha E. Young, Matthew Lauffer, Colin Mellor, and Curtis Bradley. The contents of this paper reflect the views of the author(s) and not necessarily the views of the University. The author(s) are responsible for the facts and the accuracy of the data presented herein. The contents do not necessarily reflect the official views or policies of either the North Carolina Department of Transportation or the Federal Highway Administration at the time of publication. This paper does not constitute a standard, specification, or regulation.

Conflicts of Interest

The authors declare no conflicts of interest.

Appendix A

No.Bridge IDStreamBridge Length (m)AFP (m)Report State
1040342North Fork New River280.50underwater
2040480North Fork New River18.80.51underwater
3040296North Fork New River280.53underwater
4040183Cranberry Creek15.20.56underwater
5040093North Fork New River35.90.57wash out
6040425Grassy Creek7.90.60underwater
7040483Helton Creek9.40.69underwater
8940089South Fork New River30.70.69damage
9040047Helton Creek16.70.72wash out
10040351South Fork New River49.30.76underwater
11040509South Fork New River49.30.77wash out
12040226South Fork New River310.80underwater
13130161Wilson Creek14.30.82wash out
14040354Big Laurel Creek9.40.83underwater
15040466South Fork New River37.10.85underwater
16040206Helton Creek280.87underwater
17040304Helton Creek15.50.91underwater
18040258Middle Fork Horse Creek7.60.91damage
19040463North Fork New River50.90.94underwater
20940178Cove Creek15.20.95wash out
21040048Helton Creek12.80.99underwater
22940271Watauga River32.91.00underwater
23020132Elk Creek15.21.02wash out
24940082Watauga River36.81.02underwater
25040289Helton Creek18.51.07underwater
26040140Cranberry Creek18.51.11underwater
27040121North Fork New River73.71.14wash out
28940161Watauga River23.11.15underwater
29100866Swannanoa River42.91.25damage
30100032Swannanoa River34.11.28damage
31020062Crab Creek13.71.29damage
32940058Beech Creek14.61.36wash out
33040477South Fork New River281.40wash out
34040337North Fork New River37.11.41wash out
35940168Cove Creek15.81.42wash out
36440041Lewis Creek10.61.49closed by lane
37040343Cranberry Creek12.81.50underwater
38040426Grassy Creek9.11.55underwater
39050125Elk River40.51.56wash out
40050101Elk River43.21.56wash out
41940086Howard Creek9.41.64underwater
42580285North Fork Catawba River211.66wash out
43100041Swannanoa River18.21.71damage
44040177South Beaver Creek18.81.91underwater
45050035Elk River36.81.97wash out
46940187Meat Camp Creek71.98damage
47940032Meat Camp Creek12.41.99wash out
48040122North Fork New River79.52.06wash out
49740037Green River47.82.08closed by lane
50430046Jonathan Creek29.82.10closed by lane
51440038Clear Creek43.22.22wash out
52580119North Fork Catawba River22.22.27wash out
53430225Pisgah Creek9.42.34wash out
54940016Middle Fork S.Frk. New River20.72.35damage
55430008Pisgah Creek10.92.36wash out
56440055Hungry River41.42.51closed by lane
57440026Hoopers Creek22.82.56wash out
58100785Swannanoa River13.72.59damage
59440063Lake Summit80.12.86wash out
60100552Swannanoa River52.42.90damage
61100890Swannanoa River46.93.10damage
62440027Hoopers Creek32.33.12wash out
63940280Brushy Fork Creek9.43.12wash out
64580111North Fork Catawba River36.83.23closed by lane
65800313Broad River53.63.28wash out
66130318Harper Creek24.93.40damage
67100380Swannanoa River61.53.72damage
68580083Buck Creek353.73wash out
69430111East Fork Pigeon River49.64.28closed by lane
70990097South Toe River48.74.50wash out
71740112North Pacolet River36.84.50wash out
72800060Broad River37.74.97damage
73990056South Toe River61.26.27damage
74100517Swannanoa River61.86.48damage
75040056North Fork New River101.16.99damage
76110368Lake James Canal146.67.41damage
77440214Broad River50.27.98damage
78990044Cane River73.18.16damage
79050026North Toe River85.311.91damage

References

  1. Li, Z.-X.; Bogdanova, S.; Collins, A.; Davidson, A.; De Waele, B.; Ernst, R.; Fitzsimons, I.; Fuck, R.; Gladkochub, D.; Jacobs, J. Assembly, configuration, and break-up history of Rodinia: A synthesis. Precambrian Res. 2008, 160, 179–210. [Google Scholar] [CrossRef]
  2. Hatcher, R.D., Jr. The Appalachian orogen: A brief summary. In From Rodinia to Pangea: The Lithotectonic Record of the Appalachian Region; Tollo, R.P., Bartholomew, M.J., Hibbard, J.P., Karabinos, P.M., Eds.; Geological Society of America: Boulder, CO, USA, 2010; pp. 1–19. [Google Scholar]
  3. Wooten, R.M.; Witt, A.C.; Miniat, C.F.; Hales, T.C.; Aldred, J.L. Frequency and magnitude of selected historical landslide events in the southern Appalachian Highlands of North Carolina and Virginia: Relationships to rainfall, geological and ecohydrological controls, and effects. In Natural Disturbances and Historic Range of Variation: Type, Frequency, Severity, and Post-Disturbance Structure in Central Hardwood Forests USA; Springer: Cham, Switzerland, 2016; pp. 203–262. [Google Scholar]
  4. Wooten, R.; Gillon, K.; Witt, A.; Latham, R.; Douglas, T.; Bauer, J.; Fuemmeler, S.; Lee, L. Geologic, geomorphic, and meteorological aspects of debris flows triggered by Hurricanes Frances and Ivan during September 2004 in the Southern Appalachian Mountains of Macon County, North Carolina (southeastern USA). Landslides 2008, 5, 31–44. [Google Scholar] [CrossRef]
  5. NCDHHS. Hurricane Helene Storm Related Fatalities. Hurricane Helene Recovery Resources. Available online: https://www.ncdhhs.gov/assistance/hurricane-helene-recovery-resources/hurricane-helene-storm-related-fatalities (accessed on 11 November 2024).
  6. Reinhart, B. Seven-Day Graphical Tropical Outlook. 2024. Available online: https://www.nhc.noaa.gov/gtwo.php (accessed on 17 November 2024).
  7. NWS WFO, Morristown, TN. Hurricane Helene: Record-Breaking Rainfall and Historic Flooding. 2024. Available online: https://www.weather.gov/mrx/Hurricane_Helene (accessed on 17 November 2024).
  8. USGS. Preliminary data for the 2024 Hurricane Helene Landslide Emergency Response: 2024 USGS Provisional Data Release; Geologic Hazards Science Center, U.S. Geological Survey: Denver, CO, USA, 2024.
  9. Lin, S.; Chen, S.-E.; Tang, W.; Chavan, V.; Shanmugam, N.; Allan, C.; Diemer, J. Landslide Risks to Bridges in Valleys in North Carolina. GeoHazards 2024, 5, 286–309. [Google Scholar] [CrossRef]
  10. Lin, S. Establish highway bridge network resilience via multi-hazards susceptibility modeling. In Infrastructure and Environmental System (INES); University of North Carolina at Charlotte: Charlotte, NC, USA, 2024. [Google Scholar]
  11. Liu, S.; Wang, L.; Zhang, W.; He, Y.; Pijush, S. A comprehensive review of machine learning-based methods in landslide susceptibility mapping. Geol. J. 2023, 58, 2283–2301. [Google Scholar] [CrossRef]
  12. Milanović, S.; Marković, N.; Pamučar, D.; Gigović, L.; Kostić, P.; Milanović, S.D. Forest Fire Probability Mapping in Eastern Serbia: Logistic Regression versus Random Forest Method. Forests 2021, 12, 5. [Google Scholar] [CrossRef]
  13. Pourghasemi, H.R.; Pouyan, S.; Bordbar, M.; Golkar, F.; Clague, J.J. Flood, landslides, forest fire, and earthquake susceptibility maps using machine learning techniques and their combination. Nat. Hazards 2023, 116, 3797–3816. [Google Scholar] [CrossRef]
  14. He, Q.; Jiang, Z.; Wang, M.; Liu, K. Landslide and Wildfire Susceptibility Assessment in Southeast Asia Using Ensemble Machine Learning Methods. Remote Sens. 2021, 13, 1572. [Google Scholar] [CrossRef]
  15. Culler, E.S.; Livneh, B.; Rajagopalan, B.; Tiampo, K.F. A data-driven evaluation of post-fire landslide susceptibility. Nat. Hazards Earth Syst. Sci. 2023, 23, 1631–1652. [Google Scholar] [CrossRef]
  16. DeBano, L.F.; Rice, R.M.; Conrad, C.E. Soil Heating in Chaparral Fires: Effects on Soil Properties, Plant Nutrients, Erosion, and Runoff; U.S. Department of Agriculture, Forest Service, Pacific Southwest Forest and Range Experiment Station: Berkeley, CA, USA, 1979; Res. Paper PSW-RP-145; p. 21.
  17. Rengers, F.K.; McGuire, L.A.; Oakley, N.S.; Kean, J.W.; Staley, D.M.; Tang, H. Landslides after wildfire: Initiation, magnitude, and mobility. Landslides 2020, 17, 2631–2641. [Google Scholar] [CrossRef]
  18. Breiman, L. Random Forests. Mach. Learn. 2001, 45, 5–32. [Google Scholar] [CrossRef]
  19. Ho, T.K. The random subspace method for constructing decision forests. IEEE Trans. Pattern Anal. Mach. Intell. 1998, 20, 832–844. [Google Scholar]
  20. Catani, F.; Lagomarsino, D.; Segoni, S.; Tofani, V. Landslide susceptibility estimation by random forests technique: Sensitivity and scaling issues. Nat. Hazards Earth Syst. Sci. 2013, 13, 2815–2831. [Google Scholar] [CrossRef]
  21. Pourghasemi, H.R.; Teimoori Yansari, Z.; Panagos, P.; Pradhan, B. Analysis and evaluation of landslide susceptibility: A review on articles published during 2005–2016 (periods of 2005–2012 and 2013–2016). Arab. J. Geosci. 2018, 11, 193. [Google Scholar] [CrossRef]
  22. Chen, W.; Zhang, S.; Li, R.; Shahabi, H. Performance evaluation of the GIS-based data mining techniques of best-first decision tree, random forest, and naïve Bayes tree for landslide susceptibility modeling. Sci. Total Environ. 2018, 644, 1006–1018. [Google Scholar] [CrossRef] [PubMed]
  23. Regmi, N.R.; Giardino, J.R.; McDonald, E.V.; Vitek, J.D. A comparison of logistic regression-based models of susceptibility to landslides in western Colorado, USA. Landslides 2014, 11, 247–262. [Google Scholar] [CrossRef]
  24. Sun, D.; Wen, H.; Zhang, Y.; Xue, M. An optimal sample selection-based logistic regression model of slope physical resistance against rainfall-induced landslide. Nat. Hazards 2021, 105, 1255–1279. [Google Scholar] [CrossRef]
  25. Rasanen, R.A.; Maurer, B.W. Probabilistic seismic source inversion from regional landslide evidence. Landslides 2022, 19, 407–419. [Google Scholar] [CrossRef]
  26. State, North Carolina Society of Geography. 2024. Available online: https://www.sosnc.gov/divisions/publications/kids_page_geography (accessed on 20 October 2024).
  27. NCDOT. DriveNC/TIMS Incidents Data. Available online: https://drivenc.gov/?ref=share&type=state&layers=congestion&pins=incidents_planned-road-work,incidents_other-incidents,roads_interstate,roads_us,roads_nc (accessed on 10 November 2024).
  28. NASA. The Landslide Identification Training. Landslide Reporter’s Guide 2024. Available online: https://gpm.nasa.gov/landslides/index.html (accessed on 20 October 2024).
  29. Belair, G.M.; Jones, E.S.; Slaughter, S.L.; Mirus, B.B. Landslide Inventories Across the United States Version 2: U.S. Geological Survey Data Release; U.S. Geological Survey: Reston, VA, USA, 2022. [CrossRef]
  30. NCFS. Historical Wildfire Information; North Carolina Forest Service: Asheville, NC, USA, 2024. Available online: https://www.ncforestservice.gov/fire_control/wildfire_statistics.htm (accessed on 17 November 2024).
  31. NC OneMap Services, Forest Cover; North Carolina Geographic Information Council: Raleigh, NC, USA, 2016. Available online: https://www.nconemap.gov/datasets/0fdaff9adcad441a8ab874228fa2792c/explore (accessed on 17 November 2024).
  32. Short, K.C. Spatial Wildfire Occurrence Data for the United States, 1992–2018 [FPA_FOD_20210617], 5th ed.; Forest Service Research Data Archive: Fort Collins, CO, USA, 2021. [Google Scholar] [CrossRef]
  33. Abdollahi, M.; Vahedifard, F.; Leshchinsky, B.A. Hydromechanical modeling of evolving post-wildfire regional-scale landslide susceptibility. Eng. Geol. 2024, 335, 107538. [Google Scholar] [CrossRef]
  34. Leuenberger, M.; Parente, J.; Tonini, M.; Pereira, M.G.; Kanevski, M. Wildfire susceptibility mapping: Deterministic vs. stochastic approaches. Environ. Model. Softw. 2018, 101, 194–203. [Google Scholar] [CrossRef]
  35. Bjånes, A.; De La Fuente, R.; Mena, P. A deep learning ensemble model for wildfire susceptibility mapping. Ecol. Inform. 2021, 65, 101397. [Google Scholar] [CrossRef]
  36. Langille, J.M.; Palmer, M.; Green, C. Evidence for Cenozoic topographic rejuvenation associated with the Laurel Creek Lineament in the Spruce Pine 7.5-minute quadrangle, western North Carolina, USA. J. Maps 2023, 19, 2280594. [Google Scholar] [CrossRef]
  37. Figueiredo, P.; Hill, J.; Merschat, A.; Scheip, C.; Stewart, K.; Owen, L.; Wooten, R.; Carter, M.; Szymanski, E.; Horton, S. The Mw 5.1, 9 August 2020, Sparta earthquake, North Carolina: The first documented seismic surface rupture in the eastern United States. GSA Today 2022, 32. [Google Scholar] [CrossRef]
  38. Rasanen, R.A.; Maurer, B.W. Probabilistic seismic source inversion of the 1886 Charleston, South Carolina, earthquake from macroseismic evidence: A major updating. Eng. Geol. 2023, 312, 106958. [Google Scholar] [CrossRef]
  39. Easterbrook, D.J. Surface Processes and Landforms; Prentice Hall: Upper Saddle River, NJ, USA, 1999. [Google Scholar]
  40. Arneson, L.A.; Zevenbergen, L.W.; Lagasse, P.F.; Clopper, P.E. Evaluating Scour at Bridges, 5th ed.; National Highway Institute: Washington, DC, USA, 2012.
  41. Pham, B.T.; Pradhan, B.; Bui, D.T.; Prakash, I.; Dholakia, M. A comparative study of different machine learning methods for landslide susceptibility assessment: A case study of Uttarakhand area (India). Environ. Model. Softw. 2016, 84, 240–250. [Google Scholar] [CrossRef]
  42. Yesilnacar, E.; Topal, T. Landslide susceptibility mapping: A comparison of logistic regression and neural networks methods in a medium scale study, Hendek region (Turkey). Eng. Geol. 2005, 79, 251–266. [Google Scholar] [CrossRef]
  43. Lombardo, L.; Mai, P.M. Presenting logistic regression-based landslide susceptibility results. Eng. Geol. 2018, 244, 14–24. [Google Scholar] [CrossRef]
  44. Reichenbach, P.; Rossi, M.; Malamud, B.D.; Mihir, M.; Guzzetti, F. A review of statistically-based landslide susceptibility models. Earth-Sci. Rev. 2018, 180, 60–91. [Google Scholar] [CrossRef]
  45. Wu, B.; Shi, Z.; Zheng, H.; Peng, M.; Meng, S. Impact of sampling for landslide susceptibility assessment using interpretable machine learning models. Bull. Eng. Geol. Environ. 2024, 83, 1–19. [Google Scholar] [CrossRef]
  46. Henriques, C.; Zêzere, J.L.; Marques, F. The role of the lithological setting on the landslide pattern and distribution. Eng. Geol. 2015, 189, 17–31. [Google Scholar] [CrossRef]
  47. Pregnolato, M.; Winter, A.O.; Mascarenas, D.; Sen, A.D.; Bates, P.; Motley, M.R. Assessing flooding impact to riverine bridges: An integrated analysis. Nat. Hazards Earth Syst. Sci. 2022, 22, 1559–1576. [Google Scholar] [CrossRef]
  48. Wu, C.-H.; Chen, S.-C.; Chou, H.-T. Geomorphologic characteristics of catastrophic landslides during typhoon Morakot in the Kaoping Watershed, Taiwan. Eng. Geol. 2011, 123, 13–21. [Google Scholar] [CrossRef]
Figure 1. Study area with location map illustrating North Carolina’s mountain area. (a) North Carolina’s distinct physiographic region distribution, (b) Blue Ridge Mountain area, and (c) hypothetical Appalachian Mountain formation during the Alleghenian orogeny.
Geotechnics 04 00064 g001
Figure 2. Path of Hurricane Helene moving through the Gulf of Mexico and landing near Perry, Florida as a Category 4 storm. Note the mountainous topography of western North Carolina.
Geotechnics 04 00064 g002
Figure 3. A composite representation of damaged bridges and landslide locations after Hurricane Helene.
Geotechnics 04 00064 g003
Figure 4. Some of the landslide locations after Hurricane Helene. (Photo credit: Shen-En Chen, Sophia Lin, and Qifan Zhao).
Geotechnics 04 00064 g004
Figure 5. A schematic of the calculation workflow for the probability of multi-hazard (wildfire, landslide, earthquake, and flooding) occurrence map, the probability of wildfire occurrence map, and of bridges of average flooding potential (AFP). Note that L+W+E represents landslides, wildfires, and earthquakes, and L+E represents landslides and earthquakes.
Geotechnics 04 00064 g005
Figure 6. Multi-hazard (without wildfire effect) risk map of North Carolina.
Geotechnics 04 00064 g006
Figure 7. Multi-hazard (with wildfire effect) susceptibility map of North Carolina.
Geotechnics 04 00064 g007
Figure 8. Multi-hazard susceptibility map in North Carolina with reported landslide locations: (a) landslide, wildfire, and earthquake; (b) landslide and earthquake.
Geotechnics 04 00064 g008
Figure 9. Analysis of reported landslides with the corresponding susceptibility probabilities: (a) multi-hazard scenario L+W+E; (b) multi-hazard scenario L+E; (c) difference between L+W+E and L+E; and (d) bar chart comparing the two scenarios by number of slides. Note that L+W+E represents landslides, wildfires, and earthquakes and L+E represents landslides and earthquakes.
Geotechnics 04 00064 g009
Figure 10. Hurricane Helene landslide damage to transportation structures and facilities: (a) by a roadside near Lake Lure; (b) by a parking space near Chimney Rock; (c) near a parking lot in Chimney Rock Village; and (d) below a county highway in Henderson County (Photo credit: Shen-En Chen, Sophia Lin, and Qifan Zhao).
Geotechnics 04 00064 g010
Figure 11. Hurricane Helene landslide damage to bridge structures: (a) Main Street bridge over a railroad, Saluda, NC; (b) bridge near Lake Lure; (c) the Big Hungry Road Bridge, Flat Rock; and (d) dam crossing, Lake Lure. (Photo credit: Shen-En Chen, Sophia Lin, and Qifan Zhao).
Geotechnics 04 00064 g011
Figure 12. Hurricane Helene flood-battered region in Chimney Rock Village, NC: (a) washed away bridge on the Chimney Rock Scenic Road over the Broad River, Chimney Rock Village, NC; (b) view from Main Street looking over Broad River; (c) scoured Broad River valley in front of Burnshirt Vineyards Bistro on Main Street, Chimney Rock Village, NC; and (d) the parking lot in front of Burnshirt Vineyards Bistro on Main Street, Chimney Rock Village, NC. (Photo credit: Shen-En Chen, Sophia Lin, and Qifan Zhao).
Geotechnics 04 00064 g012
Figure 13. Helene landslides and the associated susceptibility values as an accumulated function. Susceptibility values for the following multi-hazard scenarios: L+E (landslide and earthquake) and L+W+E (landslide, wildfire, and earthquake).
Geotechnics 04 00064 g013
Figure 14. Landslides with zero and 99~100% predictions for (a) without wildfire effects and (b) with wildfire effects.
Geotechnics 04 00064 g014
Figure 15. Conditioning factors used in this study, including reported landslides: (a) Elevation; (b) slope; (c) aspect; (d) soil type; (e) rainfall; (f) temperature; (g) forest cover; (h) distance to rivers; (i) distance to faults; (j) distance to roads; (k) distance to high population density; and (l) probability of wildfire occurrence.
Geotechnics 04 00064 g015
Figure 16. Typical bridge scour damage mechanism, including the formation of scour holes (local scour) around bridge piers, which can result in increased stress in the supporting geo-medium (riverbed material): (a) typical scour mechanism; (b) geo-medium stressing due to scour hole formation; (c) scour depths due to clear water scour vs. live-bed scour.
Geotechnics 04 00064 g016
Figure 17. Debris slide and scour combined mass waste mechanism of the Big Hungry River: (a) whole view of the Big Hungry Road (County route 1889) landslide, Flat Rock, NC; and (b) closeup of the slide and the river deposits, and (c) landslide assumption by [36].
Geotechnics 04 00064 g017
Figure 18. Reconstruction of the Big Hungry Road Bridge: (a) on the Flat Rock side; (b) on the Flat Rock side; (c) on the Flat Rock side, and (d) opposite to Flat Rock.
Geotechnics 04 00064 g018
Disclaimer/Publisher’s Note: The statements, opinions and data contained in all publications are solely those of the individual author(s) and contributor(s) and not of MDPI and/or the editor(s). MDPI and/or the editor(s) disclaim responsibility for any injury to people or property resulting from any ideas, methods, instructions or products referred to in the content.

