Article

Three-Dimensional Spectral Element Method Implementation for Evaluating Rooted Soil Behavior in Slope Stability Analysis

by
Ram Chandra Tiwari
1 and
Netra Prakash Bhandary
2,*
1
Department of Civil Engineering, Institute of Engineering, Pulchowk Campus, Tribhuvan University, Kathmandu 44601, Nepal
2
Department of Environmental Design, Faculty of CRI, Graduate School of Science and Engineering, Ehime University, Matsuyama 790-8577, Japan
*
Author to whom correspondence should be addressed.
Geotechnics 2024, 4(3), 893-917; https://doi.org/10.3390/geotechnics4030046
Submission received: 4 August 2024 / Revised: 4 September 2024 / Accepted: 5 September 2024 / Published: 8 September 2024

Abstract

:
Bioengineering techniques are being increasingly adopted as a sustainable solution to soil slope instability. Despite their recognized benefits, however, the mechanistic contribution of vegetation to slope stability remains inadequately understood due to the intricate nature of soil–root interactions and the complexity of root architectures. Most existing research predominantly offers qualitative assessments of vegetation effectiveness. This study aims to numerically substantiate the role of vegetation as a bioengineering technique for soil slope stabilization. Various plant species used commonly for soil stabilization were identified, and undisturbed soil samples were collected to quantify the shear strength parameters of the soils from both barren and vegetated slopes, along with root tensile strengths. A comprehensive topographic survey was conducted to capture the precise topography of the study area. Utilizing these primary data, in this work we develop 3D models for five representative plants within each species category and employ the Spectral Element Method (SEM), an advanced higher-order formulation of the finite element method (FEM), within the 3D domain to evaluate the factor of safety for the soil slopes. The SEM offers superior accuracy and stability in numerical computations. The results obtained through the SEM were corroborated through the FEM modeling and were found to be consistent with other established methodologies. This innovative approach of 3D SEM aims to quantitatively assess the impact of vegetation on soil slope stability and provide a more rigorous understanding of bioengineering applications in geotechnical engineering.

1. Introduction

Bioengineering techniques in soil slope stabilization employ vegetation, either individual plants or plant assemblages, as an engineered material characterized by quantifiable attributes and behaviors that significantly influence various geotechnical processes such as shallow landslides, erosion, debris flow, and sediment balance, primarily through its mechanical effects [1,2,3]. In the realm of soil slope stability, the reinforcement provided by plant roots emerges as a critical factor. However, the assessment of this reinforcement effect often remains qualitative, relying on approximate analyses [4,5].
The impact of vegetation on soil shear strength, particularly root reinforcement, has become a focal point of research. Yet, the precise quantification of root reinforcement remains challenging due to complex interactions between roots and soil, as well as the intricate nature of root networks [6,7]. Addressing these complexities requires investigating average root–soil interaction behaviors through direct shear tests on rooted soil, tensile tests on roots, and advanced three-dimensional modeling techniques [8,9].
Despite the acknowledged importance of root reinforcement in soil slope stability, existing methodologies predominantly rely on qualitative assessments. This gap persists due to the limited availability of robust quantitative data on the mechanical contributions of vegetation to slope stability. Current studies often lack standardized approaches to measure and model root–soil interactions across different environmental conditions and vegetation species [10,11].
This study aims to fill the gap by providing a comprehensive review and innovative approach for quantitatively assessing soil slope stability with a focus on root reinforcement. The primary objectives are as follows: to identify and characterize the key parameters of vegetation that govern soil slope stability, such as root tensile strength, root distribution, and root–soil interface properties [12,13]; to clarify the relationships between these governing parameters and their influence on soil shear strength and slope stability [14,1516]; and to conduct case-specific and site-specific analyses to quantify the factor of safety (FOS) for common vegetation species utilized in soil bioengineering projects, particularly in Nepal and similar regions [17,18].
This study provides a comprehensive overview of current methodologies for spatially characterizing root reinforcement and introduces innovative approaches for quantitative assessment. It focuses on generating robust data through empirical testing and advanced modeling techniques to support practical applications of bioengineering in soil slope stabilization. We expect that this research work will contribute to enhancing the scientific understanding of the role of vegetation in soil slope stability across different environmental settings, thereby promoting more reliable and effective strategies for managing soil stability and mitigating associated hazards [19,20]. Moreover, it endeavors to bridge the gap between qualitative assessments and quantitative analyses of root reinforcement effects in soil slope stability.
The findings will be applied beyond the specific geographic context of the case study by exploring the method’s adaptability to various geological conditions and slope types. This includes examining its potential application in regions with similar geotechnical challenges. By broadening the scope, the approach’s versatility and relevance across diverse scenarios in slope stability analysis can also be explored.
The 3D Spectral Element Method (SEM) is designed to deliver satisfactory results even in challenging scenarios, such as highly nonlinear material behavior, the presence of discontinuities, dynamic loading conditions, and complex soil–water interactions. As a higher-order FEM, SEM surpasses traditional FEM methods in both accuracy and efficiency, particularly in capturing detailed stress and strain distributions with lower computational costs. This makes SEM a robust and advantageous choice across a wide range of complex situations, offering more reliable performance than many conventional FEM approaches.
The following issues are raised in this paper while dealing with 3D SEM Implementation for evaluating the rooted soil behavior in slope stability analysis:
  • Limitations of SEM under variable environmental conditions: the SEM is effective in slope stability analysis, but its performance under varying environmental conditions, such as changes in moisture content or temperature, requires further investigation.
  • Variability of root properties across species and environmental conditions: while the paper addresses root property variability, it can explore how different species and environmental conditions impact root–soil interactions.
  • Integration into broader geotechnical practices and policy development: the findings have significant implications for geotechnical practices and policy development, particularly in regions like Nepal.
  • Scope of applicability and limitations of the methodology: The 3D Spectral Element Method (SEM) consistently delivers accurate results in complex scenarios, such as nonlinear material behavior and dynamic loading conditions. Its high accuracy and efficiency make it a valuable tool for detailed stress and strain analysis, providing significant advantages over traditional methods.
This study has significant implications for advancing geotechnical practices and policy development. The 3D SEM provides a detailed and accurate analysis of the rooted soil behavior, which is crucial for assessing slope stability, especially in complex terrains like those in Nepal. Integrating SEM’s advanced capabilities into geotechnical practices can lead to more precise and effective stabilization strategies tailored to specific site conditions.
In Nepal, the bioengineering techniques are prevalent due to their low cost, user-friendliness, environmental benefits, and adaptability to local communities. So, the mathematical justification of these techniques is essential for their optimal implementation. The SEM technique offers a robust numerical framework to justify and enhance the application of bioengineering methods. By providing detailed quantitative insights, SEM can significantly improve the effectiveness of bioengineering approaches and support more informed policy development, ensuring that infrastructure resilience and slope stability risk management are based on the latest technological advancements.

2. Materials and Methods

2.1. Field Study

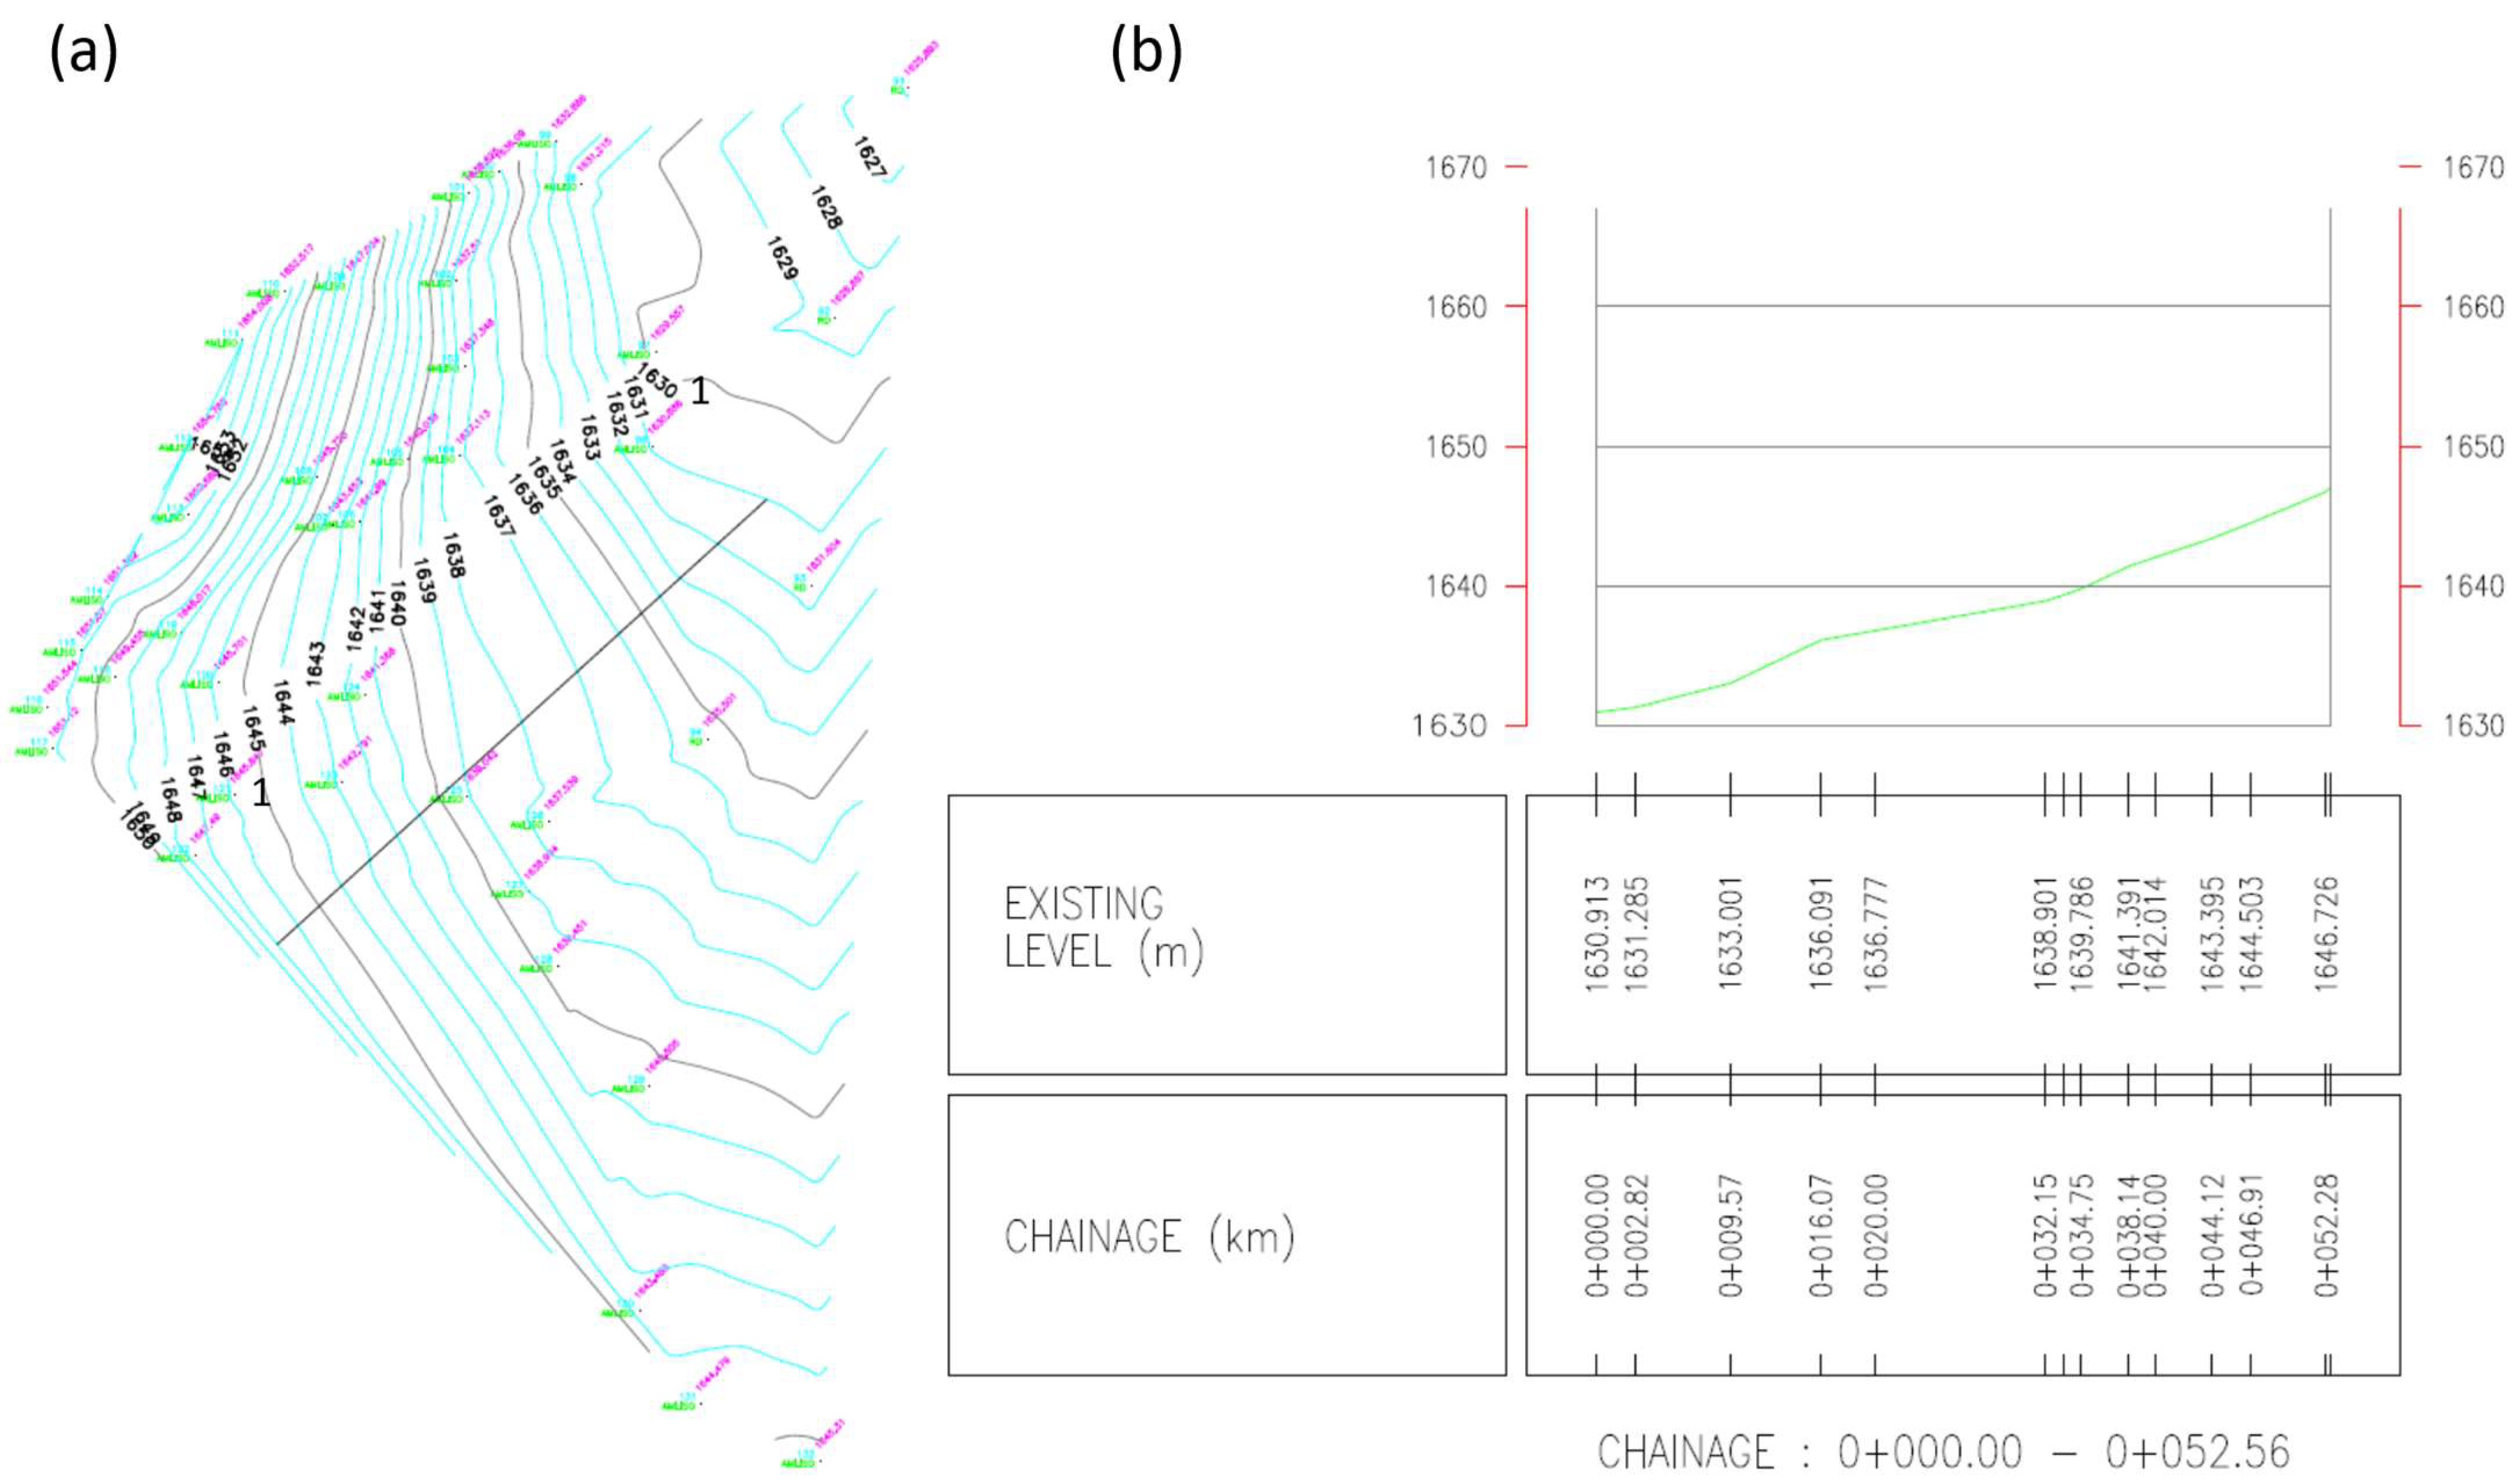
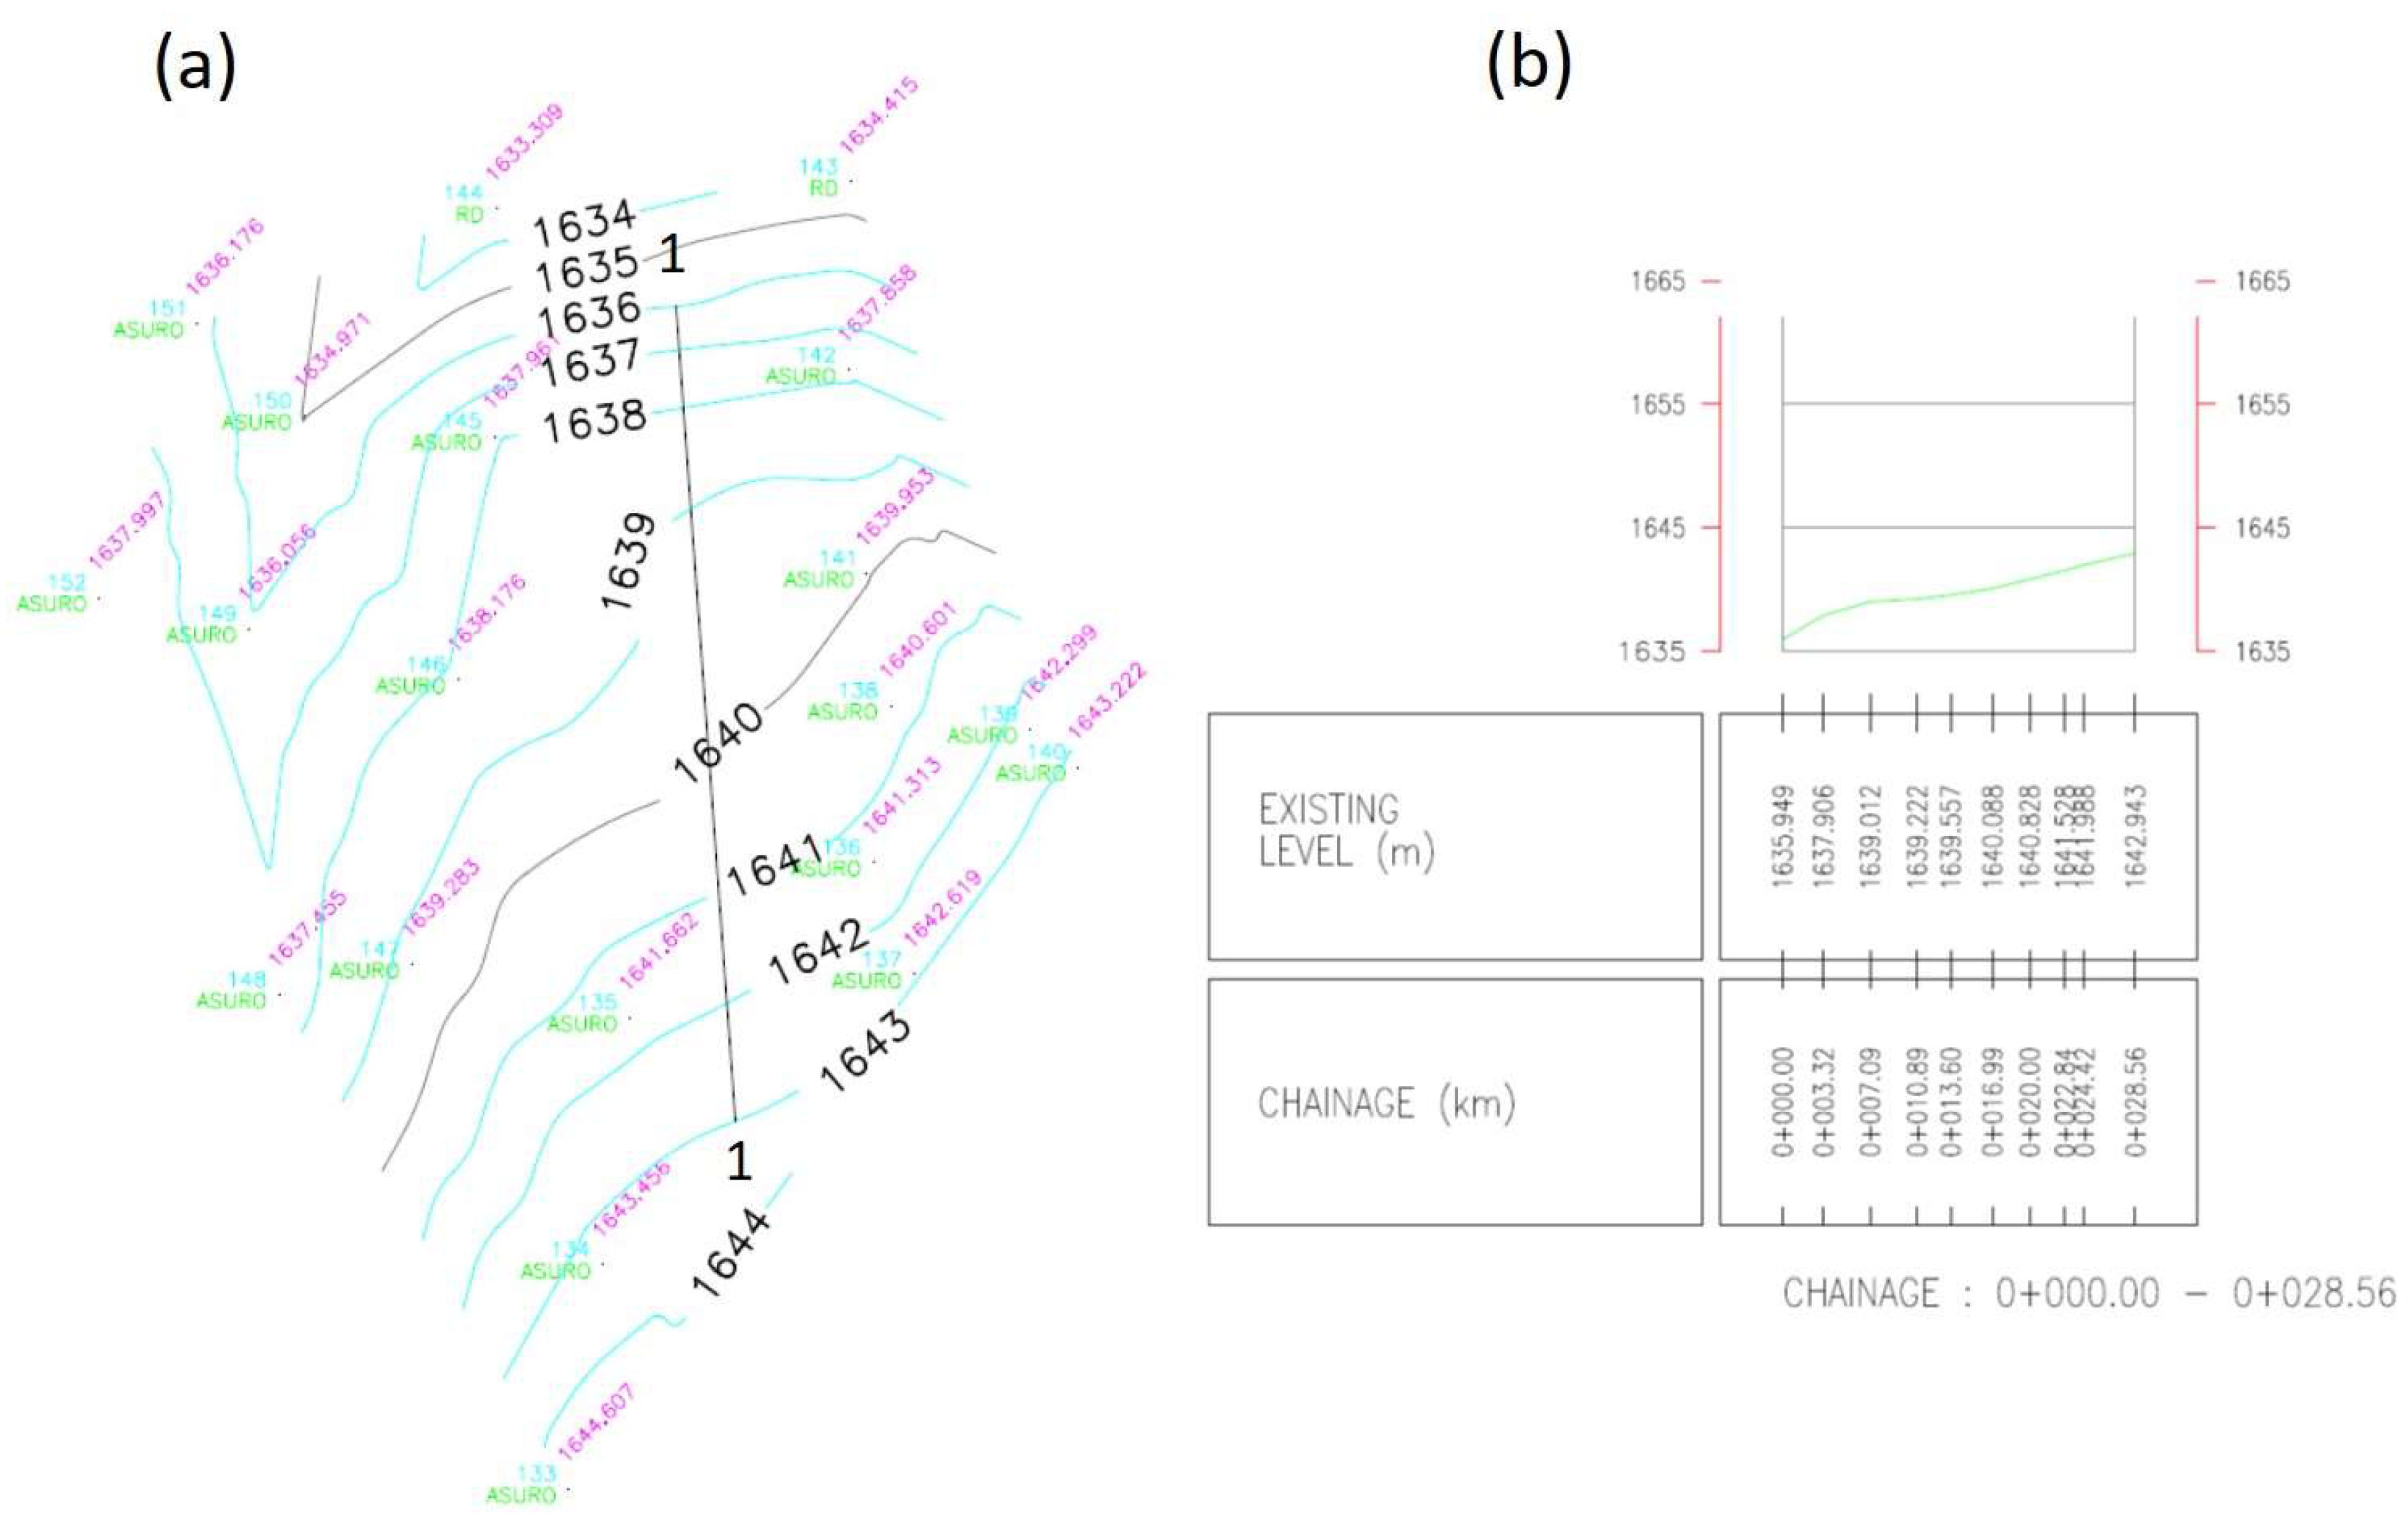
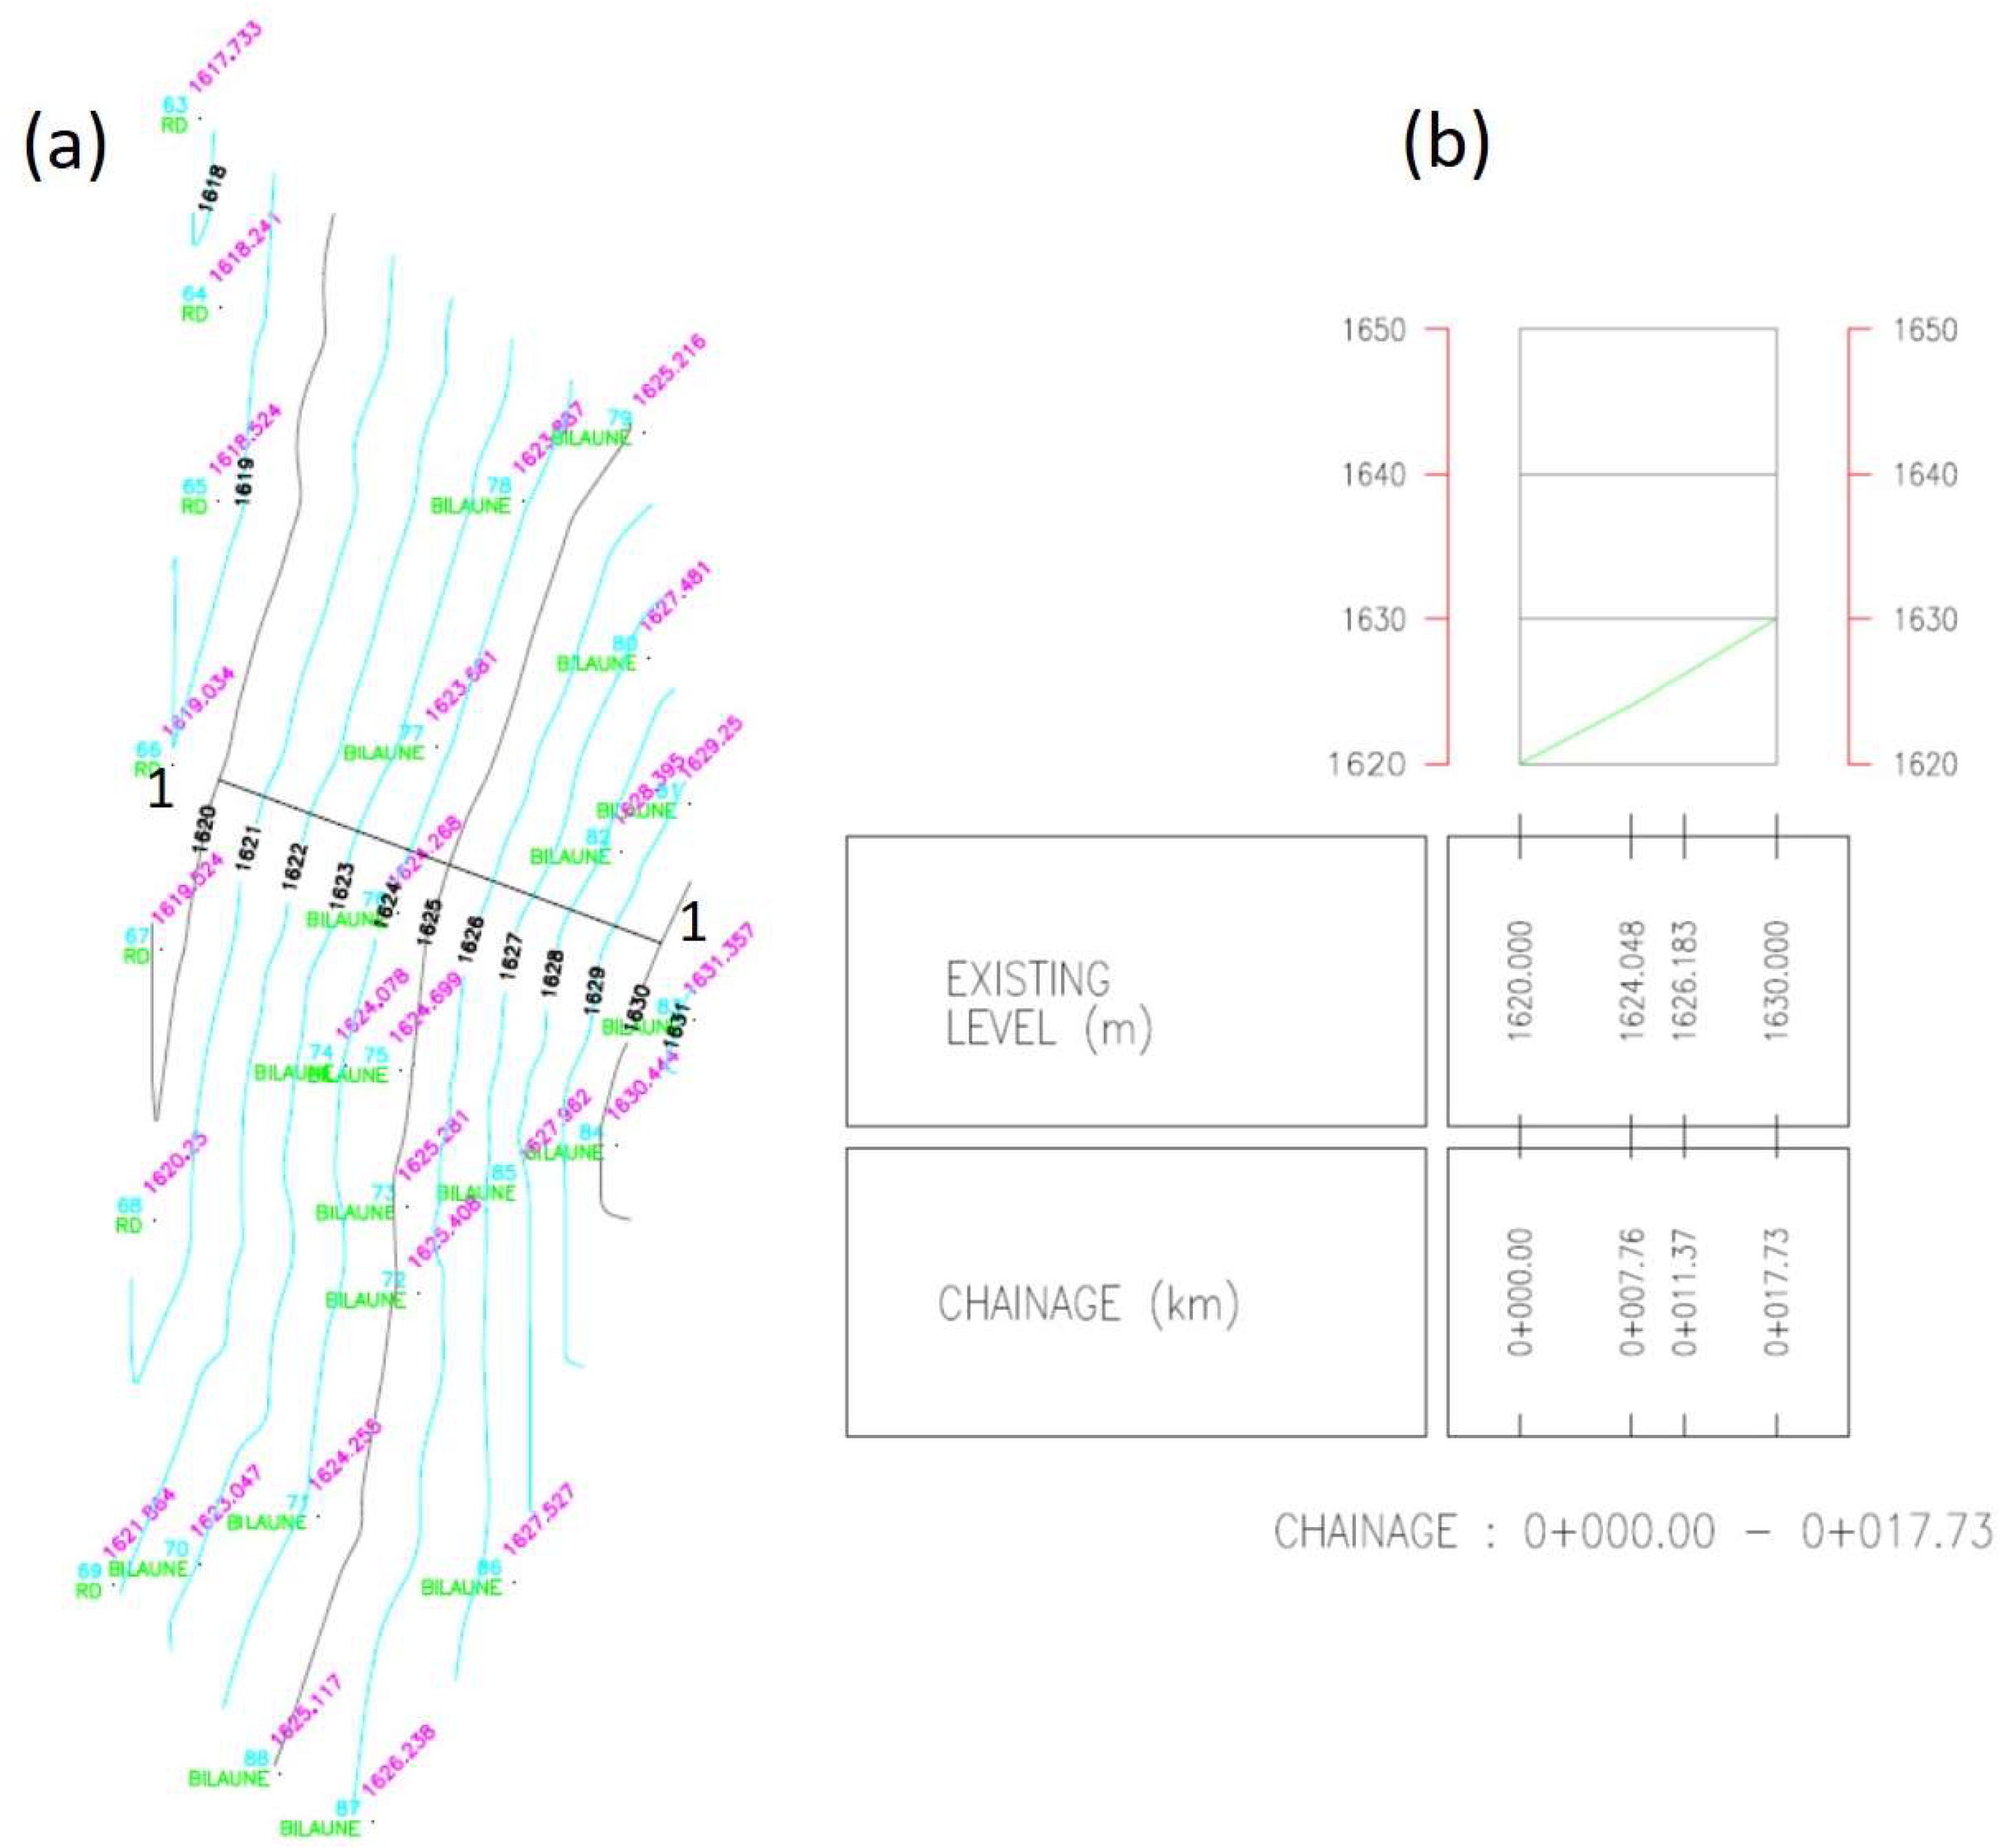
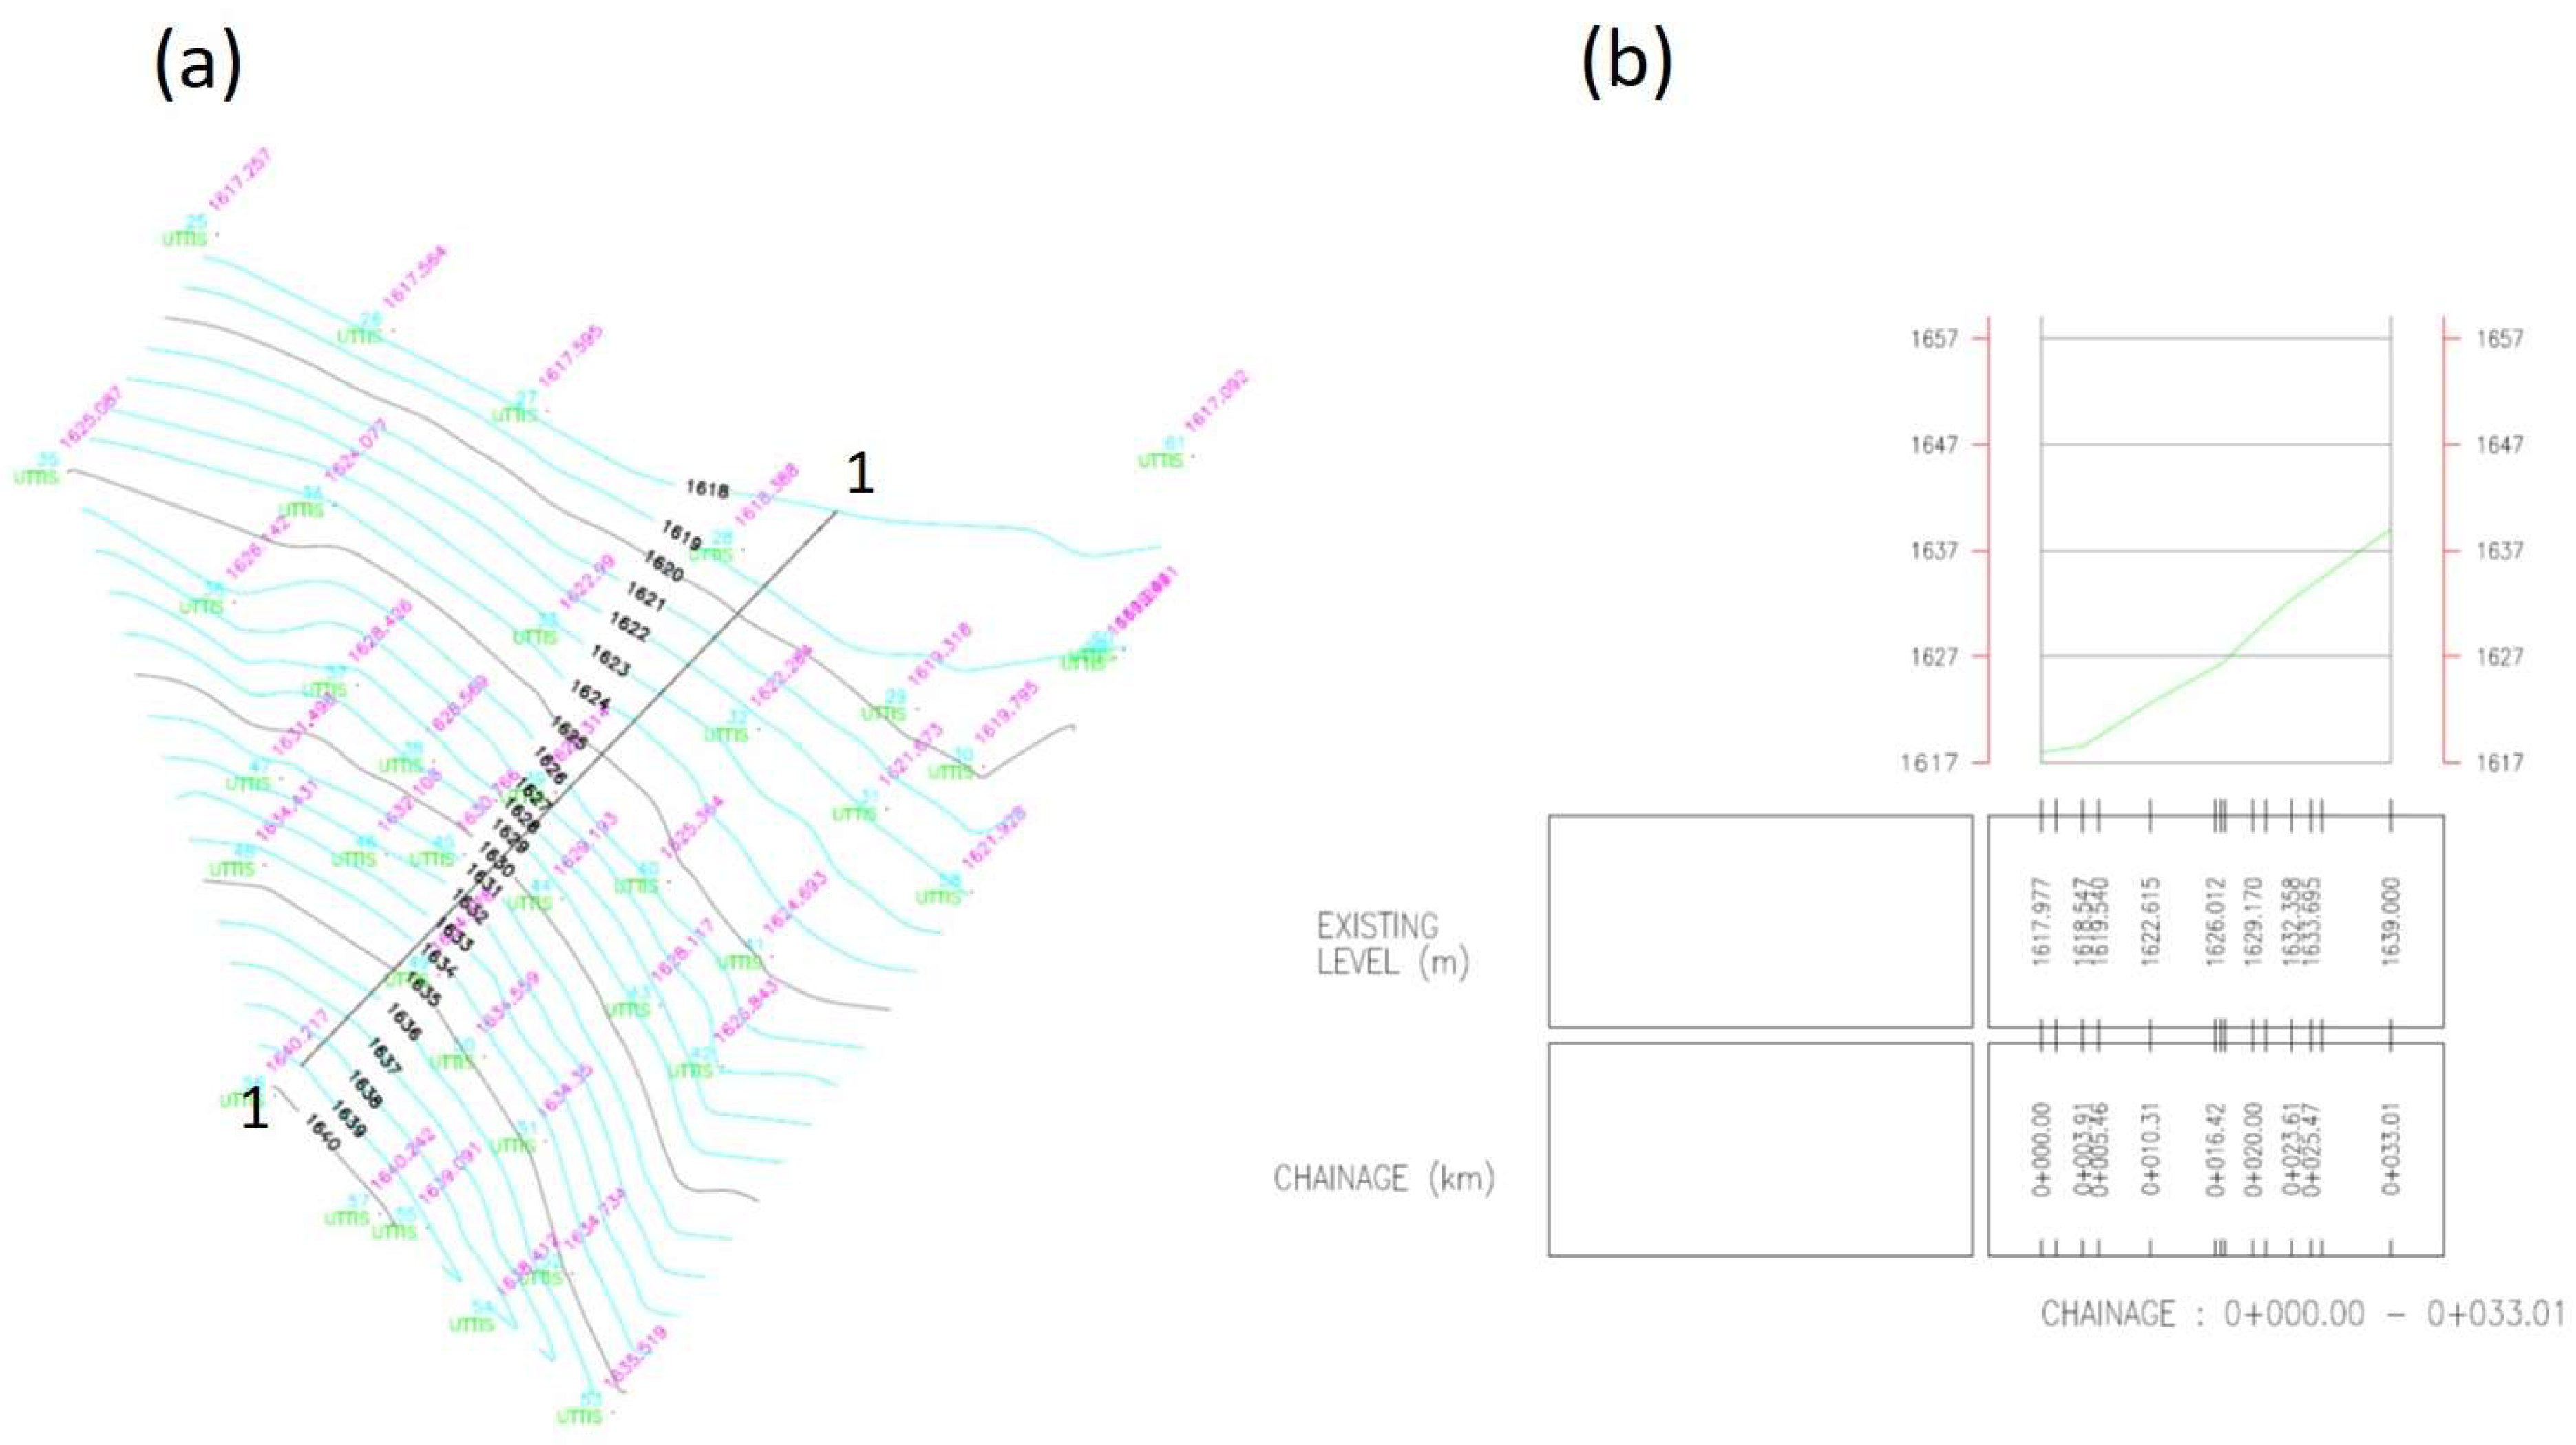
The study site is located along the Thankot-Chitlang Road in Nepal, specifically between the chainages of 2 + 580 m to 2 + 860 m. This area was chosen because of its diverse topography and vegetation, providing a suitable environment for analyzing the impact of various plant species on soil slope stability. The site is divided into five distinct zones based on the slope geometry. The topography and contour map of the site are shown in Figure 1, while the landslide zones and their corresponding profiles (along the line 1-1 in each figure) are presented in Figure 2, Figure 3, Figure 4, Figure 5 and Figure 6. Each zone was analyzed individually, focusing on different plant species categorized as grass, shrub, and tree, all locally available and considered for their engineering properties. The zones were modeled based on the following plant species:
  • Zone—I: modeled for Cynodon dactylon (locally known as Dubo, a grass species) as shown in Figure 2.
  • Zone—II: modeled for Thysanolaena maxima (locally known as Amliso, another grass species) as shown in Figure 3.
  • Zone—III: modeled for Adhatoda vasica (locally known as Assuro, a shrub species) as shown in Figure 4.
  • Zone—IV: modeled for Maesa chisia (locally known as Bilaune, another shrub species) as shown in Figure 5.
  • Zone—V: modeled for Alnus nepalensis (locally known as Uttis, a tree species) as shown in Figure 6.
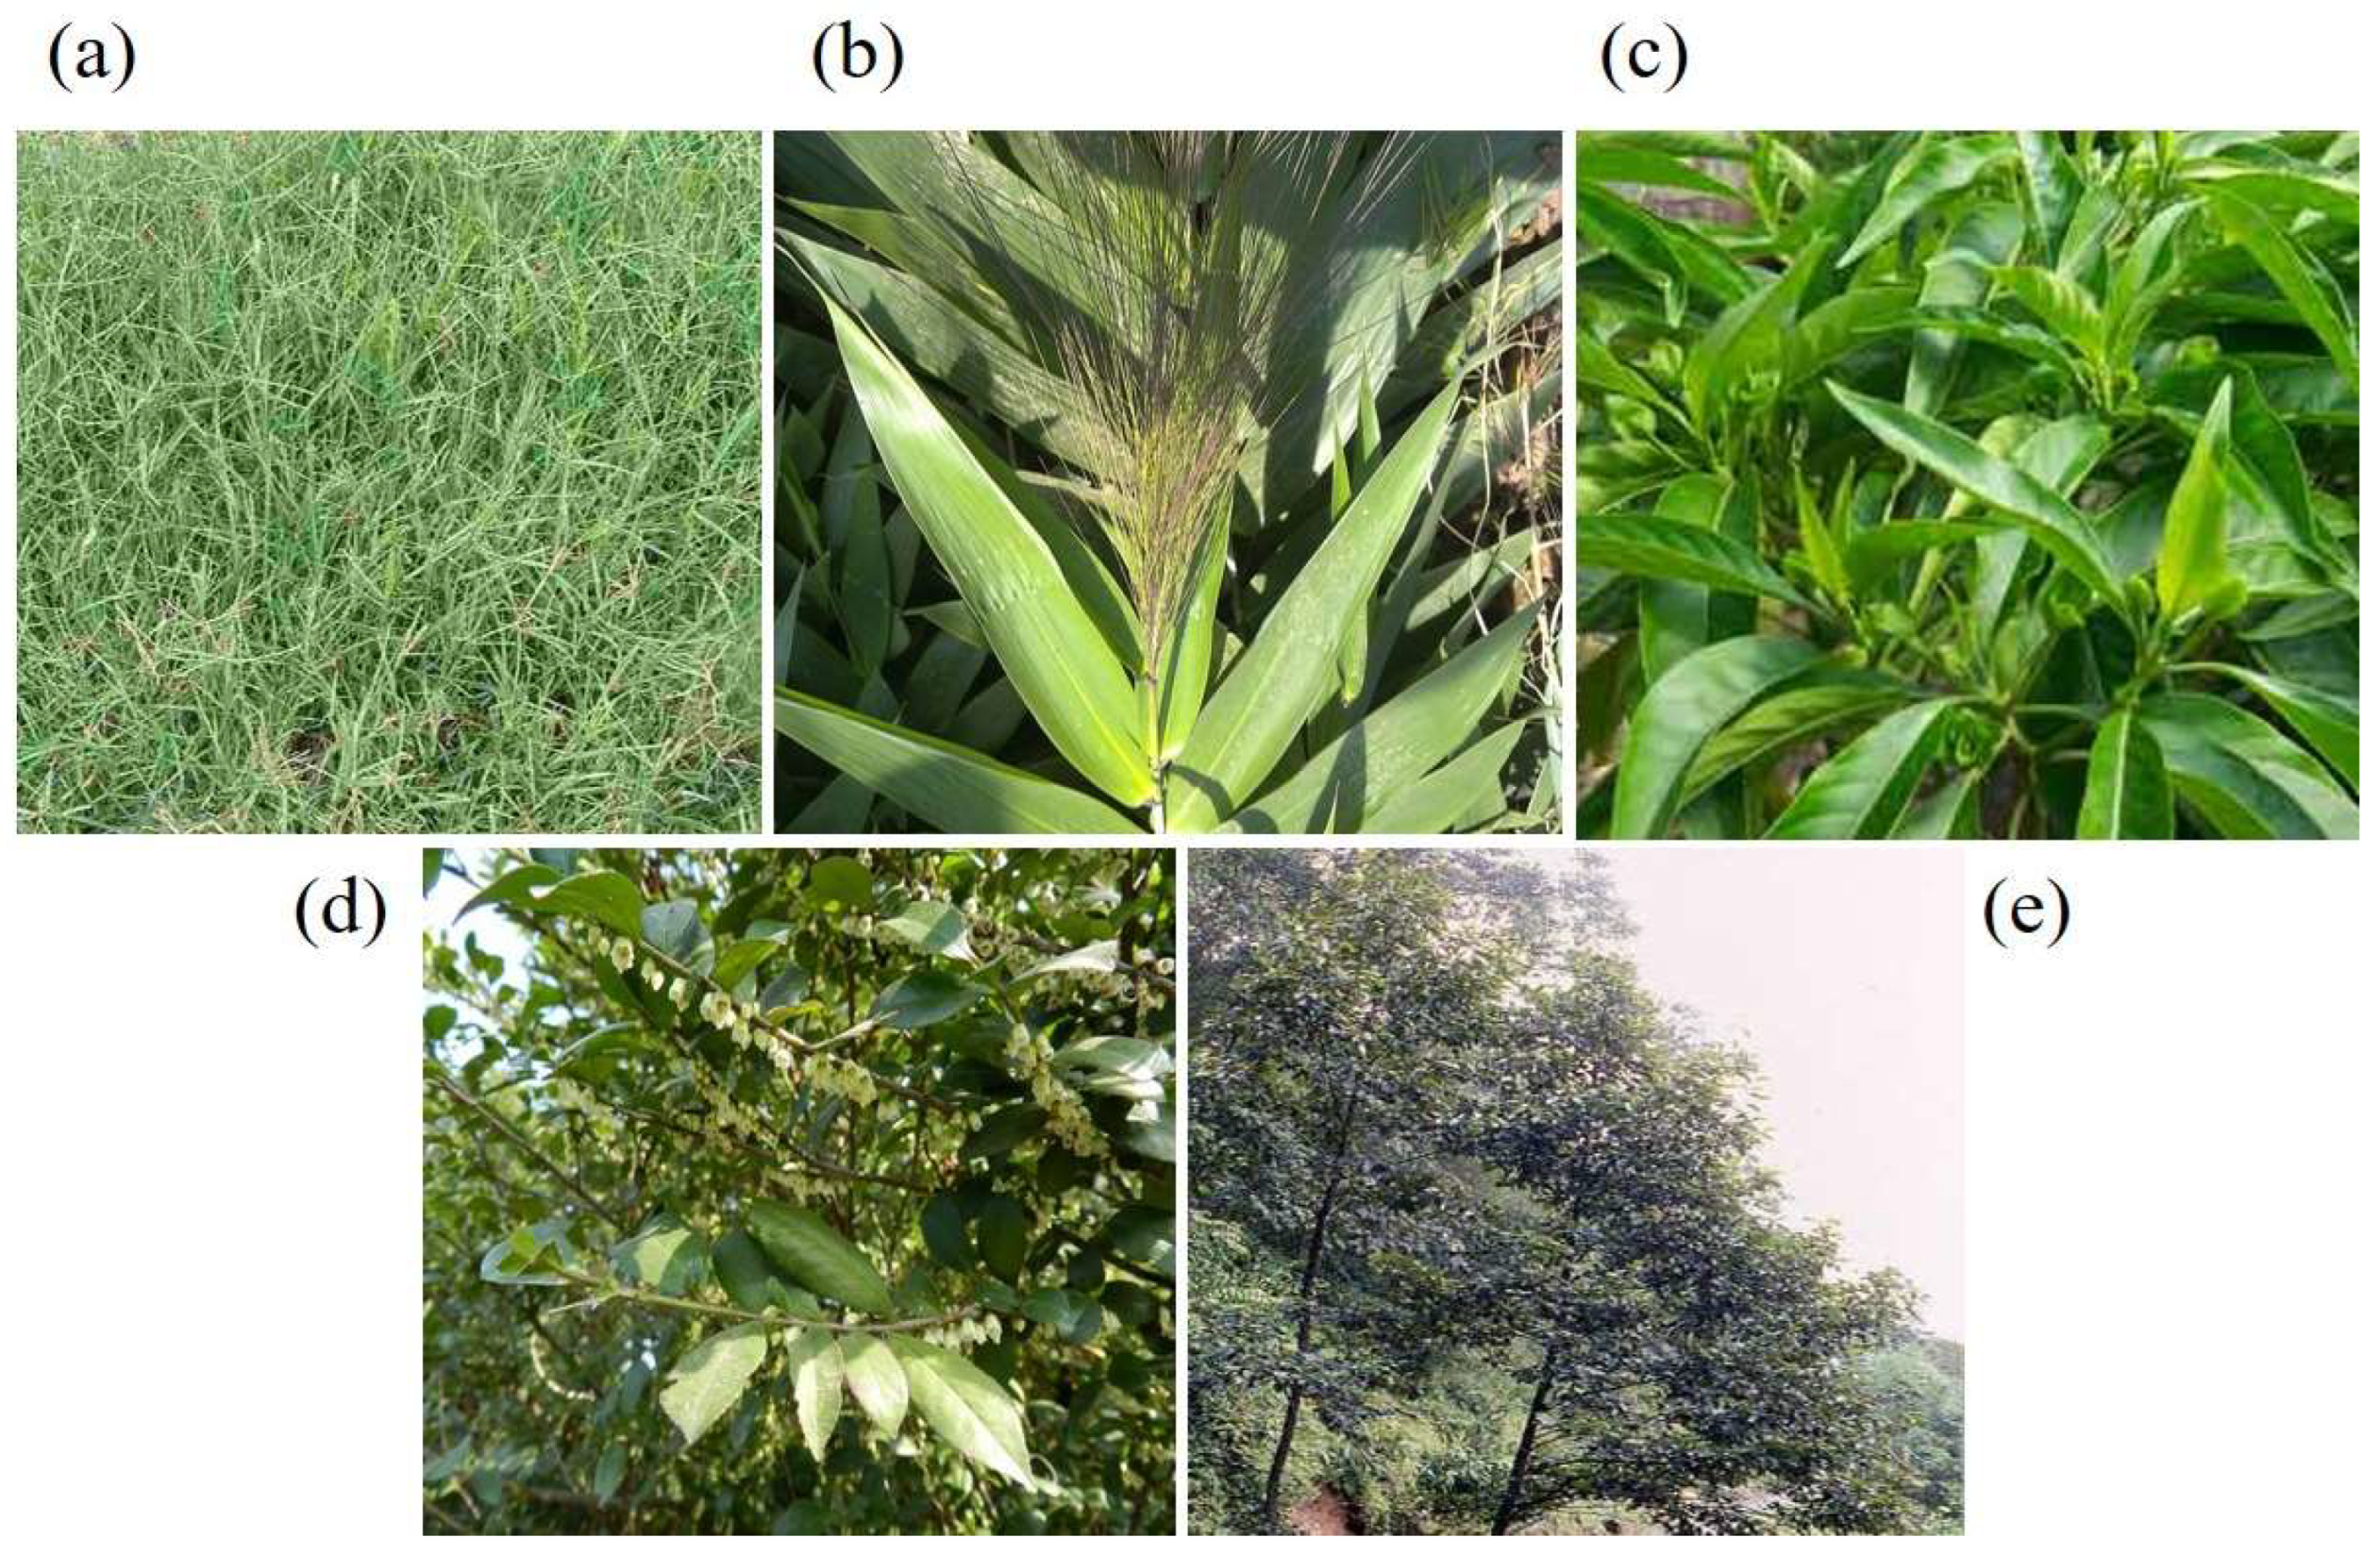
The plants selected for landslide Zone—I to Zone—V are illustrated in Figure 7a–e. Figure 7a shows Cynodon dactylon (locally known as Dubo, a grass species) which is predominant in landslide Zone—I. Figure 7b is Thysanolaena maxima (locally known as Amliso, also a grass species) featured in landslide Zone—II. Figure 7c is Adhatoda vasica (locally known as Assuro, a shrub species) of landslide Zone—III. Figure 7d Maesa chisia (locally known as Bilaune, a shrub species) of landslide Zone—IV. Finally, Figure 7e illustrates Alnus nepalensis (locally known as Uttis, a tree species) which is prevalent in landslide Zone—V.
During the site visit, a comprehensive set of tasks was undertaken to gather necessary data for the analysis. The tasks were as follows:
  • Site inspection: a detailed inspection of the study area to understand the existing conditions and identify key features relevant to the study.
  • Total station survey: conducting a precise survey using total station equipment to capture accurate topographic data and contour mapping.
  • Soil sample collection: collecting undisturbed soil samples from both barren areas and regions with vegetation (soil with and without roots). This was crucial for comparing the mechanical properties of soils in different conditions.
  • Root sample collection: extracting root samples to study their mechanical properties and their contribution to soil reinforcement.
  • Measurement of Root Area Ratio (RAR): conducting trench profiling to measure the Root Area Ratio (RAR) at various depths. This metric is vital for understanding the density and distribution of roots within the soil.
The primary focus of the field study was to explore the strength parameters of vegetation and their influence on soil slope stability. By integrating these biological elements with engineering principles, we developed a soil-bioengineering slope model that reflects the real-world conditions. This model takes into account site-specific variables such as soil parameters, slope geometries, groundwater positions, and the mechanical properties of different types of vegetation.
By employing a case- and site-specific approach, the study provides a true reflection of the actual conditions at the study site. This approach ensures that the findings and proposed solutions are tailored to the unique characteristics of the area, offering practical and effective strategies for enhancing soil slope stability using vegetation. The detailed analysis of different plant species and their mechanical interactions with soil offers valuable insights into the potential of bioengineering solutions in mitigating slope instability.

2.2. Field and Lab Test Data

For this study, it was essential to determine the shear resistance of rooted soil, focusing on the soil cohesion and frictional angle as well as the tensile strength of the plant roots. These parameters were evaluated alongside the basic soil property data. For the direct shear tests, undisturbed soil samples were extracted from the field using molds, ensuring that each sample represented the soil surrounding a specific plant species. The undisturbed samples were obtained through trench profiling, which also facilitated the measurement of Root Area Ratio (RAR) at varying trench depths.
We examined five locally available plant species from the three categories of grass, shrub, and tree. Various tests and modeling efforts were conducted for each species within specific zones, and tailored to their characteristics. Zone—I, situated at a chainage of 2 + 580 m, featured Cynodon dactylon, commonly known as Dubo in Nepal. Zone—II, located at a chainage of 2 + 800 m, was characterized by Thysanolaena maxima, locally referred to as Amliso. Adhatoda vasica or Asuro (local name), was selected for Zone—III, located at a chainage of 2 + 860 m. Maesa chisia, locally known as Bilaune, was designated for Zone—IV at a chainage of 2 + 600 m. Finally, Alnus nepalensis or Uttis (local name), was assigned to Zone—V at a chainage of 2 + 610 m, all along the Thankot-Chitlang Road in Nepal. The general characteristics of these five bioengineering plants are detailed in Table 1, based on Howell [17,18].
For each plant species, six molds were prepared, with three containing soil samples with roots and three without roots. Direct shear tests and root tensile strength tests were conducted on the undisturbed vegetated and barren slope soil samples from the five sites. The root tensile strength tests were performed using a root tensile test machine manufactured by Japsin Industrial Instrumentation in New Delhi, India (Figure 8). This testing machine is equipped with a digital recording device to measure the load at failure. It operates with a power-driven mechanism capable of recording loads ranging from 0.1 to 500 kg. The machine comprises two clamps that hold the root sample at both ends. The upper clamp is fixed to a holder, while the lower clamp is pulled down by an electric motor until the root fails. The maximum load displayed on the digital recording device represents the tensile strength of the root specimen. For these tests, one-year matured root specimens from each of the five plant species were selected.
Additionally, a topographic survey was conducted using a total station instrument to accurately capture the site contours. This survey provided essential data to support the overall analysis and modeling efforts.
This study comprehensively evaluates the interaction between plant roots and soil in terms of shear resistance and tensile strength. The data obtained from direct shear tests, root tensile tests, and topographic surveys have contributed to a robust understanding of the soil–plant dynamics in the context of the bioengineering applications.
To ensure the integrity of the test specimens, the root samples need to be extracted safely from the trench profiling. The diameter and length of each extracted root sample were meticulously measured. The lengths of the extracted root samples were approximately 10 cm, while the specific length was 7.5 cm because the clear vertical spacing between the clamping jaws of the tensile strength testing machine is only 7.5 cm, allowing for adequate grip during testing.
To prepare the root samples, the outer bark of each root was carefully removed. This process ensures that the samples are clean and free from any external factors that might affect the test results. Special attention was given to select the root samples of minimum diameter, as this is critical for consistency in testing and to accurately assess the tensile strength.
To ensure reliable results, the root specimens must be tested in their fresh conditions as soon as they are prepared. We conducted the tests on roots within six hours of the sampling time to prevent any deterioration or loss of moisture, which could significantly impact the root tensile strength. By adhering to this strict timeline, we believe that the integrity and accuracy of the test results were adequately maintained.
In measuring the root tensile strength, we adopted the following steps:
  • Measurement of roots: First, the number of roots and the diameters of the main roots, root branches, and root sub-branches were measured. This comprehensive measurement ensures that all components of the root system are accounted for.
  • Preparation of root specimens: The diameter of the straight root specimen, excluding the outer bark, was measured. Each specimen was approximately 10 cm in length to fit the testing machine specifications.
  • Attachment to testing machine: The prepared root specimen was then connected vertically to the tensile strength testing machine. It was clamped at one end, while the other end was fixed to a holder, which is pulled down by an electric motor until the root fails.
  • Recording maximum load: The maximum load observed in the digital recording instrument was recorded. This load represents the tensile strength of each root specimen.
  • Repetition for accuracy: the entire procedure was repeated for each specimen of every species to the ensure accuracy and reliability of the obtained results.
  • Calculation of tensile strength: The average tensile strength of the roots (in MPa) was calculated using the root diameter and the recorded failure load. This calculation provides a standardized measure of tensile strength across different root samples.
  • Computing average tensile strength: The average tensile strength of roots within the selected diameter range was computed for all tested species. This step ensures that the tensile strength data are representative of the root population.
In addition to the root tensile strength tests, direct shear tests were conducted on various soil samples along with the basic soil parameter tests. These tests were conducted according to the general methods described in seminal texts on soil-bioengineering [1,2,3,10] to ensure that the tests are standardized and reliable.
Also, the Unified Soil Classification System (USCS) was utilized to classify the root-permeated soils. This classification system provides a standardized framework for understanding the soil properties in relation to root structure and function.
Moreover, the Mohr–Coulomb failure criteria were implemented in the slope model, which consisted of the following parameters: angle of shearing resistance (ϕ), cohesion (c), dilation angle (Ψ = 0), Young’s modulus (E = 105 kN/m2), Poisson’s ratio (υ = 0.3), and unit weight (γ).

2.3. Root Reinforcement Effect

Vegetation plays a crucial role in stabilizing slopes through root reinforcing effects, which primarily depend on the morphological characteristics and tensile strength of the roots [4,6,13,15,16,16,21,22,23]. Root cohesion and tensile strength are key factors that enhance soil strength and stability [24,25,26].
The deformation characteristics of the rooted or root-permeated soil are significantly influenced by the root architecture, concentration, and geometry within a soil sample. These deformation characteristics are closely related to the shear resistance of the soil, which is better understood through the mechanism by which roots reinforce the soil. The shear resistance of rooted soil can be calculated using the principles outlined in the literature [27,28], as represented in Equation (1).
S r = c + u tan φ + C r
where S r is the shear resistance of rooted soil, C r is the contribution of roots to soil shear resistance, c is the soil cohesion, u is the normal stress, and φ   is the angle of internal friction of the soil. The value of C r can be computed with the fiber breakage model as per the literature [19].
C r = α i = 1 n T i n i a i A
where T i is the maximum root tensile strength in MPa for the diameter class of i , n i is the number of roots in the diameter class, a i is the cross-sectional area of the root diameter in m2, α is the correction factor of Equation (2), which depends on the inclination of roots crossing the shear plane and its value is found to be 1–1.2, and A is the area of soil occupied by the roots in m2.
The strength threshold as per fiber breakage model (FBM) can be expressed as per Equation (3) below, where ε is the strain of class j , σ m a x j is the strength threshold, and E j is the Young’s modulus of the root fiber of class j .
σ m a x j < E j ϵ
The global behavior of roots can be further expressed as per Equation (4) below.
σ ε = j = 1 n E j ε
Understanding how roots contribute to soil shear resistance involves comprehensively analyzing the interactions between root morphology and soil mechanics. This approach allows for a detailed assessment of the stabilizing effects of vegetation on slopes, thereby enhancing our ability to utilize vegetation for soil stabilization and erosion control effectively.

2.4. Slope Models

Gravity is the primary driving force behind any slope failure or landslide. However, various factors, such as groundwater (or porewater pressure), earthquakes, deforestation, cultivation, construction activities, blasting, and earthwork can alter the geometry of a slope and adversely impact its stability. Therefore, creating accurate slope models is crucial to reflect all stabilizing and destabilizing agents. Slope topography is a key factor in developing these models, and the homogeneity or heterogeneity of the soil is a major aspect of material modeling. Traditional modeling approaches and assumptions of soil homogeneity may not be sufficient for vegetated slope stability analysis. Instead, models that consider the progressive nature of failure and the uncertainty in material properties provide more reliable evaluations of the factor of safety (FOS) for a particular slope.
The stability of a slope against failure is evaluated using a critical strength reduction factor (SRF), which correlates to the FOS. The FOS is defined as the ratio of the soil mass’s resistance to shear along a potential slip plane to the shear force acting on that plane. Soil failure occurs when this ratio falls below unity.
Specfem3D_Geotech is a free and open-source command-driven Spectral Element Method (SEM) program designed for 3D slope stability analysis. It supports both serial and parallel implementations. The source codes for this program are written in Fortran 90 and parallelized using the Message Passing Interface (MPI) and the graph partitioning tool Scotch. The program uses the Mohr–Coulomb failure criterion.
This paper highlights the superiority of the 3D SEM over traditional approaches. Emphasis is placed on its ability to accurately model complex geometries and material heterogeneities in slope stability analysis. Additionally, the method’s computational efficiency and its enhanced precision in simulating stress and strain distributions which surpass the accuracy of conventional methods are discussed.
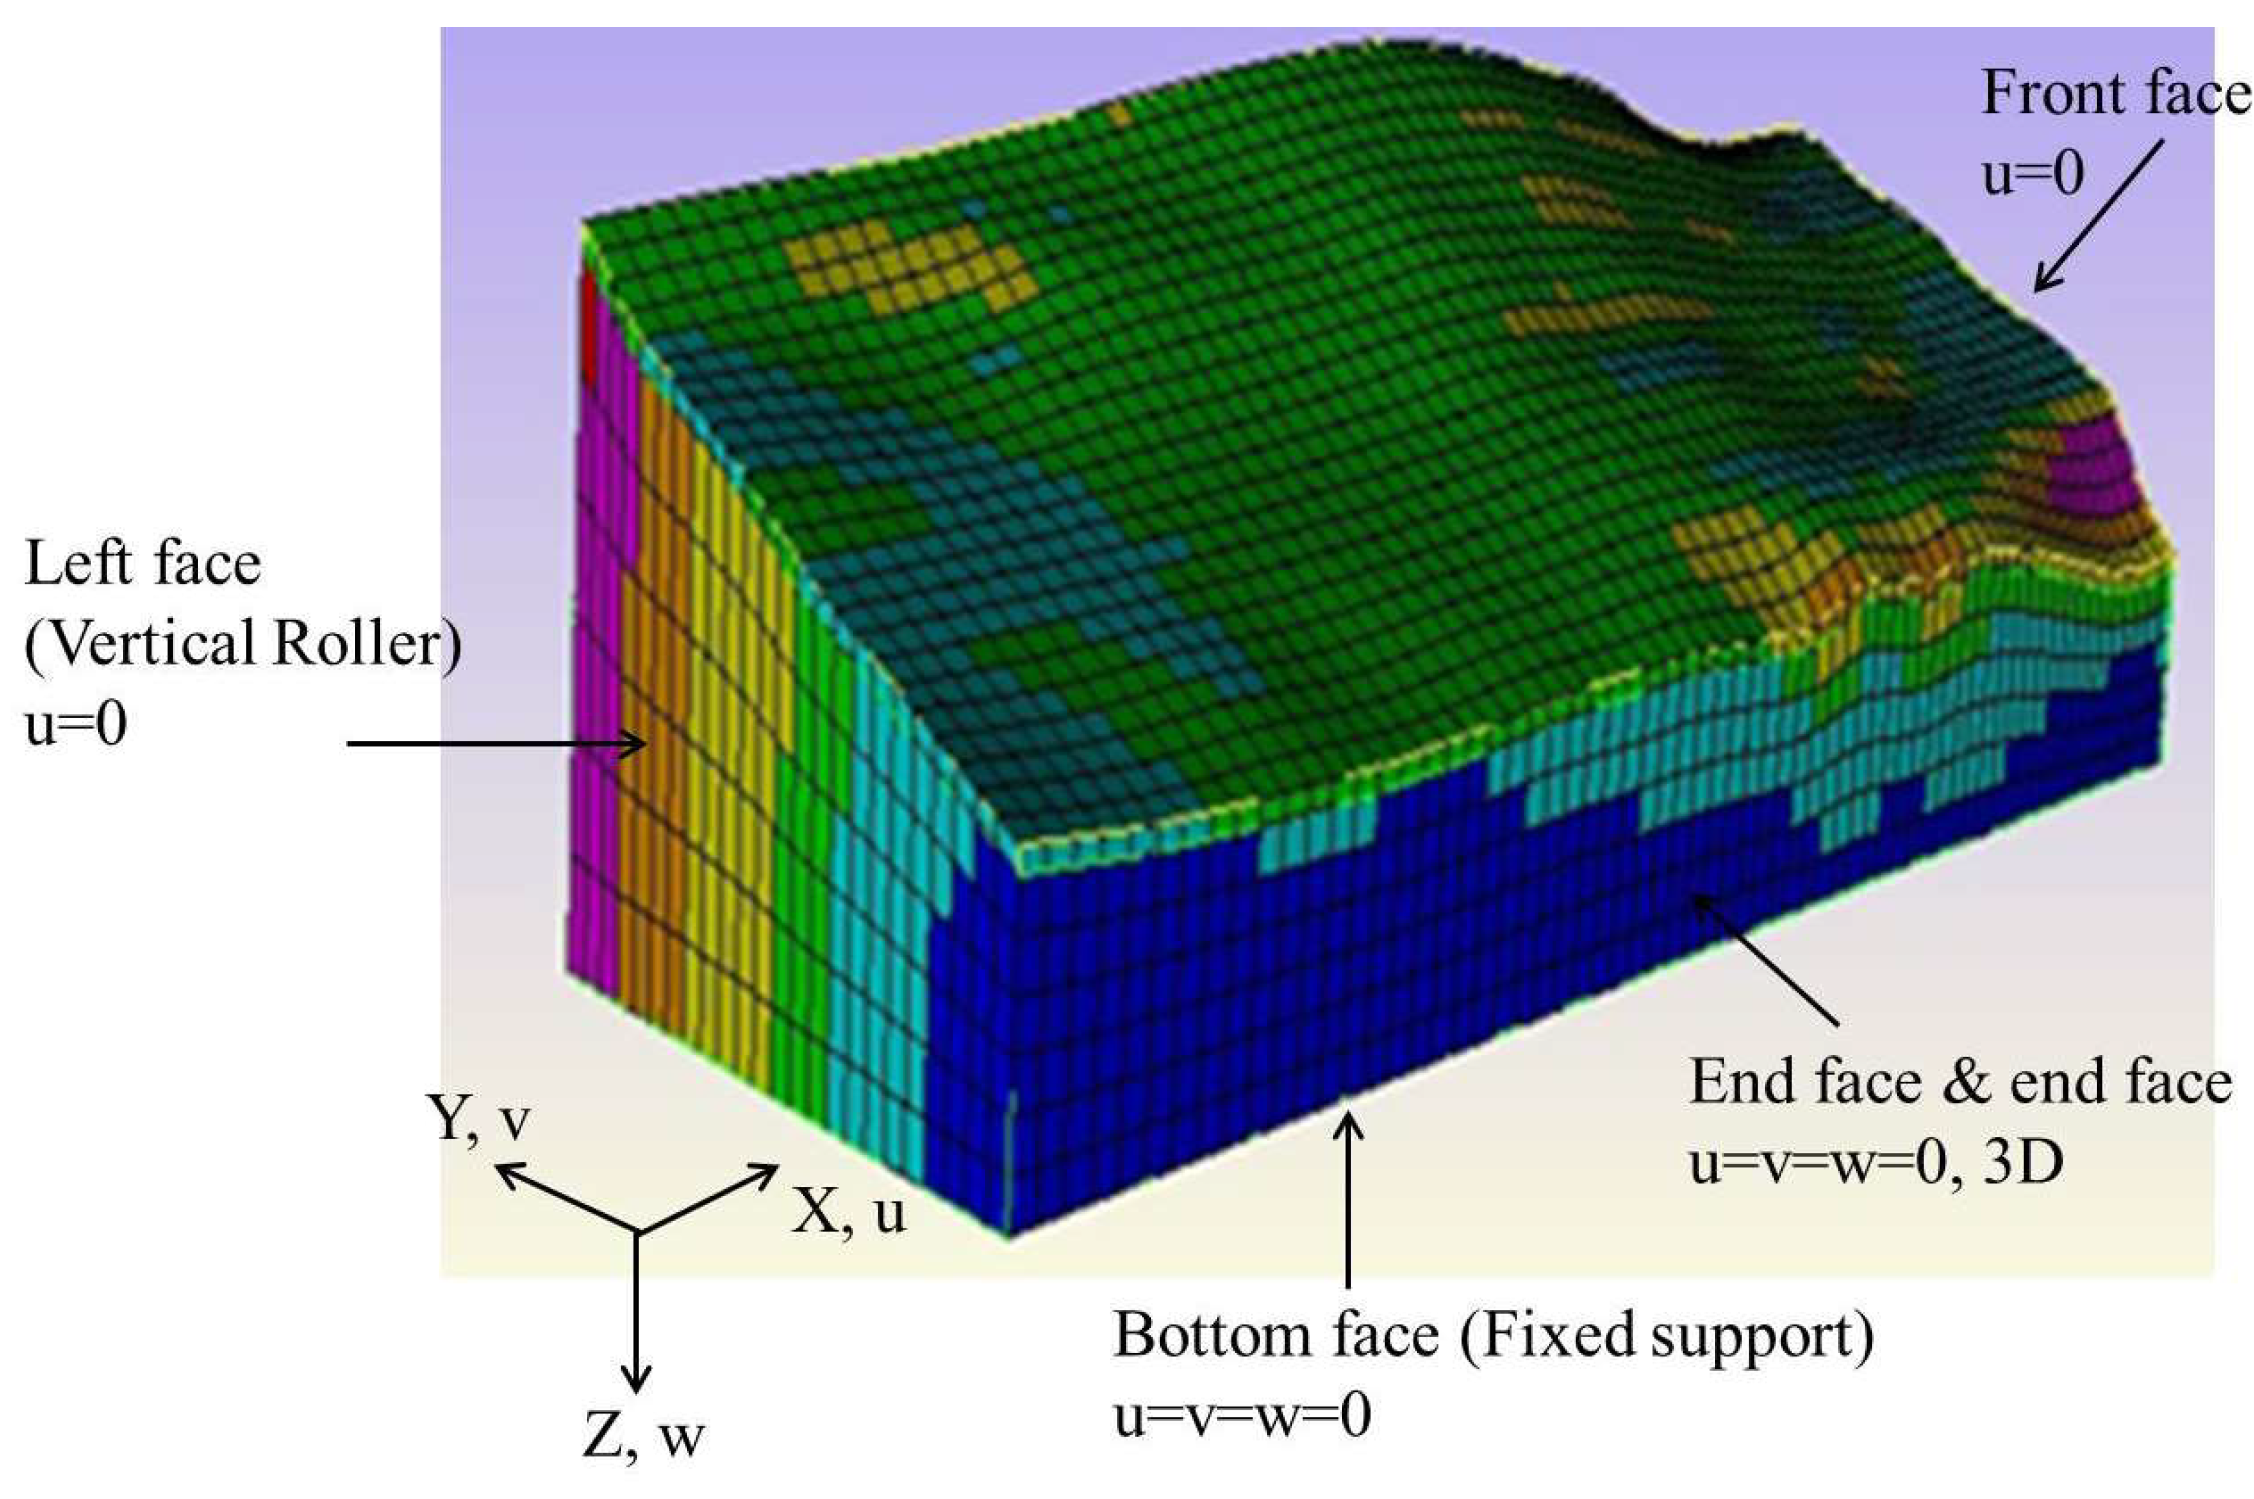
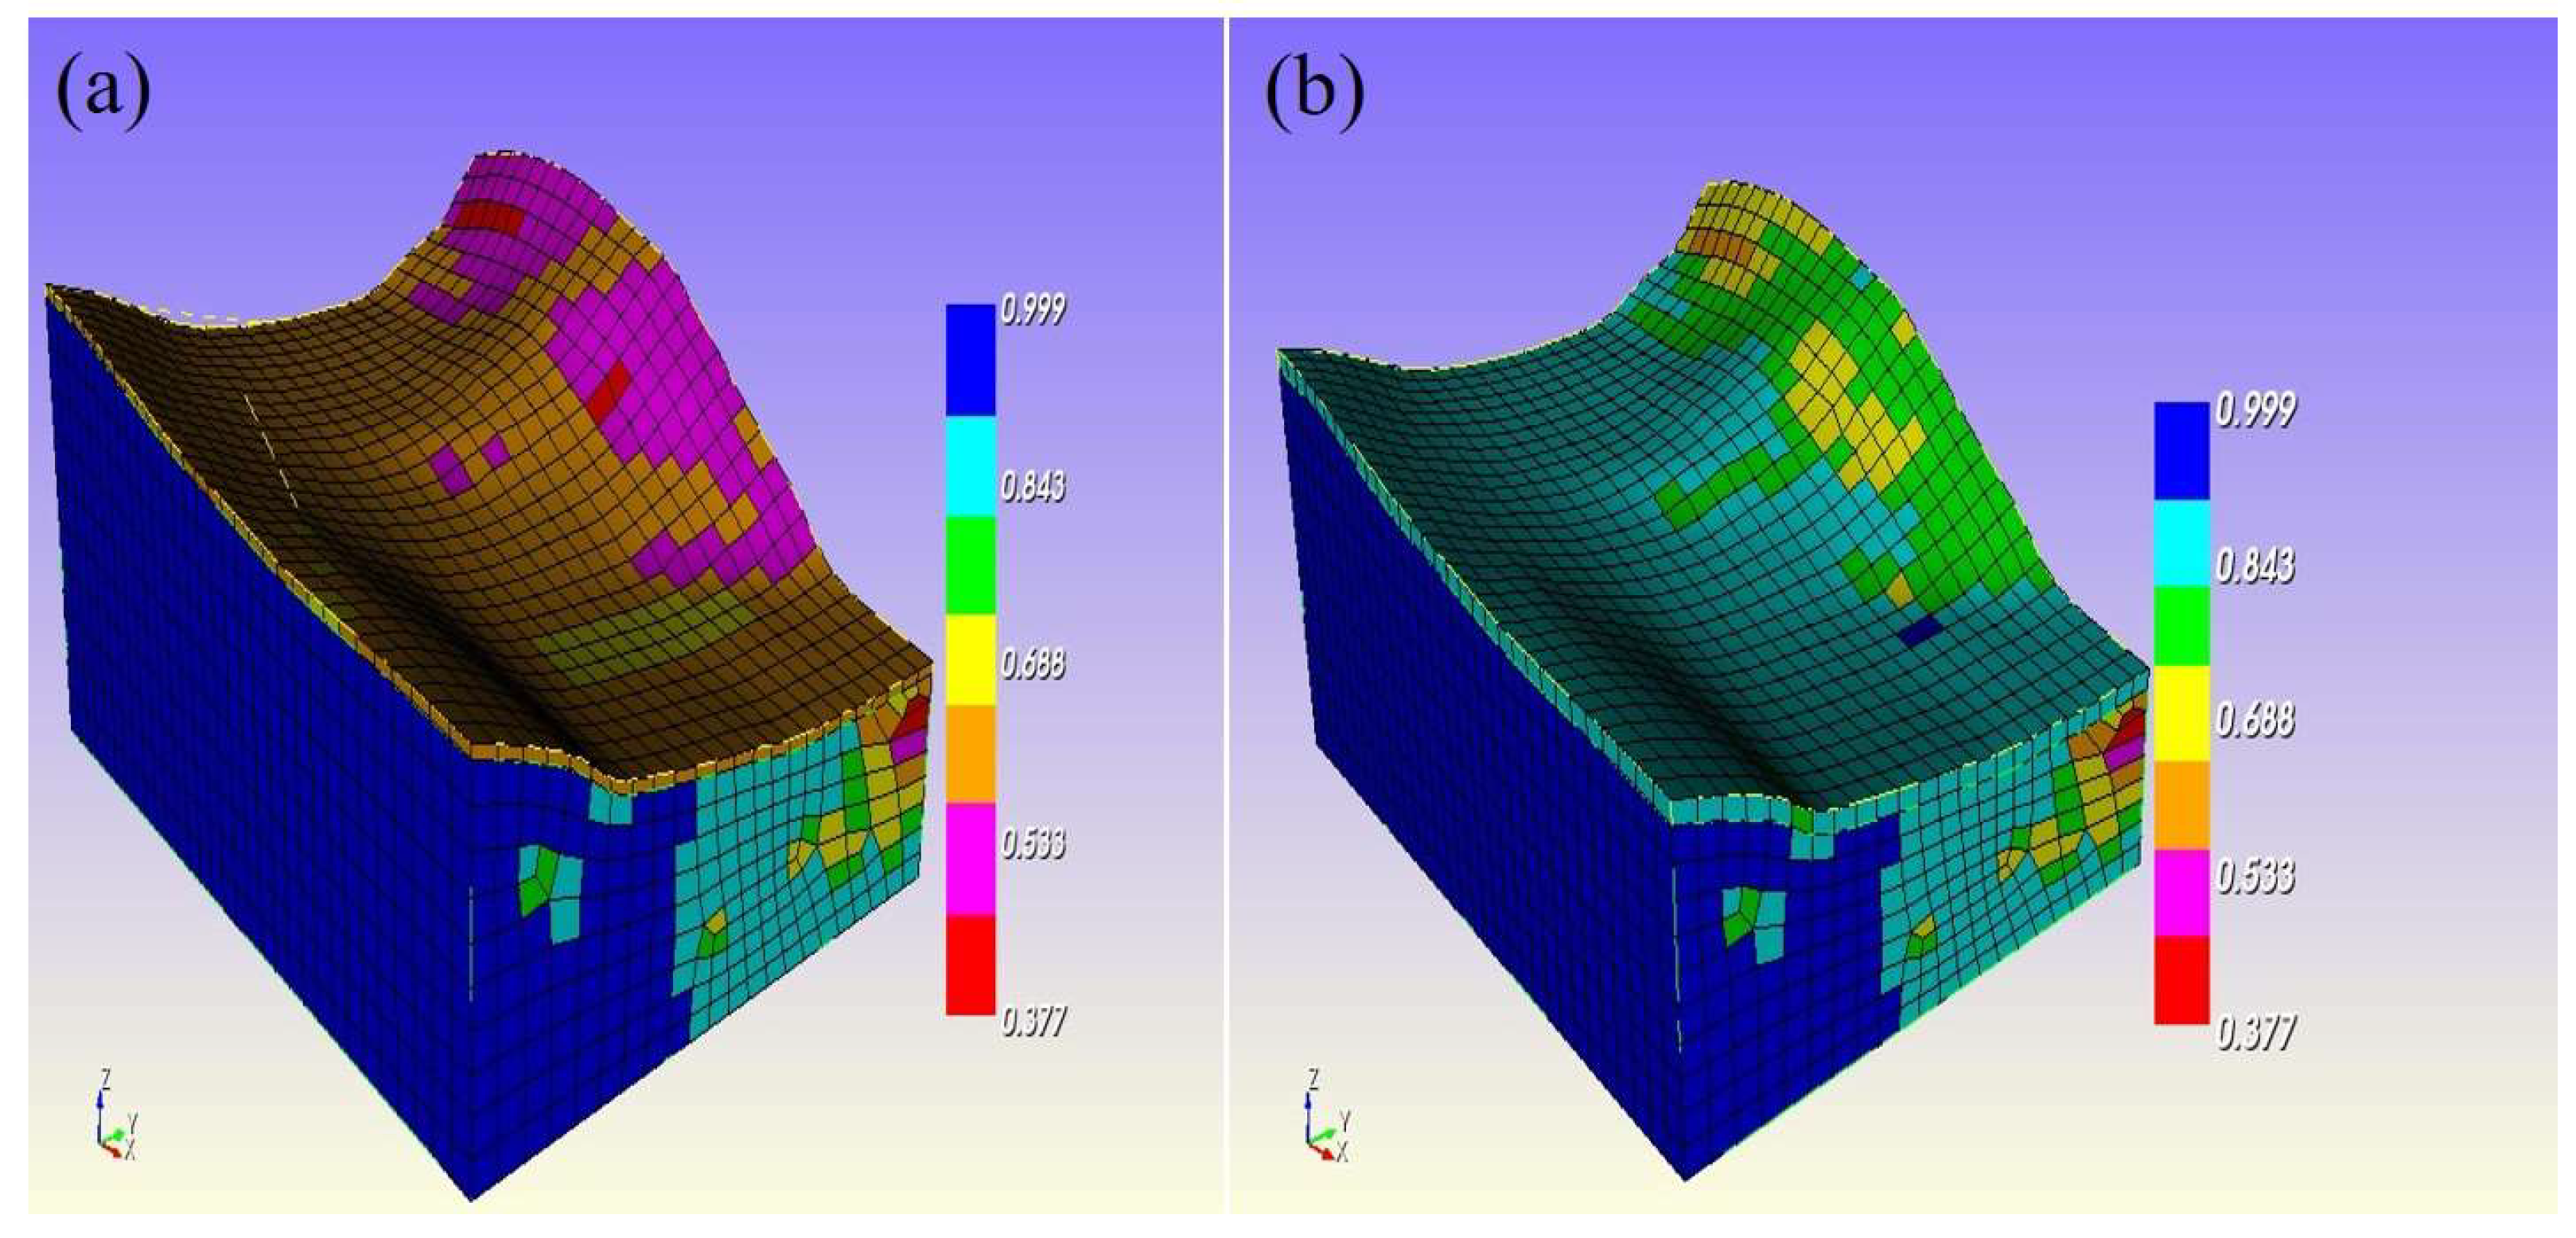
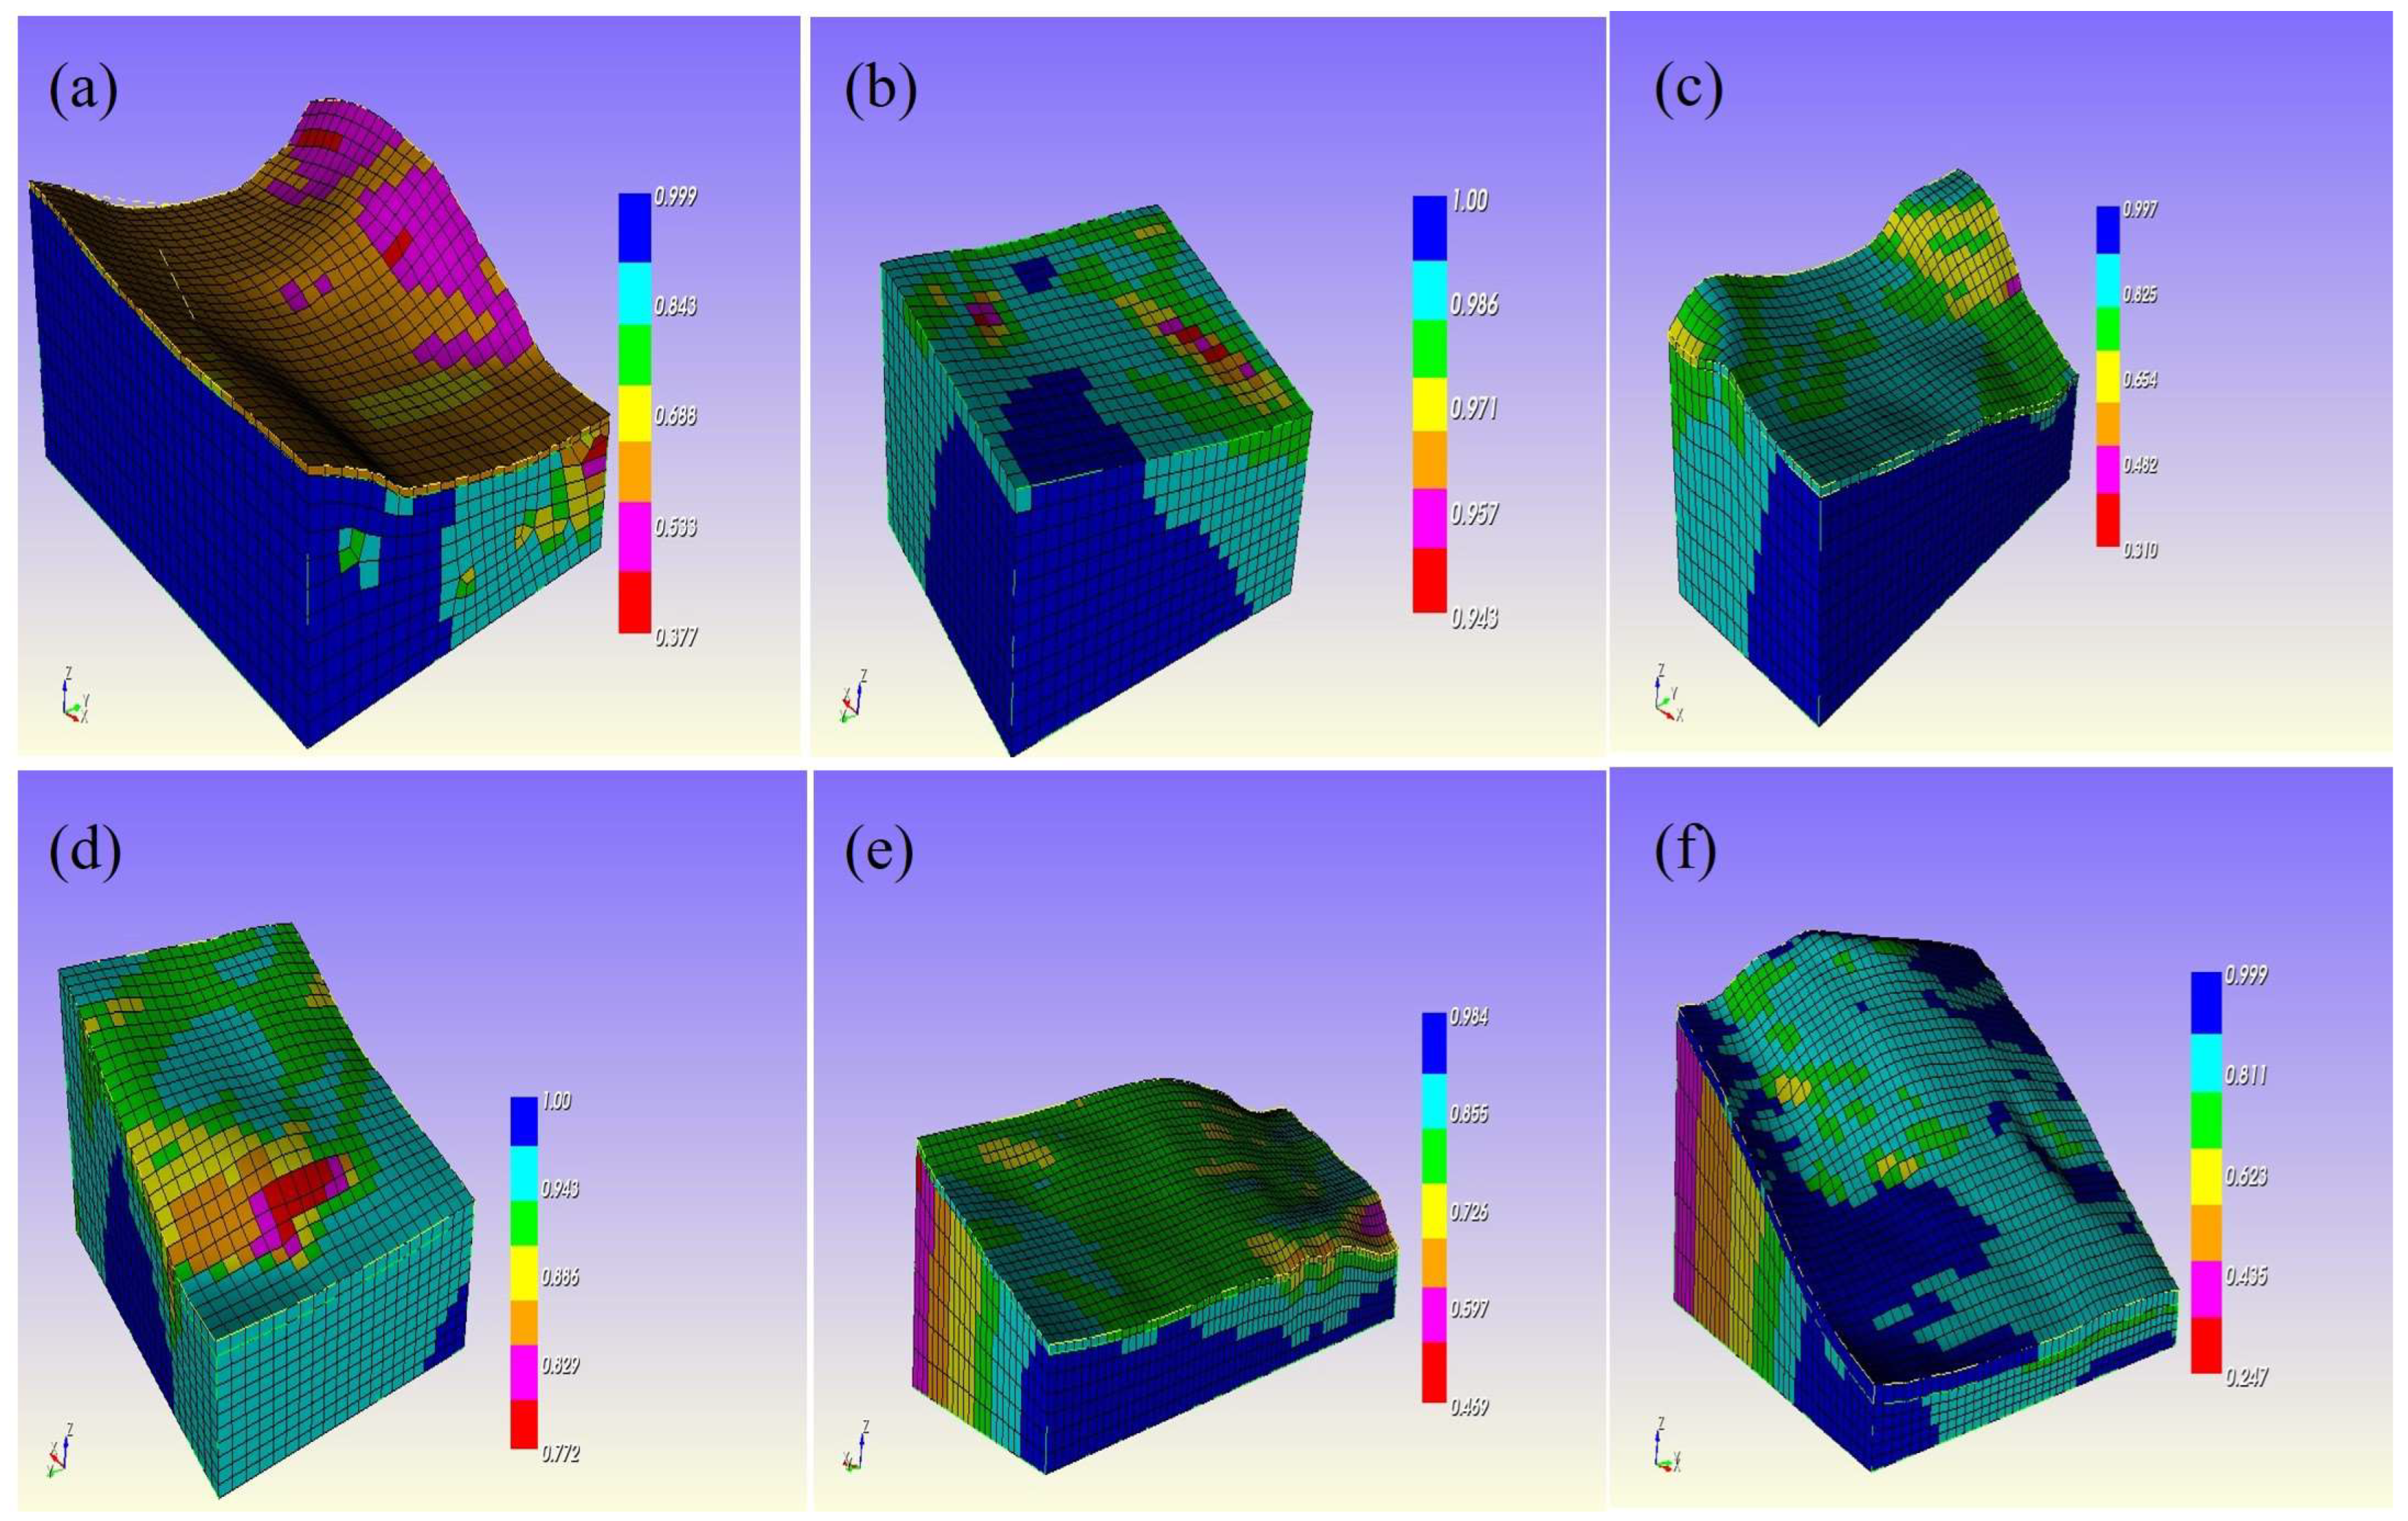
Figure 9, Figure 10 and Figure 11 illustrate discretized elements in various colors, indicating the meshing accuracy within those regions. The variation in color reflects different levels of meshing precision, with some zones exhibiting higher elemental accuracy while others show relatively lower accuracy. The legend provides a clear representation of these differences.
The boundary conditions implemented in the 3D domain are illustrated in Figure 9. The surface topographies of the 3D models, as presented in Figure 10, Figure 11 and Figure 12, are prepared according to the contours available in Figure 2, Figure 3, Figure 4, Figure 5 and Figure 6, along with soil–root material models. This comprehensive approach ensures a detailed and accurate analysis of slope stability, considering both the physical characteristics of the terrain and the complex interactions between soil and root systems.
The soil material models of both barren and root-permeated soils are summarized in Table 2. These data are based on direct shear tests on both barren and rooted soil samples as well as root tensile strength tests along with the parameters suggested in various articles [1,2,3,10,29].

3. Theoretical Verification of the Model

To verify the work performed using the Spectral Element Method (SEM), a 2D Finite Element Method (FEM) program, as described in the literature [20], was employed. This FEM program is written in Fortran 90 and runs on Visual Fortran. Unlike SEM, it lacks an inbuilt meshing operator, necessitating the use of the mesh generation toolkit Easymesh for mesh creation. The visualization of the results is accomplished using Tacplot Focus. Additionally, Geographic Information Systems (GIS) and AutoCAD are utilized to extract profiles from contour data.
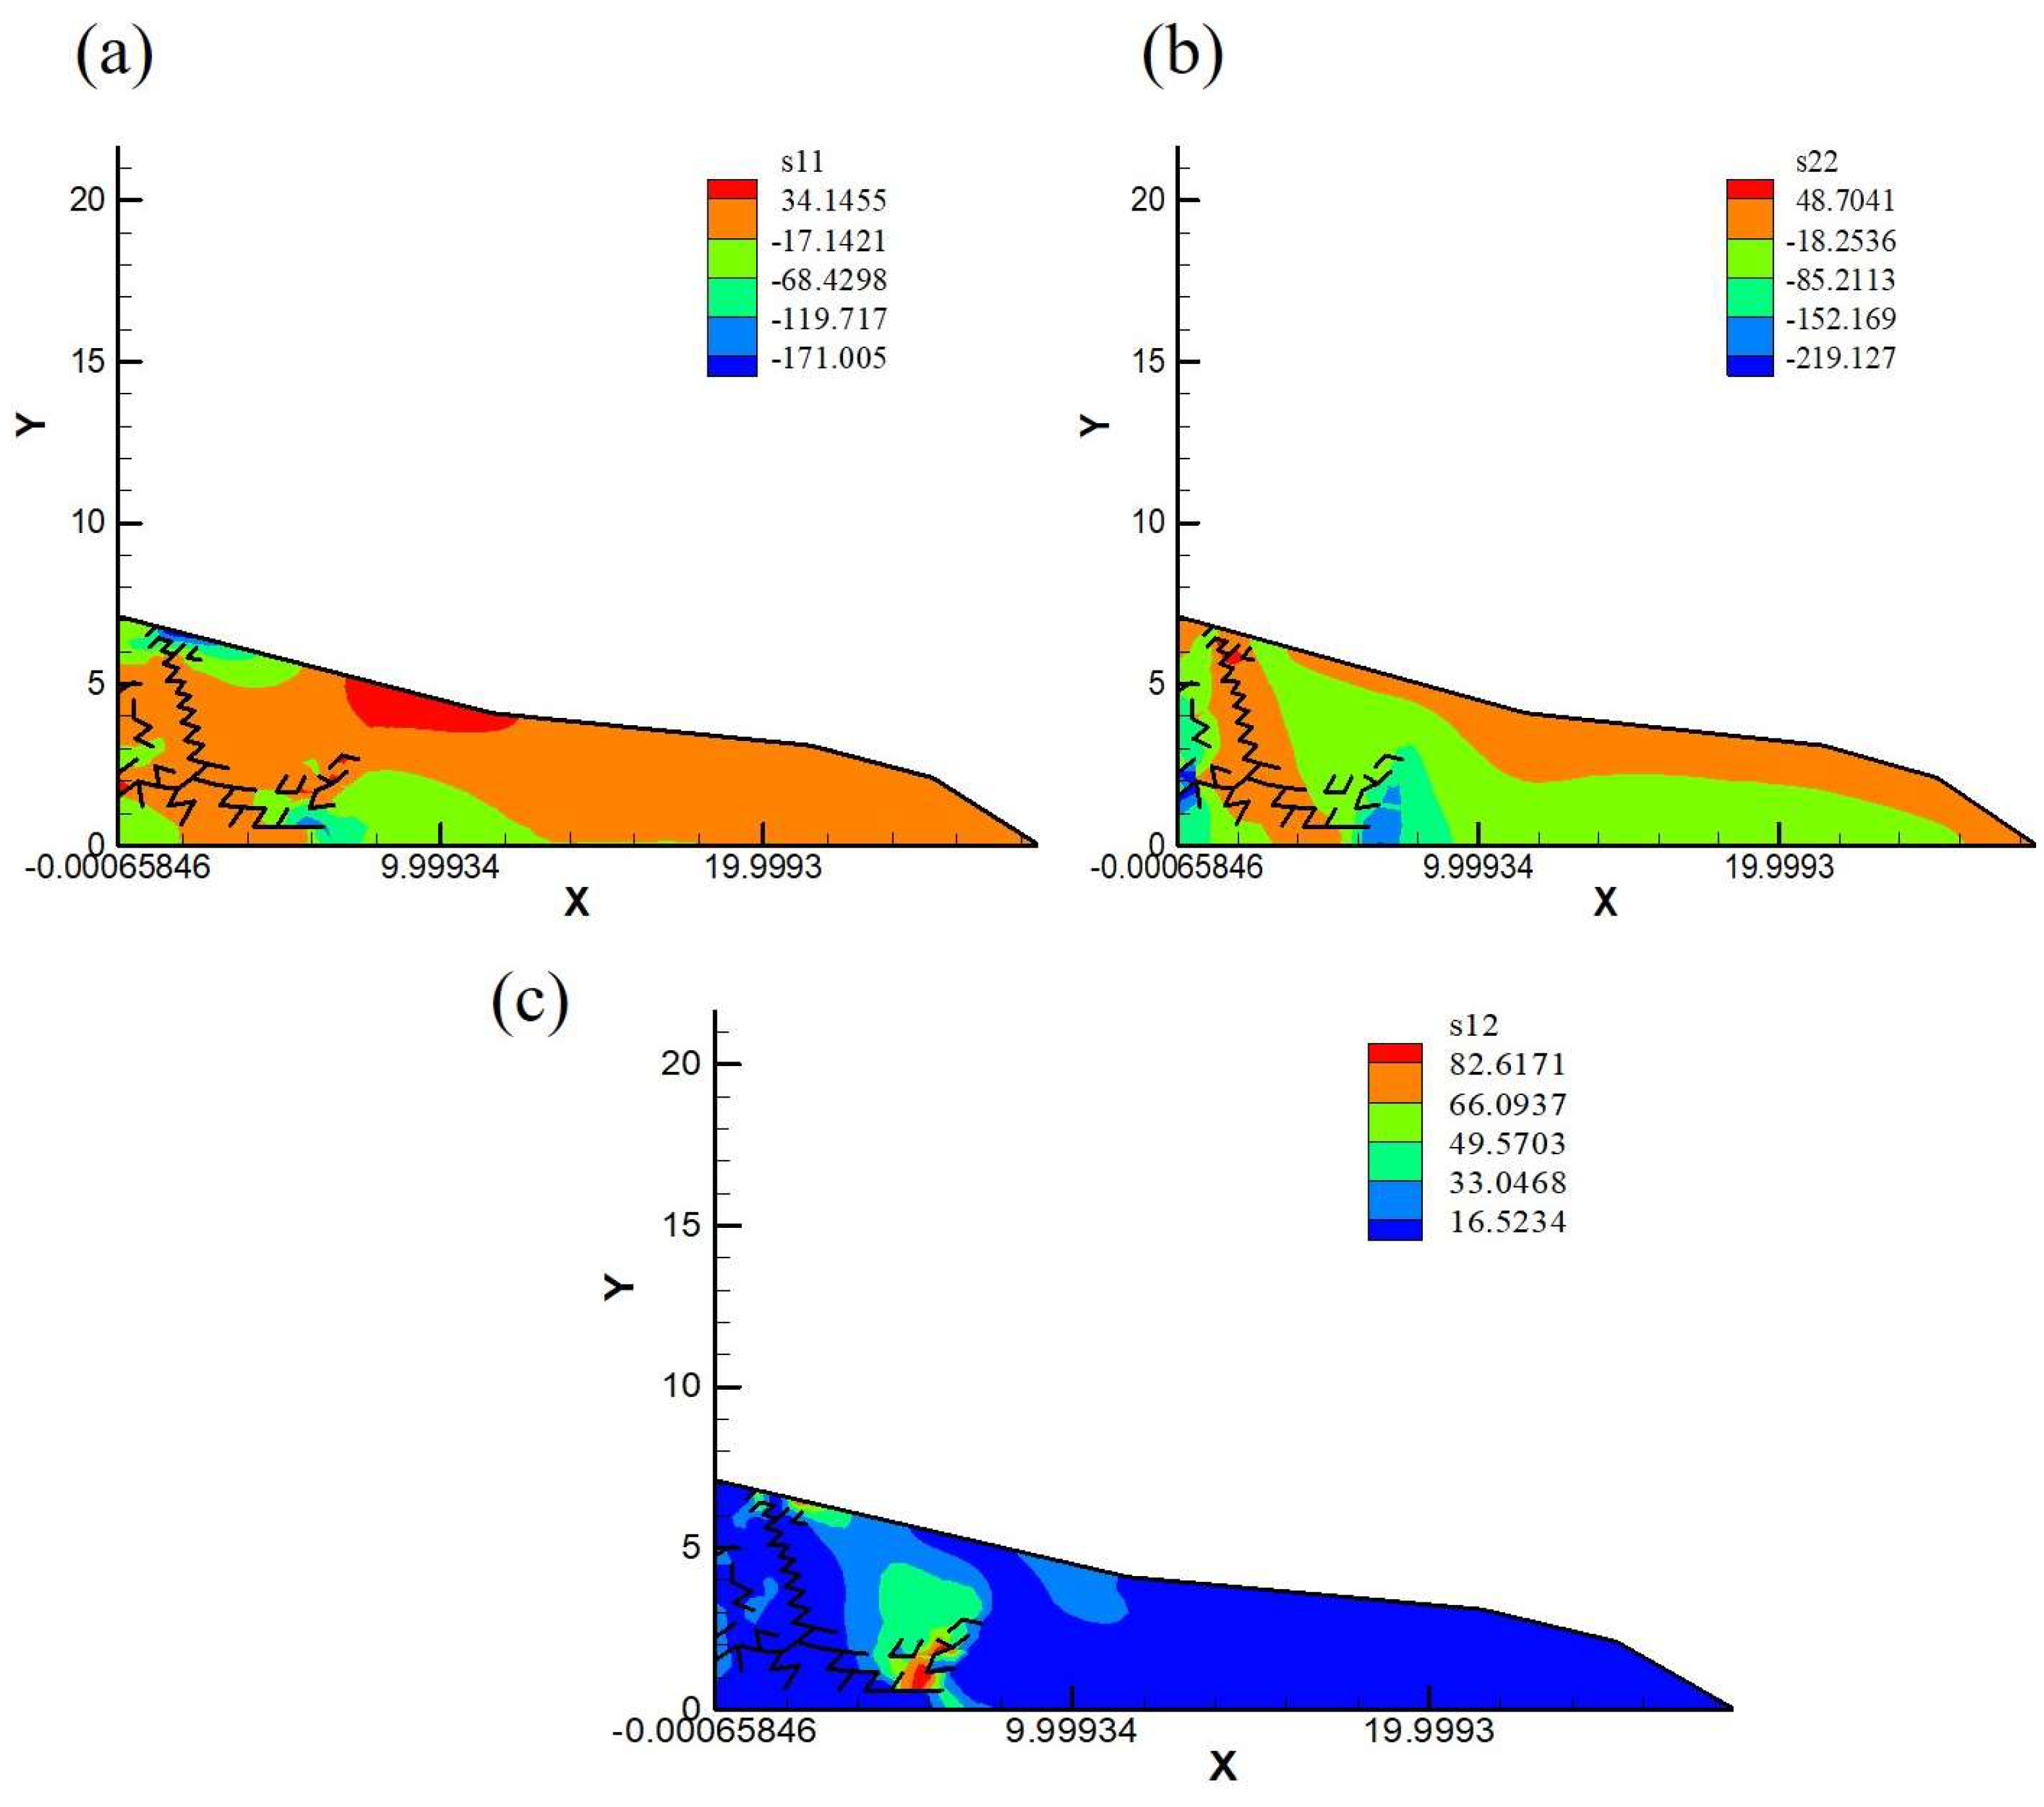
Figure 13a–c provide typical examples of the stress diagrams for σ11, σ22, and σ12. Based on the analyses conducted, the results are summarized in Table 3. In Figure 13a–c, the term ‘failure stress’ refers to the stress component at which a material or slope section is deemed to fail. The figure includes stress diagrams for the following components: σ11, which represents the normal stress along the x-axis; σ22, denoting the normal stress along the y-axis; and σ12, indicating the shear stress on the XY-plane. By specifying these stress components, the figure provides a clear depiction of the stress distribution and the conditions leading to failure.
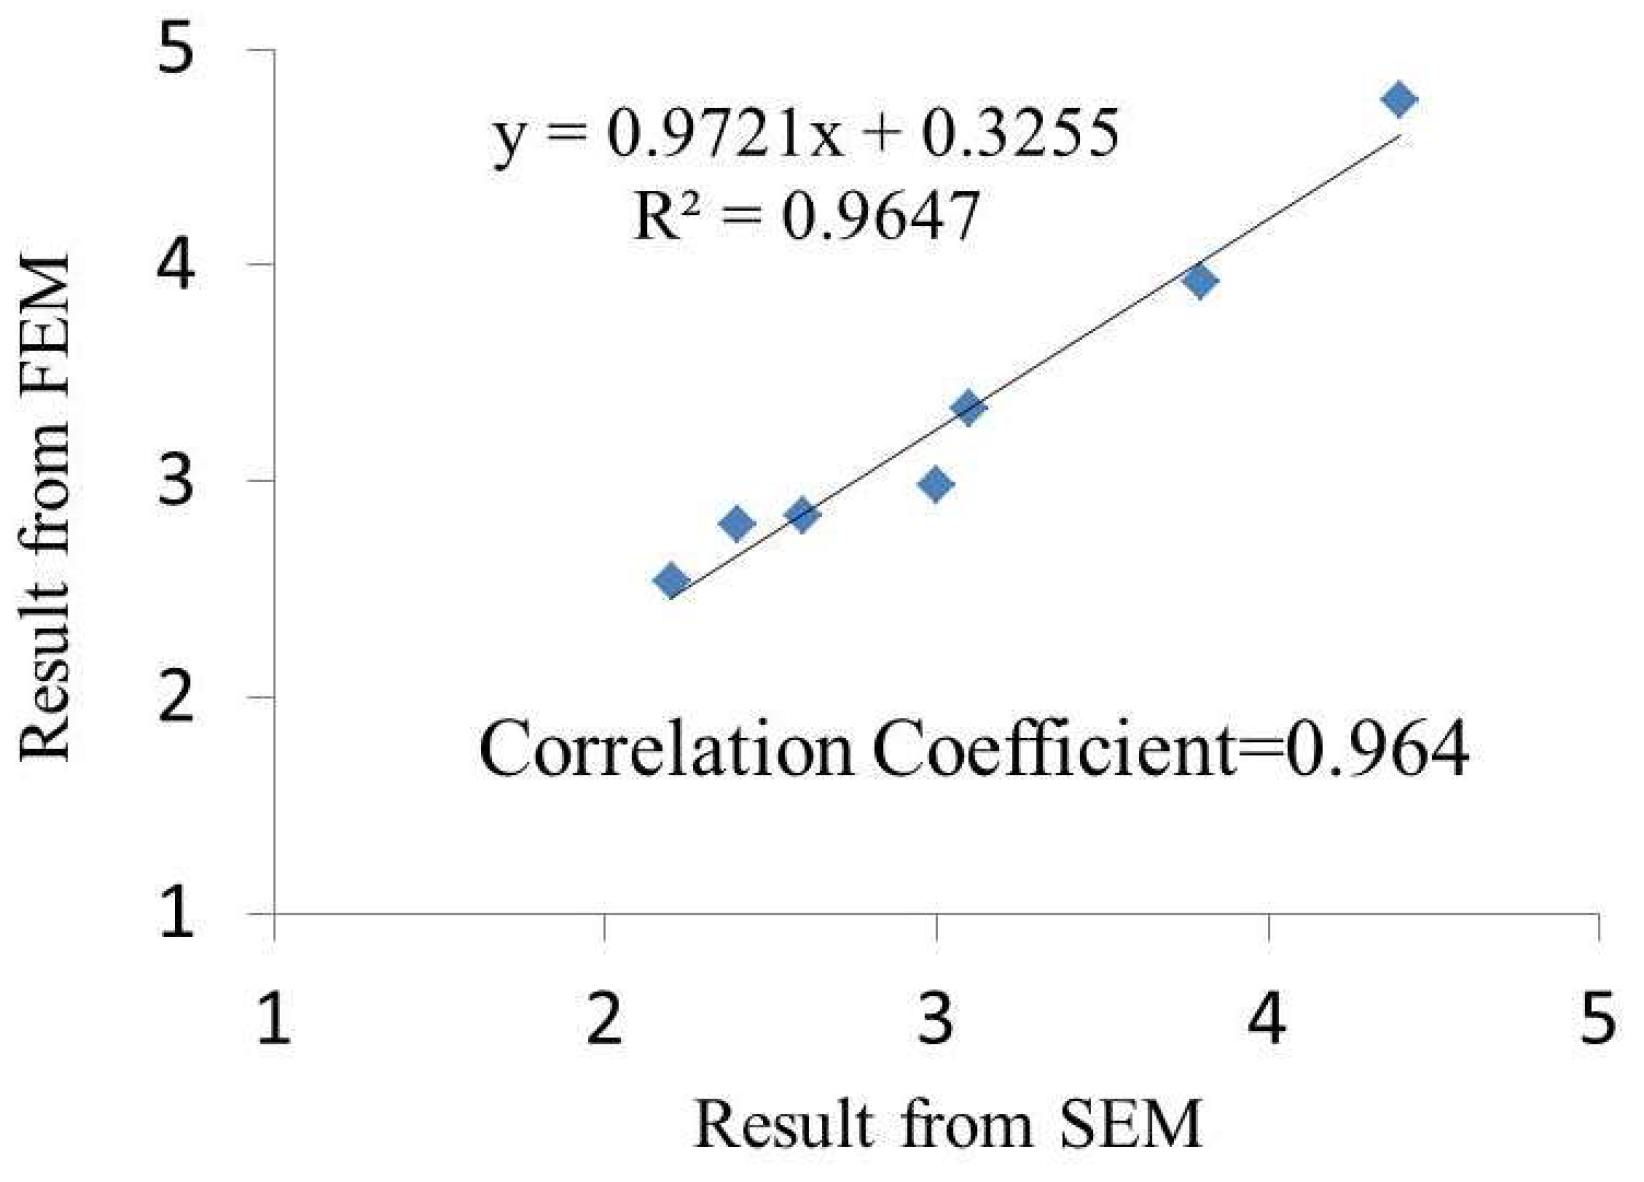
Table 3 corresponds to the maximum displacement observed at critical points within the slope model. This table highlights that the marginal factor of safety (FOS) in Zone—II differs from that observed with SEM. The incremental values due to root reinforcement effects in Zone—I to Zone—V are 0.20, 0.25, 0.20, 0.20, and 0.25, respectively. While the incremental values estimated in FEM are similar to those obtained from SEM, the FOS in each case is found to be slightly higher with FEM. The correlation coefficient between FEM and SEM modeling results is 0.964, indicating a strong agreement between the two approaches for rooted soil slope stability analysis.
However, it is observed that the FOS in SEM 3D modeling is generally lower than that in 2D FEM modeling. This discrepancy is significant because 2D modeling often overestimates the safety factor. Consequently, 3D modeling is recommended for a more accurate assessment of slope stability (Figure 14).
In the present study, the term ‘correlation’ refers to the relationship between specific variables within the slope stability analysis. For instance, it may describe the relationship between the strength reduction factor and the factor of safety, or between displacement and stress distribution. Understanding these correlations is essential for accurately interpreting how variations in one variable affect another, thereby providing insights into the overall stability and behavior of the slope. This analysis is crucial for evaluating the interplay between different factors and their impact on slope stability.
In summary, while both FEM and SEM approaches are viable for analyzing rooted soil slope stability, SEM’s 3D modeling provides a more precise evaluation by accounting for the complexities of three-dimensional interactions. The use of comprehensive tools such as GIS, AutoCAD, Easymesh, and Tacplot Focus further enhances the accuracy and reliability of the modeling process. Thus, for precise and realistic slope stability solutions, 3D modeling using SEM is preferred over 2D FEM.

4. Results and Discussion

We conducted a series of tests to evaluate the shear resistance of rooted soil and the tensile strength of roots, employing direct shear tests and root tensile strength tests, respectively. A total of thirty different soil samples were collected, encompassing five distinct barren and rooted soil types. The undisturbed soil sampling was meticulously performed through trench profiling, allowing for the measurement of Root Area Ratio (RAR) at various depths. Our findings indicated a clear inverse relationship between root diameter and root tensile strength: as root diameter increases, root tensile strength decreases. Additionally, it was observed that RAR diminishes with increasing soil depth.
The data obtained from these tests are crucial for understanding the mechanical behavior of soil–root systems. By analyzing root tensile strength and RAR, we can better comprehend how roots contribute to soil stability. The inverse relationship between root diameter and tensile strength suggests that finer roots, despite their smaller size, are more effective in enhancing soil strength due to their higher tensile capacity. On the other hand, larger roots, although they provide significant physical barriers against soil movement, exhibit lower tensile strengths. This finding is essential for designing bioengineering solutions that optimize the stabilizing effects of roots.
The results derived from the Spectral Element Method (SEM) approach are comprehensively summarized in Table 4. Table 4 corresponds to the maximum displacement observed at critical points within the slope model. For the computation of the factor of safety (FOS), it was assumed that the Groundwater Table (GWT) was at the surface. An FOS of 1.0 is considered the marginal value, necessitating the addition of a safety factor increment ranging from 0.1 to 0.2, or potentially more, to ensure slope stability. Based on these computations, appropriate mitigation measures were identified.
According to the data presented in Table 4, we observed that Zone—IV exhibits a marginal FOS under wet soil conditions. In contrast, the FOS values for the remaining four zones fall below the marginal threshold. Specifically, the implementation of root reinforcement and the lowering of the groundwater table led to an increase in the factored safety factor by 0.20, 0.25, 0.20, 0.20, and 0.25 for zones I through V, respectively. Despite these improvements, Zone—I and Zone—V still require additional engineering interventions beyond vegetation alone to achieve an adequate safety factor.
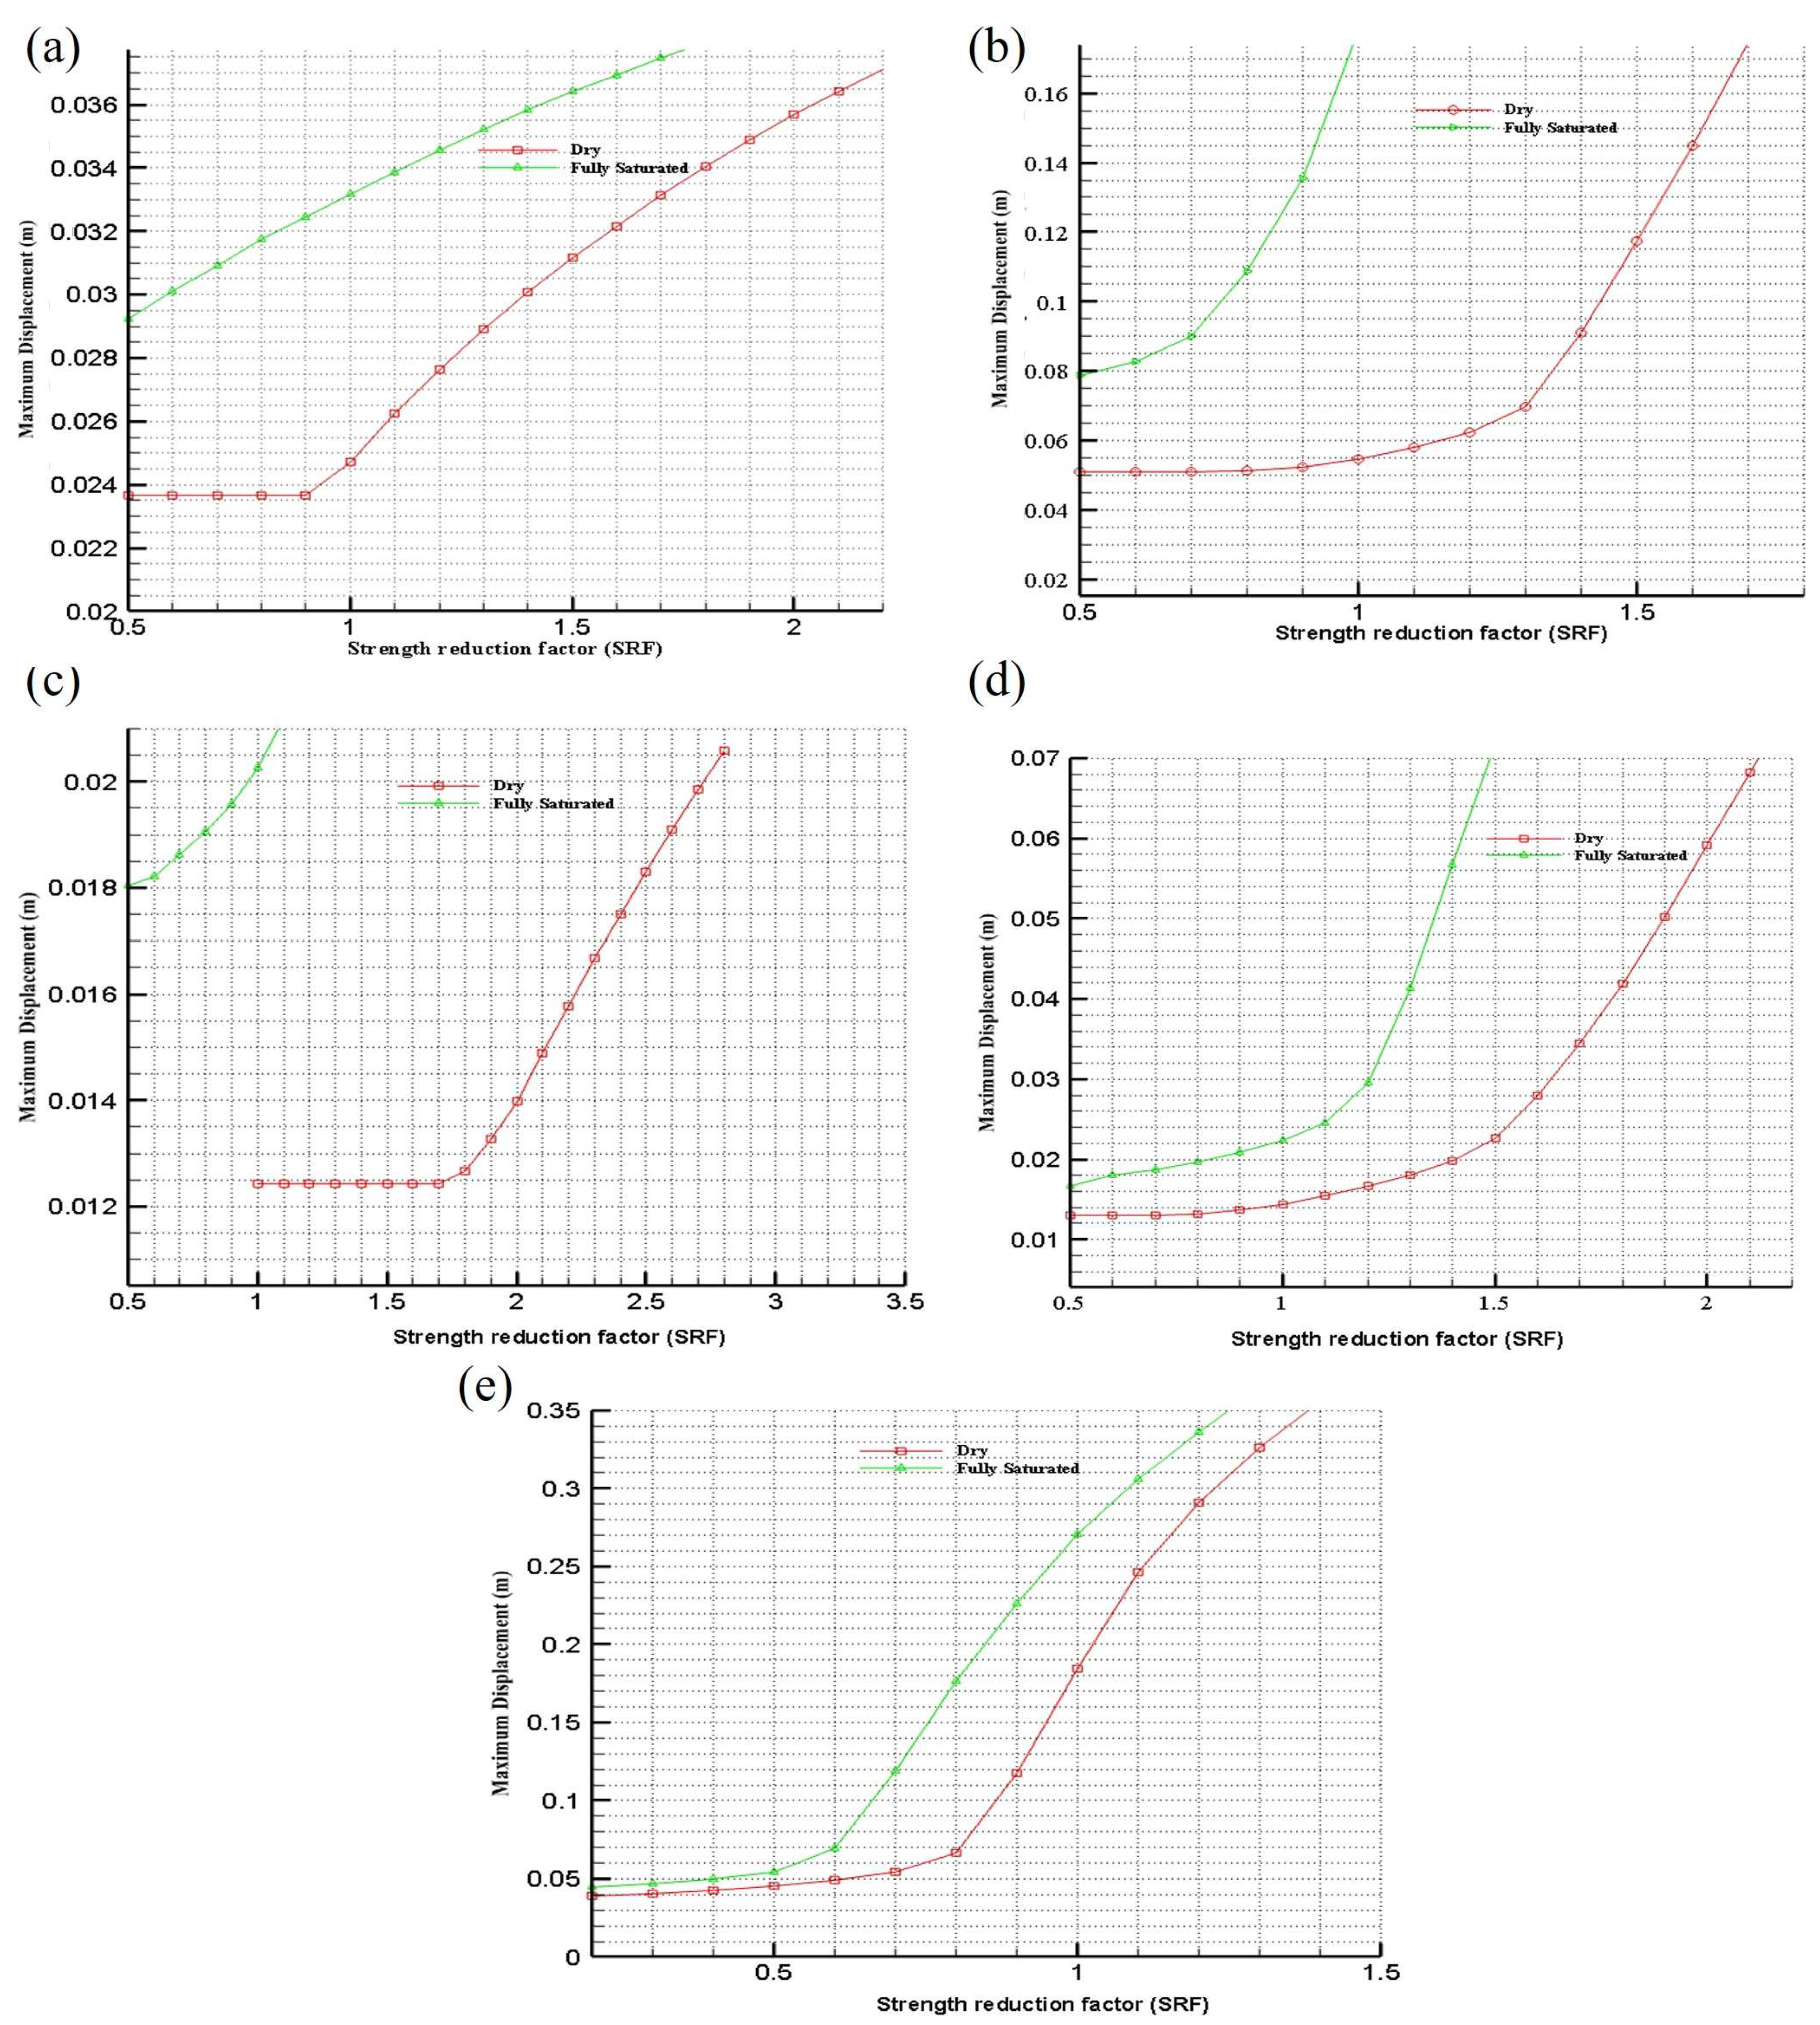
The correlation between the strength reduction factor (SRF) and displacement for all five soil slope models (Zone—I to Zone–V) is depicted in Figure 15a–e. These plots support the findings summarized in Table 4.
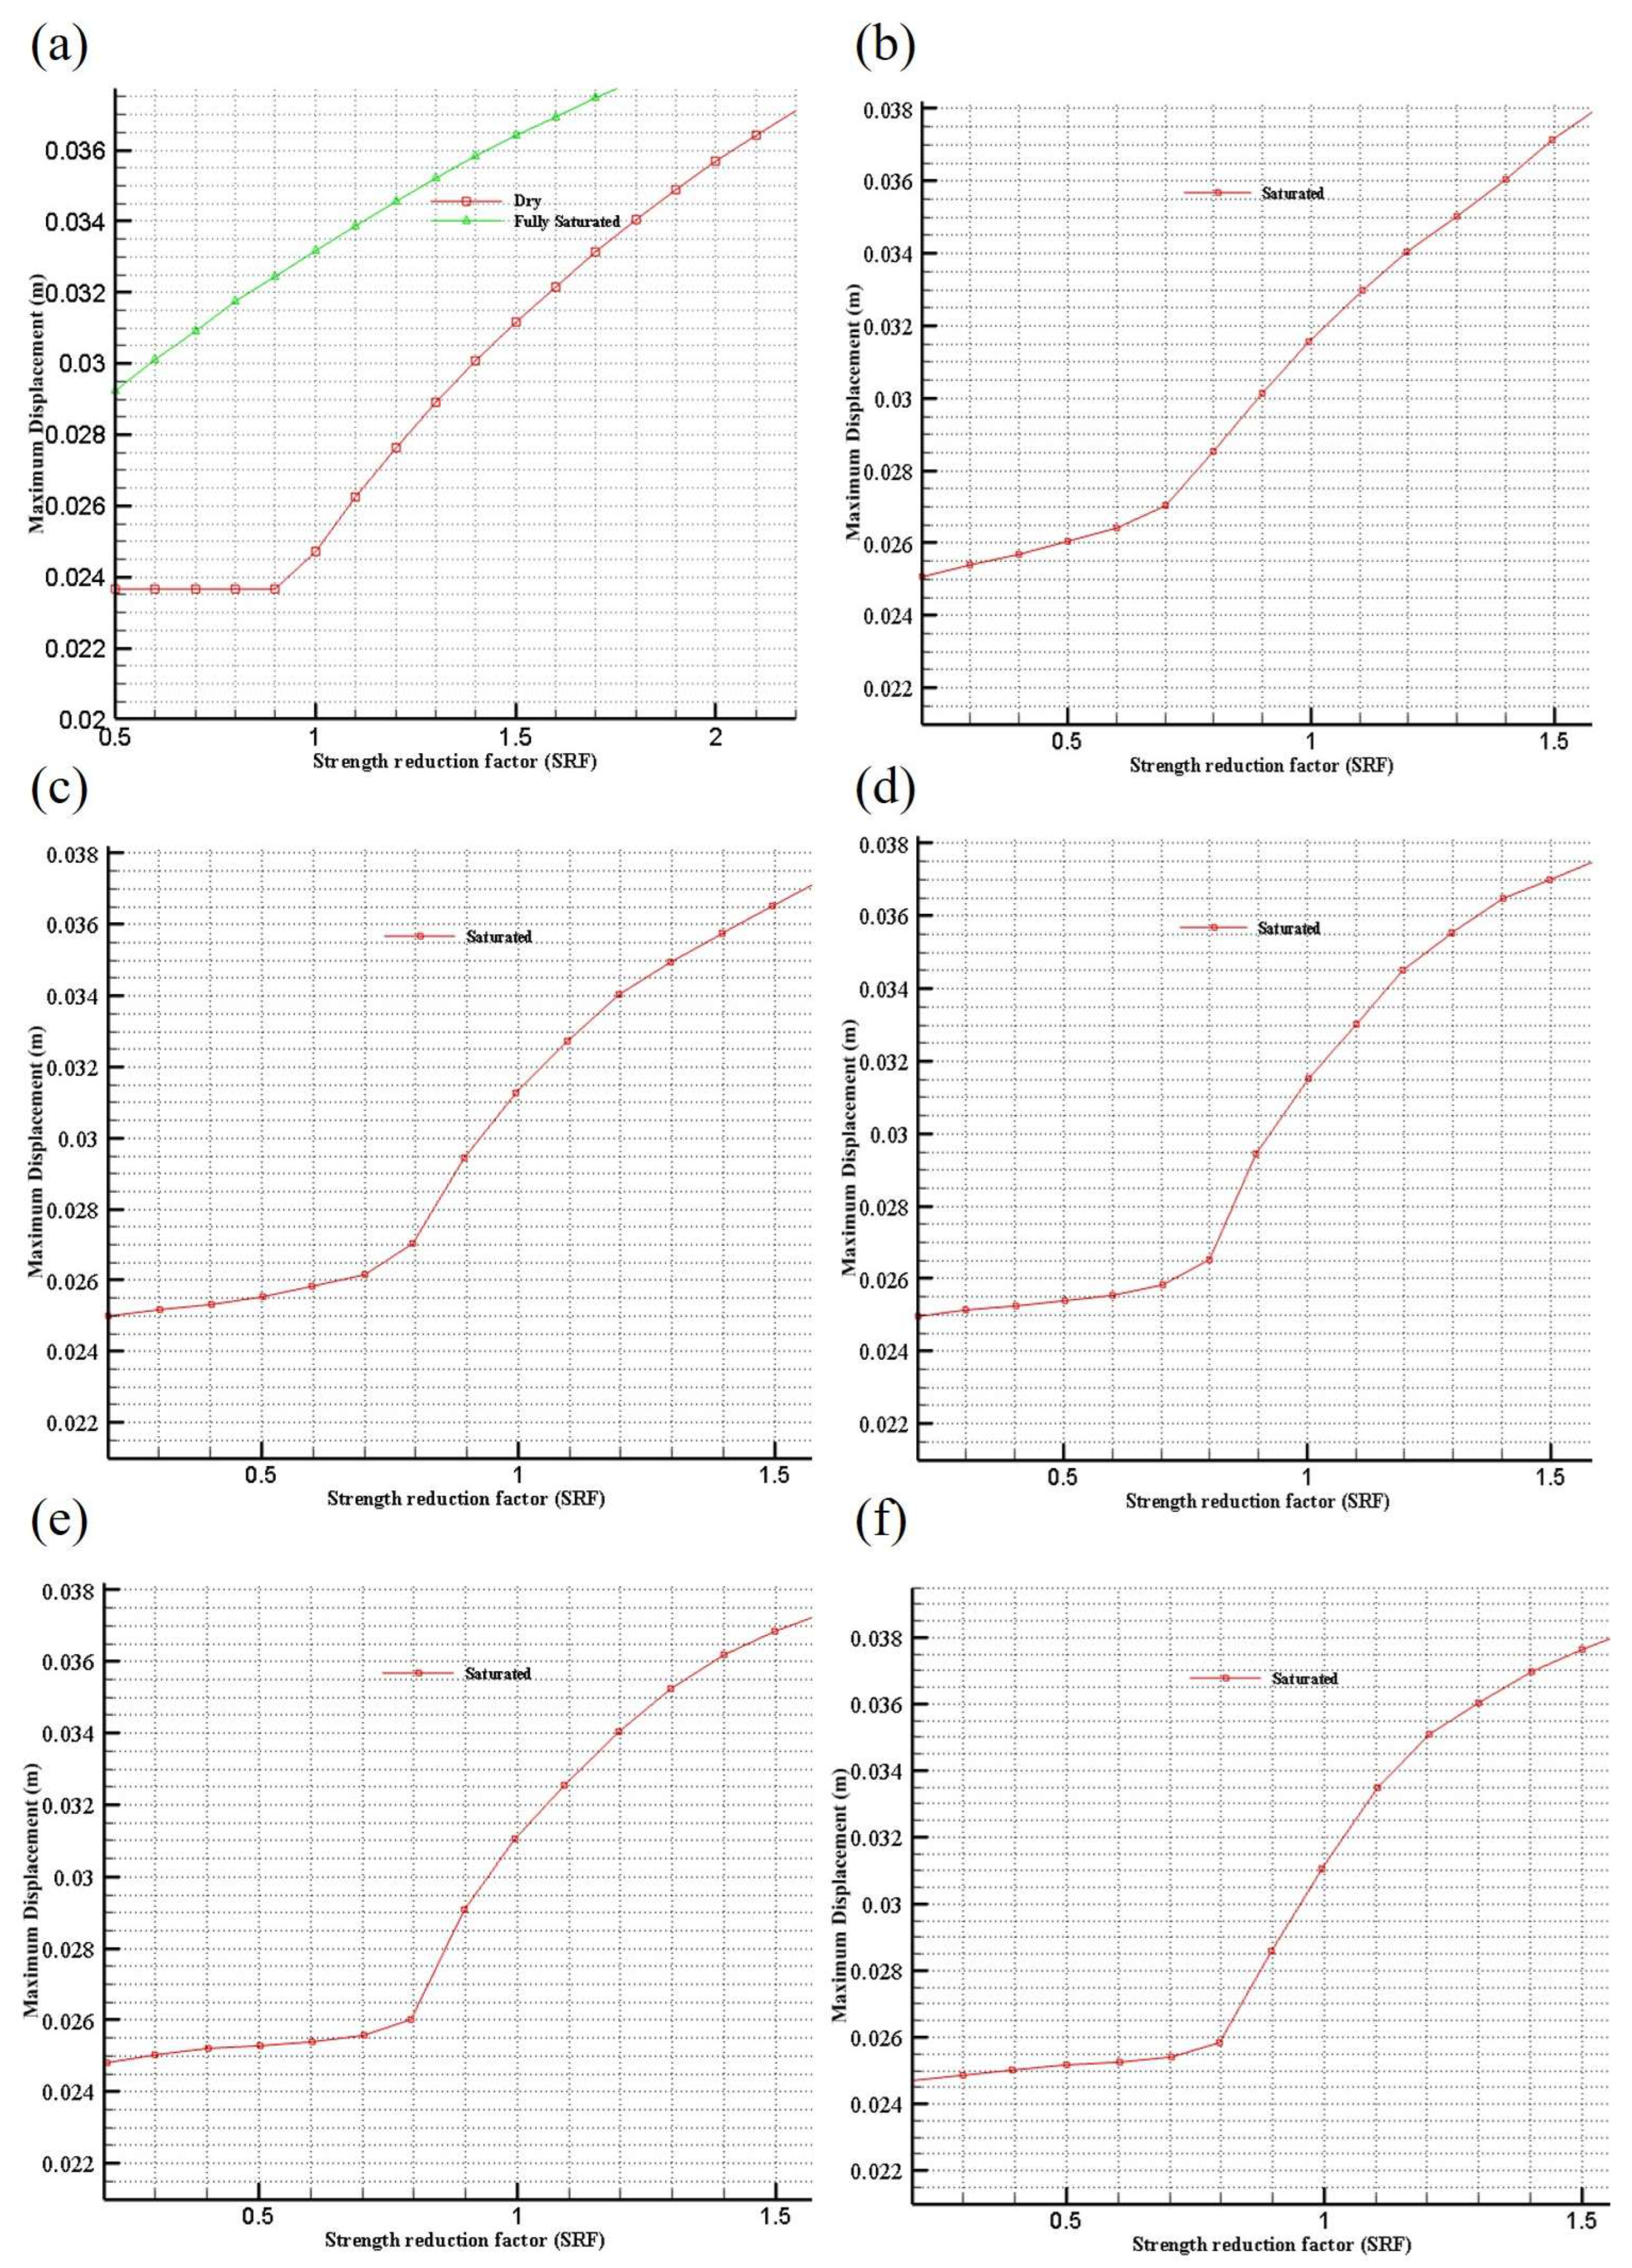
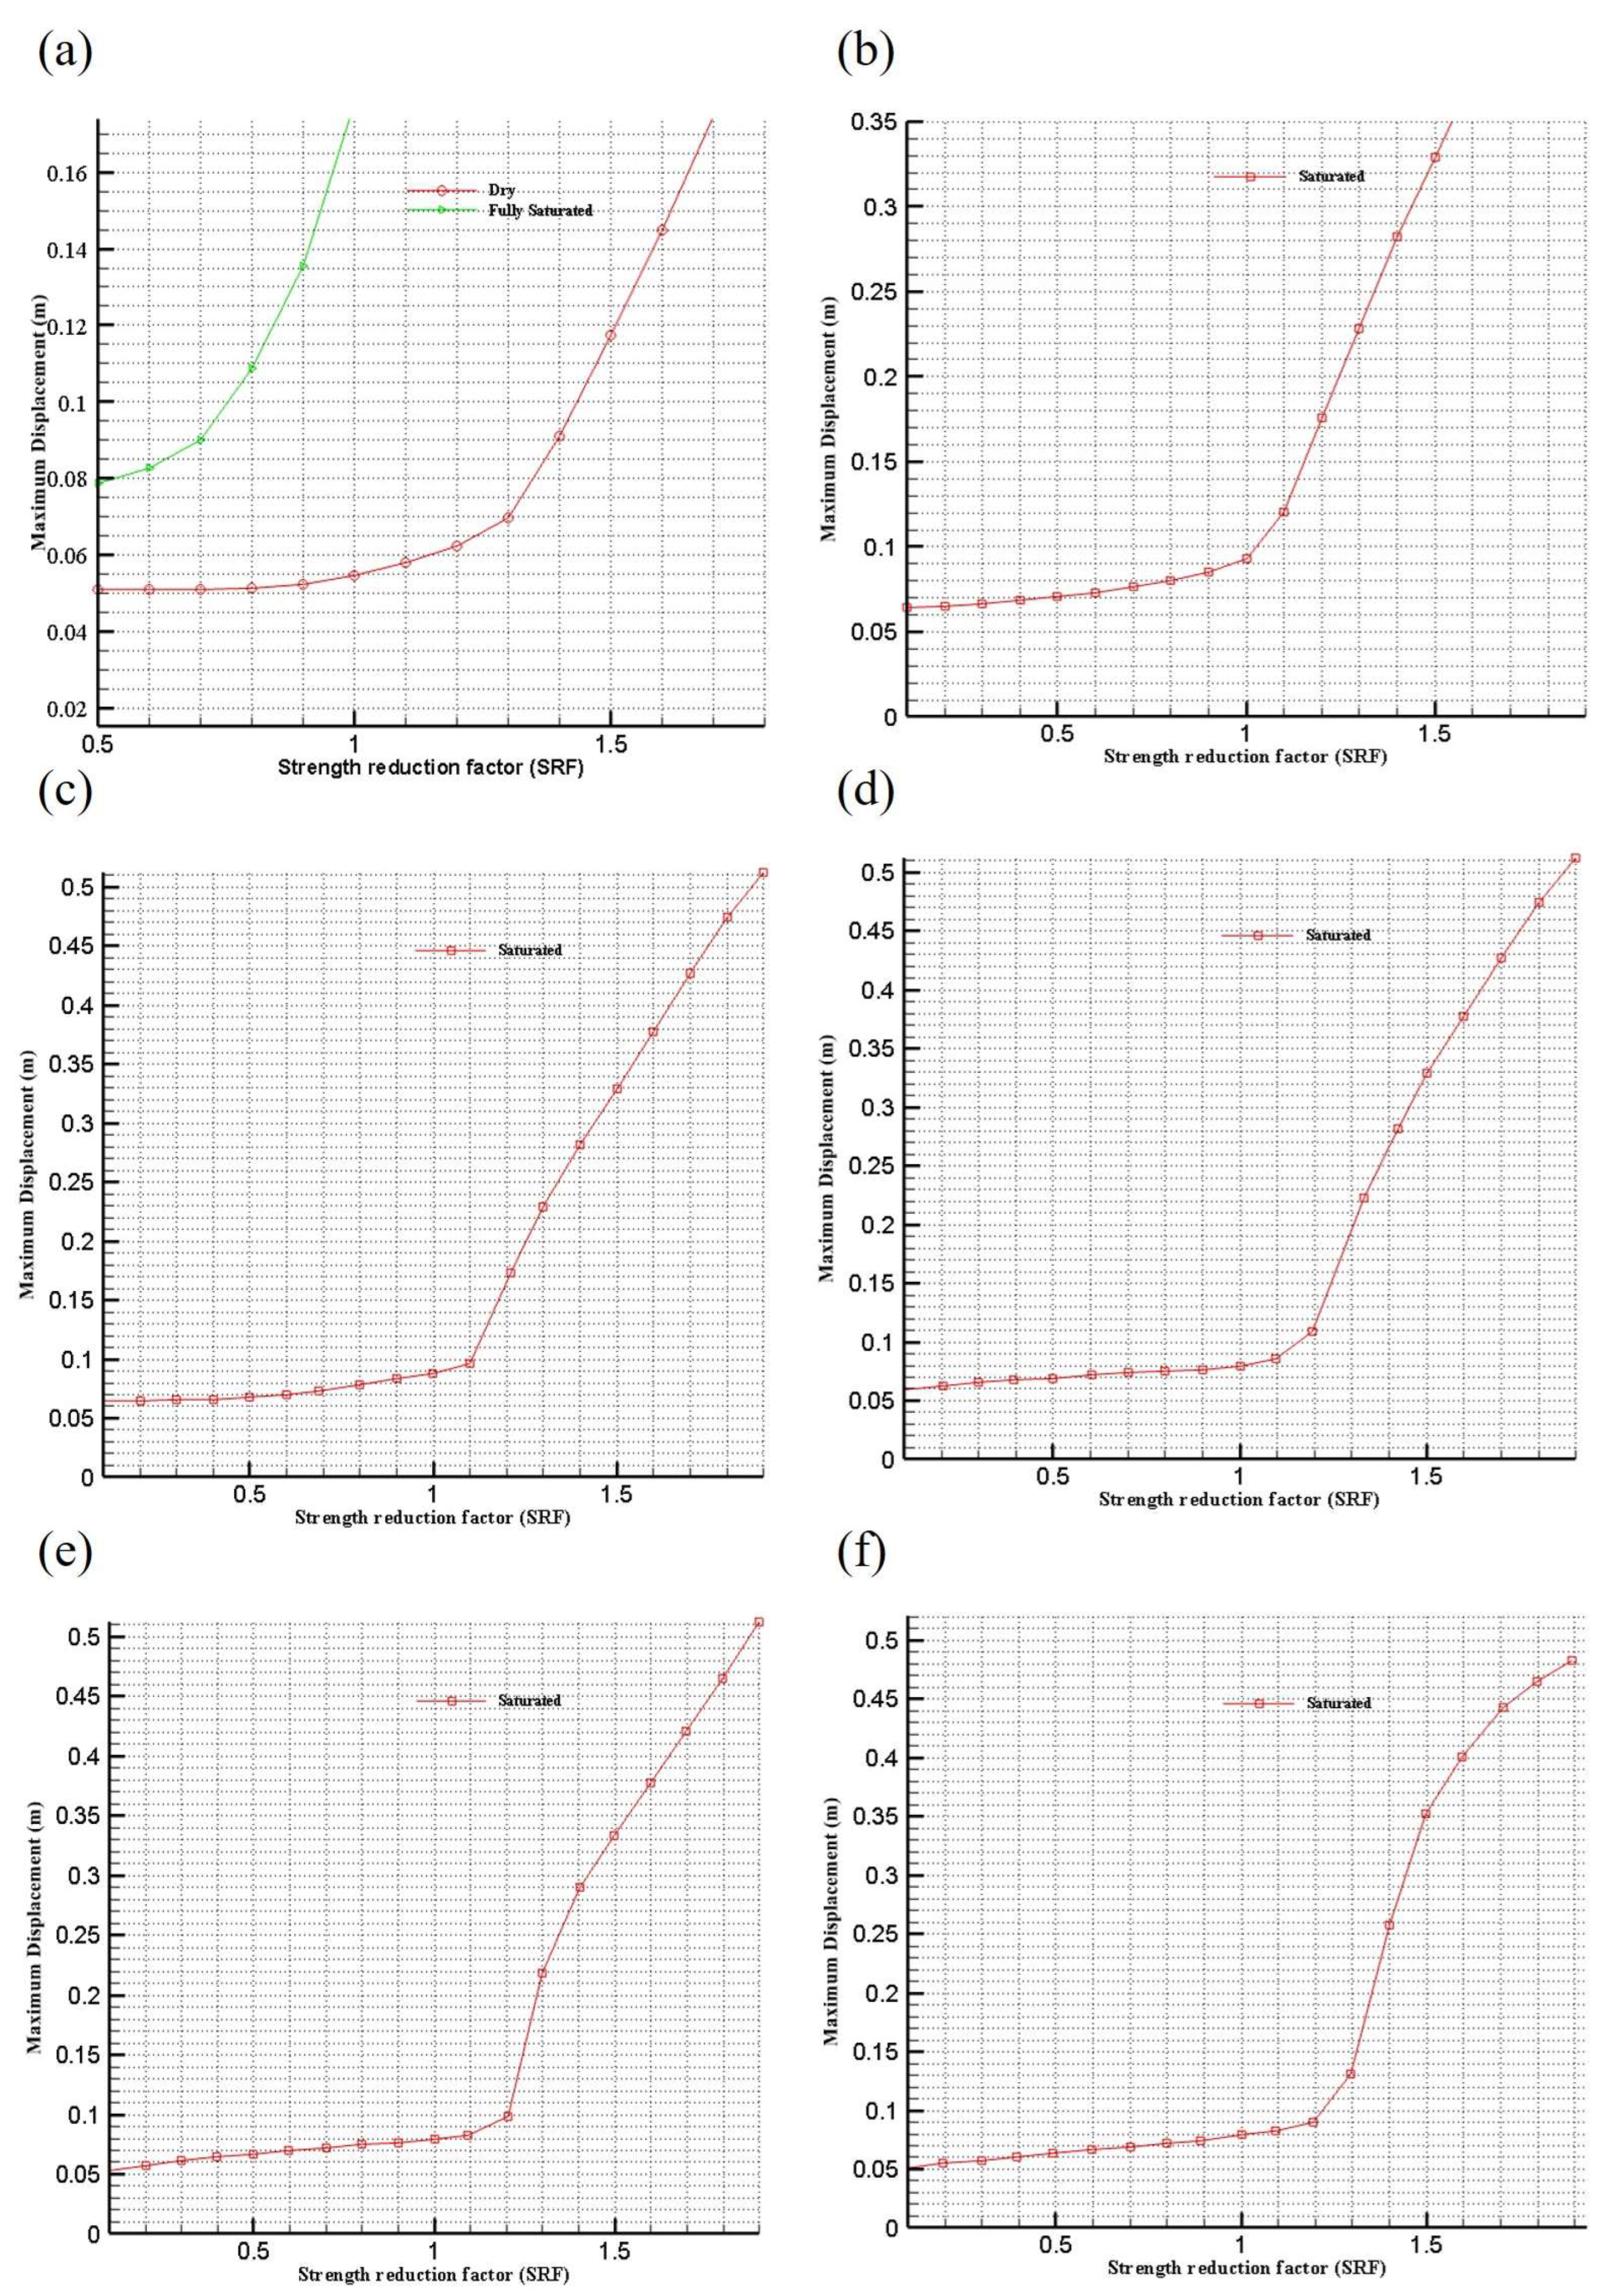
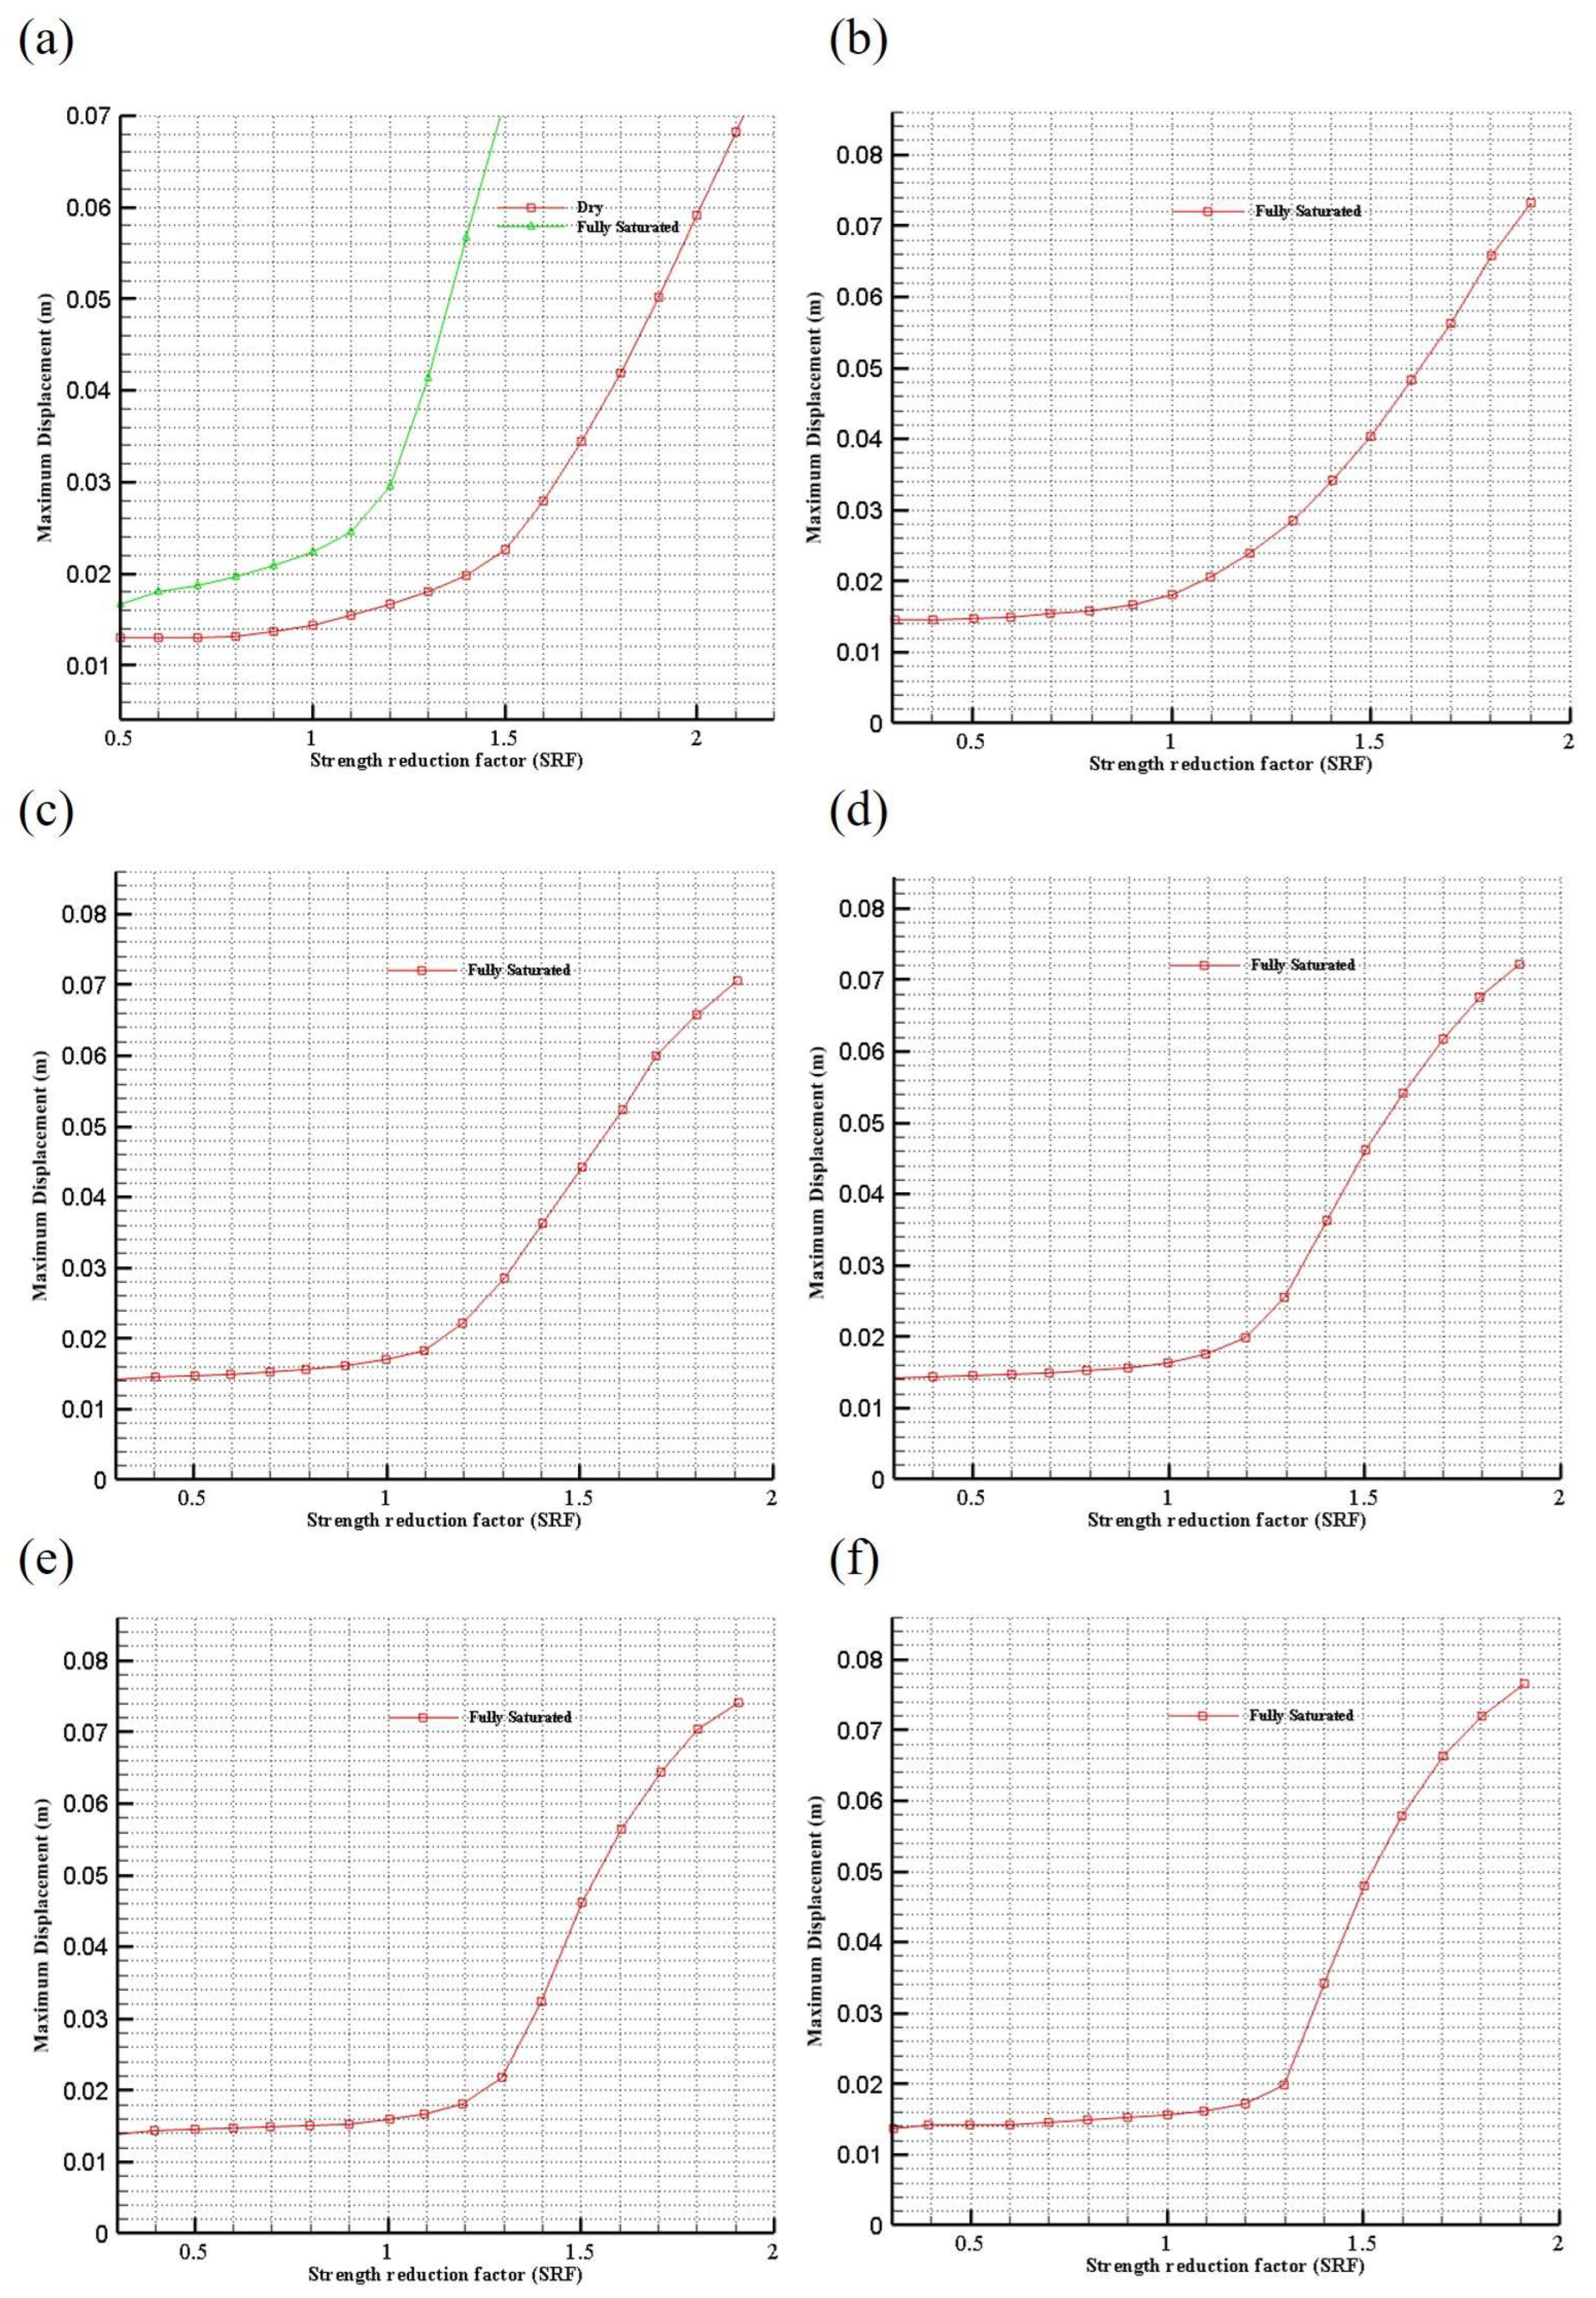
However, pinpointing the exact location of the safety factor within the SRF vs. displacement plots presents some challenges. Table 4 effectively synthesizes the results illustrated in Figure 16, Figure 17, Figure 18, Figure 19 and Figure 20, providing a clear overview of the data.
The critical levels of the strength reduction factors shown in Figure 15a–e and Figure 16, Figure 17, Figure 18, Figure 19 and Figure 20 represent the thresholds at which the slope or material begins to exhibit signs of instability or failure.
In the context of slope stability, root tensile strength plays a critical role. The data indicated that roots with smaller diameters exhibit higher tensile strengths, significantly contributing to soil reinforcement. Conversely, larger roots, while providing physical barriers to soil movement, possess lower tensile strengths. This inverse relationship underscores the necessity of understanding root characteristics when designing bioengineering solutions for slope stability.
Moreover, the RAR, which quantifies the proportion of soil volume occupied by roots, was found to decrease with depth. This trend suggests that root reinforcement is most effective near the soil surface, where root density is higher. Consequently, engineering strategies should prioritize surface root systems for effective soil stabilization. This insight is pivotal for developing bioengineering solutions that enhance slope stability by maximizing the benefits of root reinforcement in the upper soil layers.
The SEM approach allowed for detailed analysis of the mechanical properties of rooted soils, providing insights into how different soil–root interactions contribute to overall soil stability. The computational models highlighted the varying impacts of root reinforcement across different zones and soil conditions, illustrating the necessity for tailored bioengineering solutions. These models are essential for understanding the complex interactions between soil and roots and for predicting the behavior of vegetated slopes under different conditions.
The strength reduction factor (SRF) analysis further elucidated the stability of the soil slopes under different conditions. The SRF vs. displacement plots (Figure 15a–e and Figure 16, Figure 17, Figure 18, Figure 19 and Figure 20) revealed that while root reinforcement improves stability, the degree of improvement varies among zones. For instance, Zone—II, Zone—III, and Zone—IV showed significant enhancements in FoS, reaching values that suggest increased stability. However, Zone—I and Zone—V, despite some improvement, still require additional measures to reach a safe FOS.
To achieve a comprehensive understanding of slope stability, it is crucial to integrate both empirical data and computational models. The empirical tests provided valuable data on root tensile strength and shear resistance, while the SEM approach and SRF analysis offered a deeper understanding of how these properties affect overall soil stability. The results indicate that while vegetation and root reinforcement are beneficial, they must be supplemented with traditional engineering measures, particularly in zones with lower natural stability.
The importance of combining bioengineering with conventional engineering techniques cannot be overstated. Vegetation alone may not provide sufficient stability in all cases, especially in areas with high groundwater levels or significant external pressures such as those from seismic activity or heavy rainfall. Traditional engineering interventions, such as retaining walls, drainage systems, and soil nailing, should be considered alongside bioengineering methods to achieve a comprehensive and robust slope stabilization strategy.
In conclusion, this study demonstrates the complex interplay between root characteristics, soil properties, and slope stability. The findings underscore the importance of a multifaceted approach that combines bioengineering with conventional engineering techniques to enhance slope stability effectively. Future research should focus on refining these methods and exploring new ways to optimize root reinforcement in various soil conditions, ultimately contributing to more sustainable and resilient land management practices. By continuing to improve our understanding of soil–root interactions and developing innovative stabilization techniques, we can better protect vulnerable slopes and reduce the risk of landslides and other soil-related hazards.

5. Conclusions

Based on the results and discussions, this study draws several key conclusions regarding the use of vegetation for soil slope stability:
  • Effectiveness of the Spectral Element Method (SEM) approach: The Spectral Element Method (SEM) proved to be an effective numerical approach for justifying the use of vegetation in enhancing soil slope stability. This method successfully elucidates the average behavior of the soil–root matrix continuum in three-dimensional domains, offering a robust framework for understanding the mechanical interactions within the soil–root system.
  • Impact of root reinforcement on the factor of safety (FOS): Root reinforcement significantly improves the factor of safety (FOS) for soil slopes. The study found that with root reinforcement and the lowering of the groundwater table (GWT), the FOS increased by 0.20 in Zone—I and Zone—III, by 0.25 in Zone—II and Zone—V, and by 0.20 in Zone—IV. Despite these improvements, Zone—I and Zone—V still require additional engineering measures to achieve adequate stability, indicating that vegetation alone is not sufficient in these areas. This demonstrates the critical role that root systems play in stabilizing soil, while also highlighting the need for complementary engineering solutions in zones with lower inherent stability.
  • Root diameter and tensile strength: An inverse relationship was observed between root diameter and root tensile strength. Roots with smaller diameters exhibit higher tensile strengths, which are crucial for effective soil reinforcement. Specifically, it was found that as root diameter increases, root tensile strength decreases significantly, highlighting the importance of smaller roots in stabilizing soil.
  • Root Area Ratio (RAR) and soil depth: The study found that Root Area Ratios (RARs) decrease with increasing soil depth, indicating that root reinforcement is most effective near the soil surface where root density is higher. For instance, RARs were higher at shallow depths but significantly lower at deeper levels, emphasizing the need to prioritize surface root systems in bioengineering strategies for soil stabilization.
  • Role of slope geometry: Slope geometry plays a critical role in determining slope stability. The study emphasizes the need for realistic three-dimensional models that incorporate actual topography to better understand and predict slope stability. Such models are essential for accurately assessing the impact of root reinforcement and designing effective mitigation measures.
  • Empirical testing and realistic modeling: Direct shear tests and root tensile tests provided valuable data on the average shear resistance and behavior of the soil–root matrix. These empirical data are crucial for calibrating and validating numerical models. Additionally, a comprehensive topographic survey was conducted to create realistic 3D models of the study area, which are vital for accurately evaluating slope stability in real-world scenarios.
  • Safety margins and engineering measures: The study assumes a GWT at the surface and considers an FOS of 1.0 as the marginal value. To ensure slope safety, an additional safety factor increment ranging from 0.1 to 0.2 or more is necessary. For example, with the implemented root reinforcement, the FOS increased by 0.20 in Zone—I and Zone—III, by 0.25 in Zone—II and Zone—V, and by 0.20 in Zone—IV. However, Zone—I and Zone—V still require additional engineering interventions to reach a satisfactory FOS. This finding underscores the necessity of integrating biological measures with conventional engineering techniques for optimal slope stabilization.
In conclusion, this study demonstrates the substantial role of vegetation in improving soil slope stability through root reinforcement. However, it also highlights the importance of combining these biological measures with traditional engineering solutions, especially in areas with inherently lower stability. The findings of this research provide a strong foundation for future studies aimed at optimizing root reinforcement strategies and developing comprehensive, multifaceted approaches to slope stabilization.

Author Contributions

R.C.T.: numerical applications, computations, and draft manuscript preparation; N.P.B.: conceptualization, materials and methods, and manuscript finalization. All authors have read and agreed to the published version of the manuscript.

Funding

This research received no external funding.

Data Availability Statement

Data are contained within the article in the form of diagrams and graphs while any numerical data produced and used in this paper will be provided upon a written request to the authors.

Acknowledgments

We would like to extend our sincere gratitude to Hom Nath Gharti from Queen’s University, Canada, for his valuable guidance and support throughout the course of this research.

Conflicts of Interest

The authors declare no conflicts of interest.

References

  1. Coppin, N.J.; Richards, I.G. Use of Vegetation in Civil Engineering; Butterworth: London, UK, 1990. [Google Scholar]
  2. Gray, D.H.; Leiser, A.T. Biotechnical Slope Protection and Erosion Control; Van Nostrand Reinhold Co.: New York, NY, USA, 1982. [Google Scholar]
  3. Morgan, R.P.C.; Rickson, R.J. Slope Stabilization and Erosion Control—A Bioengineering Approach; E & FN SPON: London, UK, 1995. [Google Scholar]
  4. Ali, F.H.; Osmani, N. Shear strength of a soil containing vegetation roots. Soils Found. 2008, 48, 587–596. [Google Scholar] [CrossRef]
  5. Bischetti, G.B.; Chiaradia, E.A.; Simonato, T.; Speziali, B.; Vitali, B.; Vullo, P.; Zocco, A. Root strength and root area of forest species in Lombardy. Plant Soil 2005, 278, 11–22. [Google Scholar] [CrossRef]
  6. Danjon, P.; Barker, D.H.; Drexhage, M.; Stokes, A. Using Three-dimensional Plant Root Architecture in Models of Shallow-slope Stability. Ann. Bot. 2008, 101, 1281–1293. [Google Scholar] [CrossRef]
  7. Genet, M.; Kokutse, N.; Stokes, A.; Fourcaud, T.; Cai, X.; Ji, J.; Mickovski, S. Root reinforcement in plantations of Cryptomeria japonica D. Don: Effect of tree age and stand structure on slope stability. For. Ecol. Manag. 2008, 256, 1517–1526. [Google Scholar] [CrossRef]
  8. Schwarza, M.; Pretic, F.; Giadrossichc, F.; Lehmann, P.; Orba, D. Quantifying the role of vegetation in slope stability, A Case study in Tuscany (Italy). Ecol. Eng. 2010, 36, 285–291. [Google Scholar] [CrossRef]
  9. Waldron, L.J.; Dakessian, S. Soil reinforcement by roots: Calculation of increased soil shear resistance from root properties. Soil Sci. Am. J. 1981, 45, 427–435. [Google Scholar] [CrossRef]
  10. Gray, D.H.; Sotir, R.D. Biotechnical and Soil Bioengineering Slope Stabilization; John Wiley and Sons: New York, NY, USA, 1996. [Google Scholar]
  11. Greenway, D.R. Vegetation and slope stability. In Slope Stability; Anderson, M.G., Richards, K.S., Eds.; John Wiley and Sons: New York, NY, USA, 1987; pp. 187–230. [Google Scholar]
  12. Lateh, H.; Bakar, M.A.; Khan, Y.A.; Abustan, I. Influence of tensile force of agave and tea plants roots on experimental prototype slopes. Int. J. Phys. Sci. 2011, 6, 4435–4440. [Google Scholar]
  13. Nakamura, H.; Nghiem, Q.M.; Iwasa, N. Reinforcement of tree roots, LH eds. Eco-and ground bio-engineering: The use of vegetation to improve slope stability. Dev. Plant Soil Sci. 2007, 103, 81–90. [Google Scholar]
  14. Nyambane, O.S.; Mwea, S.K. Root tensile strength of 3 typical plant species and their contribution to soil shear strength; a case study: Sasumua Backslope, Nyandarua District, Kenya. J. Civ. Eng. Res. Pract. 2011, 8, 57–73. [Google Scholar] [CrossRef]
  15. Roering, J.J.; Schmidt, K.M.; Stock, J.D. Shallow landsliding, root reinforcement, and the spatial distribution of trees in the Oregon Coast Range. Can. Geotech. J. 2003, 40, 237–253. [Google Scholar] [CrossRef]
  16. Zhang, C.; Chen, L.; Jiang, J. Vertical root distribution and root cohesion of typical tree species on the Loess Plateau, China. J. Arid. Land 2014, 6, 601–611. [Google Scholar] [CrossRef]
  17. Howell, J. Road Side Bioengineering, Site Handbook; HMG, DOR: Kathmandu, Nepal, 2002. [Google Scholar]
  18. Howell, J. Road Side Bioengineering, Reference Manual; HMG, DOR: Kathmandu, Nepal, 2002. [Google Scholar]
  19. Wu, T.H.; McKinnell, W.P.; Swanston, D.N. Strength of tree roots and landslides on Prince of Wales Island, Alaska. Can. Geotech. J. 1979, 16, 19–33. [Google Scholar] [CrossRef]
  20. Tiwari, R.C.; Bhandary, N.P.; Yatabe, R.; Bhat, D.R. New numerical scheme in the finite-element method for evaluating the root-reinforcement effect on soil slope stability. Geotechnique 2013, 63, 129–139. [Google Scholar] [CrossRef]
  21. Coutts, M.P. Root architecture and tree stability. Plant Soil 1983, 71, 171–188. [Google Scholar] [CrossRef]
  22. Danjon, F.; Bert, D.; Godin, C.; Trichet, P. Structural root architecture of 5-year-old Pinus pinaster measured by 3D digitising and analysed with AMAPmod. Plant Soil 1999, 217, 49–63. [Google Scholar] [CrossRef]
  23. Lin, D.G.; Liu, W.T.; Lin, S.H. Estimating the effect of shear strength increment due to root on the stability of makino bamboo forest slopeland. J. GeoEng. 2011, 6, 73–88. [Google Scholar]
  24. Mattia, C.; Bischetti, G.B.; Gentile, F. Biotechnical characteristics of root systems of typical Mediterranean species. Plant Soil 2007, 278, 23–32. [Google Scholar] [CrossRef]
  25. Preti, F.; Giadrossich, F. Root reinforcement and slope bioengineering stabilization by Spanish Broom (Spartium junceum L.). Hydrol. Earth Syst. Sci. 2009, 13, 1713–1726. [Google Scholar] [CrossRef]
  26. Dumlao, M.R.; Ramananarivo, S.; Goyal, V.; DeJong, J.T.; Waller, J.; Silk, W.K. The role of root development of Avena fatua in conferring soil strength. Am. J. Bot. 2015, 102, 1–11. [Google Scholar] [CrossRef]
  27. Waldron, L.J. The shear resistance of root-permeated homogeneous and stratified soil. Soil Sci. Soc. Am. J. 1977, 41, 843–849. [Google Scholar] [CrossRef]
  28. Wu, T.H. Investigation of Landslides on Prince of Wales Island, Alaska; Geotech. Eng. Rep. No. 5; Department Civil Engineering, Ohio State University: Columbus, OH, USA, 1976. [Google Scholar]
  29. Schmidt, K.M.; Roering, J.J.; Stock, J.D.; Dietrich, W.E.; Montgomery, D.R.; Schaub, T. Root cohesion variability and shallow landslide susceptibility in the Oregon Coast Range. Can. Geotech. J. 2001, 38, 995–1024. [Google Scholar] [CrossRef]
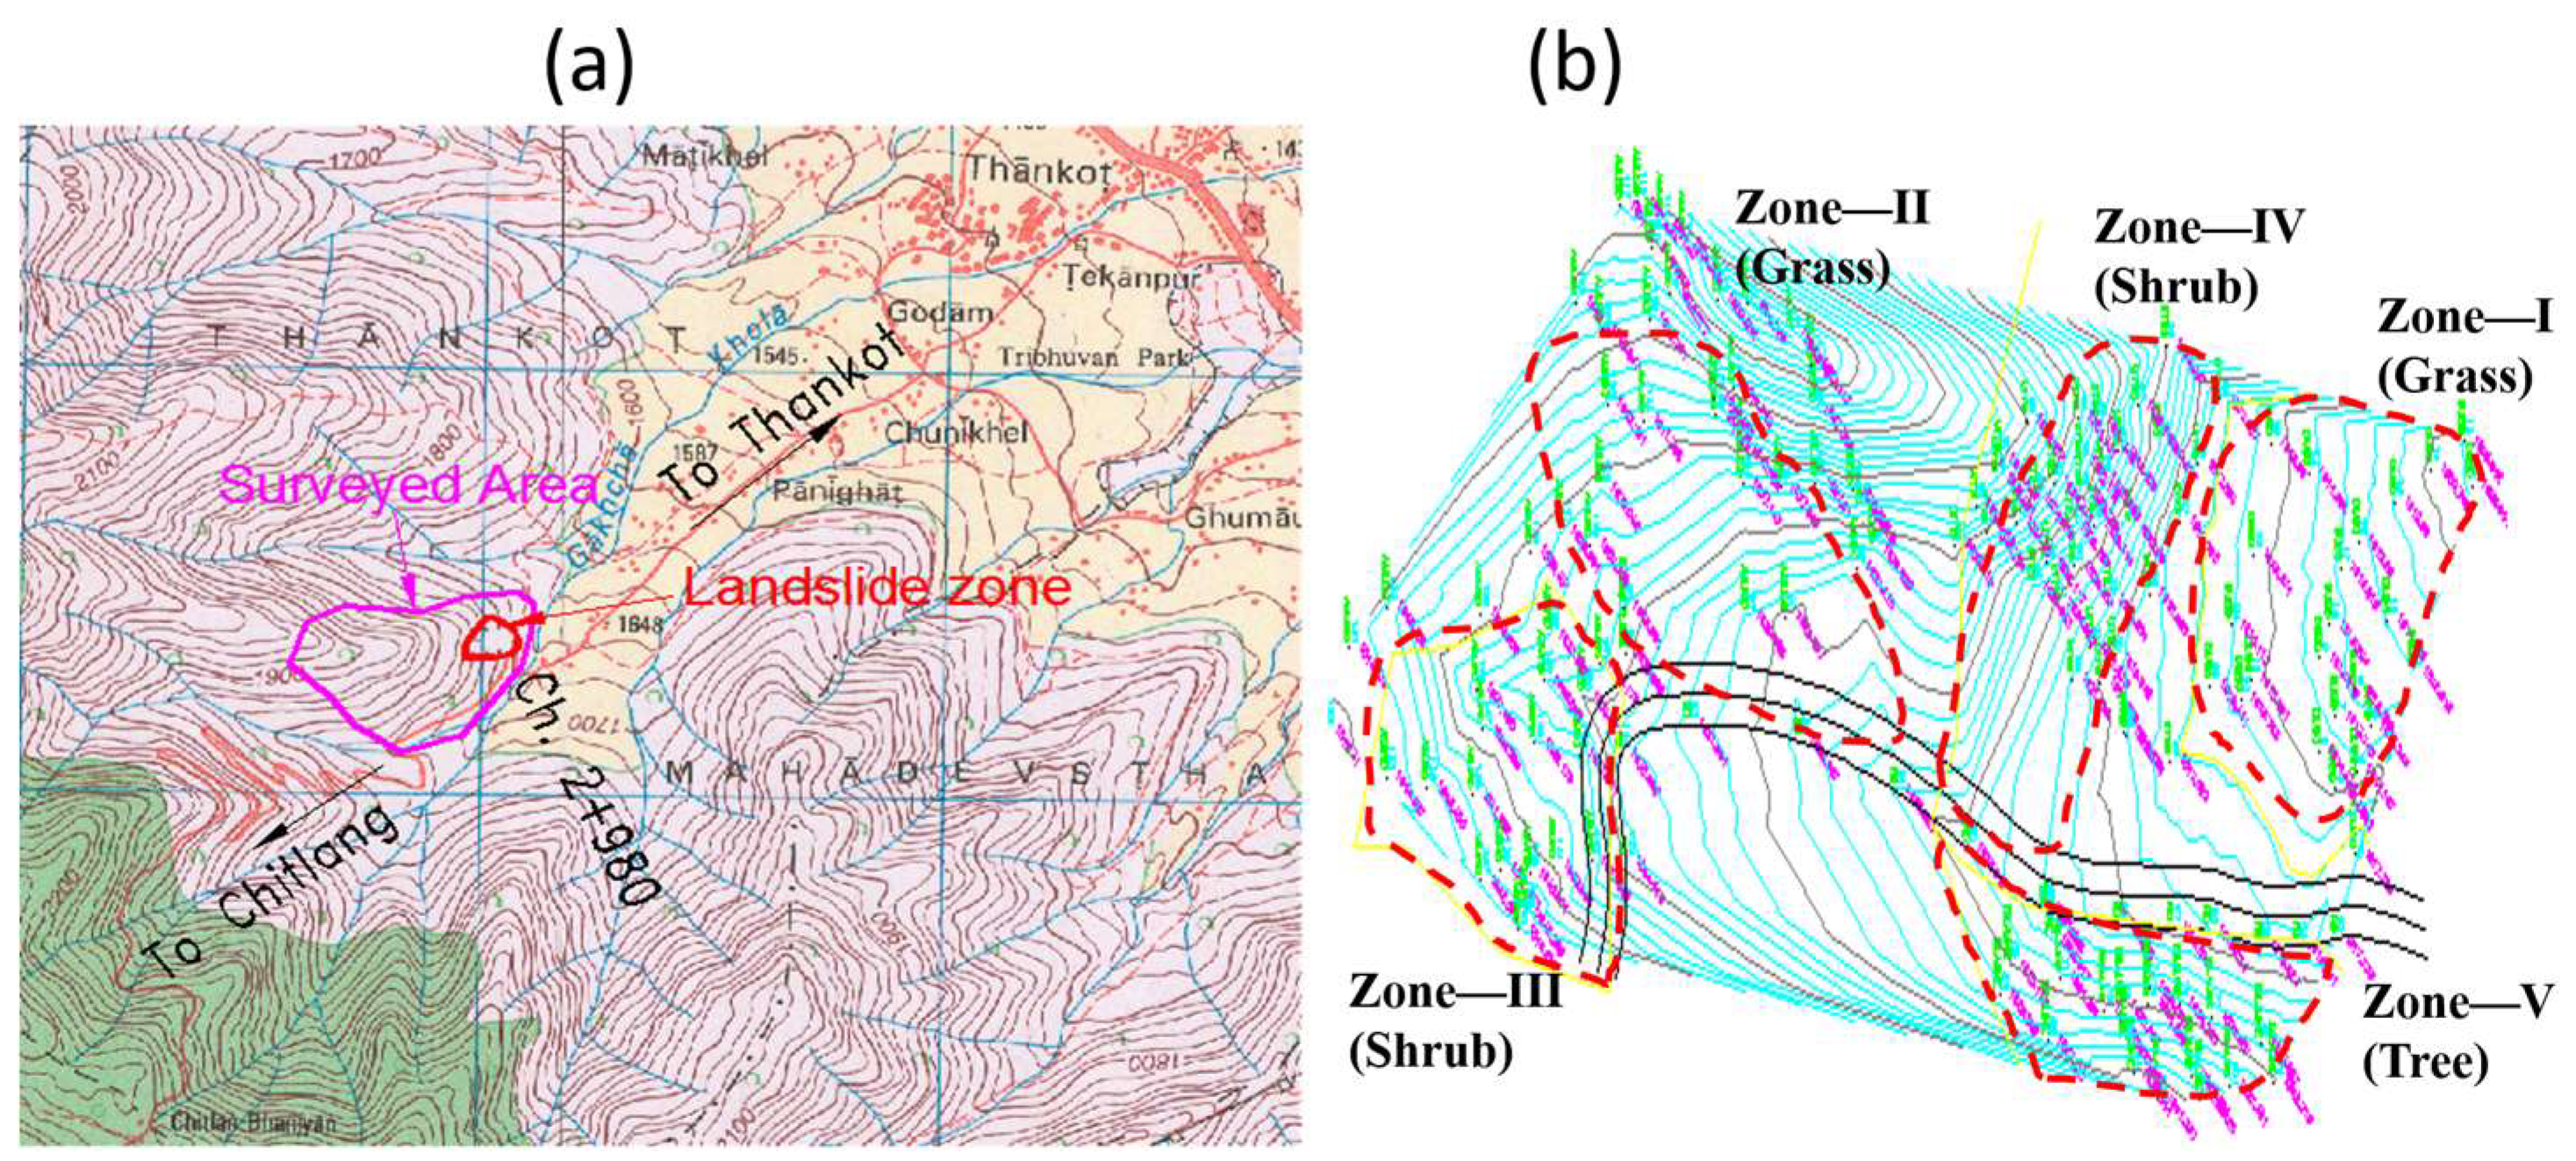
Figure 1. Study area: (a) topographic map of the study area; (b) overall site contours imported from a total station survey, showing vegetation zones (i.e., Zone—I: grass, Zone—II: grass, Zone—III: shrub, Zone—IV: shrub, Zone—V: tree).
Geotechnics 04 00046 g001
Figure 2. Landslide Zone—I for Cynodon dactylon (Dubo is the local Nepalese name, grass category): (a) site contours imported from a total station survey; (b) slope profile 1—1 (the green inclined line) as indicated in Figure (a).
Geotechnics 04 00046 g002
Figure 3. Landslide Zone—II for Thysanolaena maxima (Amliso is the local Nepalese name, grass category): (a) site contours imported from a total station survey; (b) slope profile 1—1 (the green inclined line) as indicated in Figure (a).
Geotechnics 04 00046 g003
Figure 4. Landslide Zone—III for Adhatoda vasica (Assuro is the local Nepalese name, shrub category): (a) site contours imported from a total station survey; (b) slope profile 1—1 (the green inclined line) as indicated in Figure (a).
Geotechnics 04 00046 g004
Figure 5. Landslide Zone—IV for Maesa chisia (Bilaune is the local Nepalese name, shrub category): (a) site contours imported from a total station survey; (b) slope profile 1—1 (the green inclined line) as indicated in Figure (a).
Geotechnics 04 00046 g005
Figure 6. Landslide Zone—V for Alnus nepalensis (Uttis is the local Nepalese name, tree category): (a) site contours imported from a total station survey; (b) slope profile 1—1 (the green inclined) as indicated in Figure (a).
Geotechnics 04 00046 g006
Figure 7. Plants of all three categories: (a) Landslide Zone—I of Cynodon dactylon (Dubo is the local Nepalese name, grass category) site; (b) Landslide Zone—II of Thysanolaena maxima (Amliso is the local Nepalese name, grass category) site; (c) Landslide Zone—III of Adhatoda vasica (Assuro is the local Nepalese name, shrub category) site; (d) Landslide Zone—IV of Maesa chisia (Bilaune is the local Nepalese name, shrub category) site; (e) Landslide Zone—V of Alnus nepalensis (Uttis is the local Nepalese name, tree category) site.
Geotechnics 04 00046 g007
Figure 8. Root tensile strength test machine.
Geotechnics 04 00046 g008
Figure 9. Boundary conditions for 3D domain showing the meshing accuracy in different colors.
Geotechnics 04 00046 g009
Figure 10. Model including vegetation of all three categories: (a) with 1 m vegetation cover; (b) with 2 m vegetation cover.
Geotechnics 04 00046 g010
Figure 11. Three-dimensional slope models of the landslide site: (a) slope model including vegetation of all three categories; (b) Cynodon dactylon (Dubo is the local Nepalese name, grass category) site; (c) Thysanolaena maxima (Amliso is the local Nepalese name, grass category) site; (d) Adhatoda vasica (Asuro is the local Nepalese name, shrub category) site; (e) Maesa chisia (Bilaune is the local Nepalese name, shrub category) site; (f) Alnus nepalensis (Uttis is the local Nepalese name, tree category) site.
Geotechnics 04 00046 g011
Figure 12. Three-dimensional models of Alnus nepalensis (locally known as Uttis): (a) with 1 m cover; (b) with 2 m cover; (c) with 3 m cover.
Geotechnics 04 00046 g012
Figure 13. Failure stress of Adhatoda vasica (Asuro is the local Nepalese name, shrub category) site: (a) XX direction; (b) YY direction; (c) XY direction.
Geotechnics 04 00046 g013
Figure 14. Correlation of results between the Spectral Element Method (SEM) and the Finite Element Method (FEM) approaches.
Geotechnics 04 00046 g014
Figure 15. SRF vs. displacement plot of rooted soil: (a) Cynodon dactylon (locally known as Dubo in Nepal, grass category) site; (b) Thysanolaena maxima (locally known as Amliso in Nepal, grass category) site; (c) Adhatoda vasica (locally known as Asuro in Nepal, shrub category) site; (d) Maesa chisia (locally known as Bilaune in Nepal, shrub category) site; (e) Alnus nepalensis (locally known as Uttis in Nepal, tree category) site.
Geotechnics 04 00046 g015
Figure 16. SRF vs. displacement plot for Cynodon dactylon (locally known as Dubo in Nepal, grass category) site: (a) dry and saturated soil slope conditions; (b) groundwater table (GWT) at 1 m from the surface; (c) GWT at 2 m depth; (d) GWT at 3 m depth; (e) GWT at 4 m depth; (f) GWT at 5 m depth.
Geotechnics 04 00046 g016
Figure 17. SRF vs. displacement plot for Thysanolaena maxima (locally known as Amliso in Nepal, grass category) site: (a) dry and saturated soil slope conditions; (b) groundwater table (GWT) at 1 m below the surface; (c) GWT at 2 m depth; (d) GWT at 3 m depth; (e) GWT at 4 m depth; (f) GWT at 5 m depth.
Geotechnics 04 00046 g017
Figure 18. SRF vs. displacement plot for Adhatoda vasica (locally known as Asuro in Nepal, shrub category) site: (a) dry and fully saturated soil slope conditions; (b) groundwater table (GWT) at 1 m below the surface; (c) GWT at 2 m depth; (d) GWT at 3 m depth; (e) GWT at 4 m depth; (f) GWT at 5 m depth.
Geotechnics 04 00046 g018
Figure 19. SRF vs. displacement plot for Maesa chisia (locally known as Bilaune in Nepal, shrub category) site: (a) dry and fully saturated soil slope conditions; (b) groundwater table (GWT) at 1 m below the surface; (c) GWT at 2 m depth; (d) GWT at 3 m depth; (e) GWT at 4 m depth; (f) GWT at 5 m depth.
Geotechnics 04 00046 g019
Figure 20. SRF vs. displacement plot for Alnus nepalensis (locally known as Uttis in Nepal, tree category) site: (a) dry and fully saturated soil slope conditions; (b) groundwater table (GWT) at 1 m below the surface; (c) GWT at 2 m depth; (d) GWT at 3 m depth; (e) GWT at 4 m depth; (f) GWT at 5 m depth.
Geotechnics 04 00046 g020
Table 1. Bioengineering plants selected from all three categories [17,18].
Local NameBotanical NameCharacterAltitudeSiteBest PropagationRemarks
Grass category
DuboCynodon dactylonSmall clumpingTerai (plain area)-1800 mVaried Slip cuttingStands max. 100 mm ht.
AmlisoThysanolaena maximaLarge clumpingTerai (plain area)-2000 mVariedRhizome cuttingStands up to 2 m
Shrub category
AssuroAdhatoda vasicaShrub Terai (plain area)-1000 mVariedHardwood stem cuttingStands up to 3 m ht.
BilauneMaesa chisiaShrubTerai (plain area)-2000 mVariedHardwood cuttingStands up to 3 m ht.
Tree category
UttisAlnus nepalensisLarge broad-leaved tree900–2700 mVaried and moistHardwood cuttingTree
Table 2. Soil and root material models [1,2,3,10,29].
Botanical Name of the Plant SpeciesLocal NameMean Tensile Strength (kN/m2)Root Area Ratio (RAR)Effective Root
Cohesion Due to
Evapotranspiration (kN/m2)
Angle of Internal Friction (Degree)Young’s Modulus (kN/m2)Unit Weight of Roots (kN/m3)
Barren soil (soil without root)
Cynodon dactylonDubo3261.150.00247464.1020.071.35 × 1058.25
Thysanolaena maximaAmliso15,829.300.00106456.8524.473.21 × 1058.13
Adhatoda vasicaAssuro21,231.100.0012565.1022.871.66 × 10513.26
Alnus nepalensisUttis9058.740.00209982.1022.877.43 × 10412.14
Maesa chisiaBilaune12,261.100.00170745.3019.301.23 × 1059.32
Vegetated/root-permeated soil (soil with root)
Cynodon dactylonDubo3261.150.00247504.4020.441.35 × 1058.25
Thysanolaena maximaAmliso15,829.300.00106458.8525.703.21 × 1058.13
Adhatoda vasicaAssuro21,231.100.00125606.7023.811.66 × 10513.26
Alnus nepalensisUttis9058.740.00209983.7024.487.43 × 10412.14
Maesa chisiaBilaune12,261.100.00170747.7020.281.23 × 1059.32
Table 3. Summary of 3D FEM results.
ZonePlant Species NameFOS of Rooted Soil Slope Model AtVegetation Category
BotanicalLocalDry ConditionWet ConditionGWT at Down (m)
1.002.003.004.005.00
Zone—ICynodon dactylonDubo1.100.850.850.900.951.001.05Grass
Zone—IIThysanolaena maximaAmliso1.251.001.051.051.201.251.25Grass
Zone—IIIAdhatoda vasicaAsuro1.300.950.951.001.001.101.15Shrub
Zone—IVAlnus nepalensisBilaune1.351.101.101.151.151.201.25Shrub
Zone—VMaesa chisiaUttis1.050.800.800.900.951.001.05Tree
Table 4. Summary of 3D SEM results.
ZonePlant Species NameFoS of Rooted Soil Slope ModelVegetation Category
BotanicalLocalDry ConditionWet ConditionGWT at Down (m)
1.002.003.004.005.00
Zone—ICynodon dactylonDubo1.000.750.800.850.900.900.95Grass
Zone—IIThysanolaena maximaAmliso1.200.951.001.001.151.151.20Grass
Zone—IIIAdhatoda vasicaAsuro1.250.850.901.951.001.151.15Shrub
Zone—IVAlnus nepalensisBilaune1.301.001.051.101.101.151.20Shrub
Zone—VMaesa chisiaUttis1.000.700.750.800.850.900.95Tree
Disclaimer/Publisher’s Note: The statements, opinions and data contained in all publications are solely those of the individual author(s) and contributor(s) and not of MDPI and/or the editor(s). MDPI and/or the editor(s) disclaim responsibility for any injury to people or property resulting from any ideas, methods, instructions or products referred to in the content.