


Short-Term Predictions of Evaporation Using SoilCover at the Near-Surface of a Mine Waste Pile following Heavy Rainfall Events

Abstract
:1. Introduction
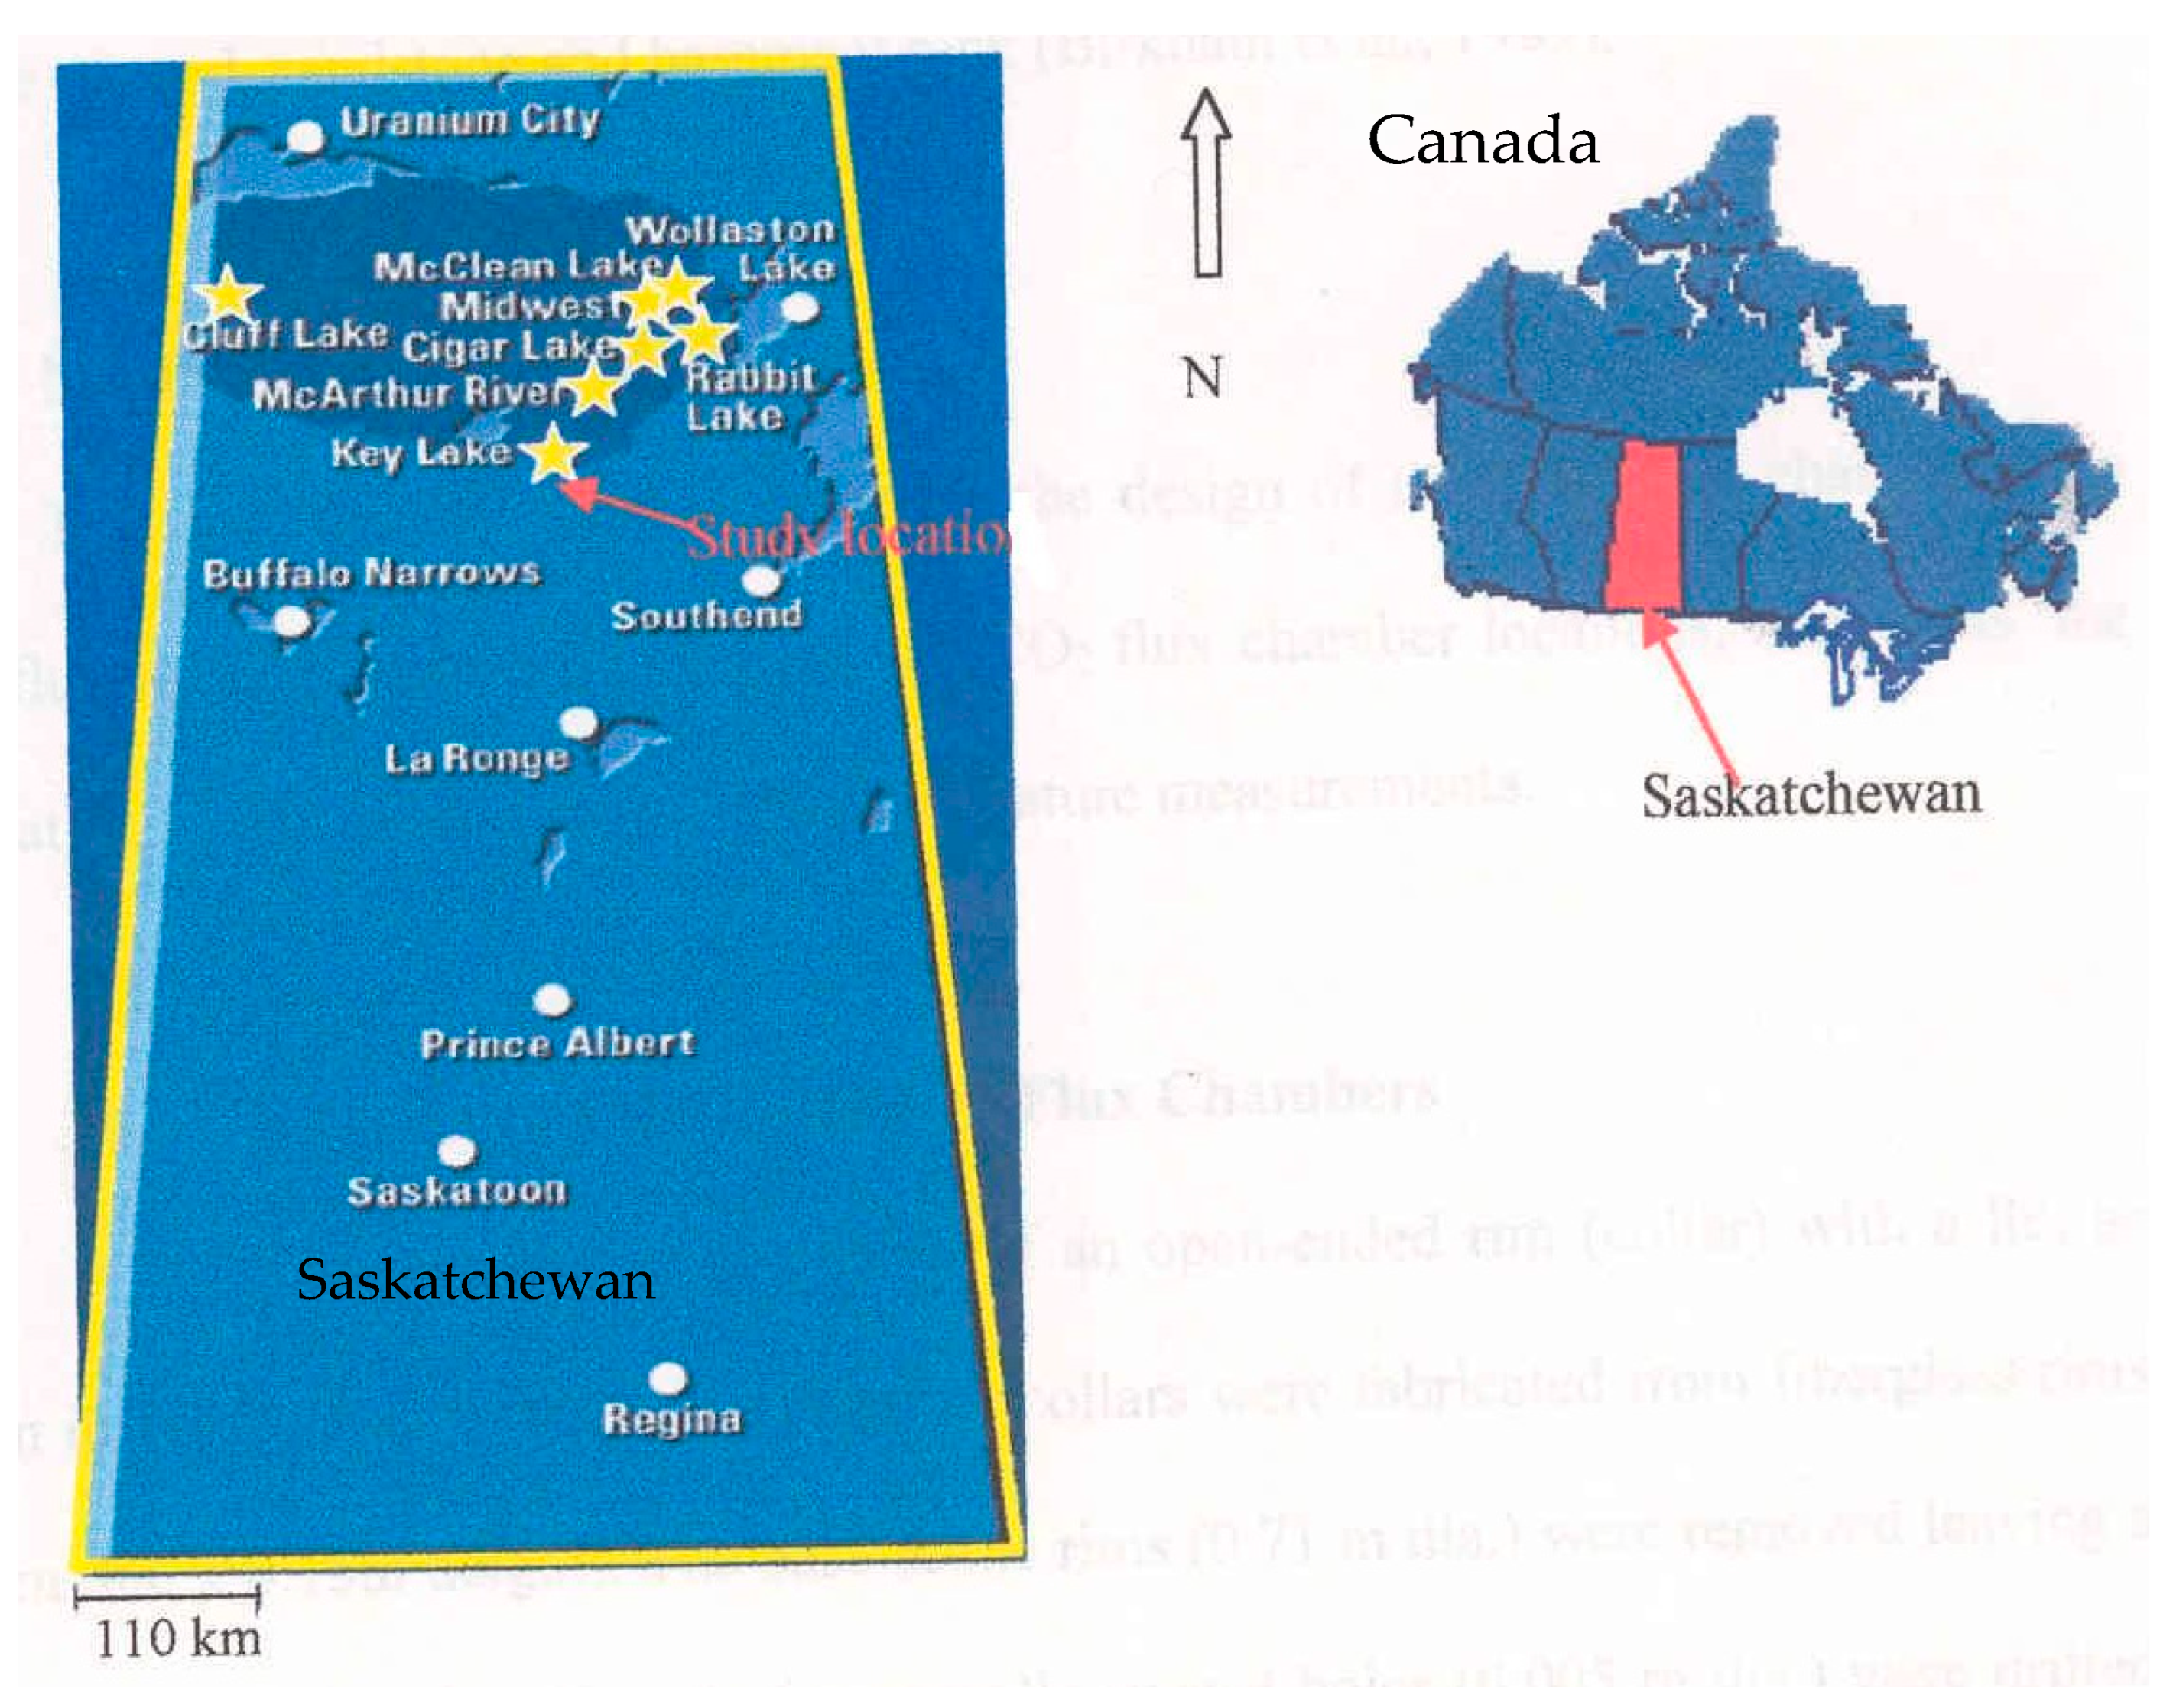
2. Study Site
3. Methodology
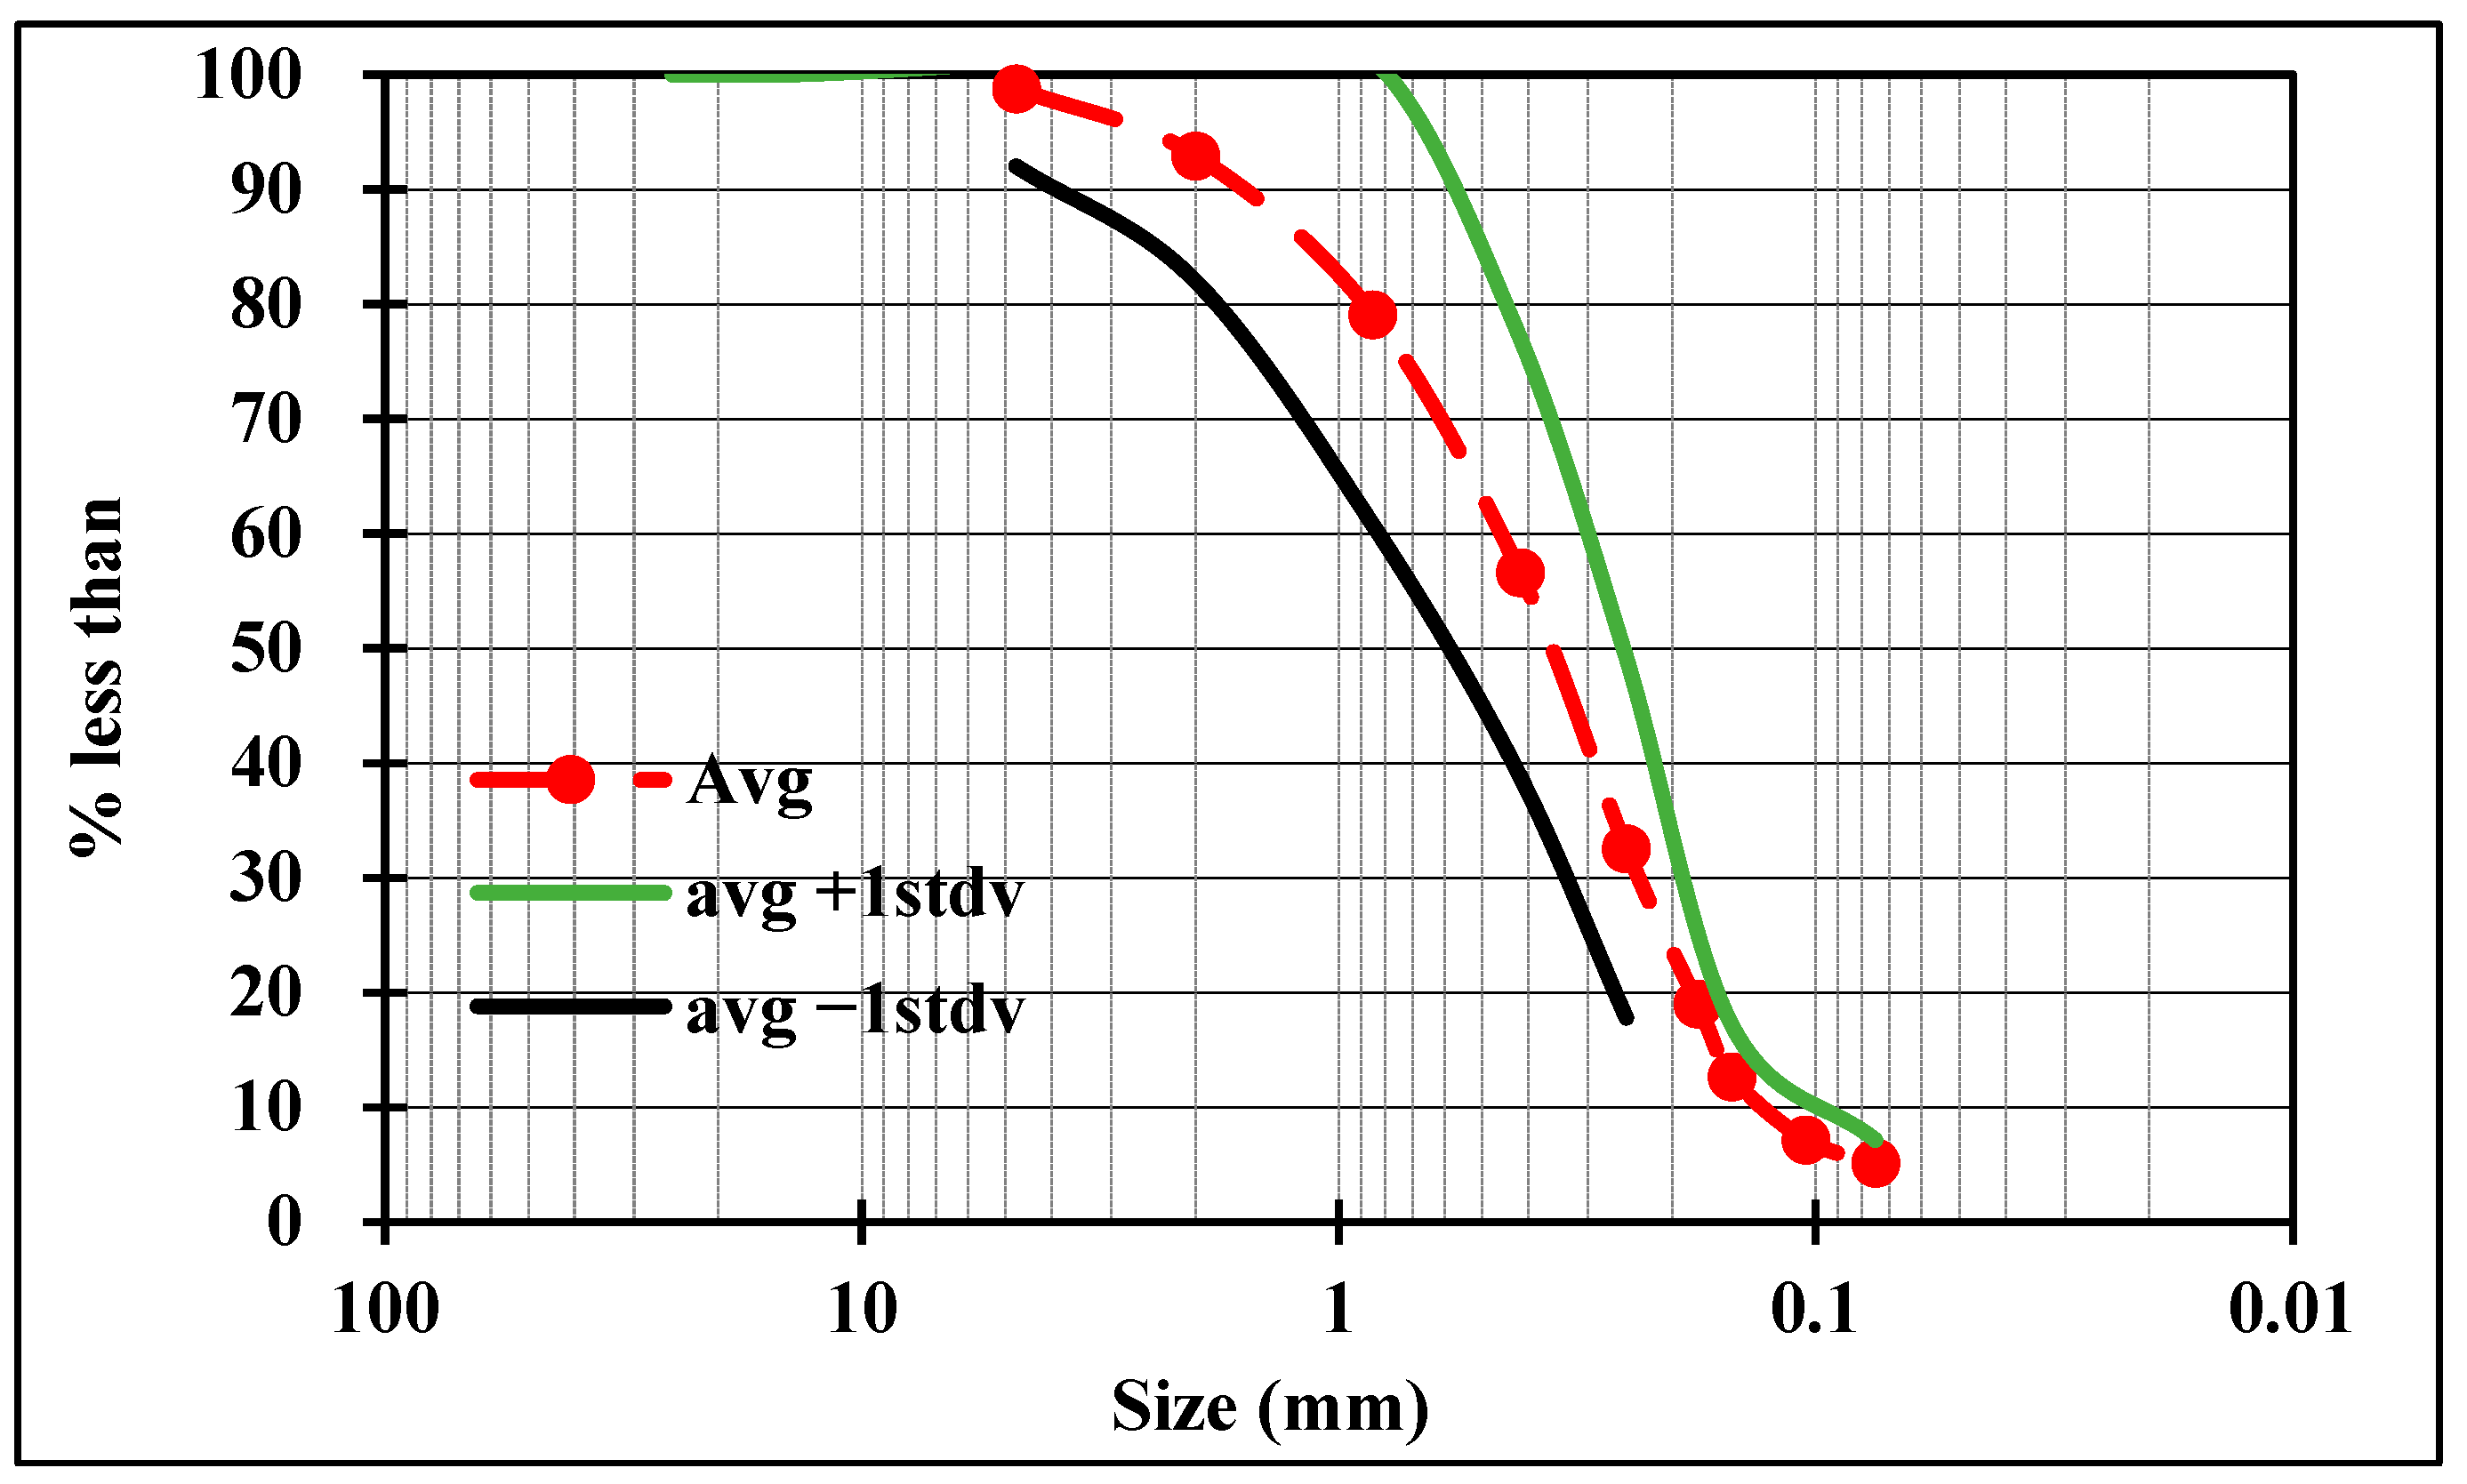
3.1. Particle-Size Distribution (PSD)
3.2. Soil Water Characteristic Curve (SWCC)
3.3. Gravimetric Soil Water Content
3.4. SoilCover (SC) Model
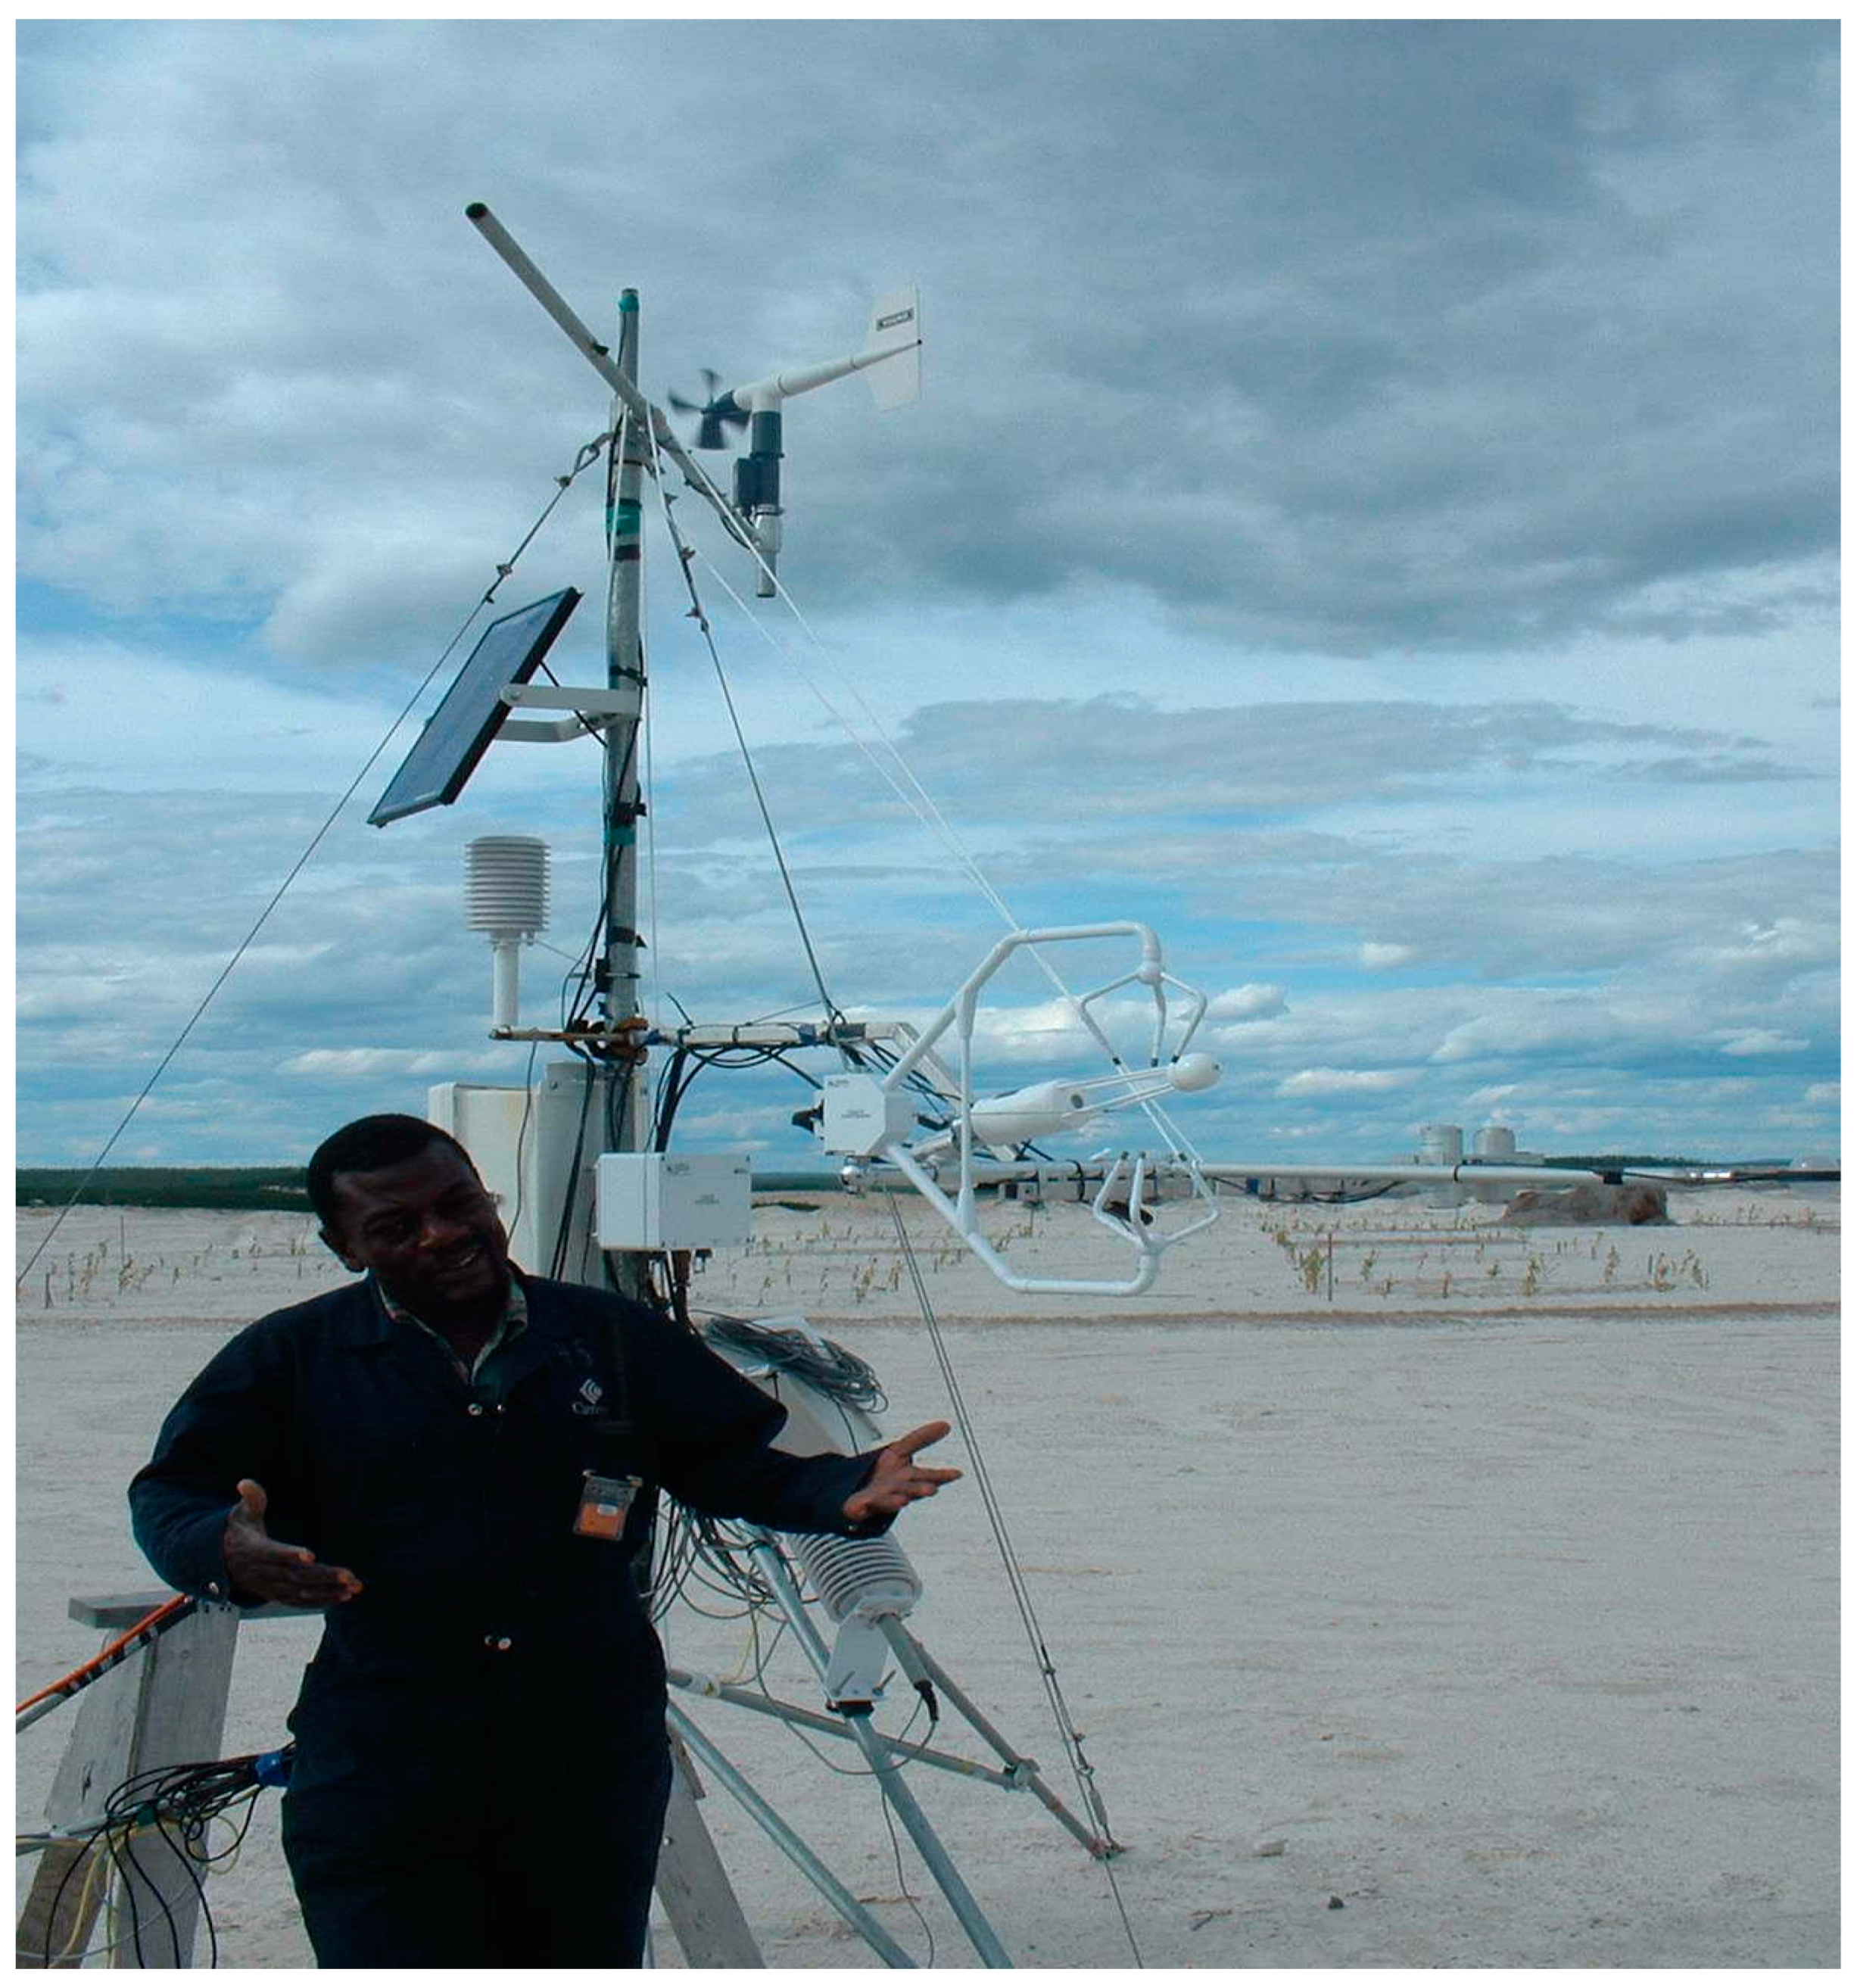
3.5. Eddy Covariance (EC) Technique
4. Results
4.1. PSD
4.2. SWCC
4.3. Weather Station Data at the DSWR Pile
4.4. Short-Term Measurements of the Soil Drying Rates by the Gravimetric Method following Heavy Rainfall Events at the Surface and Near-Surface of the DSWR Pile
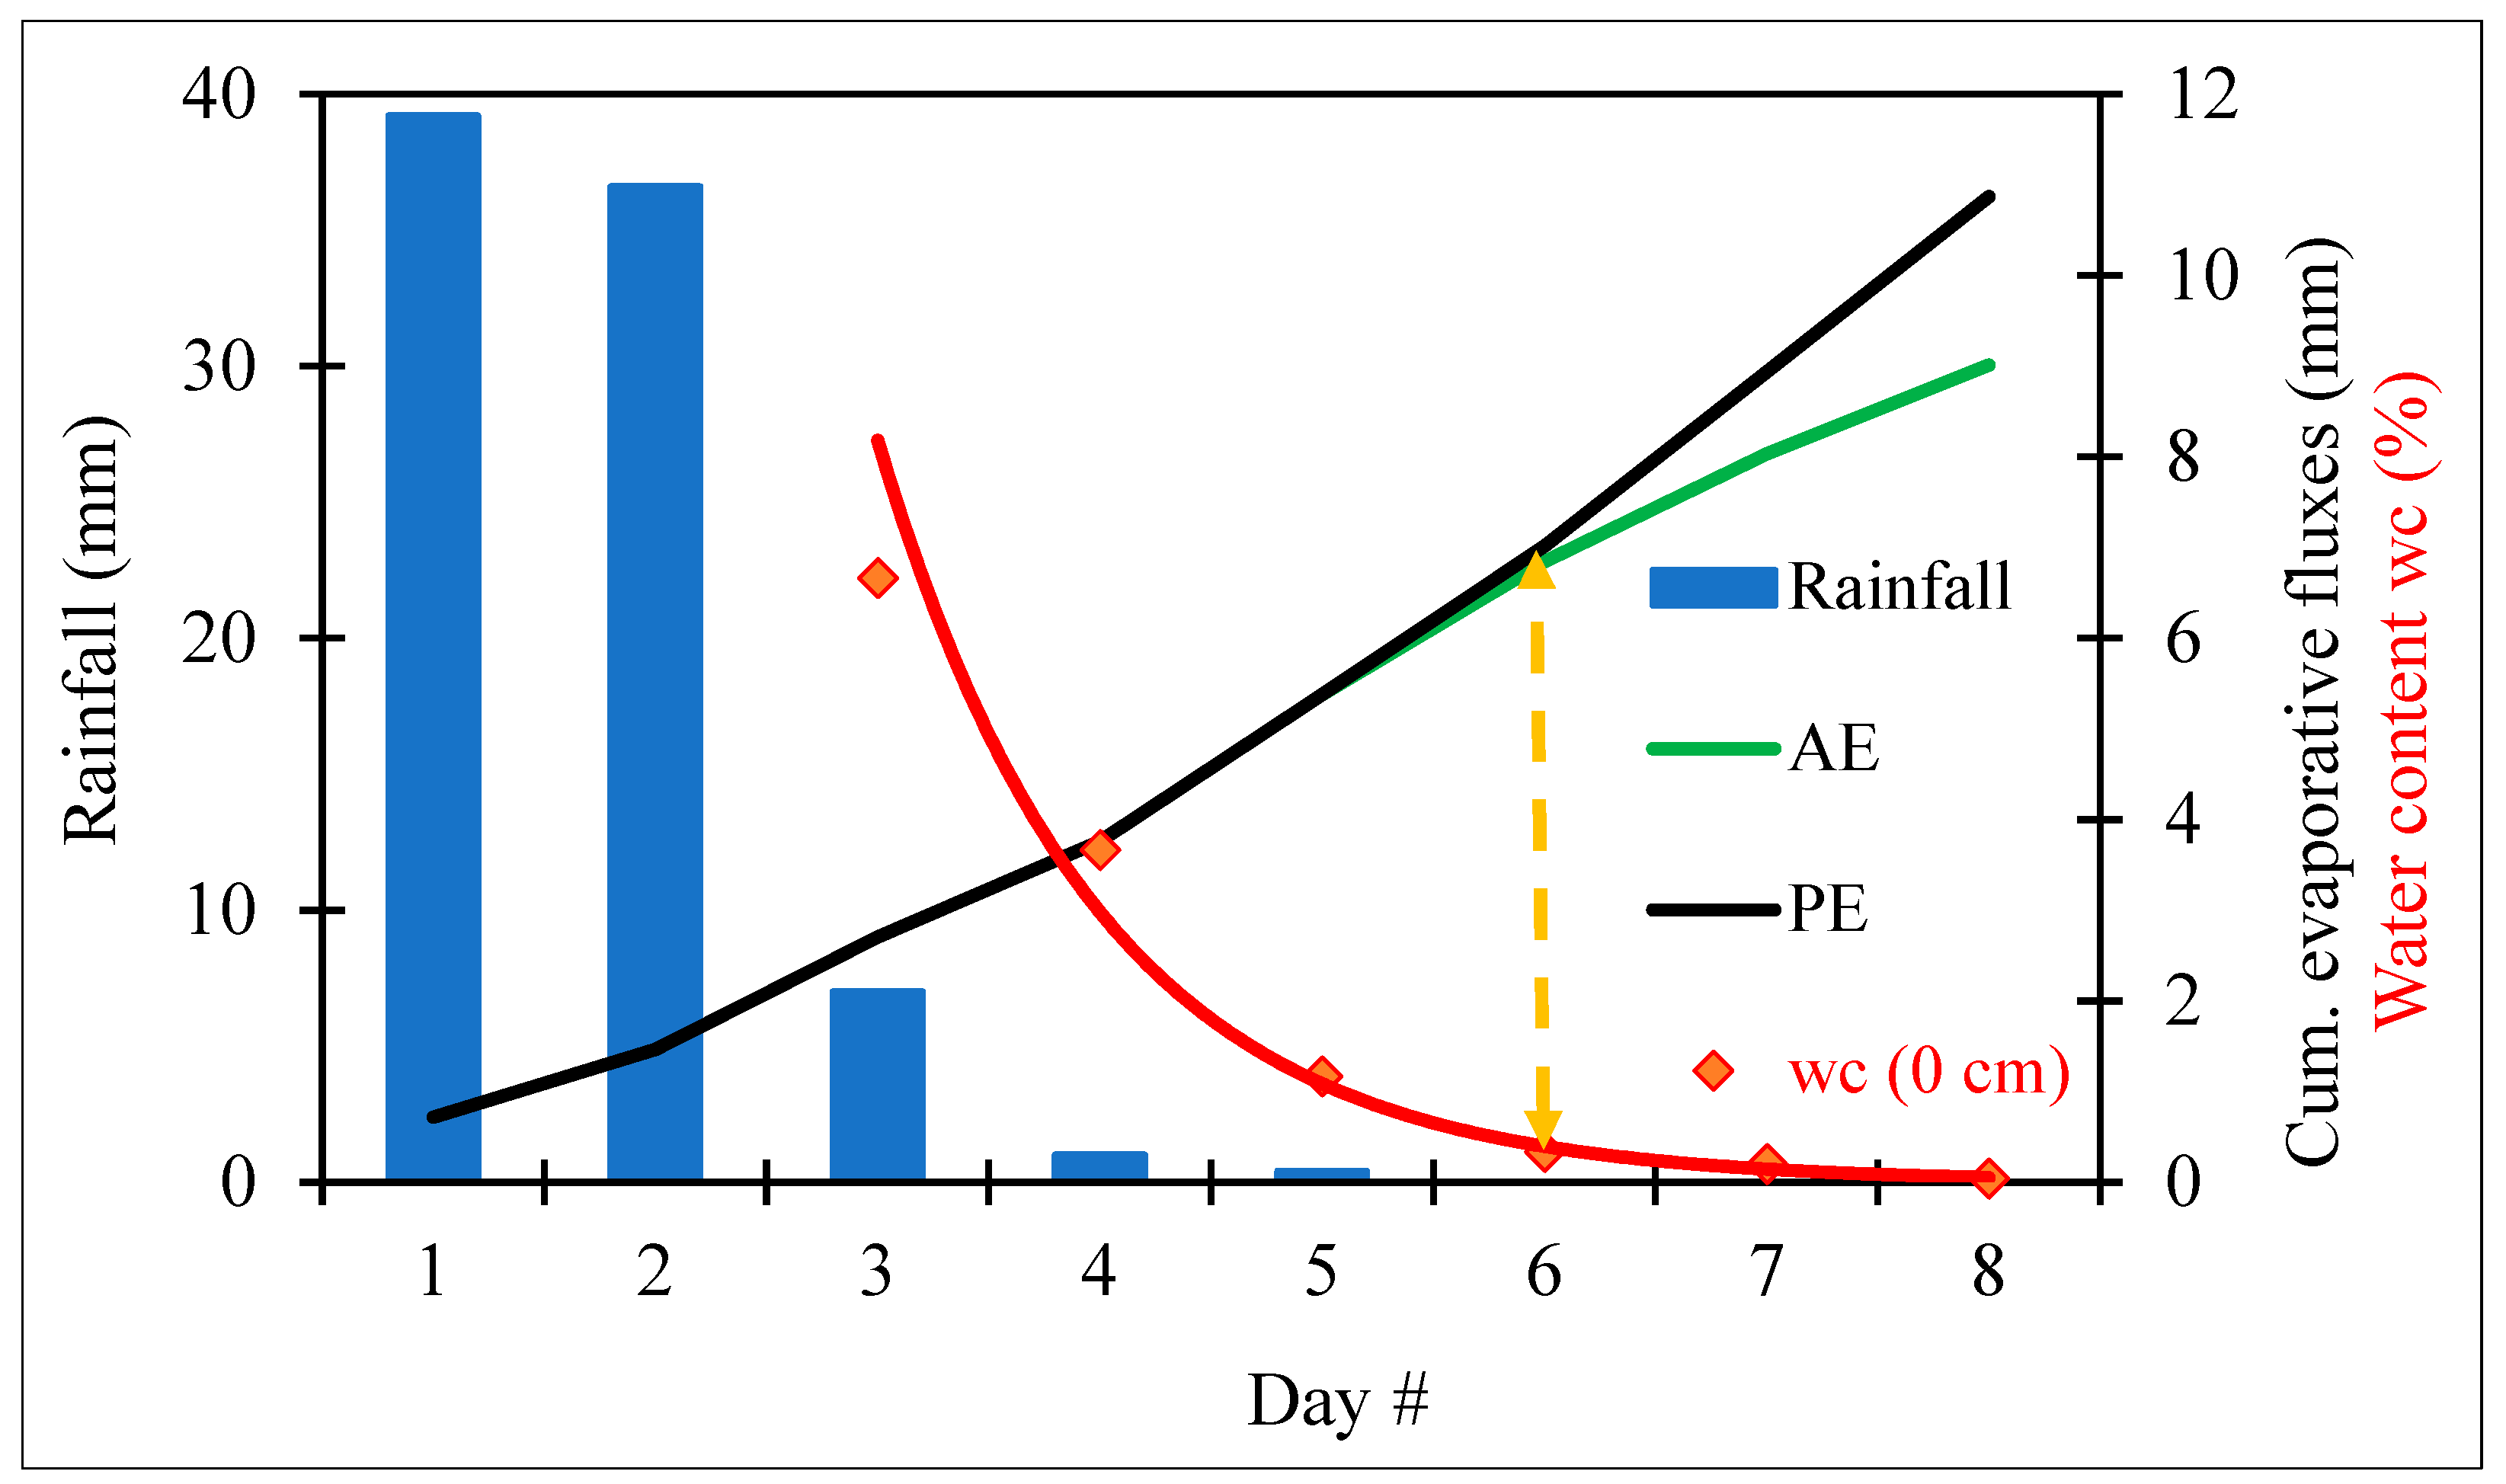
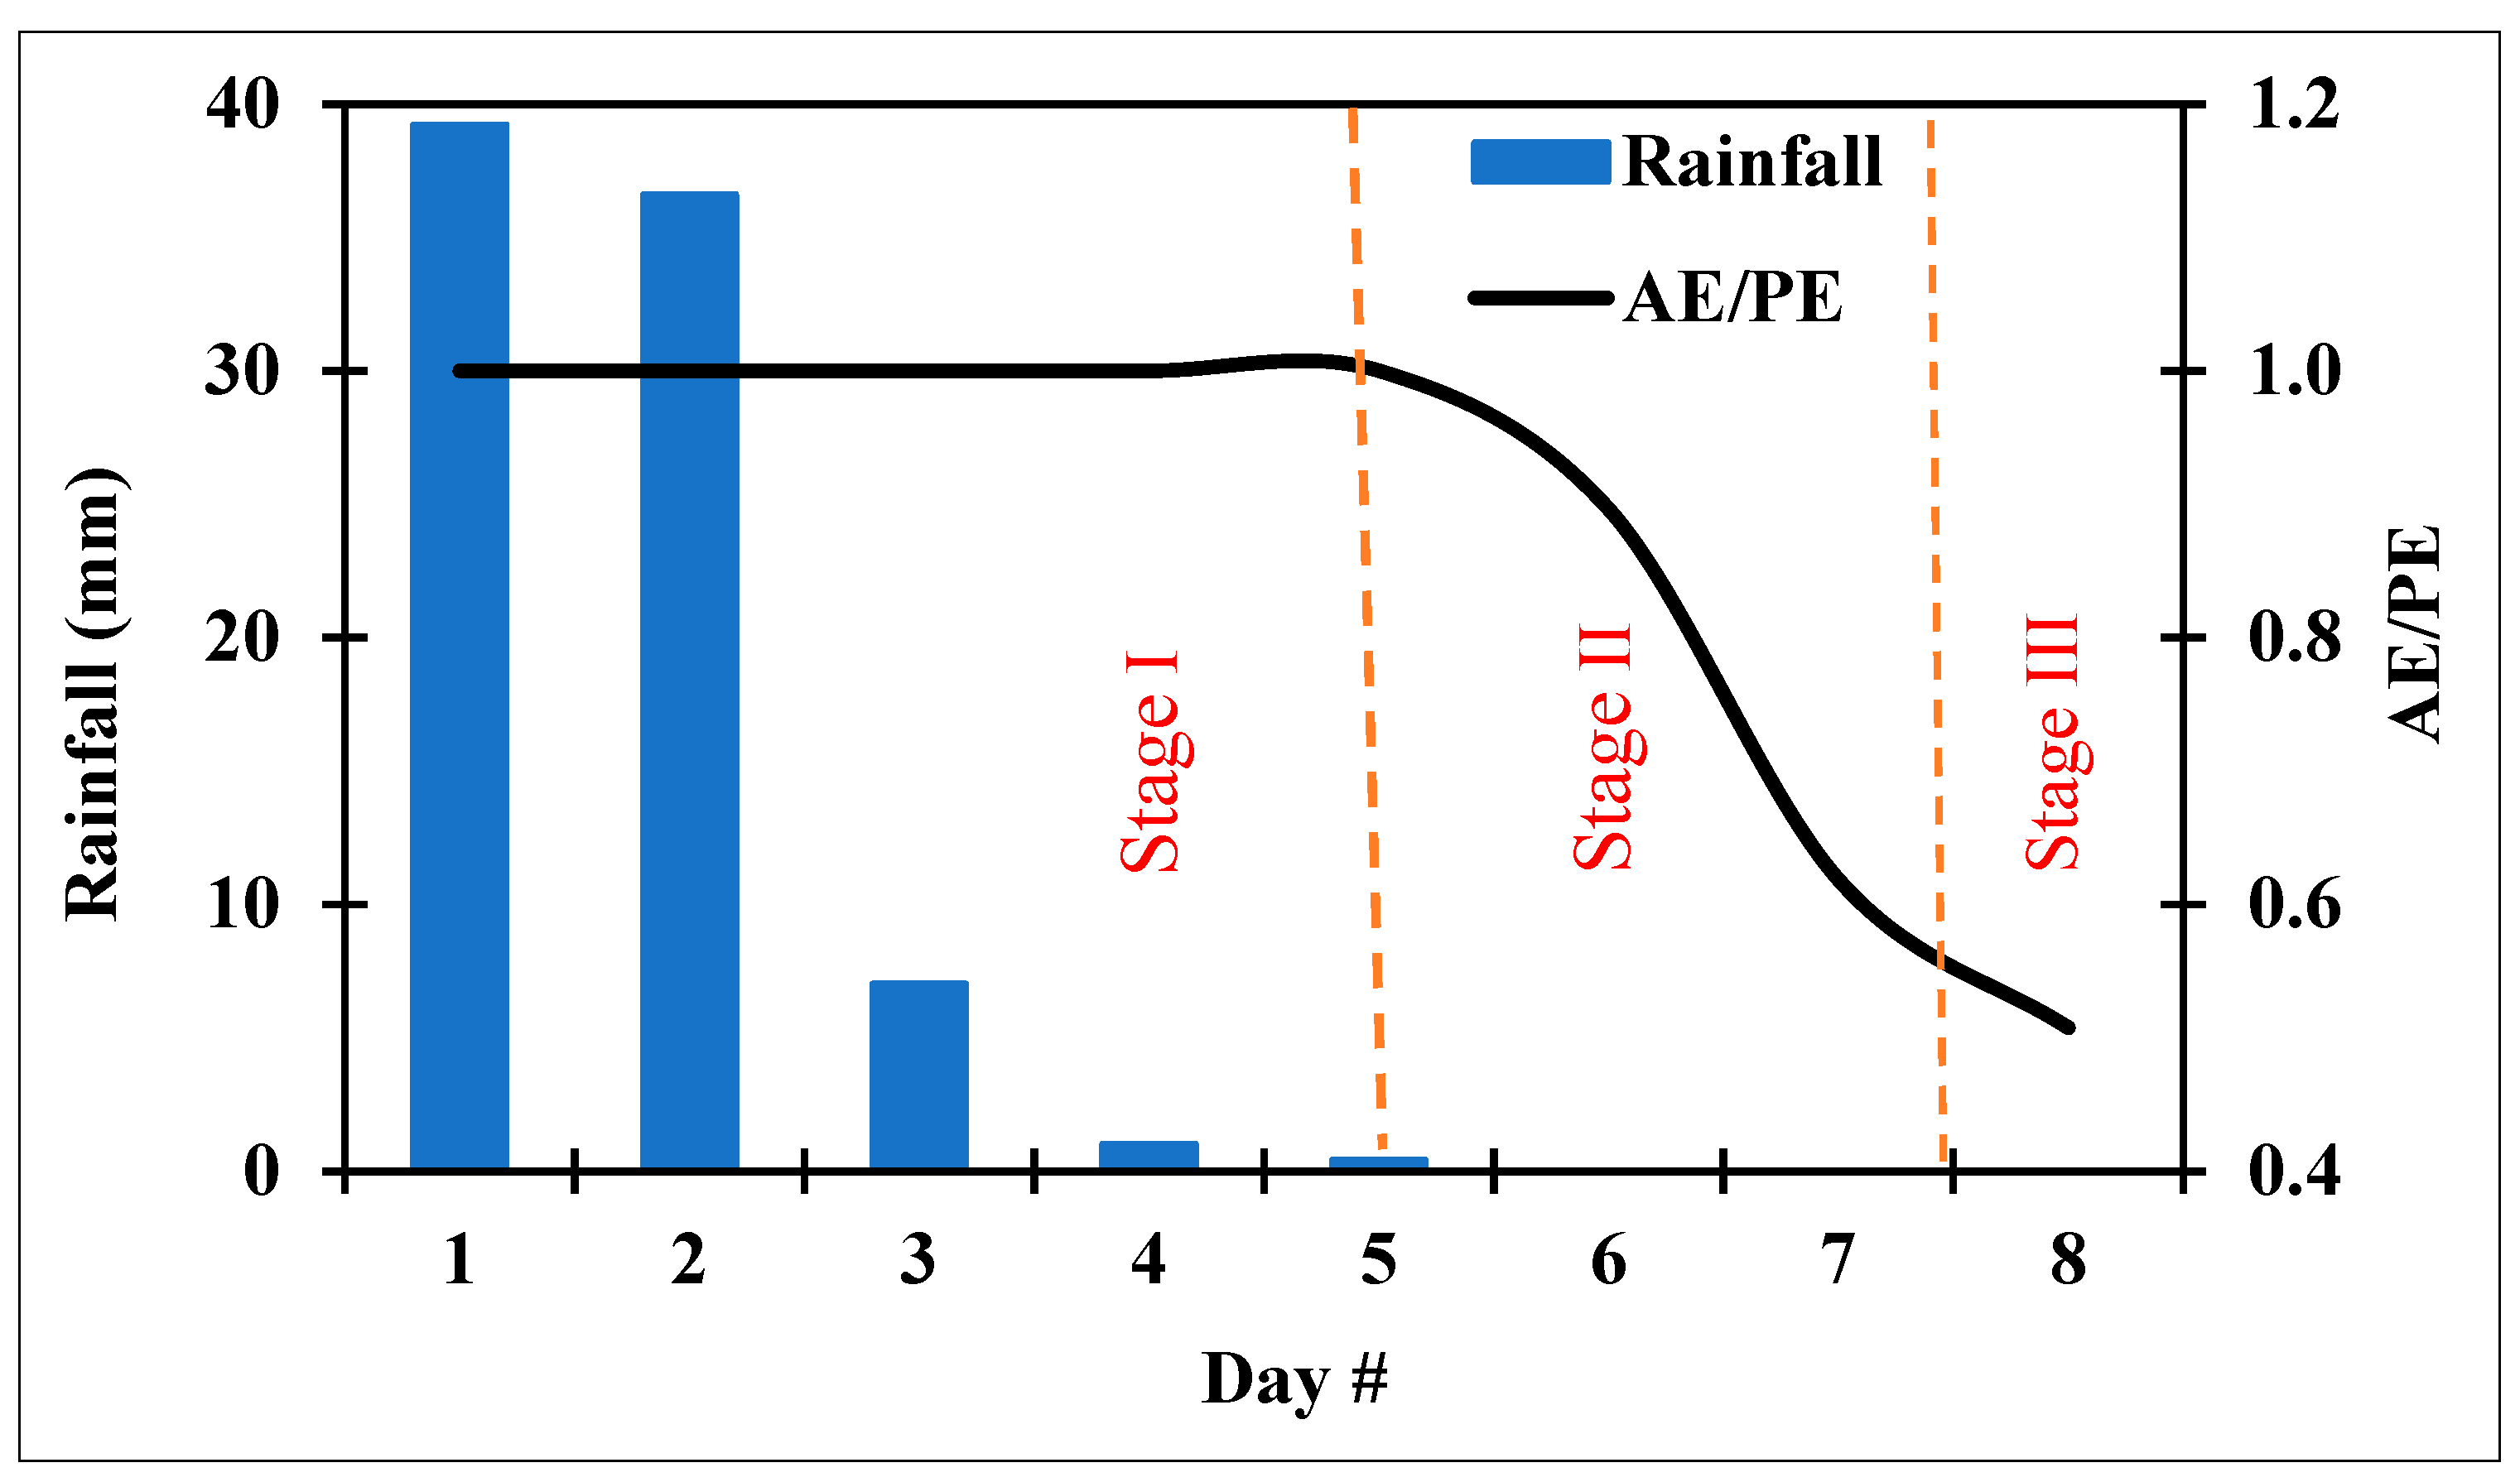
4.5. Prediction of Potential and Actual Evaporation Rates Using the SoilCover Model during and following Heavy Rainfall Events for the 8-Day and 27-Day Test Periods at the DSWR Pile
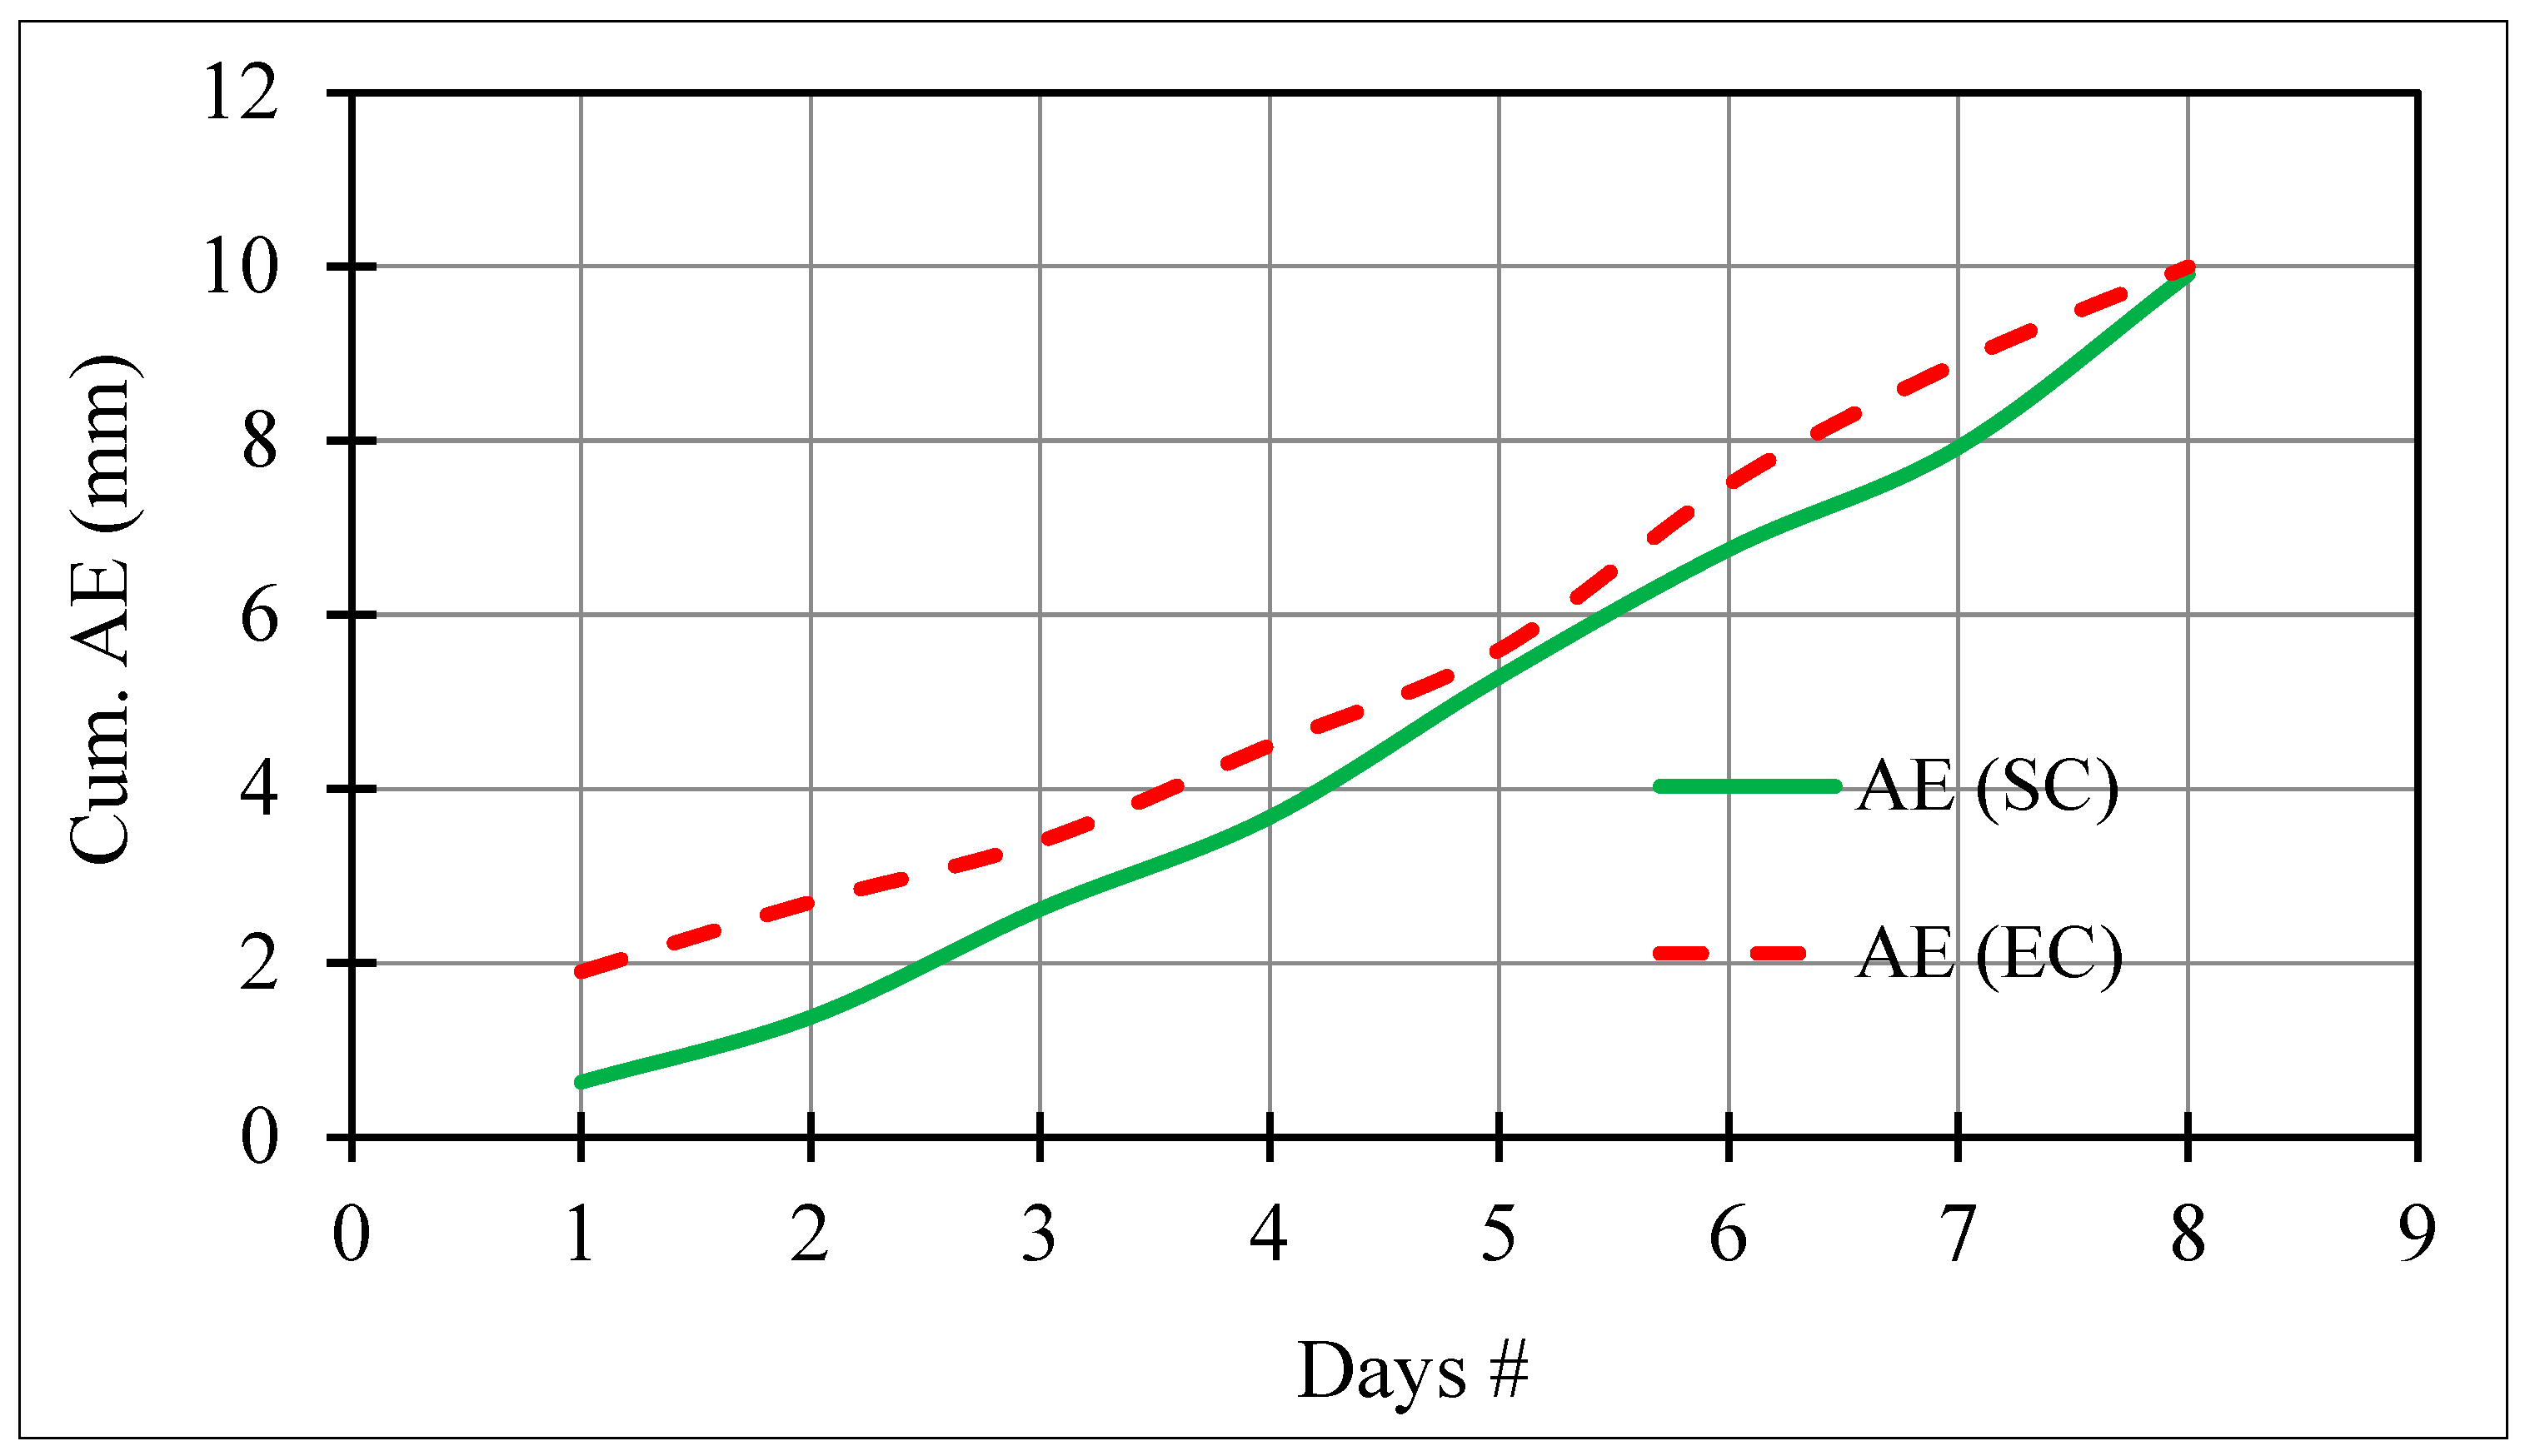
4.6. Comparison of SoilCover-Simulated AE Data with Eddy-Covariance-Measured AE Data during the 8-Day and 27-Day Test Periods at the DSWR Pile
5. Discussion
5.1. PSD
5.2. SWCC
5.3. Short-Term Measurements of the Soil Drying Rates by the Gravimetric Method following Heavy Rainfall Events at the Surface and Near-Surface of the DSWR Pile
5.4. Prediction of Evaporative Fluxes Using the SoilCover Model during and following Heavy Rainfall Events at the DSWR Pile
5.5. Comparison of SoilCover-Simulated Data with Eddy-Covariance-Measured Data during and following Heavy Rainfall Events at the DSWR Pile
6. Summary and Conclusions
Author Contributions
Funding
Data Availability Statement
Acknowledgments
Conflicts of Interest
References
- Carey, S.K.; Barbour, S.L.; Hendry, M.J. Evaporation from a waste-rock surface, Key Lake, Saskatchewan. Can. Geotech. J. 2005, 42, 1189–1199. [Google Scholar] [CrossRef]
- Kabwe, K.L.; Wilson, G.W.; Hendry, J. Effects of rainfall events on the surfaces of two waste-rock piles. Environ. Eng. Sci. 2005, 4, 469–480. [Google Scholar] [CrossRef]
- Meier, D.E.; Barbour, S.L. Monitoring of Cover and Watershed Performance for Soil Covers Placed over Saline-Sodic Shale Overburden from Oilsands Mining. In Proceedings of the National Meeting of the American Society of Mining and Reclamation, Lexington, KY, USA, 9–13 June 2002; ASMR: Lexington, KY, USA, 2002. [Google Scholar] [CrossRef]
- Shurniak, R.; Babour, S.L. Modeling of Water Movement Within Reclamation Covers on Oilsands Mining Overburden Piles. In Proceedings of the National Meeting of the American Society of Mining and Reclamation, Lexington, KY, USA, 9–13 June 2002. [Google Scholar] [CrossRef]
- Reedy, R.C.; Scanlon, B.R. Long-Term Water Balance Monitoring of Engineered Covers for Waste Containment. In Proceedings of the International Containment and Remediation Technology Conference, Orlando, FL, USA, 10–13 June 2001; Institute for International Cooperative Environmental Research, Florida State University: Tallahassee, FL, USA, 2002; p. 73. Available online: https://www.iicer.fsu.edu (accessed on 16 September 2023).
- Baalousha, H.M.; Ramasomanana, F.; Fahs, M.; Seers, T.D. Measuring and Validating the Actual Evaporation and Soil Moisture Dynamic in Arid Regions under Unirrigated Land Using Smart Field Lysimeters and Numerical Modeling. Water 2022, 14, 2787. [Google Scholar] [CrossRef]
- Rianna, G.; Reder, A.; Pagano, L. Estimating actual and potential bare soil evaporation from silty pyroclastic soils: Towards improved landslide prediction. J. Hydrol. 2018, 562, 193–209. [Google Scholar] [CrossRef]
- Lehmann, P. Surface evaporative capacitance: How soil type and rainfall characteristics affect global-scale surface evaporation. J. Water Resour. Res. 2019, 55, 519–539. [Google Scholar] [CrossRef]
- Scanlon, B.R.; Christman, M.; Reedy, R.C.; Gross, B. Intercode comparisons for simulating water balance in an engineered cover. In Proceedings of the 2001 International Containment and Remediation Technology Conference, Orlando, FL, USA, 10–13 June 2002; Institute for International Cooperative Environmental Research, Florida State University: Tallahassee, FL, USA, 2002; p. 148. [Google Scholar]
- Barbour, S.L.; Boese, C.; Stolte, B. Water balance for reclamation covers on oilsands mining overburden piles. In Proceedings of the Canadian Geotechnical Conference, Canadian Geotechnical Society, Calgary, AB, Canada, 16–19 September 2001; pp. 313–319. [Google Scholar]
- Capehart, W.J.; Carlson, T.N. Decoupling of surface and near-surface soil water content: A remote sensing perspective. J. Water Resour. Res. 1997, 33, 1383–1395. [Google Scholar] [CrossRef]
- Capehart, W.J.; Carlson, T.N. Estimating near-surface soil-moisture availability using a meteorologically driven soil water profile model. J. Hydrol. 1994, 160, 1–20. [Google Scholar] [CrossRef]
- Pabst, T.; Molson, J.; Bussière, B. Comparative performance of cover systems to prevent acid mine drainage from pre-oxidized tailings: A numerical hydro-geochemical assessment. J. Contam. Hydrol. 2017, 214, 39–53. [Google Scholar] [CrossRef]
- Albright, W.; Benson, C.; Apiwantragoon, P. Field Hydrology of Landfill Final Covers with Composite Barrier Layers. J. Geotech. Geoenviron. Eng. 2013, 139, 1–12. [Google Scholar] [CrossRef]
- Rahardjo, H.; Santoso, V.; Leong, E.; Ng, Y.; Hua, C. Performance of an Instrumented Slope Covered by a Capillary Barrier System. J. Geotech. Geoenviron. Eng. 2012, 138, 481–490. [Google Scholar] [CrossRef]
- Albright, W.H.; Apiwantragoon, P.; Shackelford, C.D.; Benson, C.H.; Bohnhoff, G.L.; Ogorzalek, A.S. Field Data and Model Predictions for a Monolithic Alternative Cover. ASCE 2008, 135, 1–16. [Google Scholar]
- Wilson, G.W. The application of cover systems for mine closure—Are we doing it right? In Proceedings of the 1st International Seminar on Mine Closure, Perth, WA, Australia, 13–15 September 2006; pp. 31–42. [Google Scholar]
- Aubertin, M.; Molson, J.; Bussiere, B.; Dagenais, A.M. Investigations of layered cover acting as oxygen barriers to limit acid mine drainage. In Proceedings of the 5th ICEG Environmental Geotechnics: Challenges and Responsibilities for Environmental Geotechnics, Cardiff, UK, 26–30 June 2006; Thomas, H.R., Ed.; Thomas Telford Publishing: London, UK, 2006; Volume 2, pp. 827–835. [Google Scholar]
- Aubertin, M.; Aachib, M.; Authier, K. Evaluation of diffusive flux through covers with a GCL. Geotext. Geomembr. 2000, 18, 215–233. [Google Scholar] [CrossRef]
- Wilson, G.W.; Fredlund, D.G.; Barbour, S.L. Couple soil-atmosphere modeling for soil evaporation. Can. Geotech. J. 1994, 31, 151–161. [Google Scholar] [CrossRef]
- Gray, D.M. Handbook on the Principle of Hydrology; Canadian National Committee for the International Hydrological Decade, NRC of Canada: Ottawa, ON, Canada, 1970. [Google Scholar]
- Dunkerley, D. Effects of rainfall intensity fluctuations on infiltration and runoff: Rainfall simulation on dryland soils, Fowlers Gap, Australia. Hydrol. Process. 2011, 26, 2211–2224. [Google Scholar] [CrossRef]
- Stone, J.J.; Paige, G.B.; Hawkins, R.H. Rainfall intensity-dependent infiltration rates on rangeland rainfall simulator plots. Trans. ASABE 2008, 51, 45–53. [Google Scholar] [CrossRef]
- Khan, J.; Ahmed, W.; Waseem, M.; Ali, W.; Rehman, I.u.; Islam, I.; Janjuhah, H.T.; Kontakiotis, G.; Bathrellos, G.D.; Skilodimou, H.D. Lowari Tunnel Water Quality Evaluation: Implications for Tunnel Support, Potable Water Supply, and Irrigation in Northwestern Himalayas, Pakistan. Appl. Sci. 2023, 13, 8895. [Google Scholar] [CrossRef]
- Chen, Z.; He, C.; Yang, W.; Guo, W.; Li, Z.; Xu, G. Impacts of geological conditions on instability causes and mechanical behavior of large-scale tunnels: A case study from the Sichuan–Tibet highway, China. Bull. Eng. Geol. Environ. 2020, 79, 3667–3688. [Google Scholar] [CrossRef]
- Holmøy, K.; Nilsen, B. Significance of geological parameters for predicting water inflow in hard rock tunnels. Rock Mech. Rock Eng. 2014, 47, 853–868. [Google Scholar] [CrossRef]
- Ff Vendrame, N.; Tezza, L.; Pitacco, A. Comparison of sensible heat fuxes by large aperture Scintillometry and Eddy covariance over two contrasting−climate vineyards. Agric. For. Meteorol. 2020, 288, 108002. [Google Scholar] [CrossRef]
- Penman, H.L. Natural evapotranspiration from open water, bare soil and grass. Proc. R. Soc. Lond. A 1948, 193, 120–146. [Google Scholar]
- SoilCover2000. SoilCover User’s Manual, Unsaturated Soils Group; Department of Civil Engineering, University of Saskatchewan: Saskatoon, SK, Canada, 2000. [Google Scholar]
- Kabwe, K.L.; Farrell, R.E.; Carey, S.K.; Hendry, M.J.; Wilson, G.W. Characterizing spatial and temporal variations in CO2 fluxes from ground surface using three complimentary measurement techniques. J. Hydrol. 2005, 311, 80–90. [Google Scholar] [CrossRef]
- Birkham, T.K.; Hendry, M.J.; Wassenaar, L.I.; Mendoza, C.A.; Lee, E.S. Characterizing geochemical reactions in unsaturated mine waste-rock piles using gaseous O2, CO2, 12CO2, and 13CO2. Environ. Sci. Technol. 2003, 37, 496–501. [Google Scholar] [CrossRef]
- Birkham, T.K. Characterizing Geochemical Reactions in Waste-Rock Piles at the Key Lake Mine using Gaseous Oxygen. Master’s Thesis, University of Saskatchewan, Saskatoon, SK, Canada, 2002. [Google Scholar]
- Kabwe, K.L. Measurements and modelling of gas fluxes in Unsaturated Mine Waste Materials. Ph.D. Thesis, University of British Columbia, Kelowna, BC, Canada, 2007. [Google Scholar]
- Lee, E.S.; Birkham, T.K.; Wassenaar, L.I.; Hendry, M.J. Microbial respiration and diffusive transport of O2, 16O2, and 18O2 in unsaturated soils and geologic sediments. Environ. Sci. Technol. 2003, 37, 2913–2919. [Google Scholar] [CrossRef]
- ASTM D422-63(2007); Standard Test Method for Particle-Size Analysis of Soils. ASTM Standard; ASTM International: West Conshohocken, PA, USA, 1963. [CrossRef]
- ASTM D6836-02 2008; Standard Test Methods for Determination of the Soil Water Characteristic Curve. ASTM: West Conshohocken, PA, USA, 2008. [CrossRef]
- Fredlund, D.G.; Rahardjo, H. Soil Mechanics for Unsaturated Soils; John Wiley & Sons, Inc.: New York, NY, USA, 1993. [Google Scholar]
- ASTM D2216-19; Standard Test Methods for Laboratory Determination of Water (Moisture) Content of Soil and Rock. ASTM: West Conshohocken, PA, USA, 2017. [CrossRef]
- Noel, M.M.; Rykaart, E.M. Comparative Study of Surface Flux Boundary Models to Design Soil Covers for Mine Waste Facilities. In Proceedings of the 6th International Conference on Acid Rock Drainage (ICARD), Cairns, QLD, Australia, 12–18 July 2003. [Google Scholar]
- Bambach, N.; Kustas, W.; Alferi, J.; Prueger, J.; Hipps, L.; McKee, L.; Castro, S.J.; Volk, J.; Alsina, M.M.; McElrone, A.J. Evapotranspiration uncertainty at micrometeorological scales: The impact of the eddy covariance energy imbalance and correction methods. Irrig. Sci. 2002, 40, 445–461. [Google Scholar] [CrossRef]
- Mauder, M.; Cuntz, M.; Drüe, C.; Graf, A.; Rebmann, C.; Schmid, H.P.; Schmidt, M.; Steinbrecher, R. A strategy for quality and uncertainty assessment of long-term eddy-covariance measurements. Agric. For. Meteorol. 2013, 169, 122–135. [Google Scholar] [CrossRef]
- Wilson, K.; Goldstein, A.; Falge, E.; Aubinet, M.; Baldocchi, D.; Berbigier, P.; Bernhofer, C.; Ceulemans, R.; Dolman, H.; Field, C.; et al. Energy balance closure at FLUXNET sites. Agric. For. Meteorol. 2002, 113, 223–243. [Google Scholar] [CrossRef]
- Leuning, R. The correct form of the Webb, Pearman and Leuning equation for eddy fluxes of trace gases in steady and non-steady state, horizontally homogeneous flows. Bound. Layer Meteorol. 2007, 123, 263–267. [Google Scholar] [CrossRef]
- Webb, E.K.; Pearman, G.I.; Leuning, R. Correction of flux measurements for density effects due to heat and water vapour transfer. Q. J. R. Meteorol. Soc. 1980, 106, 85–100. [Google Scholar] [CrossRef]
- Noll, A.D.; Bergstresser, T.W.; Timothy, W.B.; Woodcock, J. Overburden Sampling and Testing Manual; Earthteih and Geochemical Testing Divisions of Energy Center Inc. Contract No. ME 86120; Commonwealth of Pennsyvania, Department of Environmental Resources Bureau of Mining and Reclamation: Harrisburg, PA, USA, 1998. [Google Scholar]
- Handbook for Waste Rock Sampling Techniques. Energy Mines and Resources; CANMET—MSL Division (MEND Project 4.5.1); SENES Consultants Ltd.: Richmond Hill, ON, Canada, 1994. [Google Scholar]
- Kathleen, S.S.; Hageman, P.L.; Ramsey, C.A.; Wildeman, T.R.; Ranville, J.F. Reconnaissance Sampling and Characterization of Mine-Waste Material. In Proceedings of the U.S. EPA Hard Rock Mining 2006 Conference, Tucson, AZ, USA, 14–16 November 2006. [Google Scholar]
- Barbour, S.L. 1998. Nineteenth Canadian Geotechnical Colloquium: The soil-water characteristic curve: A historical perspective. Can. Geotech. J. 1998, 35, 873–894. [Google Scholar] [CrossRef]
- Fredlund, D.G.; Xing, A. Equations for the soil-water characteristic curve. Can. Geotech. J. 1994, 31, 521–532. [Google Scholar] [CrossRef]
- Ronald, B.; Lauren, F. Uncertainty of Soil Water Characteristic Curve Measurements Using an Automated Evaporation Technique. Vadose Zone J. 2017, 16, 1–11. [Google Scholar] [CrossRef]
- Shokrana, M.S.B.; Ghane, E. Measurement of soil water characteristic curve using HYPROP2. MethodsX 2020, 7, 100840. Available online: www.elsevier.com/locate (accessed on 16 September 2023). [CrossRef] [PubMed]
- Schindle, U.; Durner, W.; von Unold, G.; Mueller, I. Evaporation methods for measuring unsaturated hydraulic properties of soils: Extending the measurement range. Soil Sci. Soc. Am. J. 2010, 74, 1071–1083. [Google Scholar] [CrossRef]
- Peters, A.; Durner, W. Simplified evaporation method for determining soil hydraulic properties. J. Hydrol. 2008, 356, 147–162. [Google Scholar] [CrossRef]
- Hillel, D. Applications of Soil Physics; Academic Press, Inc.: New York, NY, USA, 1980. [Google Scholar]


| Day | Rainfall | Temp. | RH | Radiation | Wind Speed |
|---|---|---|---|---|---|
| # | (mm) | (°C) | (%) | (W/m2) | (m/s) |
| 1 | 39.2 | 13.1 | 84.2 | 21.8 | 5.7 |
| 2 | 36.6 | 11.2 | 95.2 | 31.4 | 6.2 |
| 3 | 7 | 12.1 | 91.5 | 58.7 | 6.0 |
| 4 | 1 | 8.1 | 82.9 | 44.6 | 8.5 |
| 5 | 0.4 | 7.4 | 81.3 | 66.1 | 7.3 |
| 6 | 0 | 10.0 | 71.7 | 50.6 | 5.7 |
| 7 | 0 | 12.5 | 66.8 | 50.9 | 3.1 |
| 8 | 0 | 14.6 | 71.3 | 61.3 | 5.0 |
Disclaimer/Publisher’s Note: The statements, opinions and data contained in all publications are solely those of the individual author(s) and contributor(s) and not of MDPI and/or the editor(s). MDPI and/or the editor(s) disclaim responsibility for any injury to people or property resulting from any ideas, methods, instructions or products referred to in the content. |
© 2023 by the authors. Licensee MDPI, Basel, Switzerland. This article is an open access article distributed under the terms and conditions of the Creative Commons Attribution (CC BY) license (https://creativecommons.org/licenses/by/4.0/).
Share and Cite
Kabwe, L.K.; Wilson, W.G. Short-Term Predictions of Evaporation Using SoilCover at the Near-Surface of a Mine Waste Pile following Heavy Rainfall Events. Geotechnics 2023, 3, 1180-1195. https://doi.org/10.3390/geotechnics3040064
Kabwe LK, Wilson WG. Short-Term Predictions of Evaporation Using SoilCover at the Near-Surface of a Mine Waste Pile following Heavy Rainfall Events. Geotechnics. 2023; 3(4):1180-1195. https://doi.org/10.3390/geotechnics3040064
Chicago/Turabian StyleKabwe, Louis Katele, and Ward Gordon Wilson. 2023. "Short-Term Predictions of Evaporation Using SoilCover at the Near-Surface of a Mine Waste Pile following Heavy Rainfall Events" Geotechnics 3, no. 4: 1180-1195. https://doi.org/10.3390/geotechnics3040064
APA StyleKabwe, L. K., & Wilson, W. G. (2023). Short-Term Predictions of Evaporation Using SoilCover at the Near-Surface of a Mine Waste Pile following Heavy Rainfall Events. Geotechnics, 3(4), 1180-1195. https://doi.org/10.3390/geotechnics3040064