Article

Numerical Modelling and Investigation of the Impact Behaviour of Single Guardrail Posts

Chair of Soil Mechanics and Foundation Engineering, Rock Mechanics and Tunnelling, School of Engineering and Design, Technical University of Munich, 81245 Munich, Germany
*
Author to whom correspondence should be addressed.
Geotechnics 2023, 3(4), 1135-1161; https://doi.org/10.3390/geotechnics3040062
Submission received: 6 October 2023 / Revised: 20 October 2023 / Accepted: 26 October 2023 / Published: 30 October 2023
(This article belongs to the Special Issue Recent Advances in Geotechnical Engineering (2nd Edition))

Abstract

:
Vehicle restraint systems are vital hardware elements in road safety engineering. The certification process of a vehicle restraint system includes full-scale crash tests, component testing and numerical simulation of these tests. To achieve reliable crash test simulation results, the soil–post interaction must be modelled to capture the behaviour realistically. There is no standardised approach for modelling the soil–post interaction in the praxis. In this study, the finite element method is utilised to investigate the soil–post response under quasi-static and dynamic impact loading. Two different modelling techniques are applied for this purpose. The first technique is the finite element continuum method, with the soil modelled using the advanced hypoplastic constitutive relation and calibrated using laboratory test data. The second technique is a lumped-parameter model, for which a systematic parameters calibration routine using basic soil properties is introduced. The numerical models are validated using a series of full-scale field tests performed by the authors on single posts in standard road shoulder materials. The performance comparison of the investigated modelling techniques shows that the hypoplastic constitutive relation can capture the post behaviour realistically under different loading conditions using the same parameter set. The introduced lumped-parameter model adequately simulates the post behaviour with high computational efficiency, which is very important when simulating several posts. The conducted parametric study elucidates that the soil’s relative density, the post’s embedment length, and the post-section modulus govern the single post’s lateral load-bearing behaviour and energy dissipation capacity.

1. Introduction

With the fast-paced development of computer processors today, numerical simulations are becoming increasingly significant in the field of safety hardware crashworthiness. However, the computational efficiency is not the only decisive factor for a realistic simulation. The numerical method, the selection of suitable material models, the calibration of the model parameters and the definition of the interaction between the different elements are all factors that govern the simulation results. In this study, we focus on modelling the soil–structure interaction of the single guardrail post. The post response is analysed using the finite element (FE) method under quasi-static and impact loads. To the author’s best knowledge, the hypoplastic constitutive soil model is introduced for the first time to model this boundary value problem. The advantage of modelling the granular soil behaviour using hypoplasticity is that it captures the soil non-linearity and stress-dependency of the material stiffness and shear strength, whereas no explicit distinction between elastic and plastic deformations is required [1]. Moreover, the material parameters can be calibrated using a straightforward routine from laboratory tests, and the initial state variables can be set to reflect the soil conditions in situ.
The soil–post interaction can be modelled in crash test simulations using different techniques. Considering the FE method, the soil can be modelled using continuum elements or as discrete rheological elements, e.g., using springs, dashpots and sliders. Based on the model purpose, the post can be modelled either using beam elements or shell elements resembling the section geometry.
In its simplest form, the soil and post can be modelled as a two-dimensional beam fully fixed at a predefined depth. This approach was adopted by RAY and PATZNER [2] for the simulation of vehicle restraint system (VRS) posts under collision. In this case, only the post deflection is captured, and the irreversible soil deformation due to eventual post rotation is neglected. This assumption overestimates the soil–post stiffness in dense and medium dense soils, since the failure mode is a combination of post rotation and lateral displacement, as proven experimentally by SOLIMAN et al. [3].
To simulate the system response more accurately, the soil–post interaction can be modelled as a beam supported by an array of discrete non-linear springs in the lateral direction, i.e., the Winkler model. This approach was utilised by PLAXICO et al. [4] in an FE model to simulate single wooden posts embedded in soil under impact loading. The spring coefficients were estimated as a function of the effective overburden pressure and the lateral deflection, according to HABIBAGAHI and LANGER [5]. However, this approach requires extensive calibration since it incorporates a lateral bearing capacity factor N q , which is determined empirically from static pile loading test data. The method was extrapolated by PLAXICO et al. beyond the test data to account for large deformations without experimental evidence. Moreover, the horizontal subgrade moduli were assumed independent of the loading type, whether static or dynamic, which ignores the influence of the mass inertia.
The approach was further developed by SASSI and GHRIB [6] to consider the inertial effects and damping of the soil under impact loading. The uncoupled non-linear spring’s array was extended with parallel dashpots and mass points to form a lumped-parameter model (LPM). For the calibration of the LPM parameters, an FE continuum model was created and validated using test data of the impact loading on a steel post conducted by COON et al. [7]. The lumped mass was determined from the FE model in each depth increment based on an assumed threshold displacement of 2 mm. The soil damping was considered using an array of uncoupled dashpots, and the damping coefficient was determined through back-analysis, and calibration to the field test data. They concluded that the lumped mass mobilised in the impact is depth-dependent, and that a gap has to be introduced in the model between the post and the springs to account for the installation effects of the post [6]. In a further study utilising the same model, they found that the maximum reaction force and deflection increase linearly with the impactor velocity. The peak force was found to be directly proportional to the soil density [8]. Despite the computational efficiency of this LPM, an FE model, as well as experimental data, are required to calibrate the model parameters. Furthermore, the LPM parameters were calibrated to a single test with a particular impact energy. The model parameters may vary, if the model is calibrated to a field test with a different impact intensity.
ASSADOLLAHI and BRIAUD [9] developed a simple soil–structure interaction model for the analysis of in-line post barriers under vehicle collision. The single posts are modelled using a single degree of freedom model (SDOF) connected together by a horizontal beam. The model’s main purpose is to estimate the dynamic penetration of the barrier under impact. The SDOF model incorporates a spring, a dashpot and a slider to simulate the soil stiffness, damping and irreversible soil deformations, respectively. The mass of the pile and the activated soil wedge under impact are modelled together in a lumped mass. The model parameters are derived from pressuremeter test results based on an approach developed by BRIAUD [10]. The model is found to deliver acceptable results compared with the full-scale tests. However, the plastic yielding and strain-rate dependency of the post and beam material are not included in the model. This feature limits the model application for guardrail posts, since these are much more vulnerable to plastic deformations under collision.
Many researchers utilised the FE continuum method to model the soil–post interaction. The most common constitutive soil models used for this purpose are those available in the FE code LS-DYNA [11] (e.g., the Drucker–Prager model as applied by BLIGH et al. [12], the Soil and Concrete model as applied by WU and THOMSON [13], and the FHWA soil model as applied by WOO et al. [14]). These models are mainly elasto-plastic constitutive relations with additional selected features. For example, the FHWA soil model incorporates material strain hardening, strain softening and strain-rate dependency.
Further modelling techniques that can be applied to model the soil–post interaction include the Arbitrary Lagrangian–Eulerian method (ALE), the Discrete Element Modelling (DEM) and Smoothed Particle Hydrodynamics (SPH), as well as the Applied Element Method (AEM), utilised for progressive failure analysis. Machine learning can be used as a tool for the calibration of the material parameters required in the aforementioned approaches. WOO et al. [14] employed a hybrid method combining the three-dimensional FE method (FEM) and the meshless SPH to model posts near embankment slopes. The purpose of the SPH elements is to overcome the numerical problems due to excessive mesh distortions in soil elements generated by the large post deflections. The SPH particles are defined only in the post vicinity. The FE continuum elements and SPH nodes’ constitutive behaviour are modelled using the FHWA soil model with assumed soil parameters. The results were compared only to quasi-static test results since no impact tests were conducted. Compared with an exclusively FE continuum model, this hybrid approach shows lower post resistance compared with the experimental data. This can be attributed to the assumed soil parameters. However, this approach seems to be efficient for modelling posts close to slopes, where the FEM suffers numerical instabilities.
The review of the different approaches for simulating the soil–post response shows that there is no standard modelling method for guardrail posts under lateral collision. The discussed approaches apply adjustment factors, which are calibrated either using FE models or experimental data. This feature limits the application of these methods to the test conditions of the data used for calibration. Applying these models to simulate cases beyond the calibration data conditions can be misleading. Therefore, further research is required in this field, with a particular focus on correlating the model parameters to the soil characteristics to achieve a model independent of the loading rate.

2. Methodology

The purpose of this study is to model and analyse the behaviour of single guardrail posts embedded in soil under different lateral loading conditions. To investigate the soil–post interaction, several FE continuum models were developed to simulate the soil and post response. A practical modelling technique is proposed to account for the large post deflections and the installation effects. The soil behaviour is simulated using the advanced hypoplastic constitutive material model. The steel material is modelled using a strain-rate-dependent constitutive relation. The parameters of both models were calibrated using laboratory test results. The FE models were validated using experimental full-scale field test data. The field tests were conducted by the authors on single posts embedded in a standard road shoulder material under quasi-static and impact loading [3].
In the next step, the validated FE model was used to perform a parametric study to investigate the influence of selected factors on the post response: soil relative density, post embedment length and section modulus. These factors were found to govern the post failure mode and the post response in the field tests [3]. The results of the parametric study are summarised and interpreted to understand the impact behaviour of a single post. The influence of the investigated factors on the post response is then assessed in terms of the generated impact force and the energy dissipation capacity.
The outcomes of the experimental and numerical investigations are combined to develop a simplified simulation approach using a lumped-parameter model. A parameter calibration routine depending on the soil and post characteristics is proposed. The performance of the FE continuum model and the LPM is compared with the experimental data. Based on the investigation findings, recommendations are formulated for the numerical modelling of the soil–post interaction in crash test simulations.

3. Finite Element Model

The numerical simulations were performed with the finite element code ABAQUS v2017 [15] developed by DESSAULT SYSTEMS using the implicit solver for both quasi-static and impact simulations. Since the soil is modelled using a user-defined material model subroutine “umat” running only under the Abaqus/Standard, the analysis had to be conducted using the implicit solver. Compared with the explicit dynamic analysis, the implicit method is more computationally intensive and requires more memory, due to the need to solve the system of non-linear equations at each time step. However, dynamic implicit analysis can be more efficient for problems with very stiff or fast dynamics, where the time step size used in the explicit analysis has to be very small in order to maintain stability and accuracy. In these cases, dynamic implicit analysis can handle larger time steps and provides a more computationally efficient solution [15].

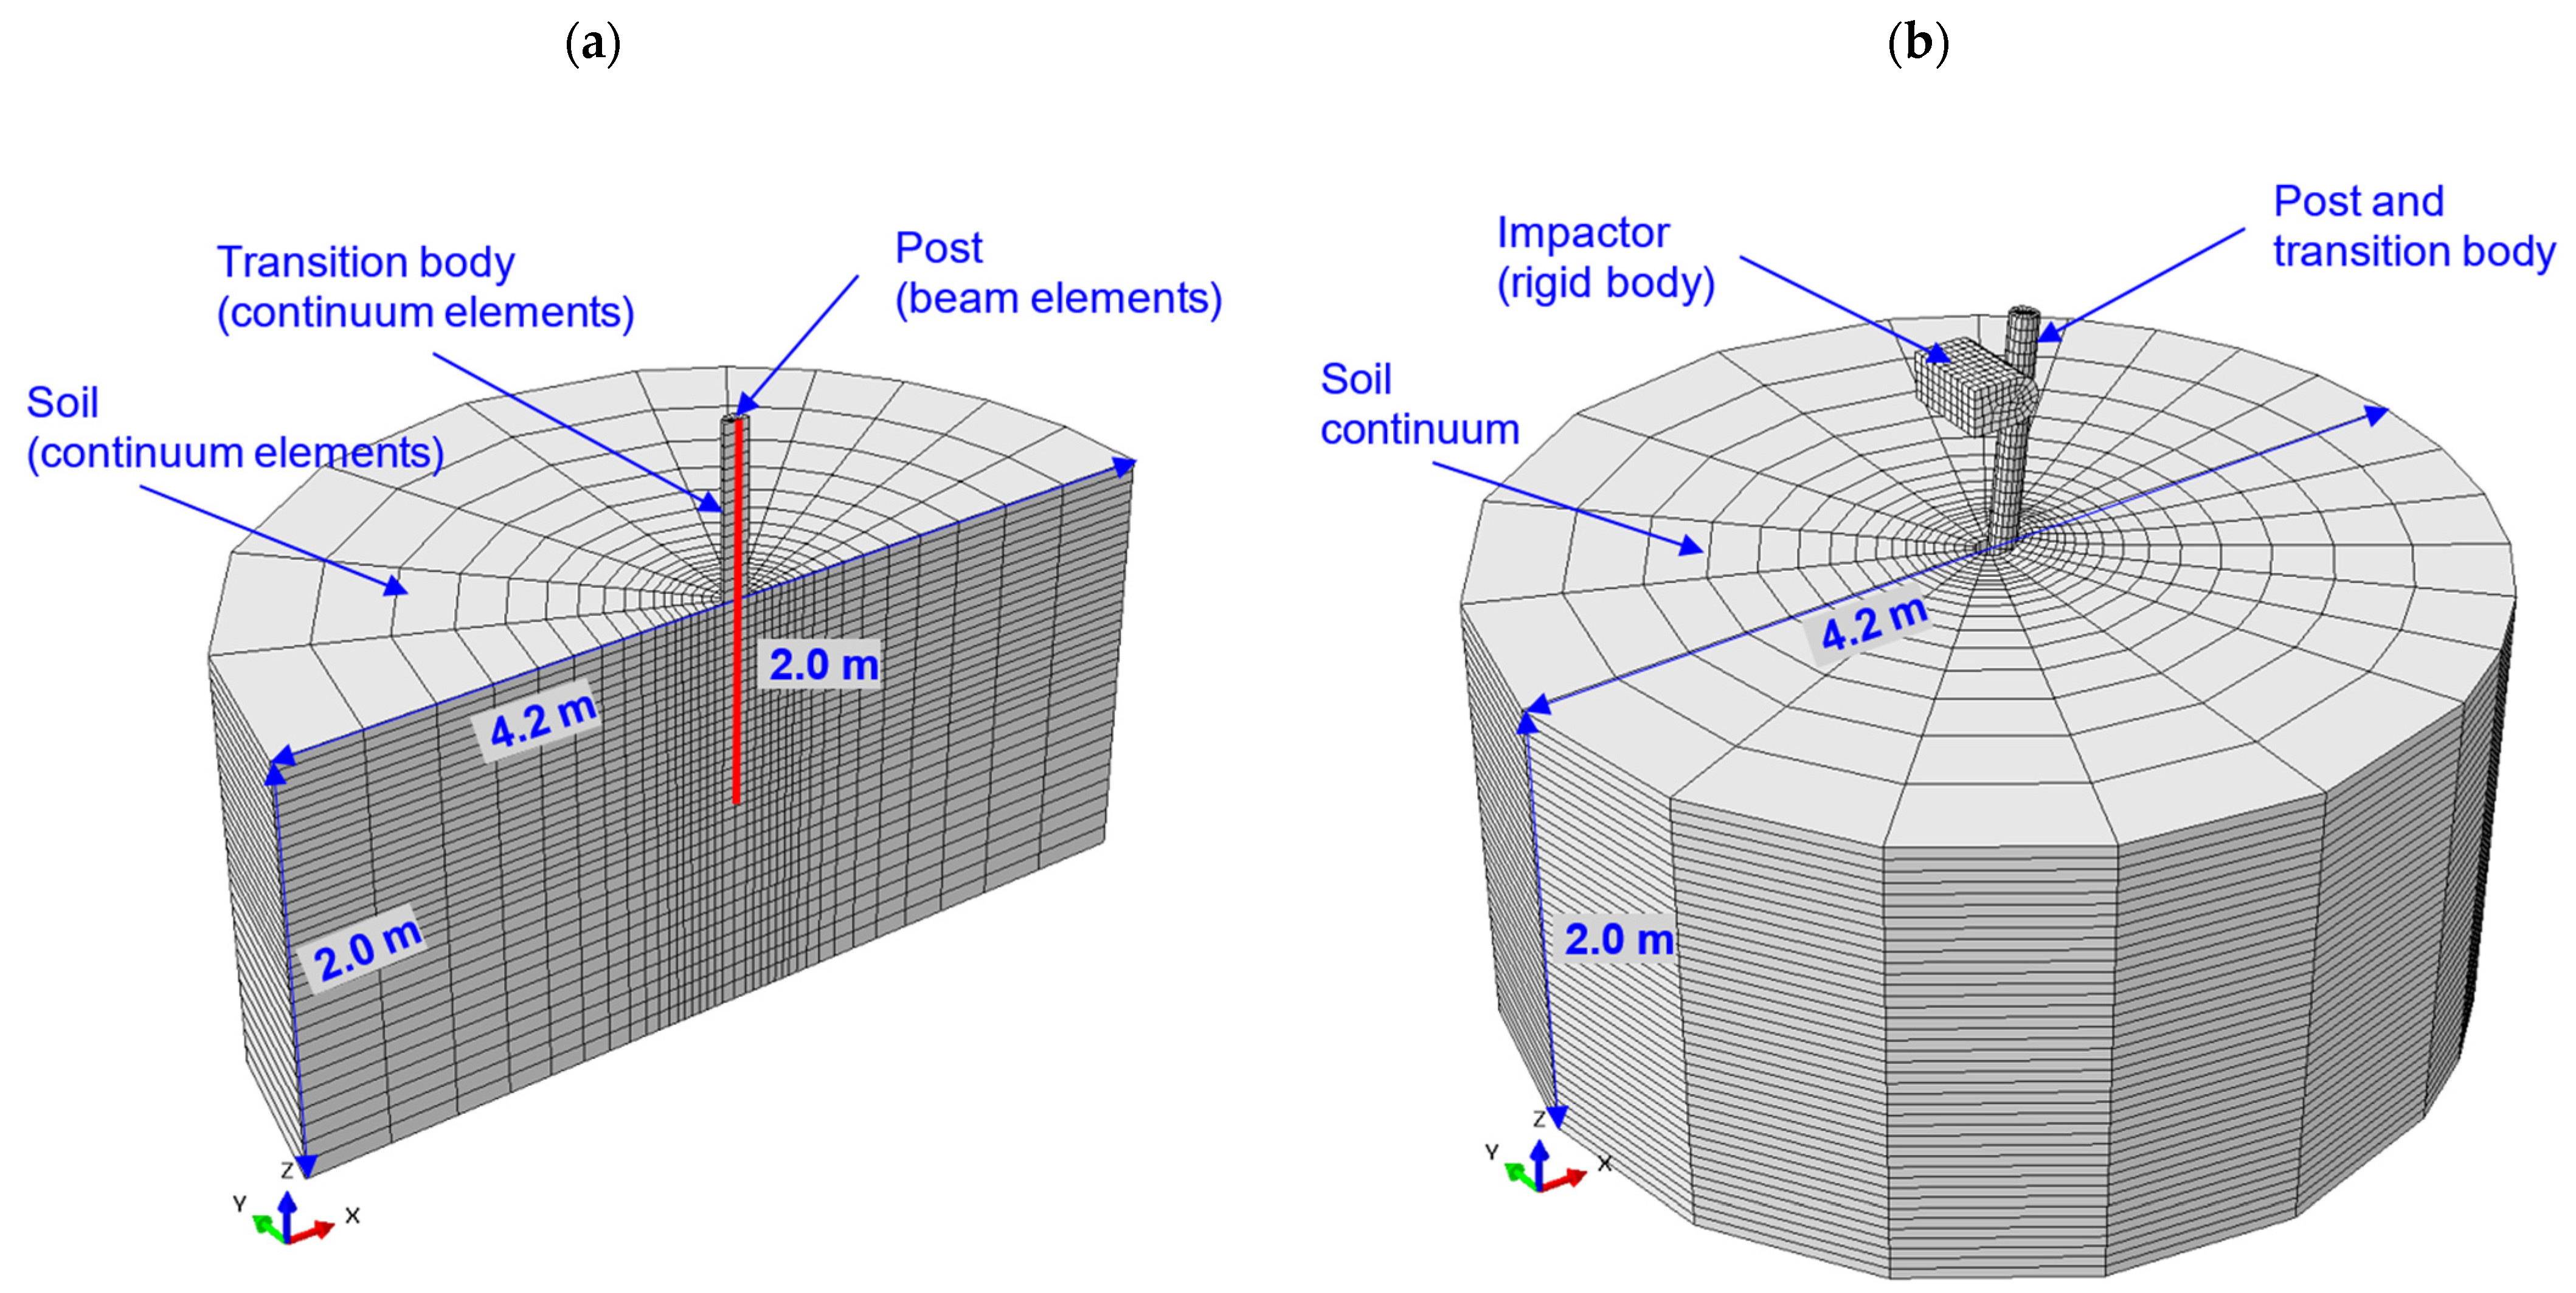
3.1. Model Geometry and Boundary Conditions

To simulate the quasi-static loading test, a three-dimensional FE model was created with a symmetry plane parallel to the loading direction. The geometry of the FE model and the mesh discretisation are shown in Figure 1. The model consists of three main parts: the post modelled as a beam, the soil block and the transition elements around the post. The soil block is modelled as a cylindrical volume with a height of 2.0 m and a diameter of 4.2 m. The model radius corresponds to the common spacing between the posts in a VRS. The discretisation of the soil is performed with the first-order C3D8 and C3D6 continuum elements with full integration. First-order solid elements are recommended for problems involving impact or severe element distortions [15]. Full-integration elements are chosen to avoid hourglassing problems under dynamic loading [15]. The soil block is divided into several coaxial zones with finer mesh in the post vicinity and coarser in the outwards direction.
The post is modelled, using B31 beam elements, as a simplified Timoshenko beam. The stiffness and strength properties are assigned to the beam element, which fully represents the cross-sectional properties of the post. The integration points in the cross-section allow for the calculation of the stress distribution and straining actions in the beam’s local axes. The beam elements are fully embedded in a cylindrical transition body consisting of C3D6 continuum elements. The nodes of the transition elements are coupled with the nodes of the beam elements in the post axis. The transition elements are defined to avoid the numerical stress concentrations and mesh distortions in the vicinity of the profile edges. The diameter of the transition body is set equal to an equivalent circle exhibiting a circumference equal to the outer perimeter of the post-section.
The transition elements along the embedment are modelled as linear-elastic and exhibit the soil stiffness properties in the unloading–reloading phase. In the quasi-static test simulation, the transition body elements are assigned a modulus of elasticity corresponding to the experimentally determined stiffness modulus of the soil for unloading–reloading at a mean stress level of 25 to 50 kPa ( E t r a n s i t i o n = 75   MPa ). This value was multiplied in the dynamic model by a factor of 15 to simulate the dynamic stiffness of the soil material. The ratio of the dynamic to static stiffness modulus E s   d y n E s was investigated experimentally by WICHTMANN and TRIANTAFYLLIDIS [16] for gravelly well-graded sand, and was determined to be between 10 and 20 for a stiffness range between 10 and 20 MPa. The transition elements above the ground level are modelled weightless. In the dynamic impact model, the transition elements above the ground level were assigned properties of rubber material to simulate the front tyre piece of the impactor. The impactor was modelled as a rigid body consisting of C3D8 continuum elements.
A contact surface is defined between the transition elements and the surrounding soil elements. In the tangential direction, a node-to-surface contact formulation with a friction coefficient of μ = t a n   φ c o n t a c t = 0.07 in the quasi-static simulation was applied. This value corresponds to a contact friction angle between steel and soil of approximately 10% of the internal soil friction angle. The tangential friction was increased to 33% in the dynamic model to prevent the post from oscillating after unloading inside the gap formed behind the post. In the direction normal to the transition elements, a contact with an exponential “pressure-overclosure” relationship was defined for both loading cases. This contact formulation allows for pressure transmission between surfaces once a predefined clearance value is reached. Then, the contact pressure increases exponentially by decreasing the clearance [15]. The clearance value was set to a low value of c 0 = 10 2   mm to model the posts installed by full soil displacement. Applying the transition elements around the post in combination with the contact surface allows for a significantly stable numerical solution under large deformations.
All degrees of freedom are constrained at the lower model boundary. In the quasi-static model, the displacements normal to the symmetry plane are fixed to resemble conducting the test using a guidance frame. Since the posts were unguided in the dynamic field tests, this boundary condition is released in the dynamic model to allow for eventual deflections in the plane orthogonal to the impact direction. To avoid tension stresses in the top surface elements of the soil block, a uniform surcharge load of 0.5 to 1.0 kN/m2 was applied. In the contact surface between the transition elements and the ground, a radial surface pressure of 0.5 kN/m2 was defined to model the supporting force of the apparent cohesion during gap opening behind the post, and thus improving the numerical convergence.
The horizontal stresses in the soil are calculated at the beginning of the simulation with an earth pressure coefficient at-rest of K 0 * = 1.1 . This value, which is higher than the common geotechnical practice ( K 0 = 1 s i n   φ     0.5 ), accounts for the compaction pressure in the shallow road-shoulder material layer. The additional horizontal pressure due to compaction is calculated as per DIN 4085 [17], depending on the type of compaction equipment and backfill area. The earth pressure coefficient over depth is then calculated as an equivalent out of the earth pressure at-rest K 0 and the lateral compaction pressure as per DIN 4085, acting on the excavation sides in the shallow depth.

3.2. Calculation Phases

In the first calculation step, the initial stress state was calculated under the materials’ own weight and surcharge loads. The installation phase of the post was not simulated explicitly. The installation effects were considered indirectly by increasing the stiffness modulus of the transition elements compared with the surrounding soil block to simulate a reloading phase of the soil. Moreover, the lateral earth pressure coefficient was adapted as described earlier to consider the compaction pressure. Further, the contact clearance in the interface was set to a low value to allow for full contact force transmission starting from the very beginning of loading.
In the quasi-static test simulation, a second step is defined, in which a prescribed horizontal displacement of 400 mm is applied at 75 cm above ground level. This height corresponds to the load application point during the in situ tests. In the dynamic test simulation, the impactor was accelerated to an initial velocity and then set free on a horizontal path to hit the post at the height of 75 cm above ground level. The impactor is allowed to collide with the post and recoil freely afterwards.
To include the large-deformation effects in the model, the non-linear geometry option is activated in all calculation steps. The duration of the initial time step was set in the dynamic analysis after a convergence study to 0.1 ms, to ensure satisfying accuracy and resolution of the results.

3.3. Material Models and Parameters Calibration

The simulation of the guardrail post behaviour requires the consideration of certain interaction mechanisms and soil features. The experimental field tests show non-linear load-deflection curves, which give an indication of the non-linearity of the soil response. No explicit transition was observed between the reversible and irreversible deformation phases. Under impact loading, the reaction force increased significantly due to the soil and post mass inertia and damping. Large deformations and soil heave in front of the post were observed under both loading conditions. The soil was observed to reach the limit state after a certain deflection range. The steel section showed plastic deformations after reaching the yield stress. However, the yield strength seemed to increase under dynamic loading, since the posts did not yield under the higher forces applied in the impact tests. The tyre material between the impactor and the post was able to dampen the high frequency amplitudes due to impact. Based on these observations from the experimental field tests, the suitable constitutive model for each material was chosen.

3.3.1. Hypoplastic Soil Model

The hypoplastic constitutive material model developed by VON WOLFFERSDORF [18] was used for modelling the soil in the static and dynamic tests. The advanced hypoplastic model is capable of simulating the non-elastic behaviour as well as the non-linear stress–strain response of granular soils efficiently. It captures the main characteristics of soil behaviour such as contraction and dilation, the critical state, the dependency of both stiffness and shear strength on the stress state and the relative density [1]. With the extension of the model with the intergranular strain properties introduced by NIEMUNIS and HERLE [19], the material stiffness is adjusted for first loading and unloading–reloading phases. Moreover, the intergranular strain properties capture the hysteretic material behaviour and the accumulative effects under cyclic loading. Compared with the common constitutive soil models, no distinction is drawn between elastic and plastic strains. Moreover, the rate formulation of the stress–strain behaviour implemented in the model makes it numerically more stable despite the consideration of material non-linear behaviour [1]. The constitutive equation is written as a tensor-valued function. The hypoplastic relation can be abbreviated as follows:
σ ˙ = H ( σ , e ,   ε ˙ ,   δ )
where σ ˙ , ε ˙ and δ are the stress-rate tensor, the strain-rate tensor and the intergranular strain tensor, respectively. Depending on the present stress state σ and void ratio of the soil e , the hypoplastic relation is capable of simulating the soil compaction and dilatancy realistically. The hypoplastic user-defined subroutine developed by NIEMUNIS (version 2003) for implicit analysis was used for the simulations.
The model parameters are subdivided into material parameters and state variables (see Table 1). The material parameters include the critical state friction angle φ c , the maximum and minimum void ratio, the pycnometric α and barometric β exponents and the granulate hardness h s . The state variables include the void ratio, the effective stress and the intergranular strain. The material model parameters were calibrated using the data from the laboratory tests conducted on specimens of the tested road-shoulder material, crushed limestone (KSS032). The parameter calibration procedure proposed by HERLE and GUDEHUS [20] and the recommendations of WICHTMANN [21] were followed. The initial critical void ratio e c 0 , defining the density of the soil specimen in the critical state under zero pressure, was identified using the standard test as per DIN 18126 [22]. The upper bound void ratio e i 0 was estimated as recommended by WICHTMANN [21] by the factor 1.15 × e c 0 . The initial minimum void ratio e d 0 , which defines the lower bound, was identified from the standard proctor test as per DIN 18127 [23]. The dependency of the void ratio on the mean pressure is described by the equation from BAUER [20] as follows:
e i e i 0 = e c e c 0 = e d e d 0 = exp [ ( 3 p s h s ) n ]
The parameters h s and n , which control the shape of the limiting void ratio curves, were assessed by means of curve fitting to large oedometer test data. Two oedometer tests were conducted on very dense specimens ( I D     95 % ) and two oedometer tests were conducted on loose specimens ( I D     32 % ). Due to the relatively large grain size of the tested specimens (D = 300 mm and H = 140–160 mm), the tests were executed using a specially manufactured “Large oedometer” apparatus for granular material specimens (cell diameter/height = 300/200 mm). For the very dense, as well as for the loose specimens, the oedometric stress–strain behaviour could be well reproduced with the calibrated parameters as shown in Figure 2.
To determine the pycnometry exponent α , two series of consolidated drained triaxial compression tests were executed acc. to DIN EN ISO 17892-9 [24] on very dense ( I D     98 % ) and loose ( I D     28 % ) specimens (see Figure 3). The exponent α , which controls the dependency of the peak friction angle and dilatancy on the relative soil density, was calculated using the set of equations given by WICHTMANN [21]. The equations incorporate the peak deviator stress q p and void ratio e p at the specimen’s mean pressure at failure p p from the experimental data of the specimen in the dense and loose states. The barometry exponent β controls the influence of the relative density and mean pressure on the soil stiffness. This exponent was derived from the comparison of the oedometric stiffness of the specimens in the dense and loose state. The equations followed for the calibration of   α and β are described in detail in the manuscript by WICHTMANN [21].
The hypoplastic relationship is extended using the intergranular strain (IGS) parameters to account for the change in stiffness due to the change in the loading path. A change in the deformation direction, e.g., unloading after monotonic loading, leads to an increase in stiffness in granular soils [20]. The model parameters controlling the IGS feature ( R ,   m T ,   m R ,   β r   and   χ ) can be determined from dynamic laboratory tests on soil samples, e.g., resonant column or cyclic shear tests. The elastic strain range, defined by the parameter R , considers the small strain response of the soil. The stiffness ratio after a change in loading direction by 90° and 180° is defined by m T and m R , respectively. The exponents β r and χ are the parameters controlling the evolution equation of the IGS tensor. The IGS parameters were assumed in the range given by MAŠÍN [1] for comparable soils and by curve fitting to the test data. The ratio m R / m T is set to 2.0 as recommended by WICHTMANN [21].
Since the critical state couldn’t be reached in the triaxial tests, the critical state friction angle φ c was estimated as a mean value from several angle of repose tests. Due to the large grain size of the material, the tests were conducted using a special setup consisting of a pipe segment (D = 0.4 m, L = 1.2 m) lifted up by a crane on specimens’ weighing ca. 200 kg.
The simulation of the deviatoric stress ( q = σ 1 σ 3 ) over axial strain ε 1 shows a good agreement with the measured values up to the peak stress (see Figure 3a). With the further increase in the axial strain beyond the peak stress, a softer behaviour is observed and the deviatoric stress is slightly underestimated. This deviation is not decisive for the simulations since the prevailing overburden stresses in the post embedded zone do not exceed 25 kPa. The volumetric strain simulation for both specimens shows a deviation of a maximum of 20% from the measured values. A higher deviation was reported by WICHTMANN [21] for the “Karlsruher Sand”, which was described as acceptable.
The relative density of the soil in situ is defined in the material model through the initial void ratio e 0 . This value was determined from the in situ tests carried out to determine the dry soil density ρ d using the nuclear densometer [3]. The calibrated hypoplastic model parameters are summarised in Table 1.

3.3.2. Steel and Rubber Material Models

The steel post was modelled using an elasto-plastic material model with isotropic hardening. The yield stress and the stress–strain behaviour of the material were calibrated to tensile tests conducted by TÜV-SÜD on specimens from the post material. The true stress–strain curves of the post material required for the numerical simulation were derived from the experimental, i.e., nominal stress–strain curves. The elastic modulus and the Poisson’s ratio of the steel material were assumed in the typical range for steel (see Table 2). Many studies confirmed that the steel yield strength increases with increasing strain-rate. The yield stress of guardrail steel can increase up to two-fold under impact loading, i.e., a high strain-rate, compared with the quasi-static value, as proven by WRIGHT and RAY [25]. The power function suggested by COWPER and SYMONDS describes the relation between the yield stress and the strain-rate [26]:
R = 1 + ( ε ˙ D ) 1 n
where R = f y   d y n / f y   s t a t is the yield stress ratio (dynamic to quasi-static), ε ˙ is the strain-rate and D and n are the material constants of the constitutive model. The COWPER-SYMONDS model was used to simulate the strain-rate dependency of the steel post under impact loading. The values of the coefficients D and n were adopted as recommended by COWPER and SYMONDS for mild steel (see Table 2). These values have been applied by WRIGHT and RAY [25] for the simulation of steel guardrail posts and have shown a good agreement with the experimental data.
In the dynamic model, the transition elements around the beam above the ground level were modelled as rubber tyre material. Rubberlike solids are modelled in the practice as hyperelastic materials, e.g., using OGDEN’s 1973 material model. Since no experimental tests have been conducted on the tyre piece covering the impactor, the material was modelled as a non-linear elastic material for simplicity. The stress–strain behaviour of the rubber material was fitted to the experimental compression test data conducted on solid rubber tyre specimens by PHORMJAN and SUVANJUMRAT [27]. The material is linearly modelled up to a strain of 26% with E = 30   G P a and ν = 0.45 . For higher strains, the stiffness increases non-linearly, which was simplified in the simulation to a continuous multilinear curve. The applied material parameters are listed in Table 2.

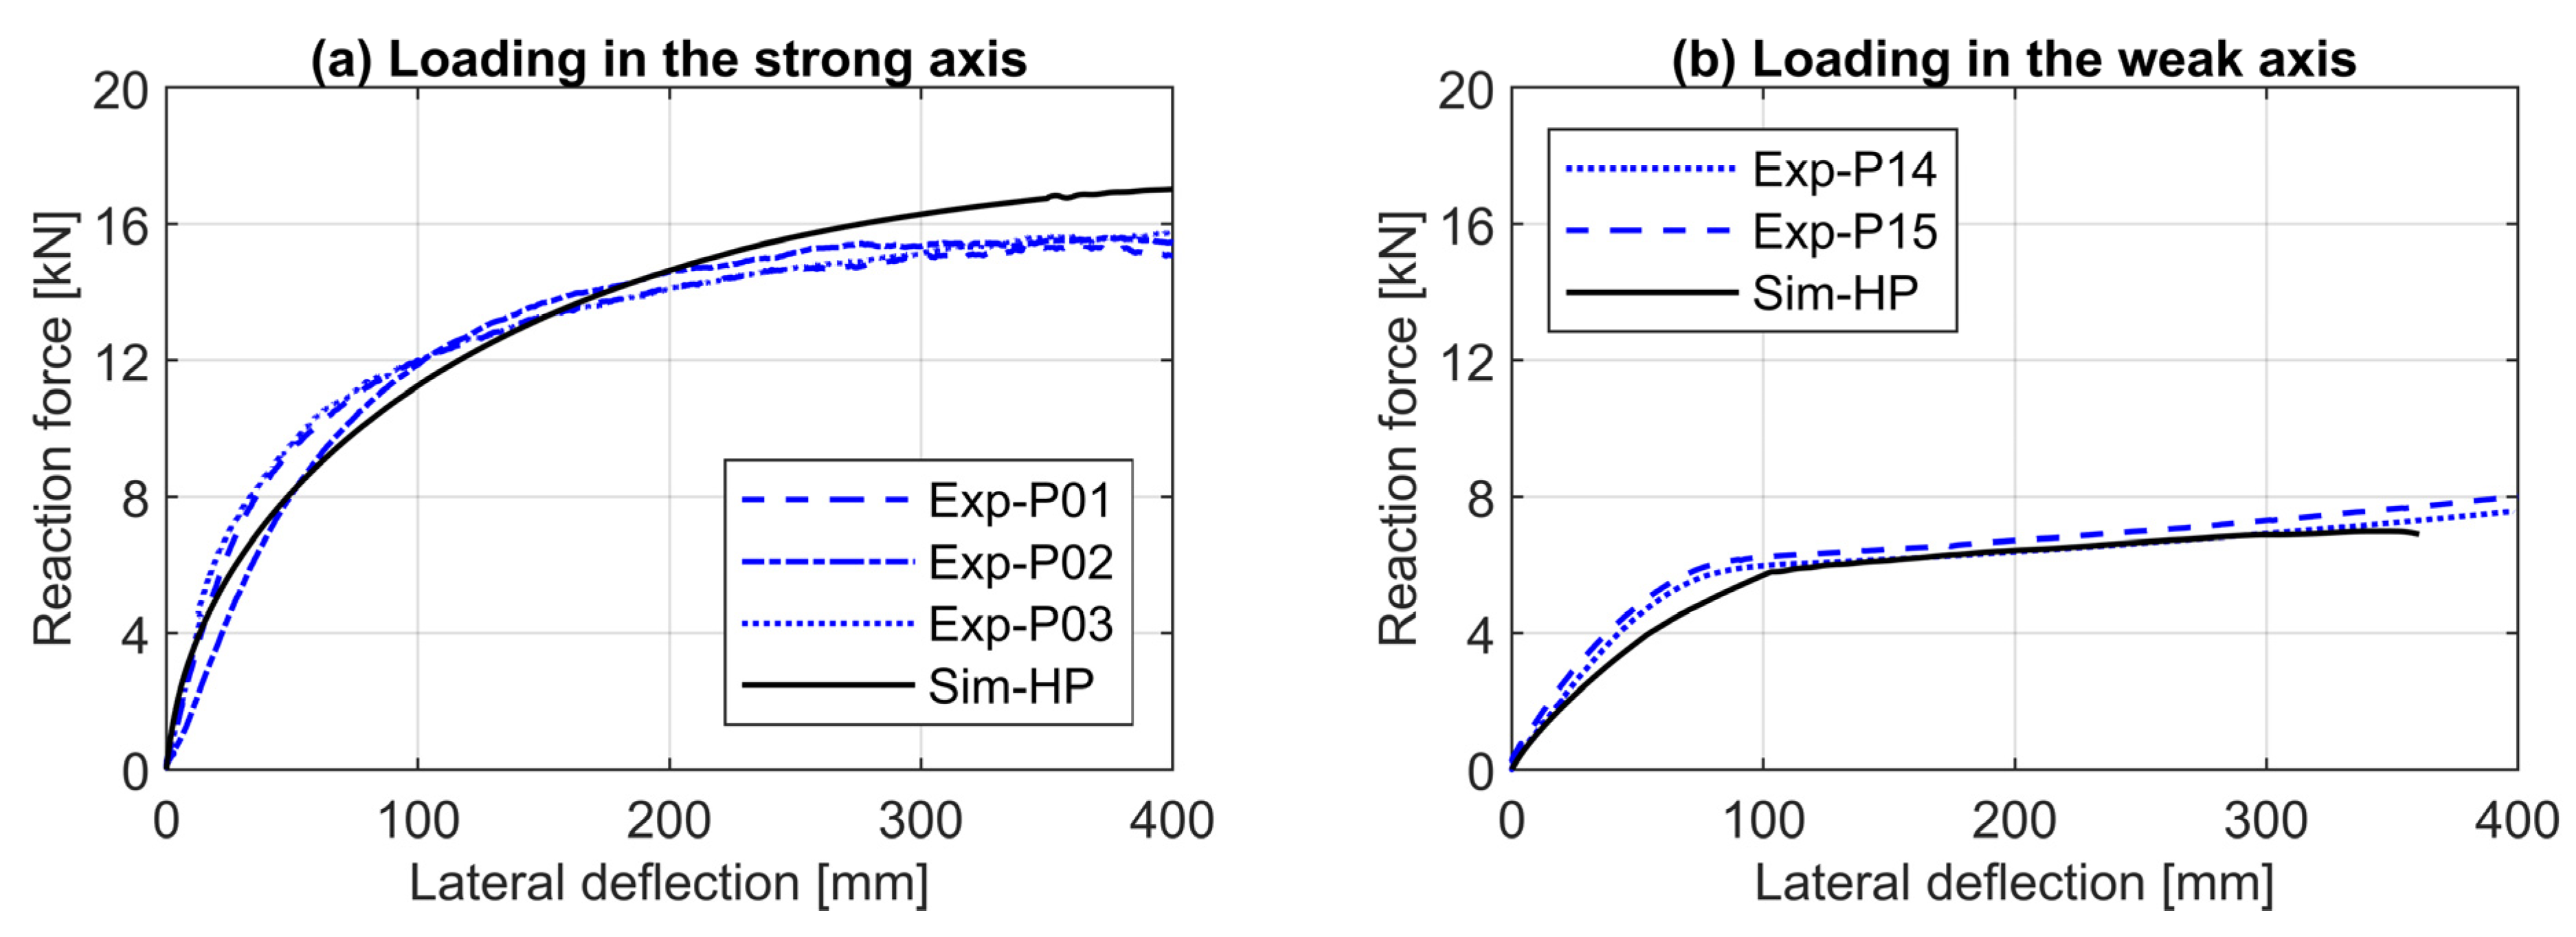
3.4. Validation of the FE Model

The FE model was validated using the full-scale field test data. These comprise five IPE120 posts (steel grade S355) loaded laterally with a quasi-static loading rate of 2–4 mm/s at a height of 75 cm above ground level (GL) up to 400 mm deflection. Three posts were loaded in the strong axis, and two in the weak axis. A further three posts were tested under impact loading with different intensities at the same loading height and the same soil conditions. All the posts were embedded to 1.0 m in crushed limestone with a grading of 0 to 32 mm (KSS032) and a relative density of 80% [3]. The posts were instrumented using strain gauges in four sections along the post. In the quasi-static test, the applied force was measured directly using a force transducer and the lateral deflection using a wire potentiometer at the load application point. In the dynamic tests, the impact force was measured using load cells built in the impactor. The post accelerations were measured using accelerometers at the load application point and at 5 cm above GL.
The simulated load-deflection curves evaluated at the load application point under quasi-static loading conditions were compared with the experimental data, as presented in Figure 4. The simulation results show good agreement with the experimental data. A coefficient of determination of R 2 s t r o n g = 0.93 and R 2 w e a k = 0.95 was achieved for the simulation compared with the field test data in the strong and weak axes, respectively. The loading in the strong axis shows the rigid body rotation of the post, and no section yielding is observed. In contrast, the loading in the weak axis leads to the formation of a plastic hinge at ca. 20 cm below ground level at a lateral deflection of 90 to 100 mm (see Figure 5). These results coincide with the field test observations.
Further simulations were performed with various mesh fineness to investigate the influence of the mesh discretisation on the numerical solution. The model for the reference test consists of a total of 6635 elements. A finer model with 24,536 elements and a coarser model with 4916 elements were created. The results of all three models show only a negligible deviation of ±0.2 kN in the maximum reaction force. However, the calculation using the finer model terminated prematurely due to convergence problems caused by the excessive distortion of individual soil elements in the flanks of the transient body.
In the next step, the FE model is validated under dynamic impact loading. The simulation results of the dynamic test executed under the impact energy of E i m p = 3.2   kJ are presented in Figure 6 and Figure 7. The simulations are in good agreement with the experimental data in terms of reaction force, lateral post deflection and velocity. The maximum reaction force simulated exhibits a deviation of 10%. At low velocity before recoil, the reaction force is equal to 97% of the quasi-static reaction force, which validates the model under both loading conditions. The post deflection and velocity–time history nearly coincide with the measured values up to the recoil point at 70 ms. The simulations show no plastic yielding in the steel section, which coincides with the field test observations.
Since the dynamic model is constructed without the definition of quiet boundaries, the effect of the model boundary extent is evaluated by comparing the parameters of interest to the reference model results. The FE model for the impact test 3.2 kJ was simulated using a doubled soil domain diameter of 8.4 m. The mesh discretisation is kept unchanged in the inner zone around the post. The simulated maximum reaction force shows a minor deviation of 1.5%. The post deflection, velocity and acceleration time histories nearly coincide.
The velocity of the impactor was varied in two further models ( E i m p = 5.7   and   8.2   kJ ) to simulate the higher impact energy levels applied in the field tests. All other parameters were kept unchanged. A comparison between the simulated and measured load-deflection curves is shown in Figure 8. The load-deflection curves agree well with the experimental data in terms of maximum force and curve progression. The simulations confirm the experimental observations, showing that increasing the impact intensity beyond the ultimate soil resistance does not lead to a significant increase in the post reaction force. The simulations with 5.7 and 8.2 kJ exhibit a maximum reaction force of 29 to 32 kN. The post section shows slight plastic deformations under 8.2 kJ, which coincides with the field test observations. Due to the excessive distortion of individual elements in the soil continuum, the simulations failed to converge shortly before reaching the maximum post deflection.

3.5. Parametric Study

The validated FE model is used to conduct a systematic investigation of the influence of different design parameters on the single post impact response. Here, we concentrated on the most significant parameters for the VRS design: soil relative density, post embedment length and the post section modulus. In each simulation series, a single parameter was variated in the anticipated range against the reference parameters (IPE120, strong axis W el , x   = 53 cm3, Embedment = 1 m, I D = 0.8 ). The posts are simulated under impact intensities of 2.5 kJ, 5 kJ and 10 kJ.
To quantify the influence of each investigated parameter on the post response, unified performance criteria had to be defined for all variations. Ultimately, in a crash test simulation, the performance of the VRS is evaluated based on the capability to absorb impact energy in conjunction with the acceleration severity index ( A S I ) and the dynamic deflection. A VRS is efficient if it can absorb high impact energy with a low A S I in a limited deflection range [28]. This means the VRS exhibits a high containment level of the colliding vehicles, as well as a lower deceleration rate jeopardising the occupants’ safety, and it can be installed safely in the vicinity of road structures. Based on these facts, the following performance criteria can be defined for the single post:
E a b s   100 : the energy absorbed by the post up to a lateral deflection of 100 mm. It has been observed in the parametric study that at the threshold of 100 mm deflection, the system stiffness has already dropped to less than 20% of its initial value. The system resistance developed after reaching this deflection value is not significant for the total resistance. The value of E a b s   100 is determined as the integration of the post load deflection curve at the loading point up to 100 mm lateral deflection, and is given in kJ.
A i m p   m a x : the maximum acceleration measured on the impactor, i.e., colliding body. The maximum impactor acceleration defines the impact force measured at the contact between the post and the impactor. It is worth mentioning that the impactor is modelled as a rigid body, which is not the case for a real vehicle. However, the A i m p   m a x value gives an indication of the relative post–soil response and is not intended for direct comparison with A S I . The value of A i m p   m a x is extracted directly from the FE model and is given as a multiple of the gravitational acceleration g .
The evaluated parameters E a b s   100 and A i m p   m a x for each variation are presented in Figure 9. The parametric study findings can be concluded as follows:
  • The range of relative density I D = 0.8 to 0.9 is ideal for the post performance, since the absorbed energy in this range is relatively high while the impactor acceleration is still low. A higher relative density leads to fixation of the post and, consequently plastic yielding.
  • Increasing the post embedment length beyond 1.0 m leads to a minor increase in the absorbed energy. However, decreasing the embedment by the same value leads to decreasing the absorbed energy significantly. The acceleration is nearly unaffected by the embedment length in the investigated embedment range.
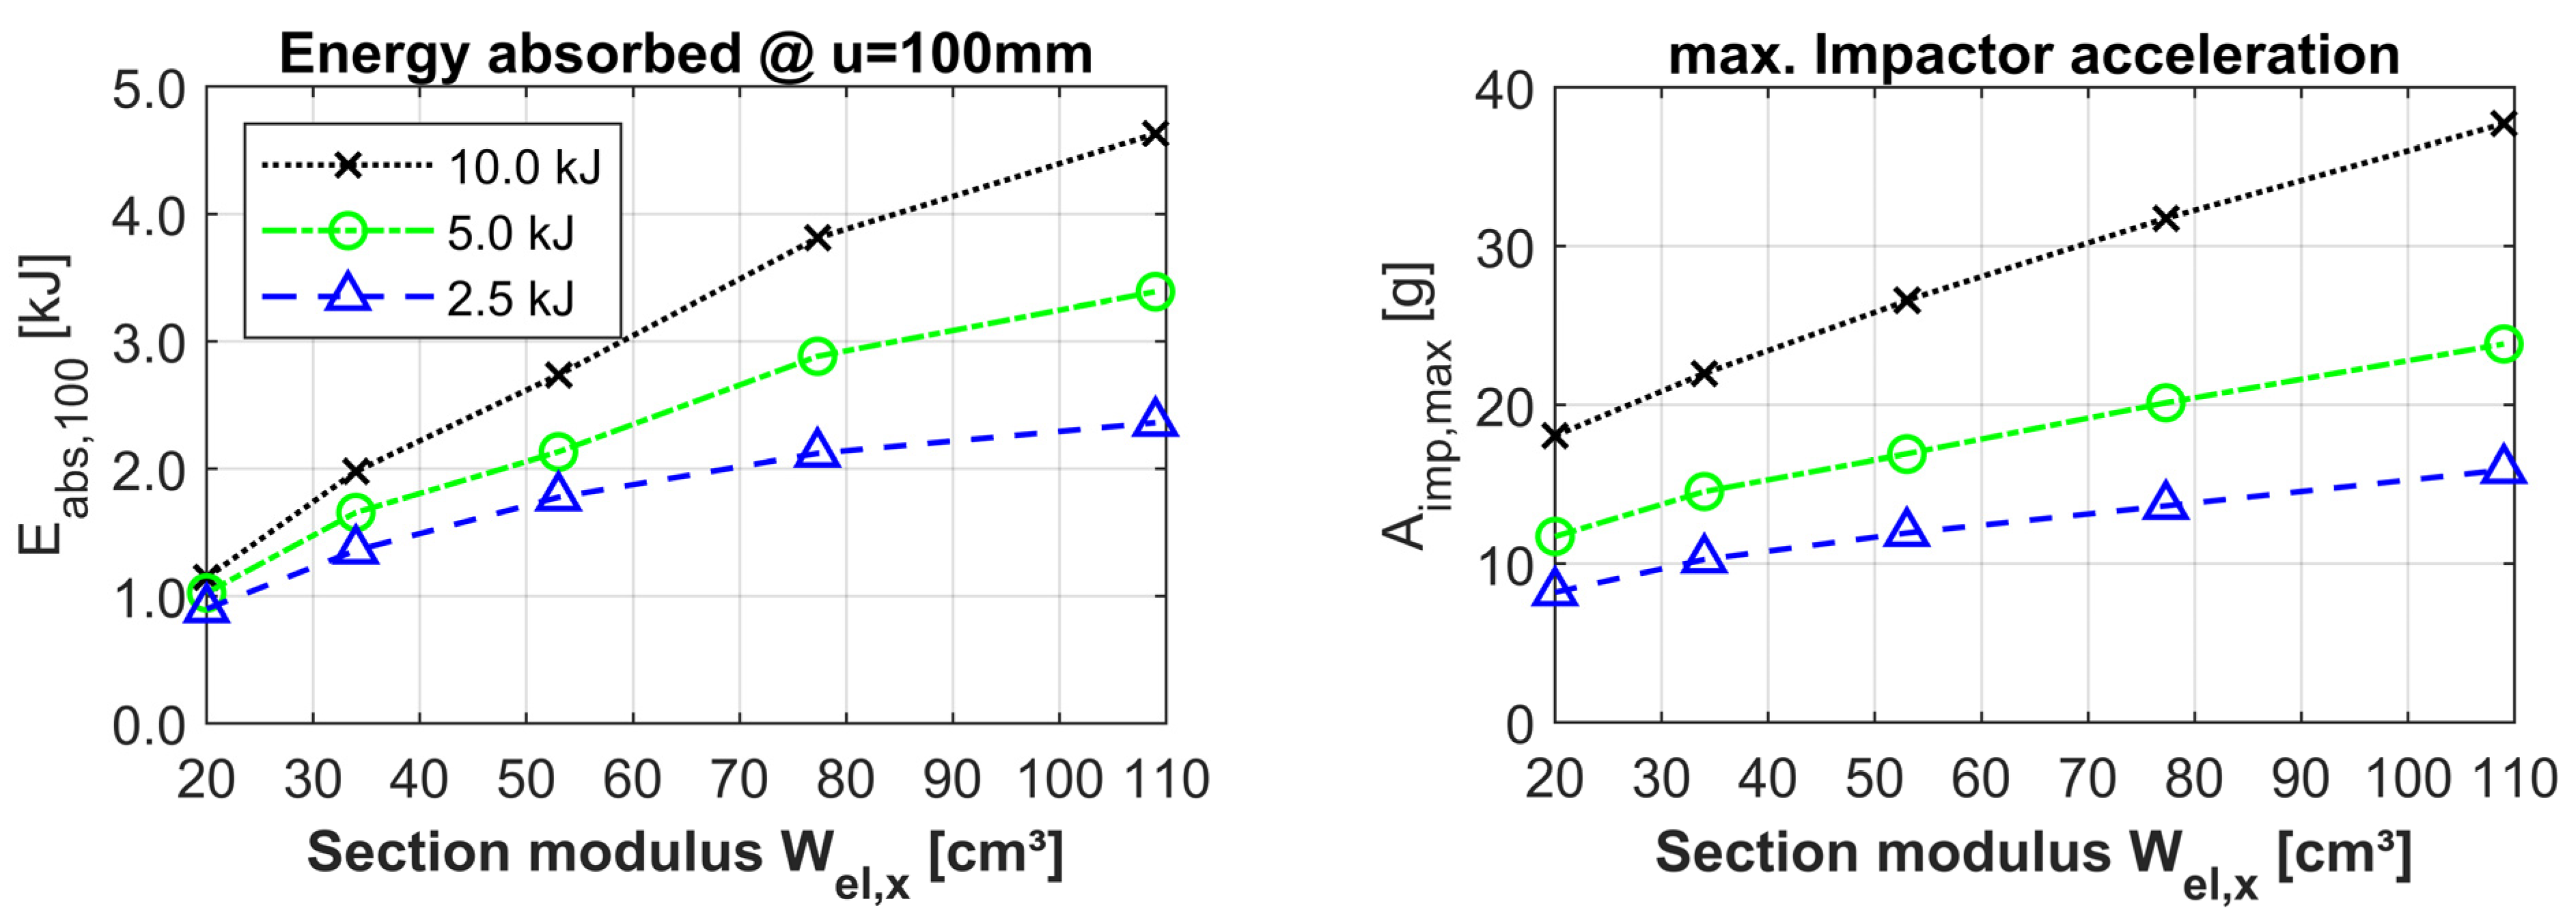
  • Increasing the flexural rigidity, i.e., the section modulus of the post section, leads to an increase in the absorbed energy and the impactor acceleration simultaneously.

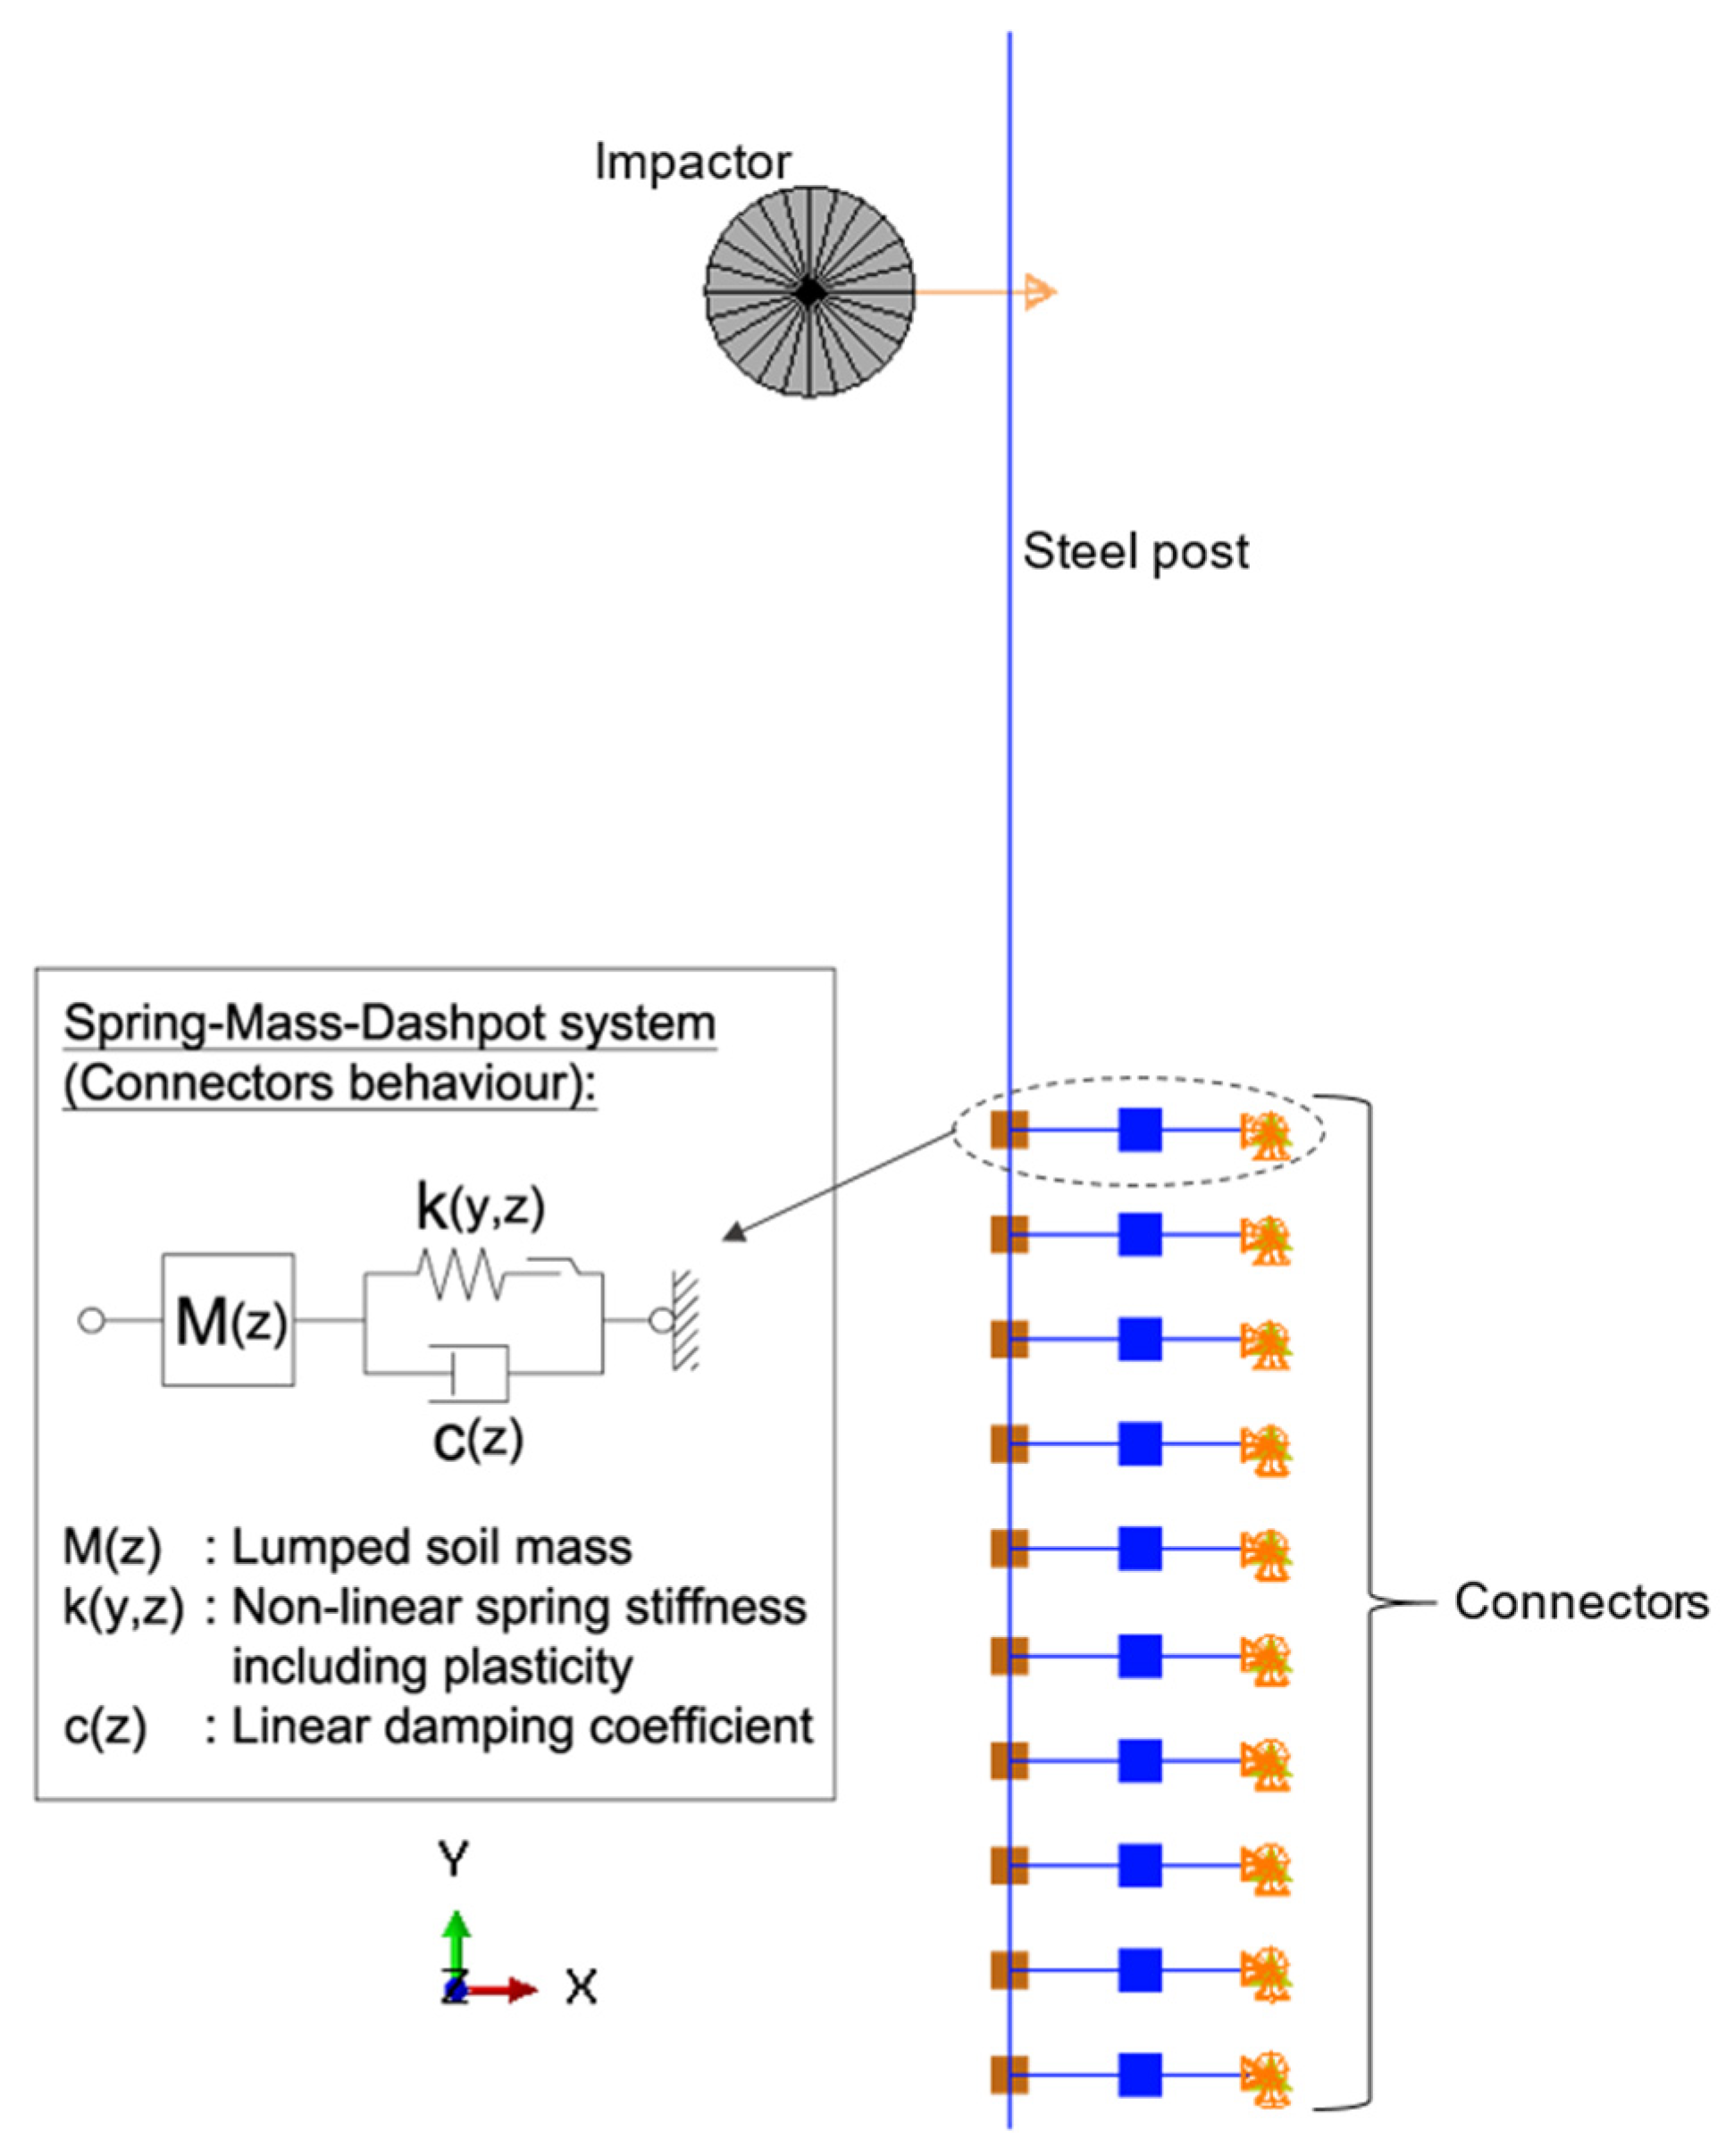
4. Development of a Lumped-Parameter Model for Guardrail Posts

The literature review has shown that besides the FE continuum models, the lumped-parameter models have proven to be efficient techniques for modelling the non-linear behaviour of guardrail posts. Therefore, we developed a simplified approach for the simulation of the soil-structure interaction using an LPM. The post–soil system is modelled using a multi-degree of freedom (MDOF) system based on the horizontal subgrade method. The post is modelled as a two-dimensional beam laterally loaded in one axis. The soil along the embedment length is substituted by a series of discrete non-linear elasto-plastic springs to model the soil stiffness. This approach is known in the literature also as ‘Beam on non-linear Winkler foundation’. Without further modifications, this model can predict the bearing behaviour of the posts under quasi-static loading. The model is extended to simulate the post behaviour under impact loading. To include the damping effects, i.e., energy dissipation in the surrounding soil, dashpot elements are added in parallel to the springs. The inertial effect of the soil mass is modelled as discrete lumped mass points at the elevations of the springs. A schematic representation of the proposed LPM is shown in Figure 10.
The advantage of the proposed model is the capability of simulating the post response under quasi-static and impact loading using one set of input parameters with an acceptable accuracy. For standard road-shoulder materials, the required parameters can be determined from a simple laboratory test program comprising relative density, oedometer and angle of repose tests.
The model is implemented in ABAQUS v2017 and runs using the implicit solver for both quasi-static and dynamic simulations. The beam is modelled using B23 elements and an elastic-perfectly plastic steel material. The strain-rate-dependent steel strength is modelled using the power law by COWPER and SYMONDS. The soil is discretised in 10 cm segments along the embedment length of 100 cm. The soil stiffness and damping properties are modelled using CONNECTOR elements, which allow for the definition of several constitutive behaviour properties for an element connecting two nodes. The connector non-linear elasticity is defined by force and displacement couples for the positive and negative deflection direction. The plasticity is defined as the depth-dependent ultimate soil resistance. A linear damping behaviour is defined for the connectors to allow for energy dissipation. The soil mass is defined using additional point mass elements attached to the post in each segment. The mass of the post is considered automatically through the steel material density.
For the case of quasi-static loading, a prescribed displacement is applied at the loading point. For dynamic loading, the impactor is simulated by a rigid mass colliding with the post with a predefined velocity. The loading height is set to 75 cm above ground level. For both loading cases, the same model with the same parameters is applied.

4.1. Determination of the Model Parameters

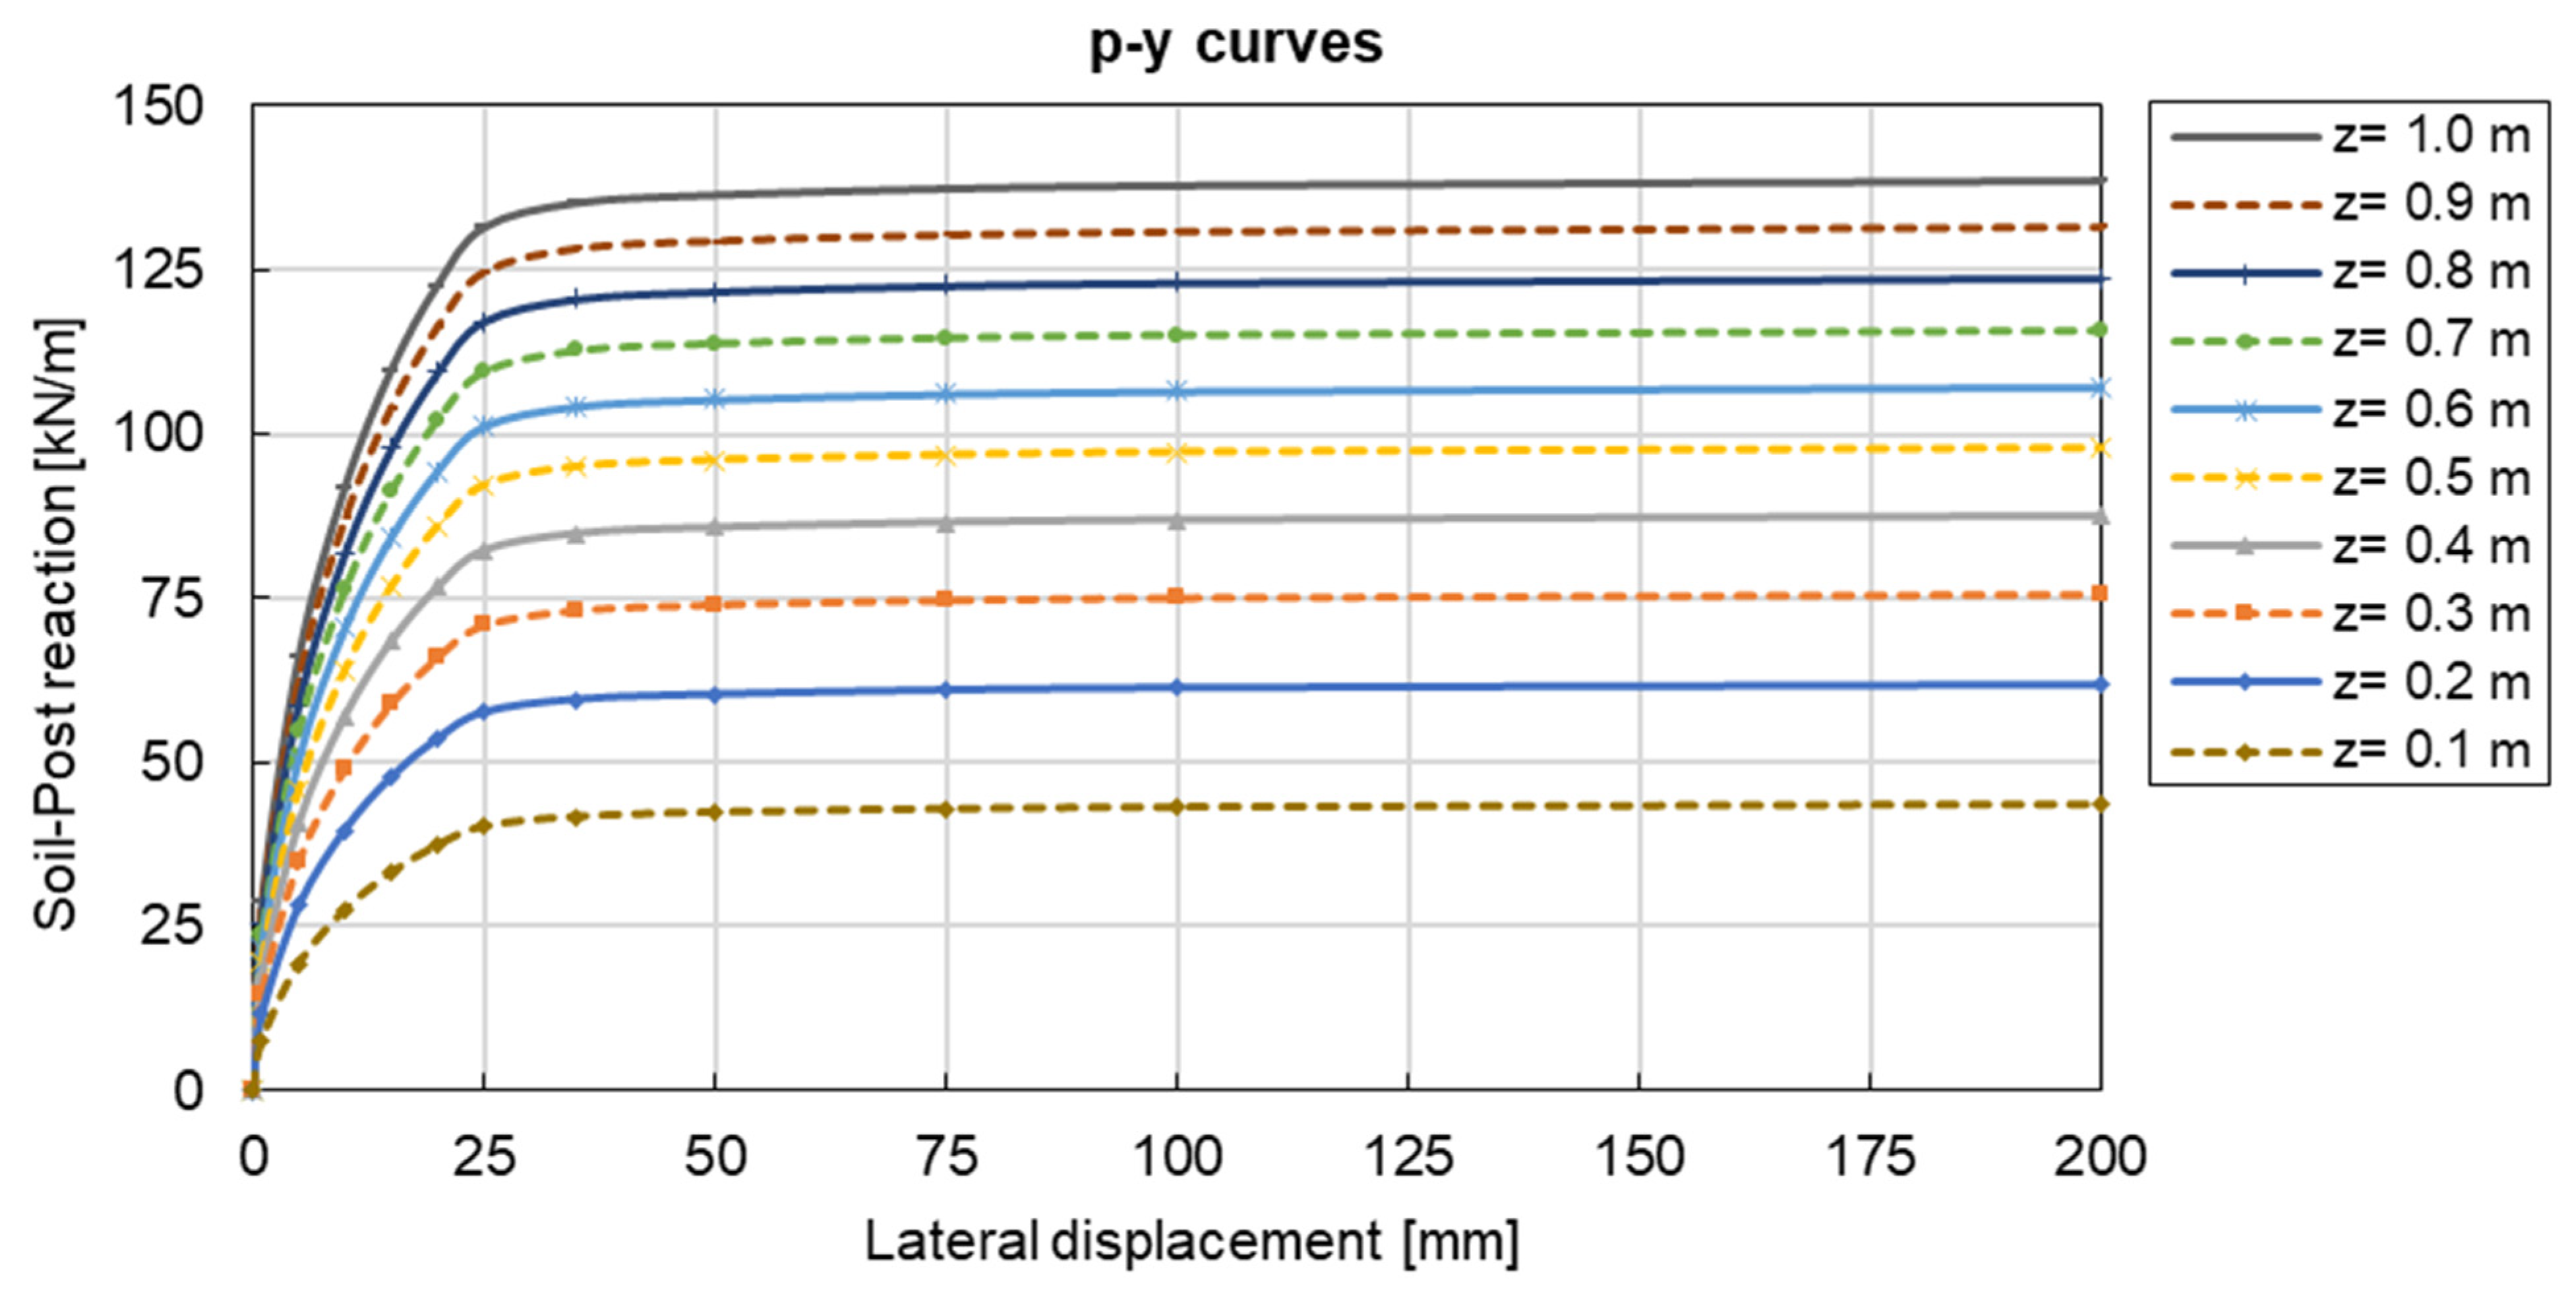
4.1.1. P–y Curve Function

The local variation in the lateral soil–pile resistance with lateral deflection along the post embedment can be described by non-linear unit load-transfer curves. This approach is referred to in the literature as an empirical approach since the p–y curves need to be calibrated either to full-scale field or model tests [29]. However, many researchers have attempted to develop models that correlate the p–y curves to the soil properties. For cohesionless soils, the non-linear p–y curves can be described, for example, by a piecewise linear function, a hyperbolic function (e.g., KONDNER [30]) or a combination of linear and parabolic segments (REESE et al. [31]). The piecewise approaches require a predefinition of the transition deflections, which consequently requires additional empirical parameters or calibration factors valid for a particular deflection range. In contrast, the hyperbolic function exhibits, besides its simplicity of implementation, a continuous function independent of the deflection range.
The hyperbolic function proposed by KONDNER [30] has the advantage of incorporating the initial soil stiffness k i n i and ultimate soil resistance P u l t without any further empirical factors:
P s t a t = y 1 k i n i + y P u l t
This function is chosen for the characterisation of the non-linear spring stiffness under quasi-static and impact loading. Under static loading conditions, and assuming no axial force acting on the post, the soil reaction per unit length P s t a t is described by the Bernoulli beam equation as follows:
E I 4 y ( z ) z 4 k · y ( z ) = 0
where E I 4 y ( z ) z 4 is the pile bending stiffness and P s t a t = k · y ( z ) is the spring resistance component.
Under impact loading conditions, based on the Bernoulli beam equation and considering the inertial and damping effects, the system reaction components to lateral transient loading F ( t ) can be written as follows:
E I 4 y ( z , t ) z 4 + M 2 y ( z , t ) t 2 + c · y ( z , t ) t + k · y ( z , t ) = F ( t )
where the sum of the inertial force M 2 y ( z , t ) t 2 , the damping component c · y ( z , t ) t and the spring resistance k · y ( z , t ) forms the dynamic soil reaction P d y n . The spring resistance k · y ( z , t ) is assumed to be independent of the loading rate. This assumption is verified through the validation of the LPM.

4.1.2. Initial Subgrade Reaction Modulus

Adopting the subgrade reaction modulus approach recommended by the German EAP [32], the initial soil stiffness k i n i can be determined as a function of the oedometric soil modulus E s :
k i n i = E s / D e q u
where D e q u is an equivalent circular post diameter calculated based on the post outer perimeter. The distribution in the oedometric stiffness modulus over the embedment length can be estimated using the power function after OHDE 1939:
E s = v .   σ r e f   ( σ z σ r e f ) ω
where σ r e f = 100   k P a is the reference pressure and v and ω are the material-dependent OHDE constants defining the stiffness distribution with the effective overburden stress. These coefficients were calibrated to the conducted odometer test on the KSS032. The calibrated coefficients are in line with the values recommended by the committee for “Waterfront Structures, Harbours and Waterways” EAU 2012 [33] for silty gravel. So, in the case of the absence of large odometer tests, v and ω can be assumed accordingly.

4.1.3. Ultimate Soil Pressure

The mobilised soil resistance plays a governing role in the estimation of the total post reaction force. In the case of a short laterally loaded pile, the ultimate pressure mobilised in front of the post above the rotation point and behind the post below the rotation point cannot exceed the three-dimensional passive earth pressure. This is assuming that the drag force in the pile toe is minor and can be neglected. As per the German standard DIN 4085 [17], the horizontal 3D passive earth-pressure force per meter E p g h for a non-cohesive soil can be calculated as follows:
E p g h = 1 2 γ z 2 K p g h μ p g h
where K p g h is the passive earth pressure coefficient due to the soil’s own weight and μ p g h is a shape factor considering the narrow pile width. For a beam width-to-embedment ratio less than 0.3, the shape factor is given by the following:
μ p g h = 0.55 · ( 1 + 2 · t a n φ ) · z D
The mobilisation of the full passive earth pressure requires a relatively large displacement of the laterally loaded element. At the beginning of loading, the lateral deflection is not enough to mobilise the full passive pressure. Therefore, the earth pressure coefficient to be applied ranges between the earth pressure coefficient at-rest K 0 and K p g h . According to DIN 4085 [17], the partially mobilised passive earth pressure E * p g h can be estimated as follows:
E * p g h = ( E p g h E 0 g h ) · [ 1 ( 1 y y p ) b ] c + E 0 g h
where y y p is the ratio of the element displacement to the displacement required for the mobilisation of the full passive earth pressure. For y y p , full E p g h is mobilised. The exponents b and c are constants and are calculated as 1.5 and 0.7 for non-cohesive soils.
The value of y p depends on the deflection form of the element, whether rotation at the pile head, at pile toe or parallel displacement. The reference values of y p recommended in DIN 4085 for granular soils exhibiting I D > 0.3 are expressed as follows:
Pile   toe   rotation   and   parallel   displacement :   y p = z · ( 0.08 · D + 0.12 )
Pile   head   rotation :   y p = z · ( 0.05 · D + 0.09 )
For simplicity, a mean value y p is assumed for the post above and below the rotation point, since the rotation point depth is not known in advance. Moreover, the experimental field tests have shown that the location of the rotation point changes with increasing lateral deflection.
The evaluation of the friction angle φ and cohesion c from the triaxial test results using Mohr–Coulomb criteria overestimates the soil shear strength under low overburden pressure [34]. The shear failure envelope has been proven to be curved rather than linear in this stress range (e.g., LADE [34]). Moreover, the shear strength parameters of the granular material depend on its relative density, as proven experimentally by BOLTON [35]. He developed a formula correlating the peak friction angle φ to the critical state friction angle φ c , the relative soil density I D and the mean effective stress at failure p :
φ = φ c + Δ φ · I D [ Q ln p p r e f ] R
where Δ φ = 3 , Q = 14 and R = 3 are material grain type dependent factors estimated through experimental testing by BOLTON for limestone, and p r e f = 1   k P a . The peak friction angle is assumed to be constant along the post embedment.
Considering all the above-discussed aspects, the earth pressure mobilised at each depth, in the case of a laterally loaded post, can be calculated as follows:
P u l t = μ p g h · K * p · D e q u · γ z n
K * p = ( K p K 0 ) · [ 1 ( 1 y y p ) b ] c + K 0
K p = 1 + s i n φ 1 s i n φ   ,   K 0 = 1 s i n φ
where the influence of the compaction pressure is considered indirectly through the exponent n .
As discussed earlier, the compaction pressure leads to an increase in the lateral pressure in the upper soil zone. By introducing the factor n = 0.5 , the ultimate soil pressure increases in the upper decimetres significantly and approaches the unadapted earth pressure values at the post-toe at the depth z = 1.0 . This assumption fits very well with the experimentally derived quasi-static p–y curves. This approach was also adopted by TAK and KIM et al. [36] for the characterisation of static load-transfer curves for shallow embedded laterally loaded model piles in sands. The developed p–y curves for each depth increment are presented in Figure A1 in Appendix A.

4.1.4. Irreversible Soil Deformations

Since the soil undergoes irreversible deformations during the quasi-static and impact loading of the posts, the plasticity feature of the soil cannot be neglected. Modelling the post–soil system with pure elastic behaviour underestimates the plastic strain energy and leads to the full recovery of the post’s original location, which is not realistic. The irreversible soil deformations were also observed in the experimental field tests under both loading cases. The soil material is assumed to reach plasticity when the ultimate soil resistance P u l t is mobilised. This value is reached at the lateral deflection y p required to mobilise the full passive resistance at each depth.

4.1.5. Soil Damping

The main mechanisms responsible for the dissipation of energy in the case of laterally impacted posts are plastic straining as well as damping. The sources of damping considered in soil–structure interaction problems include material and radiation damping. The determination of the damping properties of a dynamically loaded system is complex, due to the superposition of different phenomena, e.g., viscosity, interface properties and the problem’s geometric conditions.
NOVAK et al. [37] proposed an analytical approach for the determination of the dynamic stiffness and damping coefficient for an embedded cylindrical body in plane strain under harmonic loading. In terms of viscoelastic behaviour, the damping coefficient c is formulated as follows:
c = 2 ·   G m a x ( z ) · r 0 · S u 2 V s ( z )
where G m a x ( z ) is the small-strain shear modulus profile over depth, ρ the soil unit weight, the shear wave velocity V s ( z ) = G m a x ( z ) · ρ and r 0 is the near-field influence zone. S u 2 is the damping parameter under horizontal loading.
For the LPM, the G m a x ( z ) is calibrated to the stiffness modulus E s ( z ) profile from the oedometer test. For gravelly well-graded sands, the German committee for soil dynamics “EA-Baugrunddynamik” [38] recommends a factor η = G m a x E s = 3 ~ 6 for the range E s = 10 ~ 20   MPa based on the experimental work by WICHTMANN and TRIANTAFYLLIDIS [16]. A mean value of η = G m a x E s = 4.5 is adopted for the LPM.
Since the guardrail posts undergo large lateral deflections and the viscous behaviour of the granular road-shoulder material is negligible, radiation damping dominates. Although radiation damping depends on the geometric conditions of the problem, it increases with increasing the shear modulus and density of the material [37]. Therefore, the damping coefficient c ( z ) is estimated according to the above-mentioned approach and is adjusted by a reduction factor of x = 0.01 to fit the field test data. The calculated damping coefficient over the embedment length is presented in Table A1 in Appendix A.

4.1.6. Lumped Soil Mass

The influence of the mobilised soil mass on the post response cannot be neglected under impact loading. The experimental field tests show soil heaving in front of the post during impact loading. The analysis of the video frames shows the vertical vibration of points at ground level extending to ca. 60 cm. This observation is confirmed by the FE continuum simulations. The dimensions of the soil wedge can be estimated based on the FE continuum model by defining a deformation threshold. Here, the threshold is assumed to be a minimum deflection of 1 cm. The extent of the soil wedge mobilised at ground level was found to range between 55 and 75 cm, depending on the impact intensity. The wedge cross-section in front of the post is approximately circular, with a slightly larger width in the transversal direction. The depth of the wedge below ground level extends to the post rotation point. The inclination angle of the failure surface measured from the horizontal plane is ca. 60°. The wedge length at the rotation point is approximately equal to the equivalent post diameter D e q u .
Based on the estimated dimensions, the shape of the soil wedge can be discretised to right prisms with a square base in each depth. The prisms have a height of h = 10   cm and a side dimension of L = D e q u + T i · t a n ( 45 ° φ c / 2 ) , where T i is the increment depth to the rotation point. The lumped mass is calculated as a product of the soil density ρ and the prism volume at each depth increment. The calculated lumped mass for each depth increment is presented in Table A1 in Appendix A.
The LPM input parameters are listed in Table 3. The parameters φ c , I D and γ are determined experimentally using conventional laboratory tests. All other parameters can be derived as per the proposed approach. The soil strength is determined as a function of the soil relative density, which makes the model practical for comparing different in situ soil states.

4.2. Lumped-Parameter Model Simulation Results

The simulation results using the developed LPM are shown in Figure 11. The LPM is capable of simulating the quasi-static and impact loading with adequate accuracy. The reaction force and post deflection correspond well to the experimental data. The force fluctuations under impact loading in the first 10 ms are deviating from the experimental data, due to the absence of the tyre piece in the model. However, this detail has a negligible effect on the load-bearing behaviour. The LPM is numerically stable, even at higher impact intensities. None of the conducted simulations suffered convergence problems.
Comparing the time required for the simulation task 3.2 kJ on the same processor, the LPM requires only 2.5% of the time consumed by the FE continuum model (Total CPU time: 735 s for LPM versus 28,898 s for FE continuum). The significant computational efficiency of the LPM allows for the simulation of several posts within a VRS in a crash test with much less cost and time.

5. Discussion of the Simulation Models’ Performance

The numerical simulation results obtained using the FE continuum method and the LPM are compared statistically to infer the efficiency of the models to simulate the guardrail post behaviour. To facilitate the comparative assessment of the simulation models, the response parameters are presented using TAYLOR diagrams [39]. This mathematical presentation of data is used to quantify the correspondence between the simulated and the experimental behaviour in terms of the following statistical measures:
  • Pearson correlation coefficient ( P C C M o d e l ) , which gauges the similarity in patterns between the simulated and the experimental data sets. The coefficient is calculated as the covariance of two variable populations divided by the product of their standard deviations, and is presented in the diagram on the azimuthal angle. A Pearson coefficient value close to 1 indicates the high agreement of the simulation model with the experimental observations.
    P C C M o d e l = 1 N i = 1 N ( f S I M , i f S I M ¯ ) · ( f E X P , i f E X P ¯ ) ( S D S I M S D E X P )
    where N is the number of discrete data points of the sample, f S I M , i is the simulated variable value at a given point, f E X P , i is the measured experimental value and f S I M ¯ and f E X P ¯ are the mean values of each sample, respectively. S D S I M and S D E X P are the standard deviations of the simulated and the experimental data samples.
  • Root-mean-square error ( R M S M o d e l ) , which measures the difference between the simulated data and the observed data in terms of the root-mean-square error. Models close to the circle’s centre can simulate the observations with low error.
    R M S M o d e l = 1 N i = 1 N ( f S I M , i f E X P , i ) 2
  • Standard deviation ( S D M o d e l ) , which measures the amount of dispersion of a data sample, i.e., simulation, from a mean value, i.e., experiment. In the TAYLOR diagram, the experimental data is set as the comparison sample data. Therefore, the S D of the experimental data is divided by itself and normalised ( S D E X P = 1.0 ) .
    S D M o d e l = 1 N i = 1 N ( f S I M , i f S I M ¯ ) 2
The constructed TAYLOR diagrams for the reference tests (KSS032, I D = 0.8 , IPE120, strong axis) are presented in Figure 12. For the quasi-static test, the load-deflection data series were extracted from each model and from the field test. The coefficients were then calculated for the reaction force with respect to the same deflection scale for all data. The results show that the simulation models exhibit a high correlation P C C 0.98 and low error R M S 0.2 , i.e., the simulated values agree well with the observations (see Figure 12a). Both models show a S D = 0.1 0.2 , which indicates a very good agreement of load-deflection curve characteristics.
For the impact test, the data series had to be prepared in the form of time histories. The post reaction force, lateral deflection at the loading point and the energy absorbed up to 100 mm lateral deflection were extracted from the reference models under 3.2 kJ. Compared with the quasi-static test, the models show a slightly higher error R M S = 0.4 0.55 and a lower correlation of P C C = 0.88 0.93 (see Figure 12b). The lateral deflection simulated using both models reproduce the pattern of the experimental data very well ( S D S I M S D E X P ) and show a high correlation of P C C = 0.9 0.99 (see Figure 12c). The energy absorbed E a b s   100 shows the best pattern correlation P C C > 0.9 and a very low error R M S < 0.15 (see Figure 12d). This indicates that the developed simulation models perform very well in terms of energy dissipation, which is crucial for the simulation of a crash test.

6. Conclusions and Recommendations

The realistic modelling of the impact behaviour of a single post is crucial in assessing the performance of VRS through numerical simulations. In this study, the soil–post interaction is investigated using numerical methods to contribute to closing the gap between transportation and geotechnical engineering in this aspect. Based on the study findings, the following conclusions and recommendations are drawn:
  • The numerical model of a guardrail post embedded in soil must account for the post installation method and the initial soil stress-state, as well as the large soil deformations and post deflections. The selected constitutive soil model must be capable of simulating the stress-state dependency of the strength and stiffness parameters, their distribution over depth and irreversible material deformations. The constitutive model for the steel post section must consider the strain-rate dependency of the material yield strength.
  • The soil response can be modelled using the hypoplastic constitutive relation with one parameter set independent of the loading rate. This feature is crucial for VRS simulation in a crash test, since the posts experience different impact intensities.
  • Compared with the conventional elasto-plastic models, the hypoplastic model parameter calibration is independent of the soil relative density in situ. No additional adjustment is required for the strength and stiffness parameters in the shallow embedment depth.
  • The introduced LPM offers the same advantages as the FE hypoplastic continuum model, with a much higher computational efficiency and a simpler parameter calibration routine. The LPM can be implemented in any FE code, in which non-linear elasticity, plasticity, damping and mass points can be defined.
  • The developed LPM shall be applied only for standard road-shoulder materials. Soils comprising a cohesive or organic content exceeding 12% cannot be analysed using this approach without further modifications.
  • The soil relative density I D = 0.85 to 0.9 range can be considered optimum for the post response, since the absorbed energy is relatively high and the impact force is low in this range. Posts with embedment lengths larger than 1.0 m exhibit a marginal effect on the absorbed energy. Increasing the post section modulus is very efficient in absorbing a higher impact energy with less deformations. However, the induced impact force increases as well, which can jeopardise the vehicle occupants’ safety.

Author Contributions

Conceptualization and methodology: M.S. and R.C.; software and validation: M.S.; formal analysis and data curation: M.S.; writing and visualization: M.S.; supervision, project administration and funding acquisition: R.C. All authors have read and agreed to the published version of the manuscript.

Funding

This study was partially conducted in the framework of a research project entitled “Auswirkung des Bodens auf das Verhalten von Fahrzeug-Rückhaltesystemen” (FE03.0574/2018/HRB) funded by the German federal highways’ authority BASt.

Data Availability Statement

Some or all data supporting the findings of this study are available from the corresponding author upon reasonable request.

Acknowledgments

We gratefully acknowledge the support of the BASt and TÜV-Süd as project partner. Many thanks to Daniel Rebstock from TUM for providing the hypoplastic “umat” and for his mentoring during the project.

Conflicts of Interest

The authors declare no conflict of interest.

Appendix A

Figure A1. LPM unit load-displacement curves developed using the proposed approach for IPE120 post embedded in dense KSS032 (z = depth from ground level).
Geotechnics 03 00062 g0a1
Table A1. Lumped mass points and linear damping coefficient evaluated along the post embedment length.
Depth u. GLLumped MassDamping Coef.
zM(z)c(z)
[m][kg][kN.s/m]
0.159.93.47
0.248.94.06
0.339.04.22
0.430.24.14
0.522.53.89
0.616.03.51
0.710.63.02
0.86.22.44
0.93.11.79
1.01.01.07

References

  1. Mašín, D. Modelling of Soil Behaviour with Hypoplasticity; Springer International Publishing: Cham, Switzerland, 2019; ISBN 978-3-030-03975-2. [Google Scholar]
  2. Ray, M.H.; Patzner, G.S. Finite-Element Model of Modified Eccentric Loader Terminal (MELT). Transp. Res. Rec. 1997, 1599, 11–21. [Google Scholar] [CrossRef]
  3. Soliman, M.; Rebstock, D.; Cudmani, R. Experimental investigation of the response of guardrail posts embedded in road shoulder material under quasi-static and dynamic impact loading. Transp. Geotech. 2023, 42, 101104. [Google Scholar] [CrossRef]
  4. Plaxico, C.A.; Patzner, G.S.; Ray, M.H. Finite-Element Modeling of Guardrail Timber Posts and the Post-Soil Interaction. Transp. Res. Rec. 1998, 1647, 139–146. [Google Scholar] [CrossRef]
  5. Habibagahi, K.; Langer, J.A. Horizontal Subgrade Modulus of Granular Soils. In Laterally Loaded Deep Foundations: Analysis and Performance; American Society for Testing and Materials: West Conshohocken, PA, USA, 1984; pp. 14–21. [Google Scholar] [CrossRef]
  6. Sassi, A.; Ghrib, F. Development of finite element model for the analysis of a guardrail post subjected to dynamic lateral loading. Int. J. Crashworthiness 2014, 19, 457–468. [Google Scholar] [CrossRef]
  7. Coon, B.A.; Reid, J.D.; Rohde, J.R. Dynamic Impact Testing of Guardrail Posts Embedded in Soil; Midwest Roadside Safety Facility, University of Nebraska: Lincoln, NE, USA, 1999. [Google Scholar]
  8. Sassi, A.; Ghrib, F. Crashworthiness of guardrail posts embedded in cohesionless soils: A parametric study. Int. J. Crashworthiness 2016, 21, 460–476. [Google Scholar] [CrossRef]
  9. Mojdeh, A.P.; Jean-Louis, B. TAMU-POST: An analysis tool for vehicle impact on in-line pile group. Cogent Eng. 2020, 7, 1735694. [Google Scholar] [CrossRef]
  10. Briaud, J.-L. SALLOP: Simple Approach for Lateral Loads on Piles. J. Geotech. Geoenviron. Eng. 1997, 123, 958–964. [Google Scholar] [CrossRef]
  11. LS-DYNA Keyword User’s Manual: Vol. II: Material Models; Livermore Software Technology Corp.: Livermore, CA, USA, 2018. [Google Scholar]
  12. Bligh, R.P.; Seckinger, N.R.; Abu-Odeh, A.Y.; Roschke, P.N.; Menges, W.L.; Haug, R.R. Dynamic Response of Guardrail Systems Encased in Pavement MOW Strips: FHWA/TX-04/0-4162-2; Texas Transportation Institute: Arlington, TX, USA, 2004. [Google Scholar]
  13. Wu, W.; Thomson, R. A study of the interaction between a guardrail post and soil during quasi-static and dynamic loading. Int. J. Impact Eng. 2007, 34, 883–898. [Google Scholar] [CrossRef]
  14. Woo, K.S.; Lee, D.W.; Ahn, J.S. Impact Behavior of a Laterally Loaded Guardrail Post near Slopes by Hybrid SPH Model. Adv. Civ. Eng. 2018, 2018, 9479452. [Google Scholar] [CrossRef]
  15. ABAQUS Analysis User’s Manual, Version 6. 17; Dassault Systèmes Simulia Corp.: Waltham, MA, USA, 2016. [Google Scholar]
  16. Wichtmann, T.; Triantafyllidis, T. On the correlation of “static” and “dynamic” stiffness moduli of non-cohesive soils. Bautechnik 2009, 86, 28–39. [Google Scholar] [CrossRef]
  17. DIN 4085:2017-08; Baugrund—Berechnung des Erddrucks. Deutsches Institut für Normung e.V. Beuth Verlag: Berlin, Germany, 2017.
  18. Von Wolffersdorff, P.-A. A hypoplastic relation for granular materials with a predefined limit state surface. Mech. Cohesive-Frict. Mater. 1996, 1, 251–271. [Google Scholar] [CrossRef]
  19. Niemunis, A.; Herle, I. Hypoplastic model for cohesionless soils with elastic strain range. Mech. Cohesive-Frict. Mater. 1997, 2, 279–299. [Google Scholar] [CrossRef]
  20. Herle, I.; Gudehus, G. Determination of parameters of a hypoplastic constitutive model from properties of grain assemblies. Mech. Cohesive-Frict. Mater. 1999, 4, 461–486. [Google Scholar] [CrossRef]
  21. Wichtmann, T. Kalibrierung der Parameter Eines Hypoplastischen Stoffmodells für Granulare Böden: Vorlesungsskript; Bauhaus-Universität Weimar: Weimar, Germany, 2018. [Google Scholar]
  22. DIN 18126:2022-10; Baugrund, Untersuchung von Bodenproben: Bestimmung der Dichte Nicht Bindiger Böden bei Lockerster und Dichtester Lagerung. Deutsche Gesellschaft für Geotechnik e.V. Beuth Verlag: Berlin, Germany, 2022.
  23. DIN 18127:2012-09; Baugrund, Untersuchung von Bodenproben—Proctorversuch, Deutsches Institut für Normung e.V. Beuth Verlag: Berlin, Germany, 2012.
  24. DIN EN ISO 17892-9:-07; Geotechnische Erkundung und Untersuchung—Laborversuche an Bodenproben: Teil_9: Konsolidierte Triaxiale Kompressionsversuche an Wassergesättigten Böden. Deutsches Institut für Normung e.V. Beuth Verlag: Berlin, Germany, 2018.
  25. Wright, A.E.; Ray, M.H. Characterizing Guardrail Steel for LS-DYNA3D Simulations. Transp. Res. Rec. 1996, 1528, 138–145. [Google Scholar] [CrossRef]
  26. Cowper, G.; Symonds, P. Strain-Hardening and Strain-Rate Effects in the Impact Loading of Cantilever Beams; Division of Applied Mathematics, Brown University: Providence, RI, USA, 1957. [Google Scholar]
  27. Phromjan, J.; Suvanjumrat, C. Material Properties of Natural Rubber Solid Tires for Finite Element Analysis. KEM 2018, 775, 560–564. [Google Scholar] [CrossRef]
  28. DIN EN 1317-1:2011-01; Rückhaltesysteme an Straßen: Teil_1: Terminologie und Allgemeine Kriterien für Prüfverfahren. Deutsches Institut für Normung e.V. Beuth Verlag: Berlin, Germany, 2011.
  29. Reese, L.C.; van Impe, W.F. Single Piles and Pile Groups under Lateral Loading, 2nd ed.; CRC Press/Balkema: Boca Raton, FL, USA, 2011; ISBN 9780415469883. [Google Scholar]
  30. Kondner, R.L. Hyperbolic Stress-Strain Response: Cohesive Soils. J. Soil Mech. Found. Div. 1963, 89, 115–143. [Google Scholar] [CrossRef]
  31. Reese, L.C.; Cox, W.R.; Koop, F.D. Analysis of laterally loaded piles in sand. In Proceedings of the VI Annual Offshore Technology Conference, Houston, TX, USA, 5–7 May 1974; OTC 2080. pp. 473–485. [Google Scholar]
  32. Empfehlungen des Arbeitskreises “Pfähle”. Deutsche Gesellschaft für Geotechnik e.V., 2. Auflage; Ernst & Sohn a Wiley Brand: Berlin, Germany, 2012; ISBN 978-3-433-03005-9. [Google Scholar]
  33. Empfehlungen des Arbeitsausschusses “Ufereinfassungen” Häfen und Wasserstraßen EAU. Deutsche Gesellschaft für Geotechnik e.V., 12. Auflage; Ernst Wilhelm & Sohn: Berlin, Germany, 2020; ISBN 978-3-433-03317-3. [Google Scholar]
  34. Lade, P. Triaxial Testing of Soils; Wiley Blackwell: Chichester, UK, 2016; ISBN 9781119106623. [Google Scholar]
  35. Bolton, M.D. The strength and dilatancy of sands. Géotechnique 1986, 36, 65–78. [Google Scholar] [CrossRef]
  36. Tak Kim, B.; Kim, N.K.; Jin Lee, W.; Su Kim, Y. Experimental Load–Transfer Curves of Laterally Loaded Piles in Nak-Dong River Sand. J. Geotech. Geoenviron. Eng. 2004, 130, 416–425. [Google Scholar] [CrossRef]
  37. Novak, M.; Aboul-Ella, F.; Nogami, T. Dynamic Soil Reactions for Plane Strain Case. J. Eng. Mech. Div. 1978, 104, 953–959. [Google Scholar] [CrossRef]
  38. Empfehlungen des Arbeitskreises “Baugrunddynamik”. Deutsche Gesellschaft für Geotechnik e.V., 2. Auflage; Ernst Wilhelm & Sohn: Berlin, Germany, 2017; ISBN 978-3-433-03210-7. [Google Scholar]
  39. Taylor, K.E. Summarizing multiple aspects of model performance in a single diagram. J. Geophys. Res. 2001, 106, 7183–7192. [Google Scholar] [CrossRef]
Figure 1. FE model geometric configuration and element types: (a) half model for quasi-static simulations; (b) full model for dynamic impact simulations.
Geotechnics 03 00062 g001
Figure 2. Simulation of the large oedometer tests conducted on crushed limestone specimens with the relative density (a) very dense and (b) loose.
Geotechnics 03 00062 g002
Figure 3. Simulation of the drained triaxial compression test conducted on very dense crushed limestone specimens under confinement pressures of 50 and 100 kPa; (a,c) stress–strain curves; (b,d) volumetric strain curves.
Geotechnics 03 00062 g003
Figure 4. Comparison of the simulated quasi-static test to the experimental data; load-deflection curves at the loading height.
Geotechnics 03 00062 g004
Figure 5. Simulation of the quasi-static test; results at a post deflection of 350 mm (a) soil deformation contours in the strong axis (b) development of plastic strains in the weak axis.
Geotechnics 03 00062 g005
Figure 6. Simulation results of the dynamic impact test under an impact energy of 3.2 kJ.
Geotechnics 03 00062 g006
Figure 7. Maximum post deflection at 72 ms (a) dynamic impact test conducted with 3.2 kJ (b) simulation using FE continuum method.
Geotechnics 03 00062 g007
Figure 8. Comparison of the simulated force-deflection curves to the experimental data under variations in the impact intensity.
Geotechnics 03 00062 g008
Figure 9. Evaluation of the post’s performance as a function of the parametric study variables.
Geotechnics 03 00062 g009aGeotechnics 03 00062 g009b
Figure 10. Proposed lumped-parameter model for the simulation of the soil–post interaction.
Geotechnics 03 00062 g010
Figure 11. Simulation results using the LPM under quasi-static loading and various impact intensities.
Geotechnics 03 00062 g011
Figure 12. Taylor diagrams displaying statistical comparisons of the simulated post response using different models to the experimental measurements.
Geotechnics 03 00062 g012
Table 1. Material parameters of the hypoplastic soil model for the crushed limestone KSS032.
DescriptionParameterValue
Critical state friction angle φ c [◦]35.7
Poisson’s ratio ν [-]0.35
Granulate hardness h s [MPa]42 × 103
Exponent gran. hardness n [-]0.22
Initial minimum void ratio e d 0 [-]0.251
Initial critical void ratio e c 0 [-]0.614
Initial maximum void ratio e i 0 [-]0.706
Pycnotropy exponent α [-]0.108
Barometry exponent β [-]1.10
Max. value of intergranular strain R [-]1.0 × 10⁻⁴
Stiffness multiplier (180°) m R [-]4.0
Stiffness multiplier (90°) m T [-]2.0
Exponent IGSβr[-]0.1
Exponent IGS χ [-]1.0
Initial void ratioe0[-]0.328
Table 2. Material model parameters and cross-section properties of the steel post.
DescriptionParameterValueSteel Post IPE120 (S335)
Elasticity modulus E [MPa]210.0 × 10³Geotechnics 03 00062 i001
Poisson’s ratio ν [-]0.28
Density ρ [g/cm3]7.85
Yield/Ultimate stress f y / f u [N/mm2]416/520
Strain-rate multiplier D [s−1]40.4
Strain-rate exponentn[-]5.0
Table 3. Input parameters for the Lumped-Parameter Model.
DescriptionParameterValue
P–y curves
Critical state friction angle φ c [◦]35.7
Relative density I D [-]0.80
Soil effective weight γ [kN/m3]21.3
Equivalent post diameter D e q u [m]0.12
Ohde coefficient v [-]500
Ohde exponent ω [-]0.7
Passive pressure mob. exponent b [-]1.5
Passive pressure mob. exponent c [-]0.7
P–y curve depth exponent n [-]0.5
Damping coefficient
Poisson’s ratio υ [-]0.35
Soil unit weight ρ [t/m3]2.13
Small-strain stiffness ratio G m a x / E s [-]4.5
Novak damping parameter S u 2 [-]2.0
Damping reduction factor x [-]0.01
Disclaimer/Publisher’s Note: The statements, opinions and data contained in all publications are solely those of the individual author(s) and contributor(s) and not of MDPI and/or the editor(s). MDPI and/or the editor(s) disclaim responsibility for any injury to people or property resulting from any ideas, methods, instructions or products referred to in the content.

