Article

Borehole Analysis with the Modification of RQD Value

by
Gábor Somodi
and
Balázs Vásárhelyi
*
Department of Engineering Geology & Geotechnics, Faculty of Civil Engineering, Budapest University of Technology and Economy, 1111 Budapest, Hungary
*
Author to whom correspondence should be addressed.
Geotechnics 2023, 3(4), 1017-1032; https://doi.org/10.3390/geotechnics3040055
Submission received: 24 August 2023 / Revised: 17 September 2023 / Accepted: 28 September 2023 / Published: 1 October 2023

Abstract

:
The most common classification method of drill cores is the Rock Quality Designation (RQD) value, which indicates the percentage of rock cores longer than 10 cm in a given core section. This core logging procedure is the basic parameter in the most useful rock mass classification methods like Rock Mass Rate (RMR) and Rock Mass Quality (Q). It is also used to determine the Geological Strength Index (GSI), which has become widely used in the last 20 years. One of the basic problems of the RQD value is that it does not distinguish different rock cores longer than 10 cm (100% is obtained for one piece of 1 m length and 10 pieces of 10 cm length) and a uniform result is obtained for shorter units. In this paper, the so-called Integrated RQD (Int_RQD) factor is introduced to eliminate these problems and to provide a better description of fracture density in the core logging procedure. As it uses the original core logging procedure, historical RQD data can also be reevaluated. Considering that RQD is an input parameter for most rock engineering classifications, these systems such as GSI can be reviewed based on the new RQD definition proposed herein.

1. Introduction

The nature of rock masses is determined by the geological evolution of the rock. As a result, various fracture intensities became a significant parameter in failure behavior besides the physical characteristics of intact rock. This requires the evaluation of the structure when determining the engineering properties of the rock.
The RQD (Rock Quality Designation) method [1] has become the predominant method for the analysis of rating and the quantitative analysis of drill cores and has become almost the only accepted method used worldwide today. It is also used as base data by the most widely used rock classification methods: Bieniawski’s RMR [2,3] and the Q-method introduced by Barton [4]. Rehman and co-authors [5,6] analyzed these rock mass classification methods focusing on the different input parameters, including the RQD value.
It can also be applied for determining the Geological Strength Index (GSI) of the borehole [7,8]. The Geological Strength Index (GSI) system is widely used for estimating the strength reduction from an intact rock to a rock mass, introduced by Hoek et al. [9]. It is a unique rock mass classification system used as part of the Hoek-Brown failure criterion for deriving the strength and stiffness of a rock mass [10]. The GSI can be estimated using a standard chart and field observations of rock mass fracture intensity and surface condition of the discontinuity.
The RQD can also be used for calculating the Geological Strength Index (GSI): on the basis of several studies, Hoek et al. [7] suggested the following simple formula for GSI calculation:
GSI = 1.5 JCond89 + 0.5 RQD
JCond89 (Joint Condition) rating defined by Bieniawski [3]—the maximum value is 30.
According to the definition, the determination of the RQD value was based on the drill core (with a minimum diameter of 55 mm) and the length of the extracted core samples. The metric itself gives the total length of the pieces longer than 100 mm as a percentage, i.e., the RQD value [1]:
R Q D = Σ h 10 h b h a 100 % ,
where Σh10 is the total length of the pieces longer than 10 cm, and hb and ha are the upper and the lower depths of depth intervals.
According to Deere [11,12], boreholes where the jointing surface is parallel with the borehole axis are also considered to be intact, and fresh fractures that clearly occurred during drilling also need to be ignored. The RQD value gives a realistic picture even in the case of poor core conditions, as these are caused by very high fracture intensity or weak rock. Table 1 shows the relationship between the RQD value and the rock test classes, based on practical observations. This table corresponds to the classification given in EUROCODE 7-1 [13].
RQD can also be determined from discontinuity frequency obtained from scanline sampling. Priest and Hudson [14] suggested a negative exponential distribution. According to their calculation, the relationship between RQD and a linear discontinuity frequency, λ is as follows:
RQD = 100−λt(λt + 1),
where t is the length threshold. For t = 0.1 m as for the conventionally defined RQD, Equation (3) can be expressed as [14]
RQD = 100−0.1λ(0.1λ + 1),
When data is available, both in terms of the number of joint sets and average spacing between joints of each joint set [13], the joint frequency is determined using Equation (4):
λ = n u m b e r   o f   j o i n t   s e t s a v e a r g e   s p e c i n g   ( m )
For values of λ in the range of 6–16 m−1, the following linear equation can be used:
RQD = 110.4 − 3.68λ
The relations obtained by Priest and Hudson [14] between measured values of RQD and λ, and the values calculated using Equation (4) are shown in Figure 1.
The curves of the theoretical RQD against values of λ (0–50) for various threshold values t, using Equation (3) are plotted in Figure 2. The figure demonstrates the disadvantages of both the RQD additive principle and the threshold value principle. The curves show that the larger the threshold value t, the steeper the drop of the RQD as a function of k. This is because smaller core pieces are disregarded. However, as the threshold value decreases, the drop of RQD becomes flatter. This is because all the shorter cores are now taken into account, although their number and, consequently, the number of fractures are not included. It can be argued that using some middle threshold value, such as 0.1 m, or selecting an appropriate threshold value for a given rock mass compensates these disadvantages [15].
Both the geophysical and geotechnical parameters are influenced by the same structural heterogeneity and the geological properties such as rock type, degree of weathering and water content, fractures/faults, porosity, and permeability [16,17]. As a first approximation, it can be assumed that the acoustic wave propagation time in the rock matrix is constant, i.e., wave propagation time is essentially a function of the mechanical state of the rock and depends only slightly on its chemical composition. Apart from seismic properties, the electrical resistivity of rocks is also well-distinguished, because in fractured rocks it derives from joint network and clay mineralization [17,18]. Compared with the traditional geotechnical approaches, geophysical methods provide non-destructive volumetric measurement, in a fast, user friendly and inexpensive way [19,20].
The RQD value was first defined for rock core logging, and later extended to rock surfaces analysis [21,22]. In this paper we focus exclusively on rock core analysis. Deere and his co-authors suggested using this value for calculating the rock load factor and the width of the opening [23,24] of the tunnel design. The method has the advantage of being quick and simple—support predictions of the tunnel based on RQD are easy to perform and they give a first indication of the support requirements based on information gathered from borings.
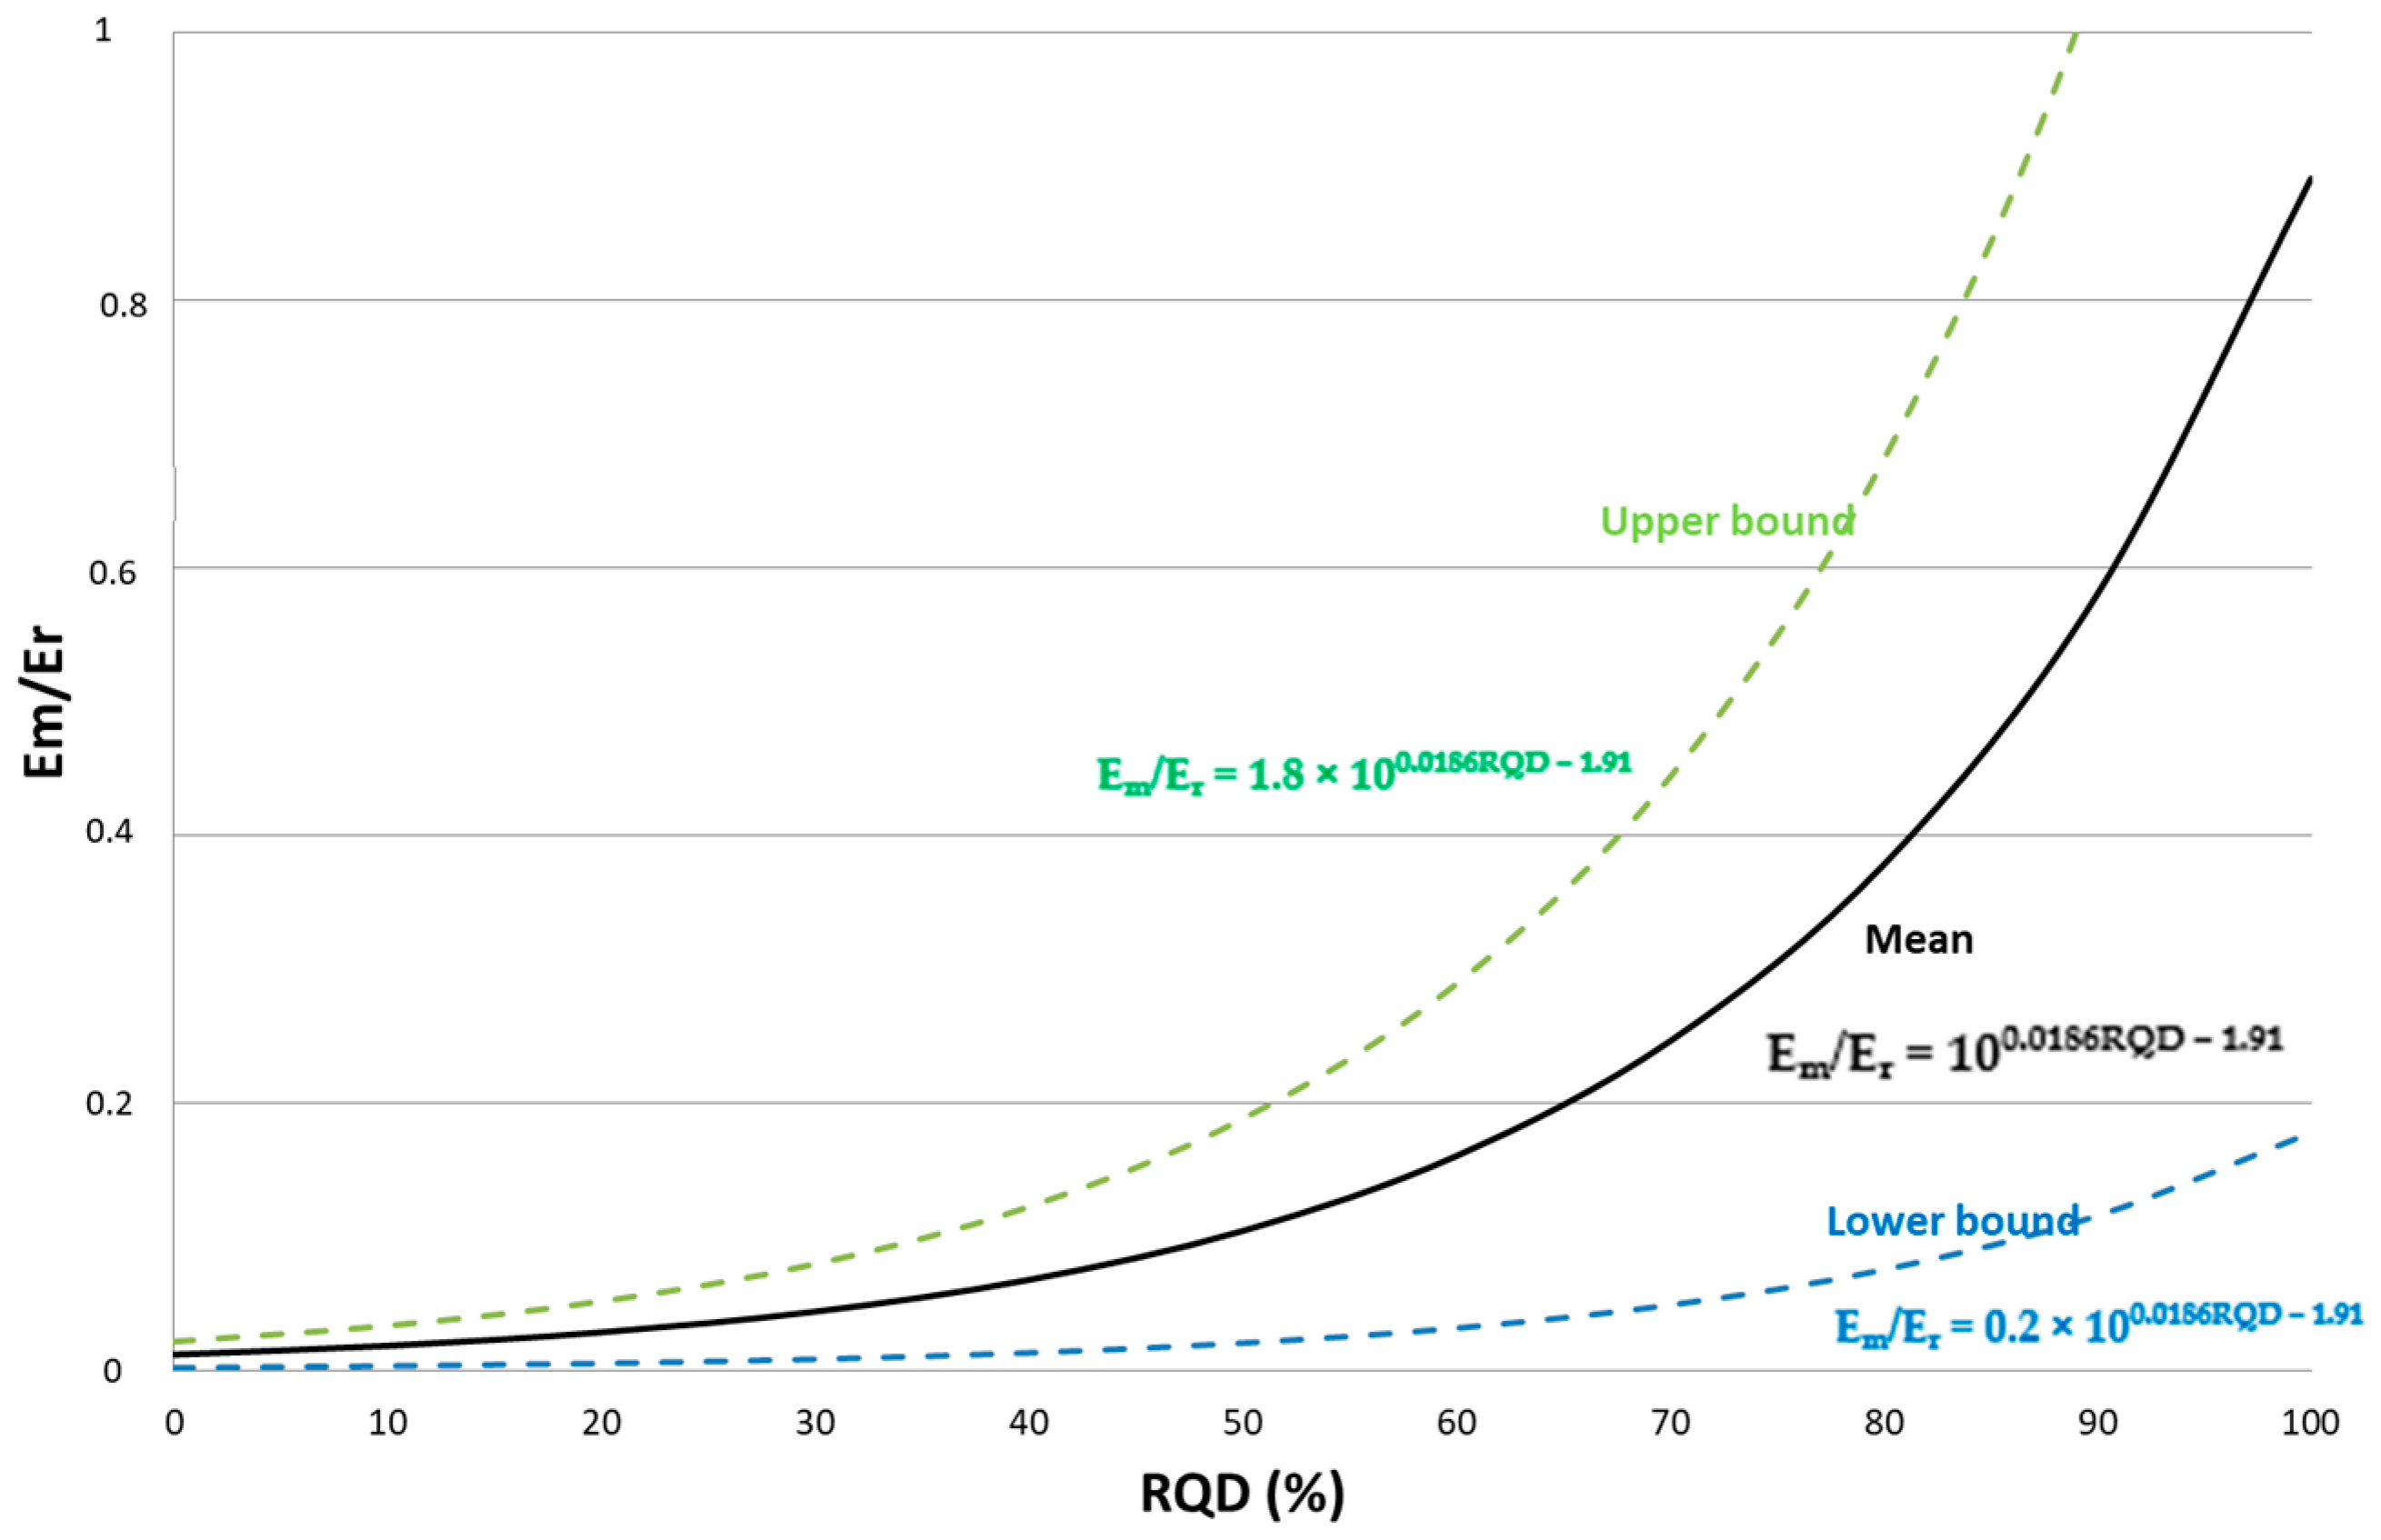
This value can be used for estimating the deformation moduli of the rock mass [25,26]. Zhang and Einstein [26] calculated the relationship between RQD and the ratio of deformation moduli of rock mass (Em) and the intact rock (Er). By processing a large number of measurements, they determined the following relationships (see Figure 3):
  • Lower bound:
Em/Er = 0.2 × 100.0186RQD−1.91
  • Upper bound:
Em/Er = 1.8 × 100.0186RQD−1.91
  • Mean:
Em/Er = 100.0186RQD−1.91
The figure shows that at 100% RQD there can be up to fivefold difference between Em/Er values. This can be explained by the different borehole lengths.
This value can be used for estimating both the deformation moduli [24,25] and the strength [26] of the jointed rock mass, among others [26,27,28,29]. Ván and Vásárhelyi [30] suggested that it could also be used as a damage model.
It is important to note, however, that a minor professional debate about the usefulness of the RQD factor has been ongoing for decades, with the result that some have ‘ditched’ (or at least wanted to ditch) this factor [31]. According to the arguments of Pells et al. [31] the difficulty in correlation is that RQD is a one-dimensional measurement based only on core pieces longer than 0.1 m, which means that the application of RQD in rock engineering may lead to inaccuracy. The incorporation of this parameter within the two systems was a matter of historical development, and its use in this classification system is no longer essential [31].
A study of Su et al. [32] demonstrated the capabilities of deep learning algorithm in core image segmentation, which can easily be extended to more applications and enhances the accuracy of engineering requirements. Their method enables efficient RQD calculation for geological engineers, taking only 15% of the time of manual measurement. However, it is questionable whether the fractures caused by handling or drilling can be identified and ignored when determining the RQD value with deep-learning.
The use of RQD to create a discrete fracture network model is also a well distinguished question and calculations in 3-D space are useful for reflecting the variations in different orientations [33].
Li et al. [34] introduced the corrected RQD (RQDc) as follows:
RQDc = p r N a
where pr is the percentage of solid core recovery, SCR (0–100), N is the number of cores in a core run, and a is the exponent of the power function. The exponent is a variable and must be determined on a case-by-case basis. Through trial and error, it was concluded that the best approximate fit for the considered data for exponent is 0.26 [20].

2. Disadvantages of the RQD Method

The first interpretation has a very strict rule which says that we only need to take 10 cm-long cores into account. It seems a very simple rule; however, RQD is strongly influenced by the relative orientation of the borehole (or scanline) with respect to the orientation of the fractures. It also means that the traditional method of obtaining rock quality designation (RQD) cannot fully reflect the anisotropy of the rock mass thus cannot accurately reflect its quality [32,33].
Palmström’s [33,34] analyzed the shortcomings of the RQD factor in detail, describing the dependency of orientation and the inconsistencies in the original definition. Pells et al. [31] pointed out that even though the greatest source of differences in core-logged RQD values arises from professionals, in certain parts of the world the hard and sound criterion in the definition is ignored and that’s why in many countries the definition is no longer consistent with the original methodology and logic fits creator. Azimian [35] emphasized the problems with piece length and discontinuity orientation, which do not affect the values, and suggested a new method, RQDI that represents a more reliable and accurate rock quality value, although RQDI requires much more core logging time and effort with higher accuracy for more details. It must be emphasized that due to its disadvantages and the sophisticated tunnel face mapping procedure to determine RQD, it has been replaced by fracture frequency parameter in the revisions of RMR (RMR13 [36], RMR14 [37], RMR19 [38]).
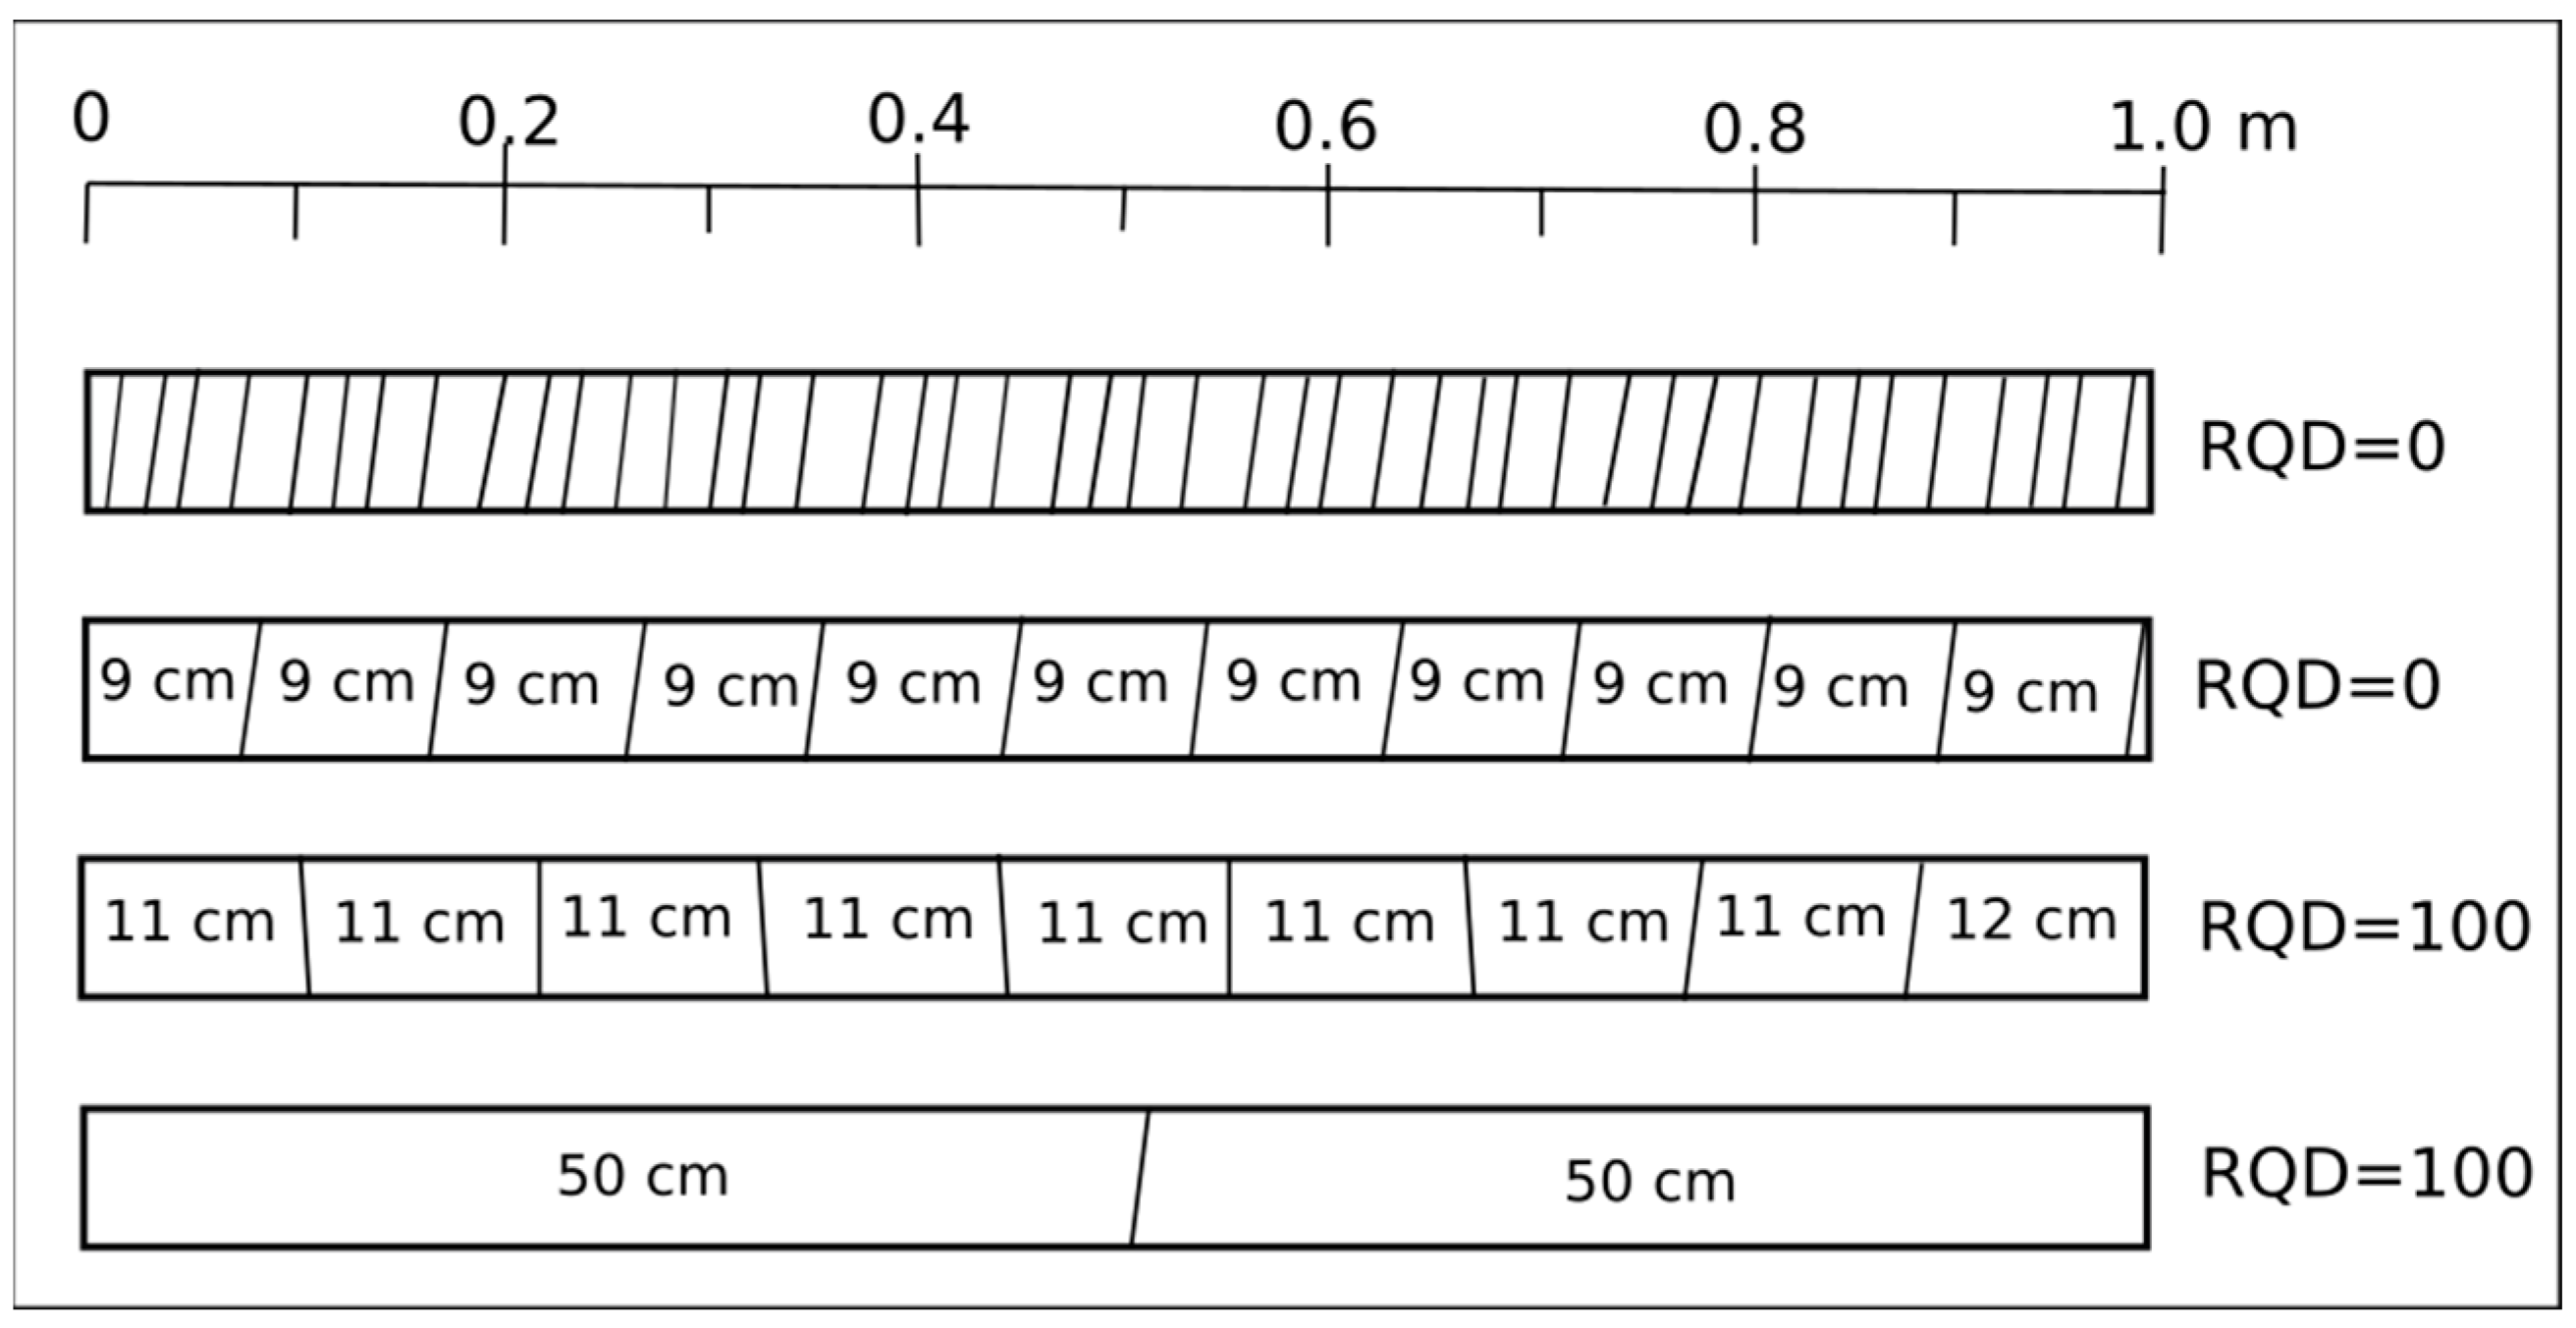
Figure 4 shows the measurement results of Palmström [39], pointing out errors of using this value: as can be seen in the figure, there can be a significant difference between the actual jointing picture of a drilling section with RQD = 0% and a drilling section with RQD = 100%. As illustrated in the figure, RQD = 0% can be obtained both when the core is completely fractured and when the length of the intact cores extracted is just under 10 cm. When the distance (intercept) between joints is 9 cm or less, the RQD is 0, whereas RQD is 100% when the distance is 11 cm or more. Thus, it gives no information on the core for pieces < 10 cm; i.e., it does not matter whether the discarded pieces are earth-like materials or fresh rock pieces up to 10 cm length.
The question arises: how can the problem raised by Palmström [40] be addressed? This is proposed by introducing an integrated RQD value which is demonstrated through a study of exploratory boreholes from the host rock of the Hungarian National Radioactive Waste Repository.

3. Investigated Rock and Data

The analyzed data originated from exploration boreholes drilled in the Carboniferous Mórágy Granite Formation (MGF), selected as host rock of the repository of low- and intermediate-level radioactive wastes [41]. After underground investigation and construction phases the operation phase started in 2012.
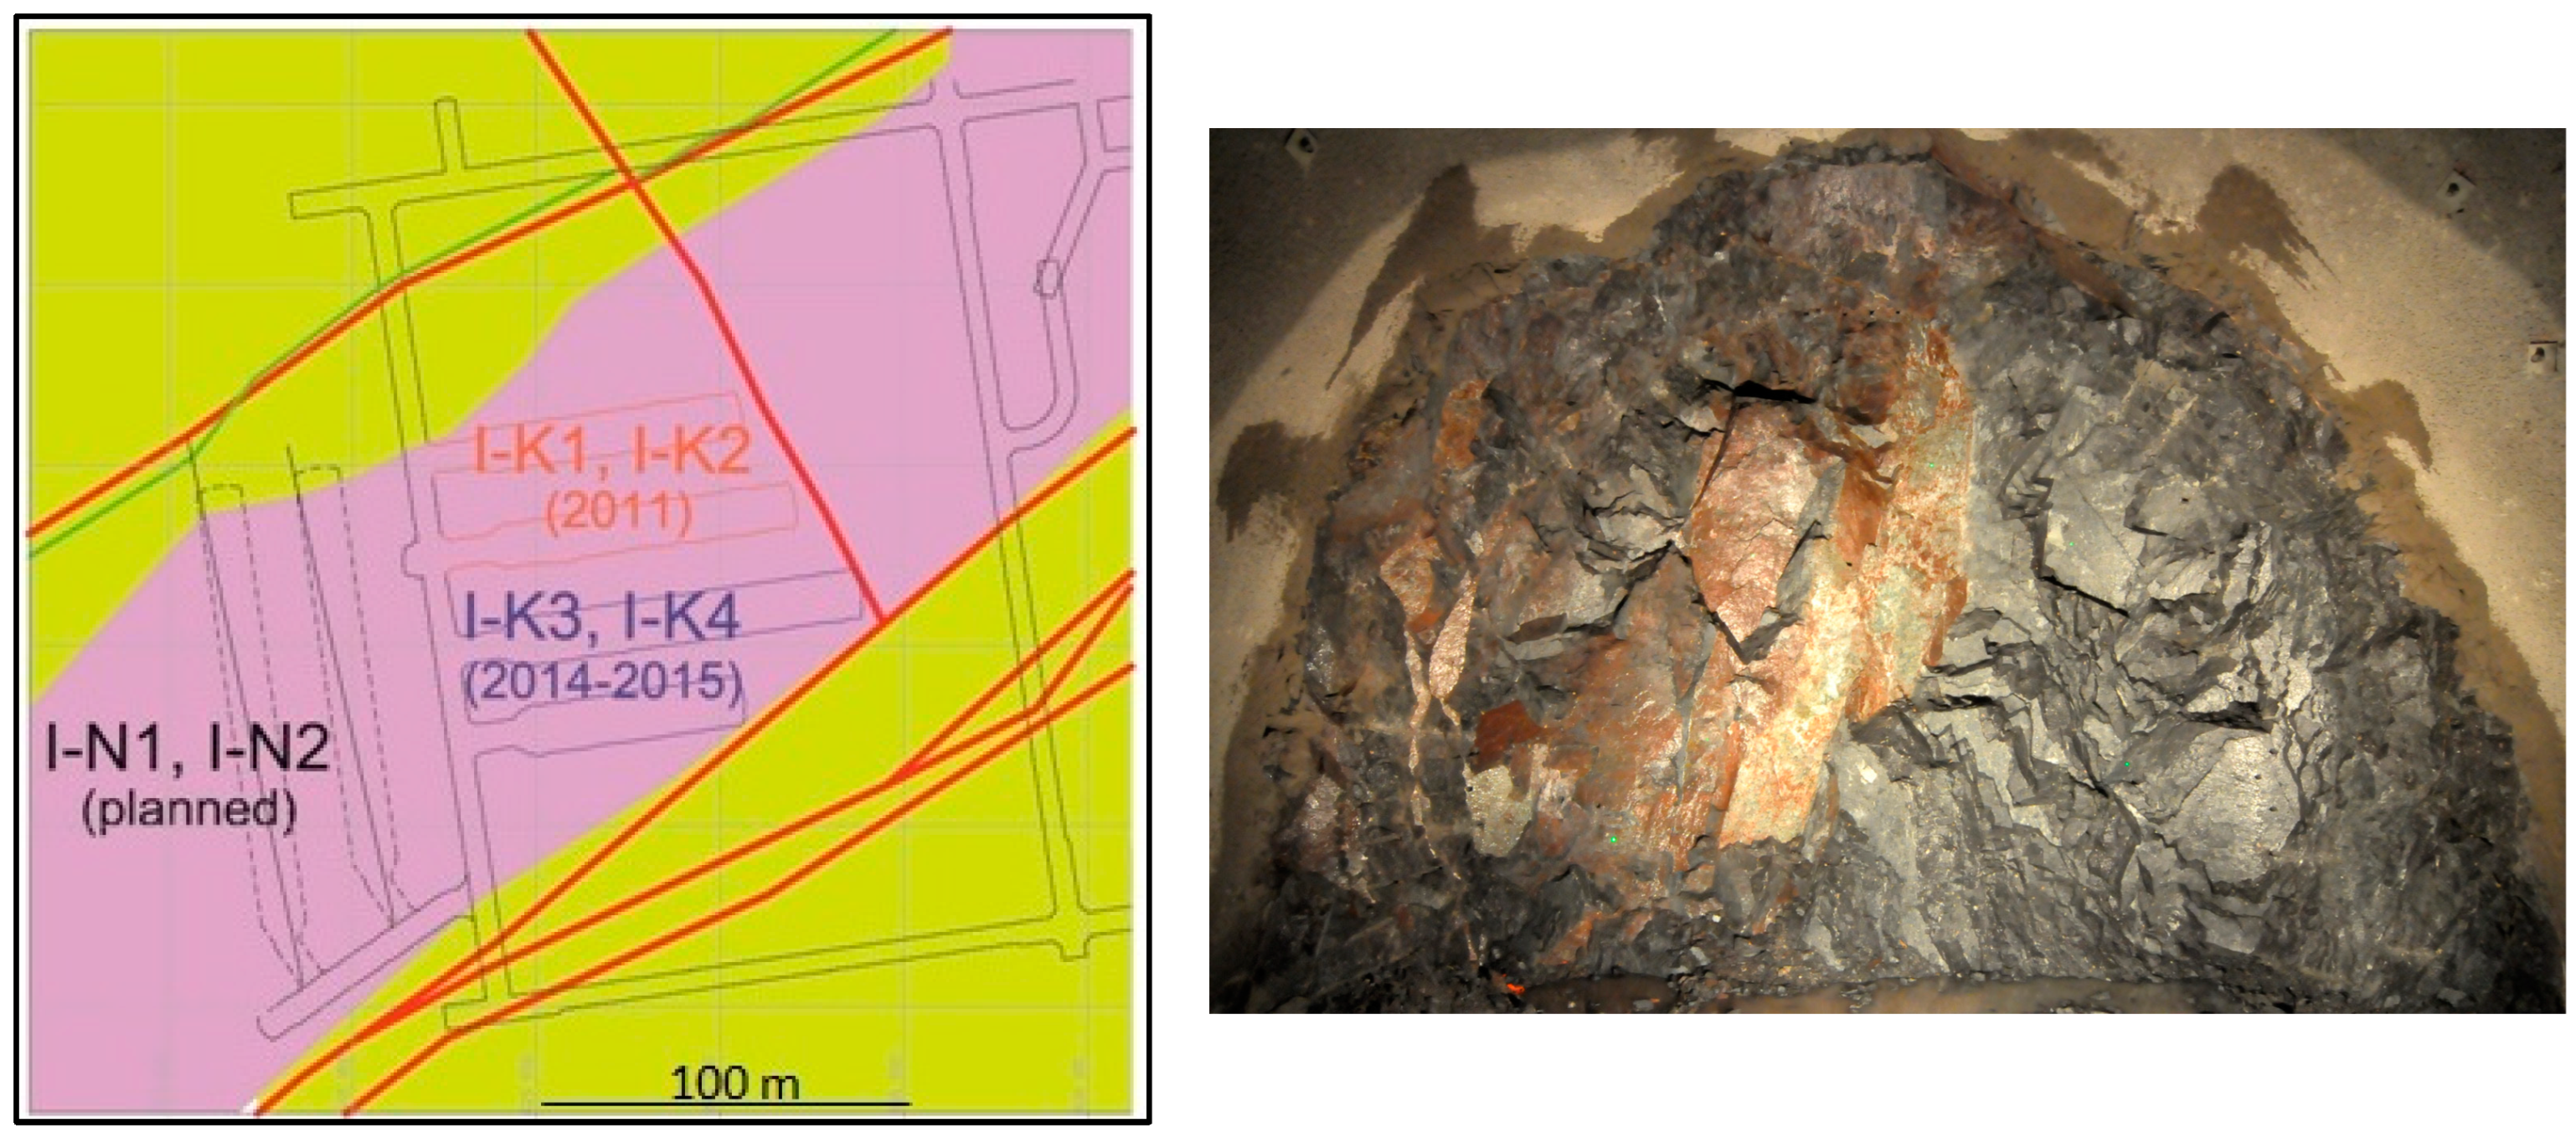
The Bátaapáti radioactive waste repository is found in a slightly metamorphosed granitoid rock type of Carboniferous age, the Mórágy Granite Formation in South Hungary (Figure 5). The tectonic and metamorphic evolution of the granite formation can be well presented in the geologic map of the repository surrounding (Figure 6).
In petrological terms, this formation is an igneous rock body which is composed of diverse granitoid subtypes, mainly monzonite and monzogranite. Feldspar and quartz-rich leucocratic dykes belonging to the late-stage magmatic evolution. Late Cretaceous trachyte and tephrite dykes crosscut all of the previously described rock types. In general, fractured but fresh rock is common which is sparsely intersected by fault zones with few meters thick clay gauges. Intense clay mineralisation in the fault cores indicates a low-grade hydrothermal alteration. In general, the intensity of water inflow has also increased around the faults zones but clay gauges usually behave as hydrogeological barrier. The most fundamental tectonic feature of the area is the braided sigmoidal structures from macroscale to microscale. These form a complex fracture network. The distribution of open and closed fractures is similar to that of all fractures, with minimal differences in emphasis. It was also found that it is not possible to identify typical fracture filling materials that can be classified into tectonic phases but correlation between fracture directions and infilling thickness and quality exists [41,42]. There may be significant differences between the fracture distribution and fracture intensity depending on the investigated deformation segment of the study area [43,44,45,46].
During the 2002–2003 surface exploration phases, 23 boreholes were drilled. Eight of them were of depths between 300–411 m. In underground research program, 100–150 m long research boreholes were drilled in the axis of tunnel driving or in other directions with the aim of geological, hydrogeological, geotechnical research concepts. These research boreholes had very detailed geological description. In engineering geology aspects, original rock mass classification systems were applied as RQD, RMR, Q, GSI, and this data was the basis of structural design and it provides valid information for construction and geotechnical monitoring [43,44,45,46].
Systematic sampling of boreholes for laboratory rock mechanics tests was intended to determine the matrix parameters of intact rocks. Both high number of uniaxial compressive tests and triaxial tests were carried out to obtain the rock mechanical parameters [47,48,49]. The most important average rock mechanical parameters are summarized in Table 2.
According to the results, the formation has high strength and elasticity properties. However, due to the geological and tectonic history of the Mórágyi Formation described above, the rock mechanics-geotechnical parameters are extremely inhomogeneous, thus their spatial extension on the site is rather limited. One of the primary factors in this limitation is the presence of the wide, clayey fracture zones.
According to [42,47], the frequency distribution of RQD data from borehole is multimodal for all rock types. The rocks are heterogeneous in their RQD distributions, and the range of distributions is wide. Some of the variability in the confidence intervals for the mean is due to the different mechanical behavior of the rock types as it is interpreted in [43,50]. Monzonite shows lower fracture intensity than the other rock types. Aplite and trachyandesite are distinguished from other rock types by their highly fractured behavior. Based on the homogeneity test of the fracture pattern, rocks can be divided into four groups (monzogranite, monzonite, hybrid, vein-type). Observations confirmed that a wide, clayey fractured zone is to be expected in all rock types. In the results of [43,50], the spatial variability of RQD from borehole investigation is larger than RQD from underground excavation surfaces. The spatial distribution picture of the repository was dominated mostly by tectonic patterns and rock domain with lower fracture intensity [51].
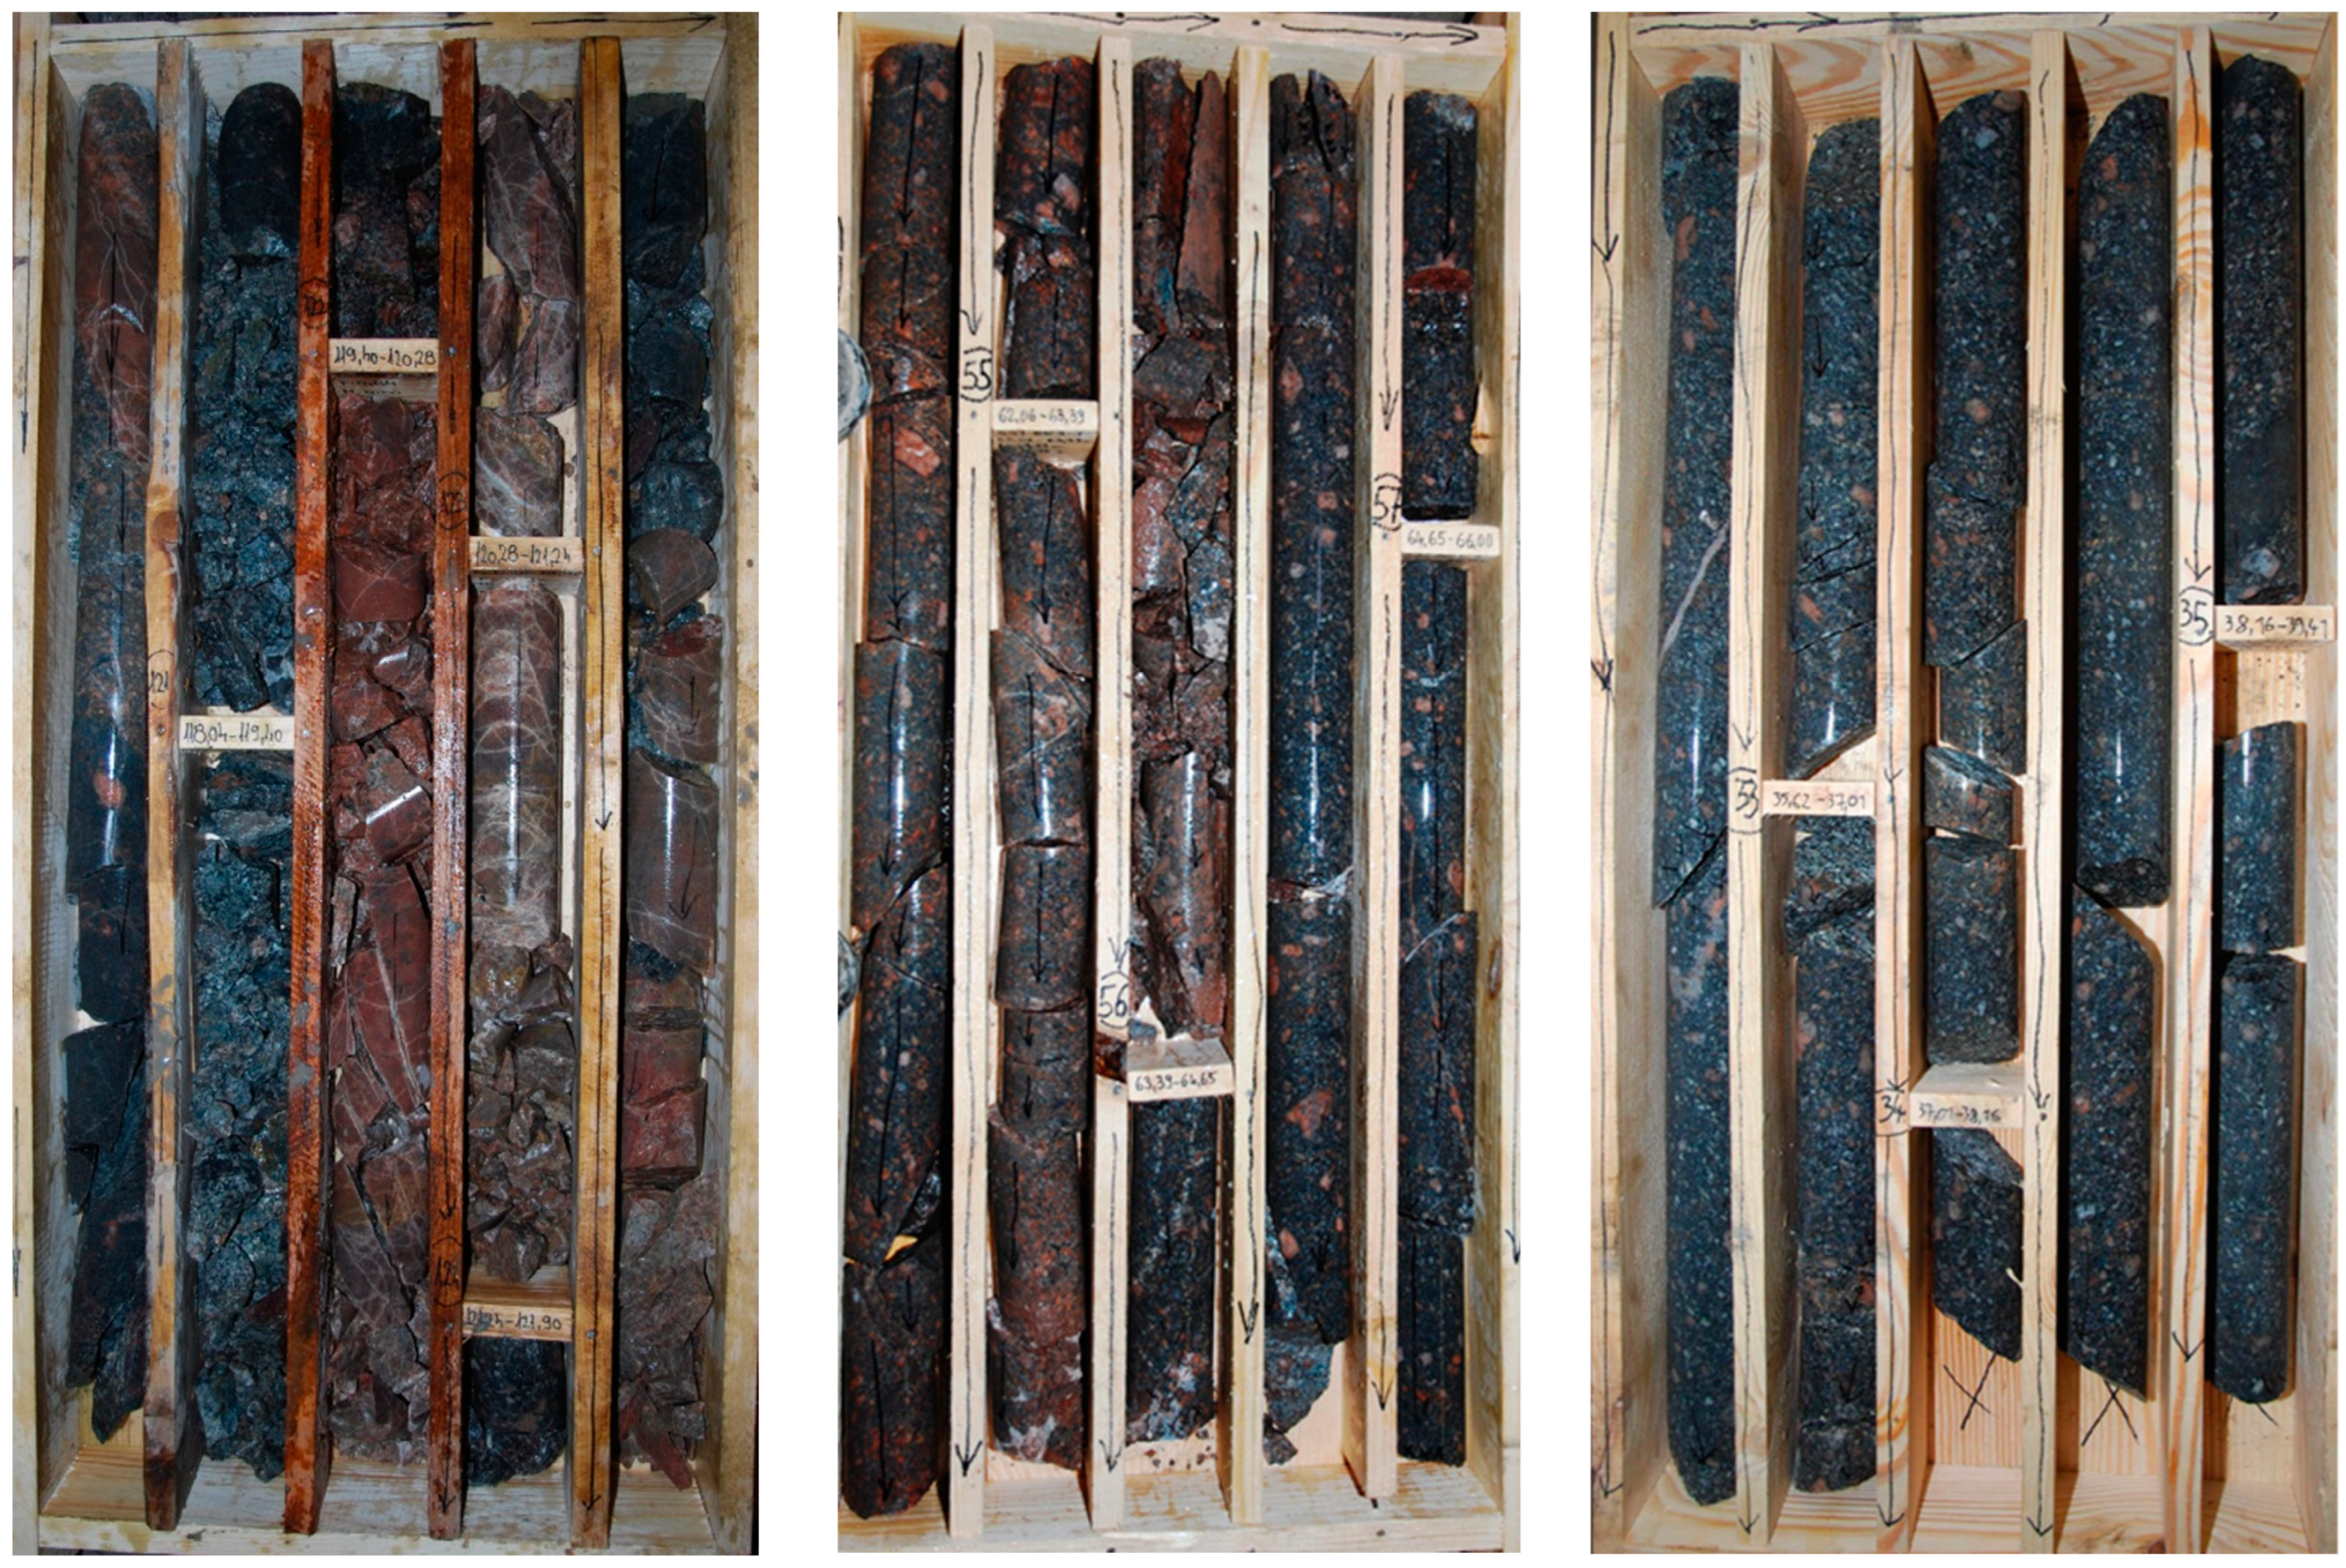
Further analysis of the boreholes is essential for subsequent design and construction works and analysis of RQD definition can be implemented on these rock cores for the reason of sufficient description of the whole site. Figure 7 shows rock core photographs demonstrating typical fractured conditions of the cores drilled in monzogranite type rock.
The length of sampling line of RQD determination was always between 1 to 3 m, depending on the change of fracture intensity and homogeneity. Discontinuities were recorded manually by well-trained geotechnical engineers and geologists; core length was given by using surveyor’s tape. The evaluation and interpretation was the part of RMR and Q classification.

4. RQD and the Length of Core Pieces

Equation (11) can also be written by looking at the total length of a piece of core of arbitrary length along the given section, i.e.,:
R Q D n = Σ h n h b h a 100 %
where Σhn is the total length of the pieces longer than n cm, and hb and ha are the upper and lower depths of the depth intervals.
The value of n in this equation can be arbitrary, but for engineering reasons, we have examined the total length of 10, 20, 30 … 100 cm pieces of core after 5 cm. It is important to point out that the length tested could be up to 3 m, since it was taken as one unit based on the same conditions. That is to say that the given RQD factor is not a value considered for a 1 m section, so it is possible that the 1 m total core recovery gave a result of only 30% for the given RQD section.
The formula clearly shows that it is possible to distinguish between the results of e.g., 3 core recovery of 10 cm (RQD10 = 30%; RQD20 = 0%; RQD30 = 0%) and 1 core recovery of 30 cm (RQD10 = 30%; RQD20 = 30%; RQD30 = 30%).
Figure 8 shows some of these cases. The data are taken from geotechnical evaluations of core material from exploratory drilling of the radioactive waste repository at Bátaapáti.
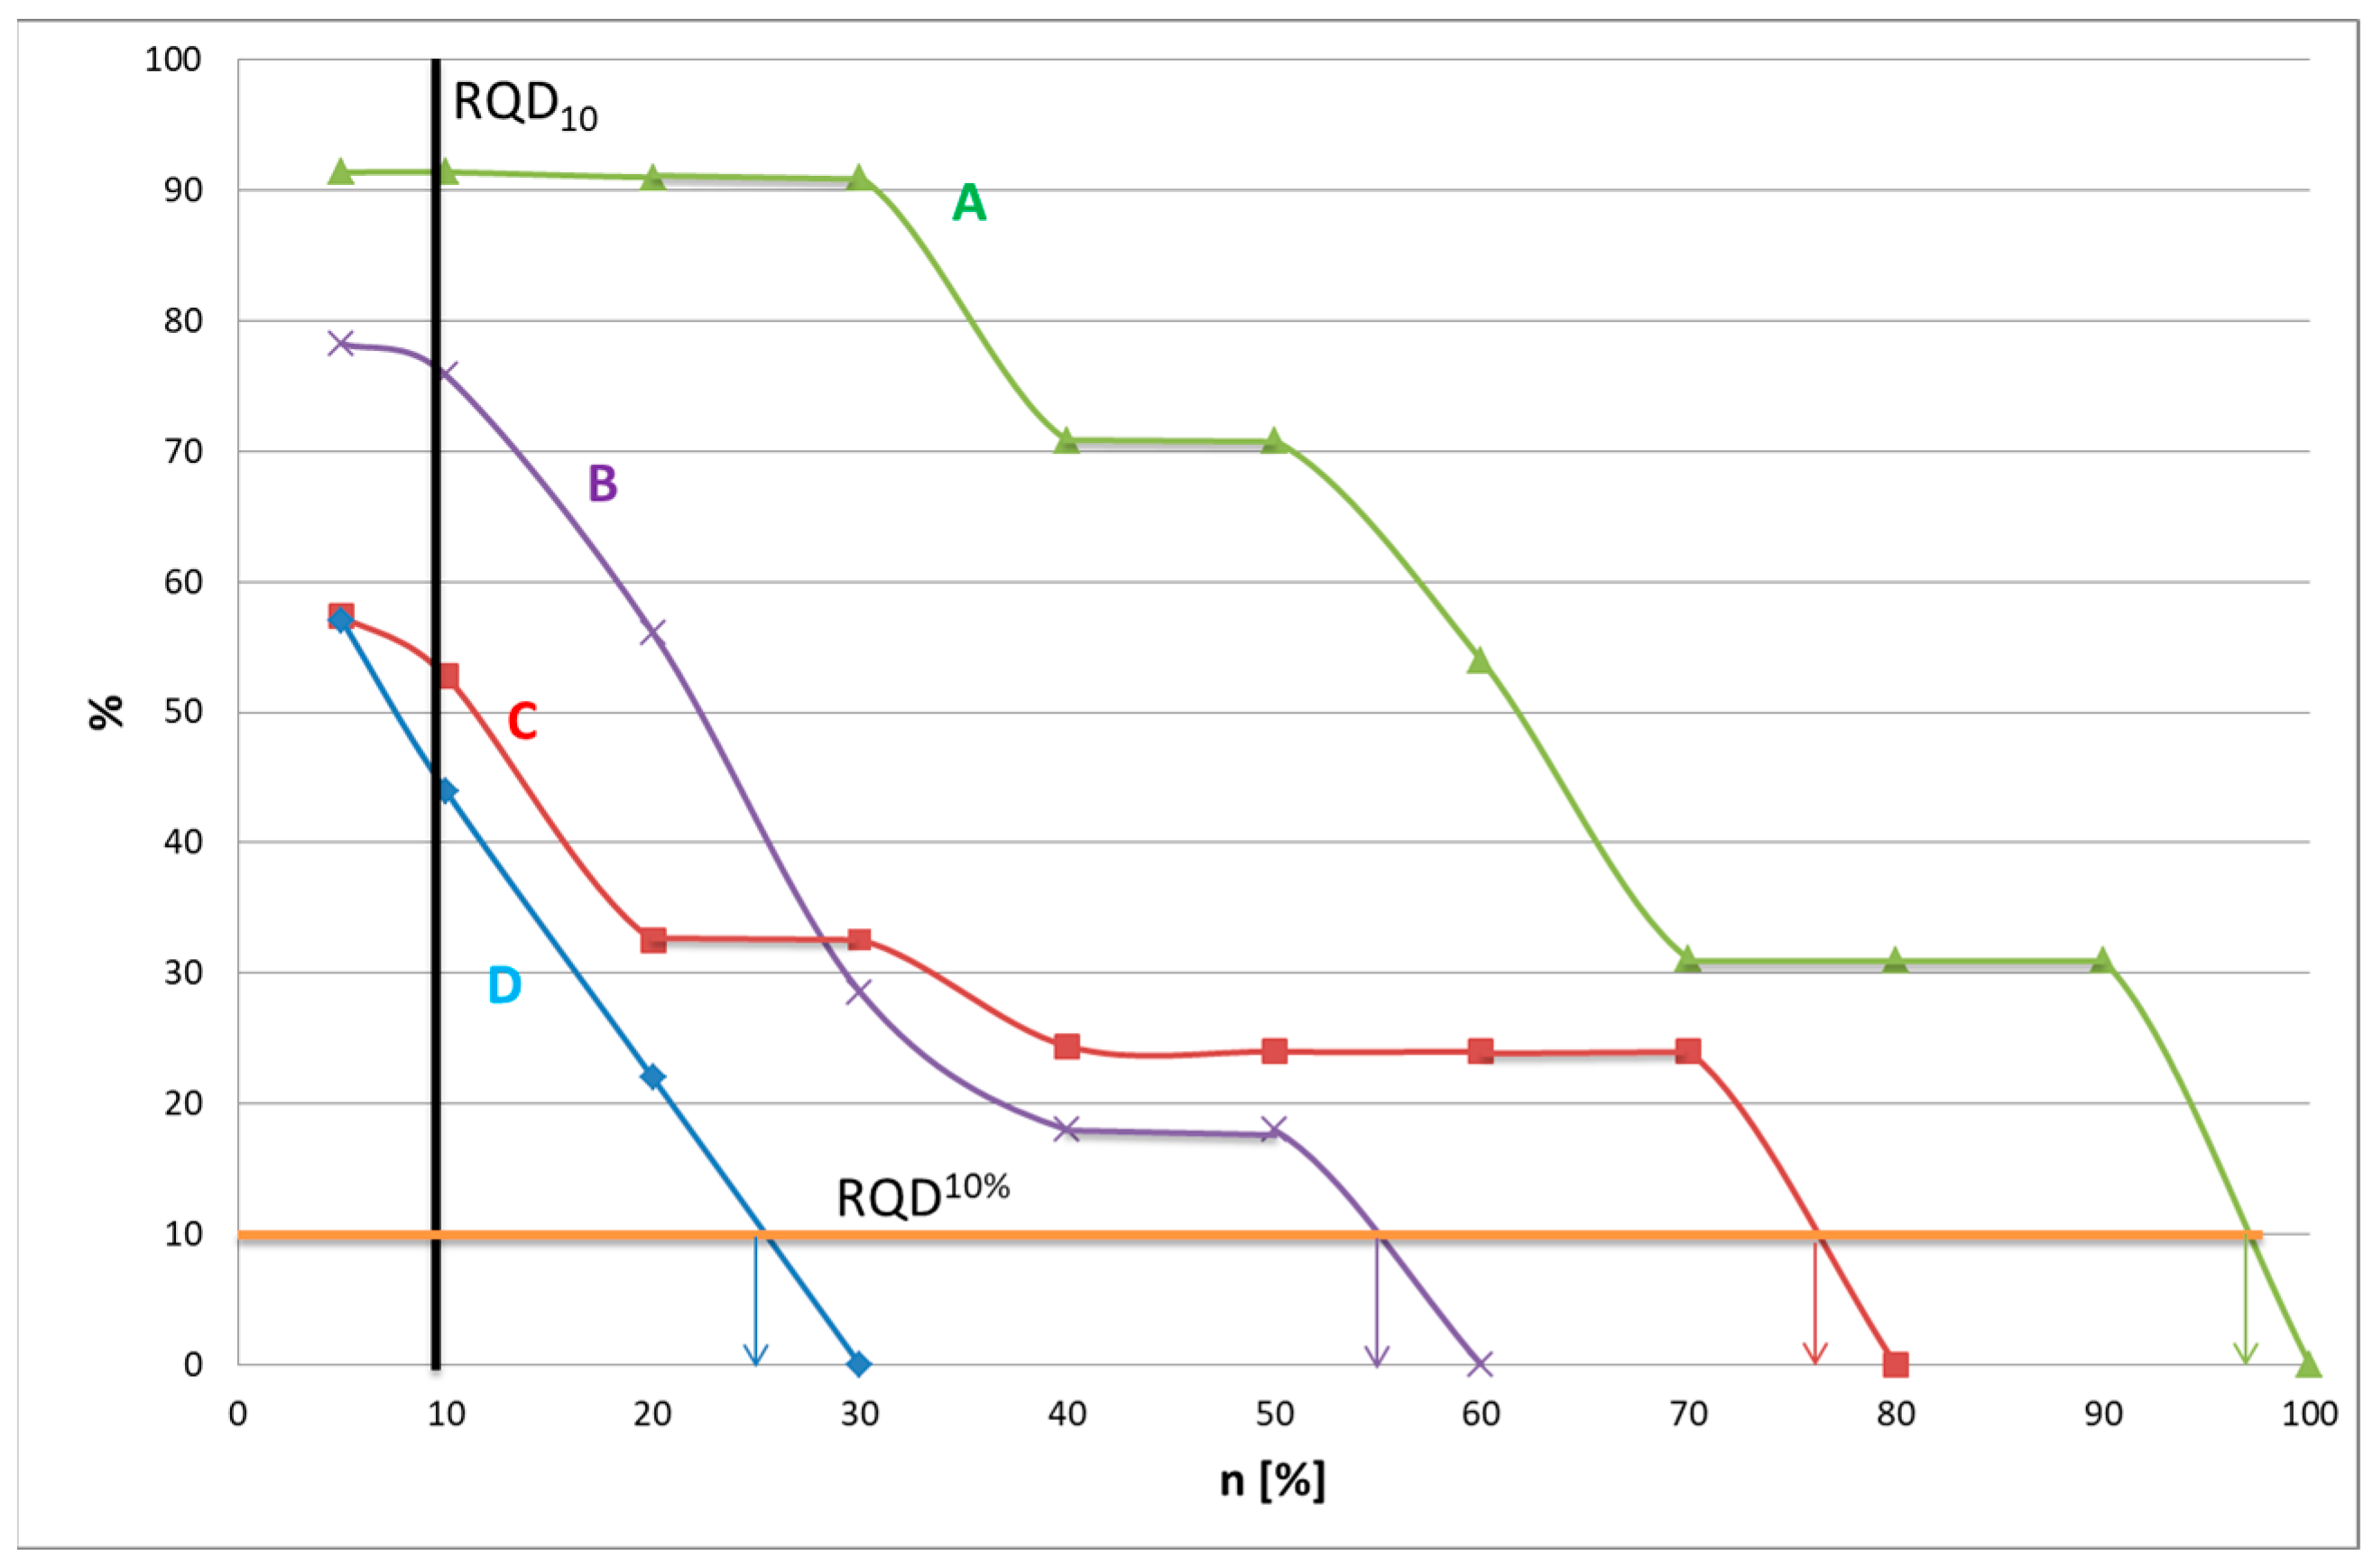
The curves show clearly whether a given RQD value is associated with longer or several shorter core sections, and also that the order of fragmentation of the sections varies for different RQDn values. Some of the RQDn values (n = 5; 10, 50 cm) are summarized in Table 3. The shape of the curve gives a good indication of the quality of the rock and the size of the blocks. It is easy to see which size of block is predominant in the studied section. In case of a geotechnical drilling program, it is possible to characterize the core sections and classify into groups on the basis of plotting RQDn % values.
In Figure 8, the 10% probability size is also marked separately—using RQD10% symbol (see orange line). It can be seen that while the RQD value is larger in case B than in case C, this 10% limit is associated with longer core pieces in case C.
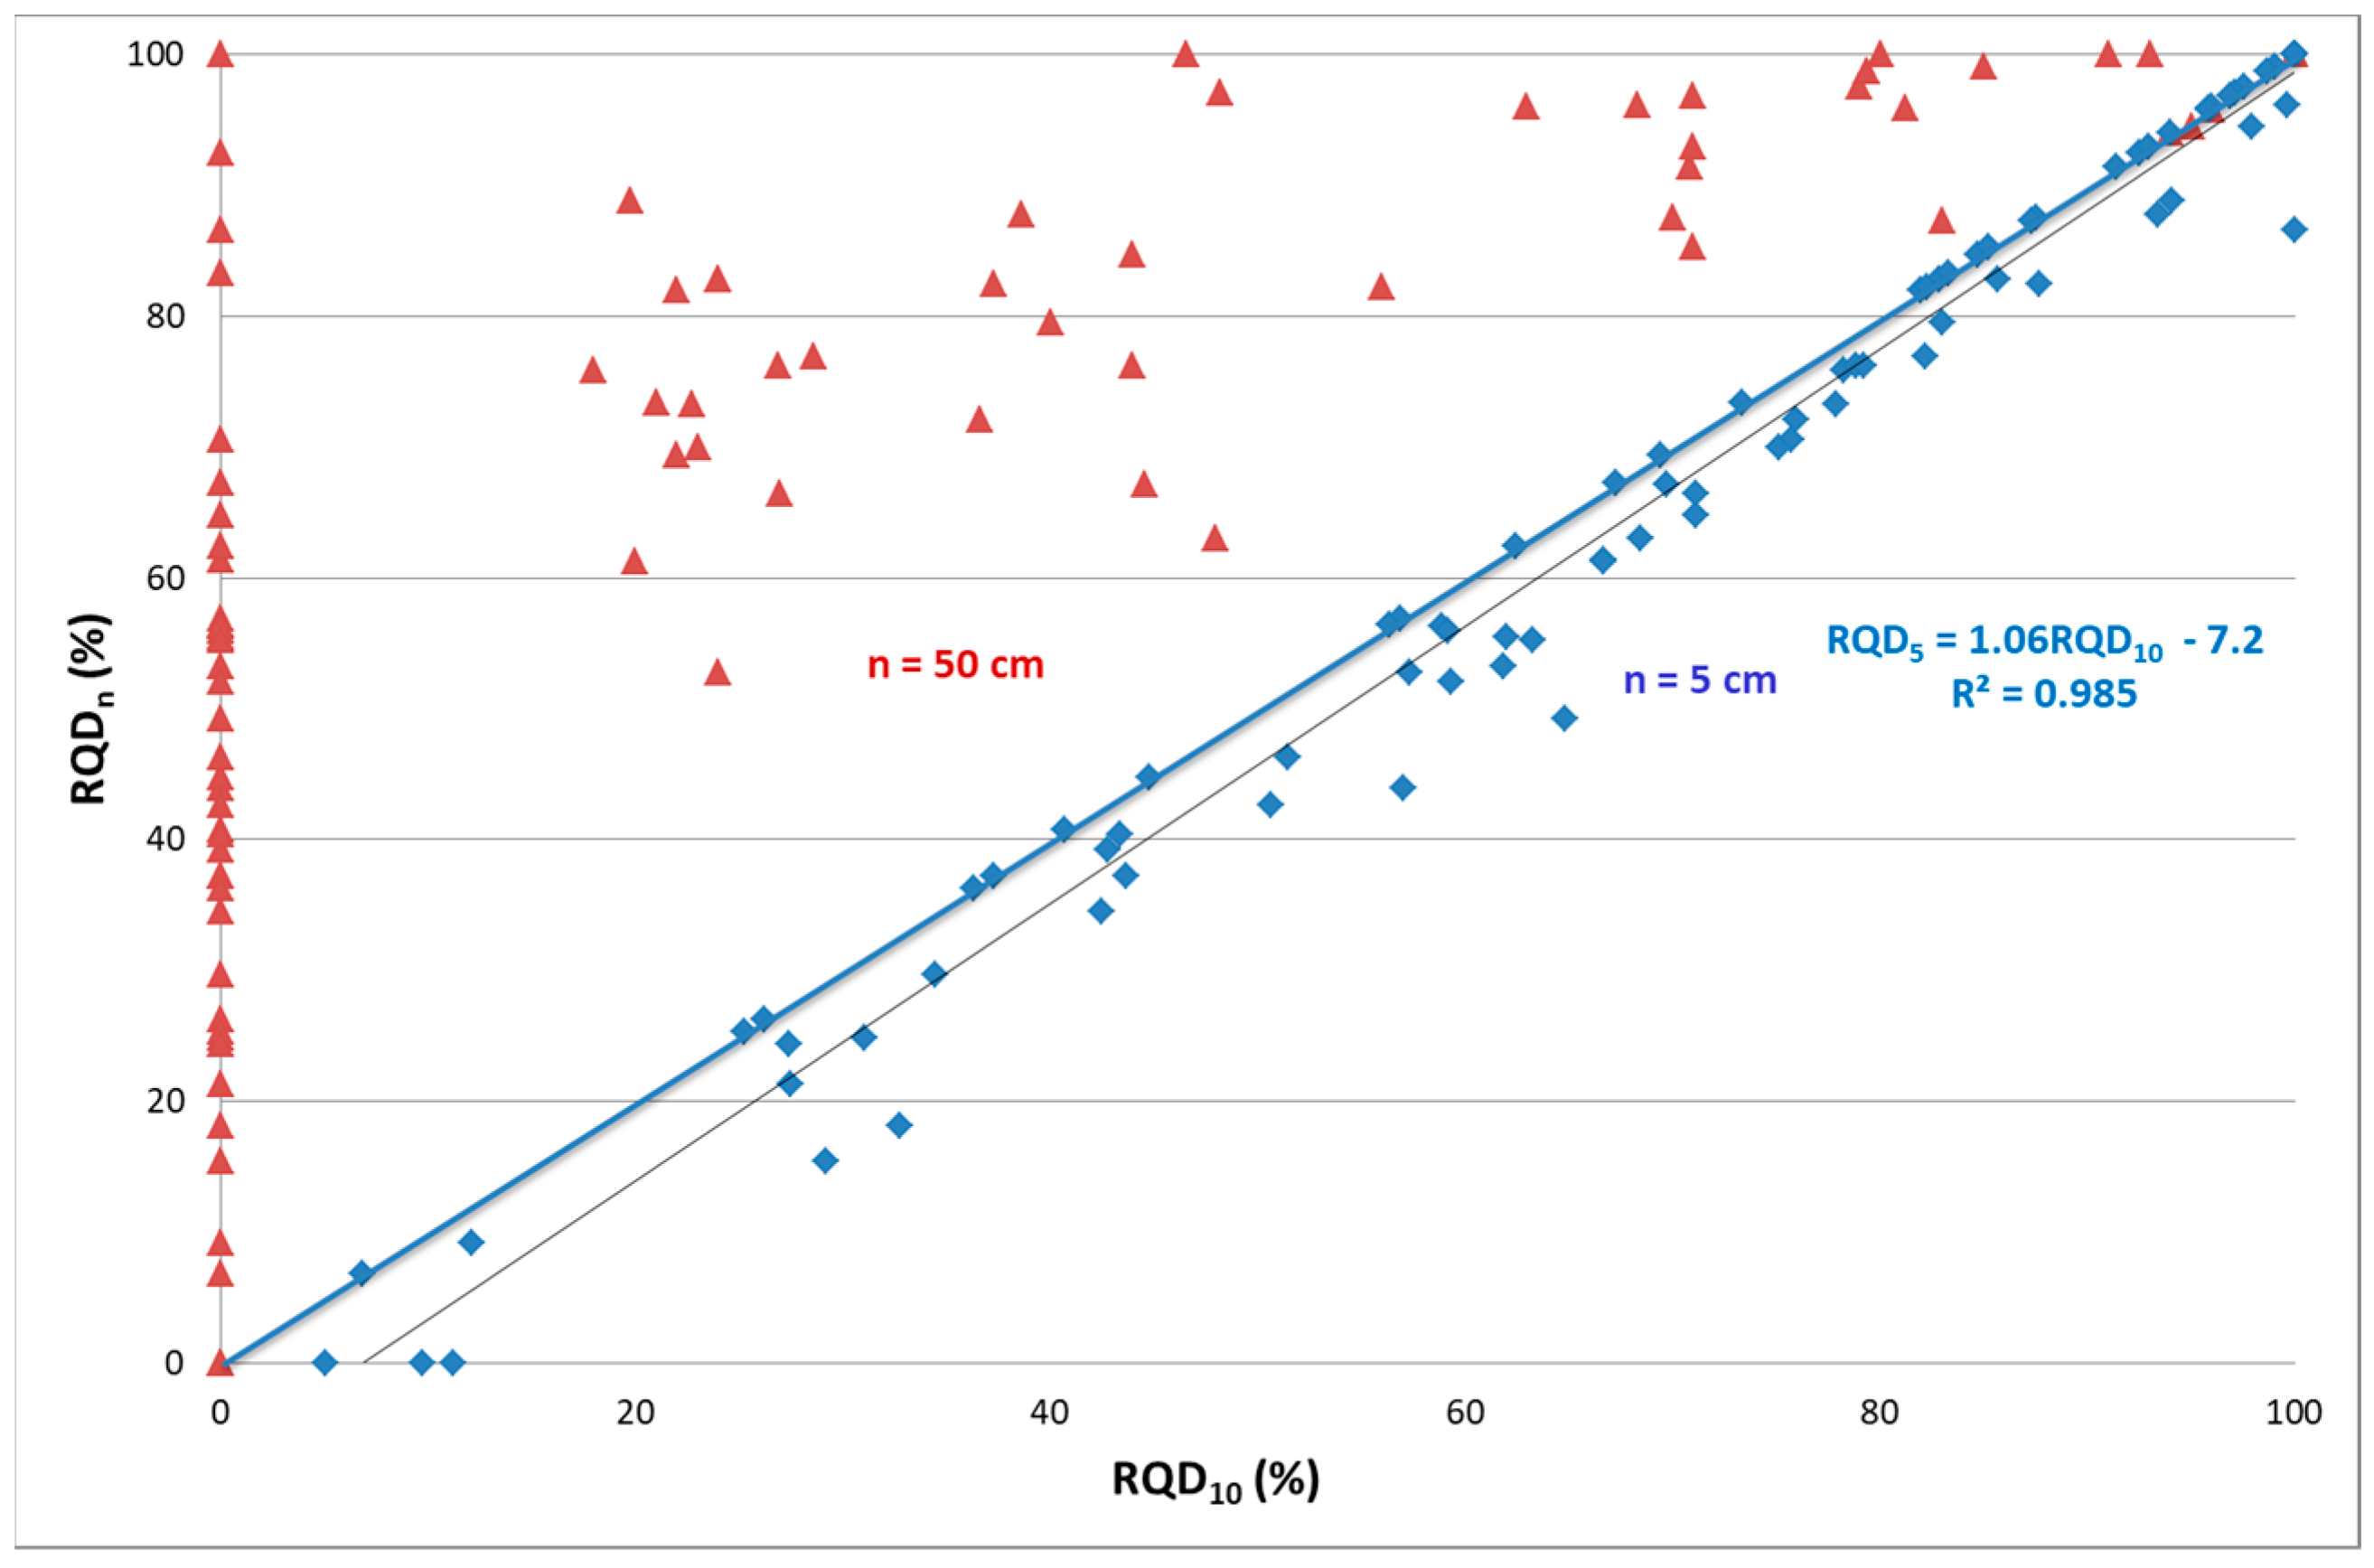
Figure 9 shows how the RQD values interpreted for the original 10 cm length compare with the core lengths evaluated under the new approach. Figure 10 introduces a very close relationship between the smallest core lengths of 5 cm and the original RQD values. The RQD values interpreted for the 50 cm core length and the RQD values as originally defined are much more divergent, and the closeness of the relationship is questionable. Such a figure may also characterize rock type properties for site investigation evaluations.

5. Implementation of Integrated RQD

Figure 10 shows how the RQD values interpreted for the original 10 cm length compare with RQDn. The functions produced by the introduction of length-dependent RQD (see Figure 9) provide the opportunity to develop a unique evaluation method. If length-dependent RQD values are produced for each section, the area under the function varies individually and the resulting Integrated RQD (Int_RQD) value provides a wider range of classification options for characterizing the fragmentation of the rock mass. To calculate the area, Int_RQD was determined by integration (the calculated values are expressed in x0.01%). The function and thus the Int_RQD do not require the exact downhole positions to be determined, but is recommended for future evaluation and re-evaluation.
The figure clearly shows that significant deviations can occur in the range above RQD10 > 50 and that this does not occur systematically in one direction. These results may reflect the principle of RQD section length and the homogeneity of the MGF is divided. It also shows that there is chance for using integrated RQD or RQDn for characterizing the rock mass in a different aspect.
Figure 11 shows the closeness of the relationship between the new interpretation and the traditional RQD calculation. Statistically, the relationship between the RQD10 [%] and Int_RQD values is:
Int_RQD = 1.563 e0.04RQD10
Logarithmic relationship was found between the Int_RQD and RQD10 values (see Figure 12).
RQD10 = 22.61 ln(Int_RQD) − 4.04
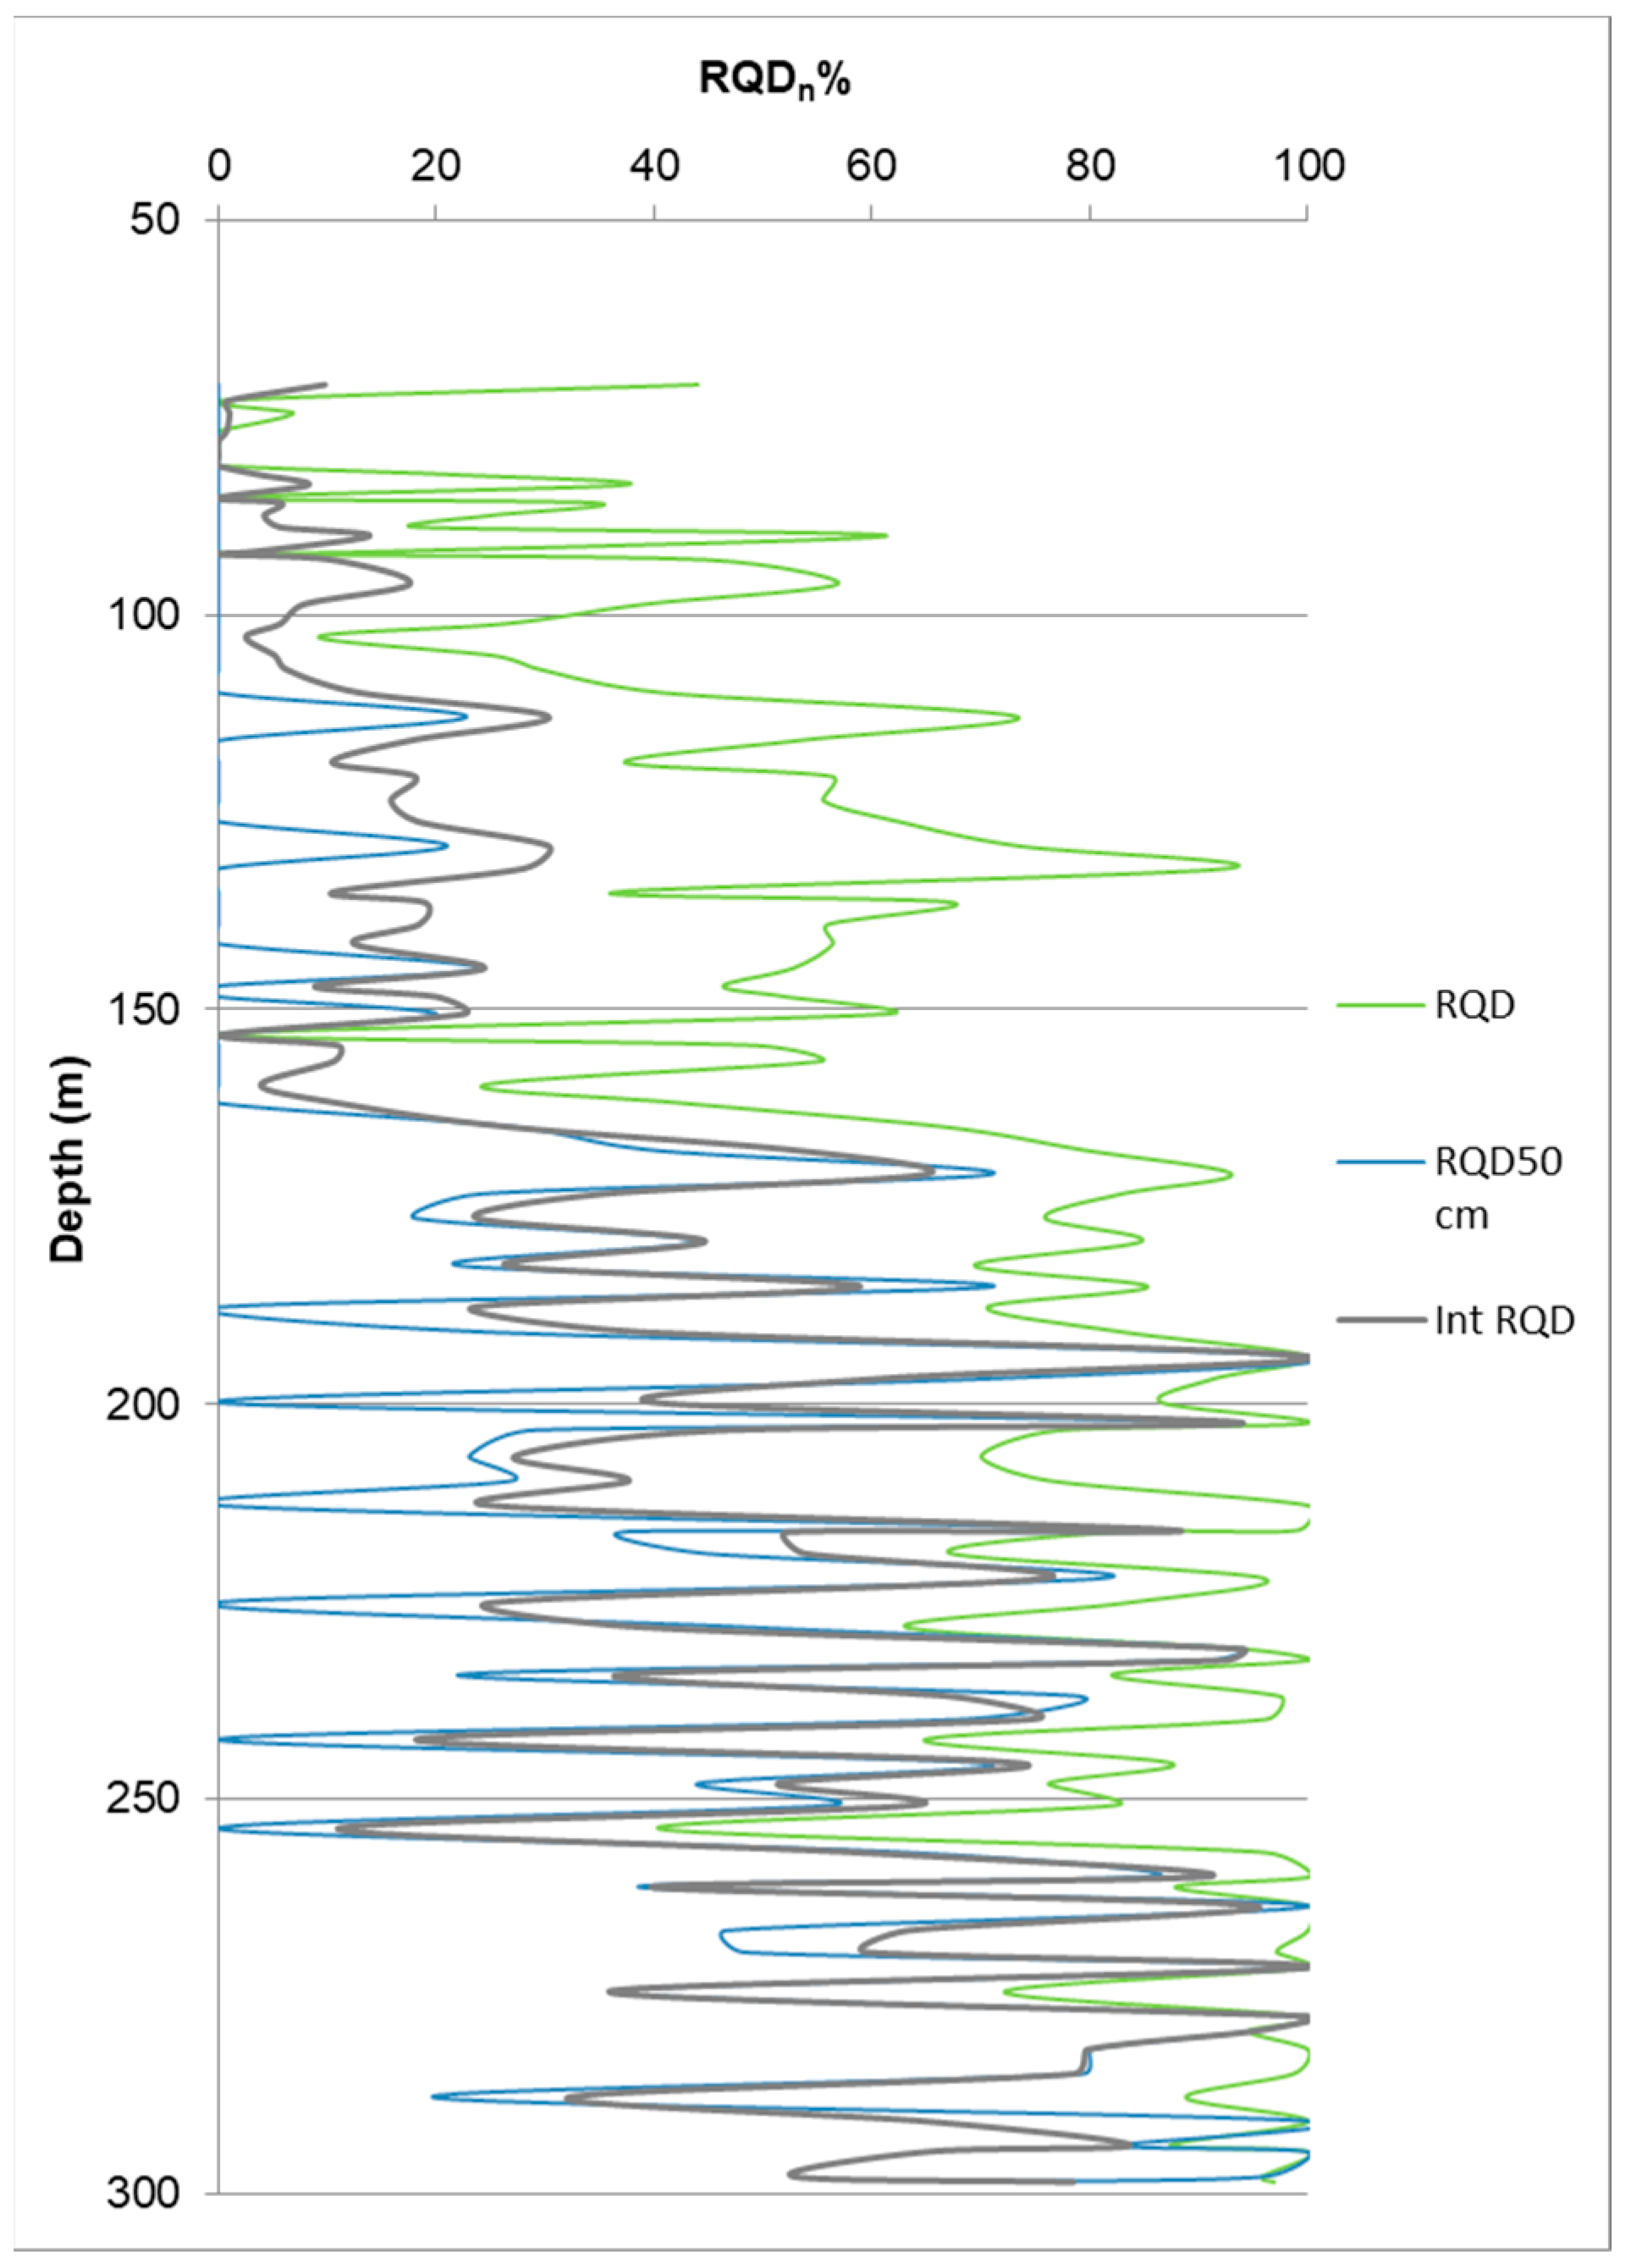
Regarding the data of different fracture density approaches in the function of depth (Figure 13), it is obvious that RQDn and integral RQD give more information about the characteristics of a fractured rock mass. Based on these plots, distinct rock mass domains can be divided and boundaries can be observed more easily. Moreover, the minimum values of RQD 50 cm or integrated RQD allow identify the possible tectonic zones with smaller rock pieces in a more expressive way. Using it with other borehole logs, it is an effective procedure to create a more suitable geotechnical profile of the investigated rock mass.

6. Discussions

When RQD was developed for borehole analysis, the aim, among others, was to design tunnels empirically. Empirical relations between RQD and rock load factor, and the width of opening of the tunnel were developed by Deere et al. [24,52].
Recently, it is one of the basic input parameters for rock mass classifications (such as Rock Mass Rate [2,3] and Rock Mass Quality [4]). It is important to note that introducing a new definition for RQD does not necessitate modifications to the RMR and Q.
It can be used for calculating the Geological Strength Index (GSI) from a borehole [7,8]. The analysis presented here is not intended to change the rock mass classifications, but to present a more accurate analysis of the borehole.
The large variance of empirical equations based on different RQD (see, for example, calculation of the deformation moduli [26]) is due to the uncertainty of the RQD (see Palmström’s critique of RQD [39]). Recent rock mass classifications suggest abandoning the RQD due to its flaws and using the fracture intensity instead [36,37,38]. The presented approach does not address all the disadvantages of RQD, but unlike the position taken by Pells et al. [31], it offers a solution not only for further use and interpretation of RQD, but also offers the possibility to reinterpret detailed datasets of historic projects.
In the definition of the Geological Strength Index (GSI) of the borehole proposed by [7,8] for the classification of fractured rock masses, the RQD value was directly incorporated into the calculation formula. As the Integrated RQD gives a more accurate picture of rock mass structure, it is a suitable parameter for a more accurate determination of the GSI value. The following new equation is recommended for calculating the Geological Strength Index (GSI), using the suggestion of [8]:
GSI = 2.5 × SCR + 11.3 ln(Int_RQD) − 2
where the Surface Condition Rating (SCR) can be calculated using the following equation:
SCR = Rr + Rw + Rf
where Rr, Rw and Rf are the rating corresponding to roughness, weathering and infilling, respectively [8]. As can be seen from Table 4, the maximum rating value can be 18.
Further investigation is needed in the task of scanlines especially in the aspects of Zhang et al. [33] and discrete fracture network modeling. Another important approach can be the implementation of integrated RQD on the data derived from slope or tunnel face classification.

7. Conclusions

The integrated RQD value presented here eliminates the limitations associated with the 10 cm core size, one of the major disadvantages of RQD determination. The evaluations can be carried out on any length of core section, depending on whether quick data is needed on boreholes and want to be obtained for individual developments, or a detailed rock mass characterization needs to be carried out for the design of engineering structures. If detailed RQD evaluations from previous research projects are available, they can also be re-evaluated. It is also possible to provide a more geologically accurate fracture density distribution for geologically based sectioning.
The shape of the integrated RQD distribution curve gives a good indication of the quality of the rock and the size of the blocks and if there is a large-scale geotechnical drilling program, it is possible to create specific distribution curves for the site or in relevant rock domains. A new procedure is now available for the analysis of boreholes to divide rock mass domains and recognize major or minor tectonic zones.
The procedures presented here are the first steps of an analysis. The results show that the presented procedures will allow a much more accurate analysis of the drill core. This calculation technique can lead to a proper description of rock mass fabric and gives a more statistical view of fracture intensity.

Author Contributions

G.S.: Conceptualization, writing; B.V.: methodology, supervision. All authors have read and agreed to the published version of the manuscript.

Funding

This research received no external funding.

Data Availability Statement

The data can be found in the Public Limited Company for Radioactive Waste Management (PURAM)/RHK Ltd. repository.

Acknowledgments

The research and this paper could not have been carried out without the approval of Public Limited Company for Radioactive Waste Management (PURAM)/RHK Ltd.

Conflicts of Interest

The authors declare no conflict of interest.

References

  1. Deere, D.U. Technical description of rock cores for engineering purposes. Rock Mech. Eng. Geol. 1964, 1, 17–22. [Google Scholar]
  2. Bieniawski, Z.T. Engineering classification of jointed rock masses. Trans. S. Afr. Inst. Civ. Eng. 1973, 15, 335–344. [Google Scholar]
  3. Bieniawski, Z.T. Engineering Rock Mass Classifications: A Complete Manual for Engineers and Geologists in Mining, Civil, and Petroleum Engineering; Wiley-Interscience: Hoboken, NJ, USA, 1989. [Google Scholar]
  4. Barton, N.R.; Lien, R.; Lunde, J. Engineering classification of rock masses for the design of tunnel support. Rock Mech. 1974, 6, 189–239. [Google Scholar] [CrossRef]
  5. Rehman, H.; Ali, W.; Naji, A.M.; Kim, J.-J.; Abdullah, R.A.; Yoo, H.-K. Review of Rock-Mass Rating and Tunneling Quality Index Systems for Tunnel Design: Development, Refinement, Application and Limitation. Appl. Sci. 2018, 8, 1250. [Google Scholar] [CrossRef]
  6. Rehman, H.; Naji, A.M.; Kim, J.-J.; Yoo, H.-K. Empirical Evaluation of Rock Mass Rating and Tunneling Quality Index System for Tunnel Support Design. Appl. Sci. 2018, 8, 782. [Google Scholar] [CrossRef]
  7. Hoek, E.; Carter, T.G.; Diederichs, M.S. Quantification of the Geological Strength Index Chart. In Proceedings of the 47th US Rock Mechanics/Geomechanics Symposium, San Francisco, CA, USA, 23–26 June 2013. [Google Scholar]
  8. Xia, K.; Chen, C.; Wang, T.; Pang, H.; Liu, X. Quantification of the GSI and D values in the Hoek–Brown criterion using the rock quality designation (RQD) and discontinuity surface condition rating (SCR). Bull. Eng. Geol. Environ. 2022, 81, 4. [Google Scholar] [CrossRef]
  9. Hoek, E.; Kaiser, P.K.; Bawden, W.F. Support of Underground Excavations Is Hard Rock; Balkema: Rotterdam, The Netherlands, 1995. [Google Scholar]
  10. Hoek, E.; Brown, E.T. The Hoek-Brown failure criterion and GSI–2018 edition. J. Rock Mech. Geotech. Eng. 2019, 11, 445–463. [Google Scholar] [CrossRef]
  11. Deere, D.U. Rock Quality Designation (RQD) after 20 Years; US Army Corps. Engrs Rep.: Gainesville, FL, USA, 1989; p. GL-89-1. [Google Scholar]
  12. Deere, D.U.; Deere, D.W. The RQD Index in Practice, Rock Classification Systems for Engineering Purposes; ASTM Special Technical Publications 984: West Conshohocken, PA, USA, 1988; pp. 91–101. [Google Scholar]
  13. Eurocode 1997-1: Geotechnical design, Part 1: General rules.
  14. Priest, S.D.; Hudson, J. Discontinuity spacing in rock. Int. J. Rock Mech. Mining Sci. Geomech. 1976, 13, 135–148. [Google Scholar] [CrossRef]
  15. Vučemilović, H.; Mulabdić, M.; Miščević, P. Corrected Rock Fracture Parameters and Other Empirical Considerations for the Rock Mechanics of Rock Masses of Doha, Qatar. Geotech. Geol. Eng. 2021, 39, 2823–2847. [Google Scholar] [CrossRef]
  16. Hasan, M.; Shang, Y.; Shao, P.; Yi, X.; Meng, H. Geophysical research on rock mass quality evaluation for infrastructure design. Earth Space Sci. 2022, 9, e2021EA002017. [Google Scholar] [CrossRef]
  17. Zilahi-Sebess, L. A repedezettség hatása a mélyfúrásgeofizikai mérésekre. Magy. Geofiz. Hung. Geophys. 2010, 51, 124–142. [Google Scholar]
  18. Egerer, F.; Kertész, P. Bevezetés a Kőzetfizikába (Introduction to Rock Physics); Akadémiai Kiadó: Budapest, Hungary, 1993. [Google Scholar]
  19. Kirkby, A.; Heinson, G.; Krieger, L. Relating permeability and electrical resistivity in fractures using random resistor network models. J. Geophys. Res. Solid Earth 2016, 121, 1546–1564. [Google Scholar] [CrossRef]
  20. Alemdag, S.; Sari, M.; Seren, A. Determination of rock quality designation (RQD) in metamorphic rocks: A case study (Bayburt-Kirklartepe Dam). Bull. Eng. Geol. Environ. 2022, 81, 214. [Google Scholar] [CrossRef]
  21. Palmström, A. The Volumetric Joint Count—A Useful and Simple Measure of the Degree of Rock Mass Jointing; IAEG Congress: New Delhi, India, 1982; pp. V.221–V.228. [Google Scholar]
  22. Ding, Q.; Wang, F.; Chen, J.; Wang, M.; Zhang, X. Research on Generalized RQD of Rock Mass Based on 3D Slope Model Established by Digital Close-Range Photogrammetry. Remote Sens. 2022, 14, 2275. [Google Scholar] [CrossRef]
  23. Deere, D.U.; Hendron, A.J.; Patton, F.D.; Cording, E.J. Design of surface and near surface constructions in rock. In Proceedings of the 8th U.S. Symposium on Rock Mechanics, Minneapolis, MN, USA, 15 September 1966; AIME: New York, NY, USA, 1967; pp. 237–302. [Google Scholar]
  24. Deere, D.U.; Merritt, A.H.; Coon, R.F. Engineering Classification of In-Situ Rocks; Report by University of Illinois to Air Force Weapons Lab; Kirtland Air Force Base: Albuquerque, NM, USA, 1968; p. 272, Publication No. AFWL-TW-67-144, National Technical Information Service (NTIS) Publication No. AD 848798. [Google Scholar]
  25. Coon, R.F.; Marritt, A.H. Predicting in Situ Modulus of Deformation Using Rock Quality Index. In Determination of the In Situ Modulus of Deformation of Rock; ASTM International: West Conshohocken, PA, USA, 1970; pp. 154–173. [Google Scholar]
  26. Zhang, L.; Einstein, H.H. Using RQD to estimate the deformation modulus of rock masses. Int. J. Rock Mech. Mining Sci. 2004, 41, 337–341. [Google Scholar] [CrossRef]
  27. Zhang, L. Estimating the Strength of Jointed Rock Masses. Rock Mech. Rock Eng. 2010, 43, 391–402. [Google Scholar] [CrossRef]
  28. Zhang, L. Determination and applications of rock quality designation (RQD). J. Rock Mech. Geotech. Eng. 2016, 8, 389–397. [Google Scholar] [CrossRef]
  29. Vásárhelyi, B.; Kovács, D. Empirical methods of calculating the mechanical parameters of the rock mass. Period. Polytech. Civ. Eng. 2017, 61, 39–50. [Google Scholar] [CrossRef]
  30. Ván, P.; Vásárhelyi, B. Relation of rock mass characterization and damage. In Rock Engineering in Difficult Ground Conditions–Soft Rocks and Karst; Vrkljan, I., Ed.; CRC Press: Omis, Croatia, 2010; pp. 399–404. [Google Scholar]
  31. Pells, P.J.; Bieniawski, Z.T.; Hencher, S.R.; Pells, S.E. Rock quality designation (RQD): Time to rest in peace. Can. Geotech. J. 2017, 54, 825–834. [Google Scholar] [CrossRef]
  32. Su, R.; Zhao, Q.; Zheng, T.; Han, G.; Jlang, J.; Hu, J. A Framework for RQD Calculation Based on Deep Learning. Min. Metall. Explor. 2023. [Google Scholar] [CrossRef]
  33. Zhang, W.; Chen, J.; Wang, Q.; Ma, D.; Niu, C.; Zhang, W. Investigation of RQD variation with scanline length and optimal threshold based on three-dimensional fracture network modeling. Sci. China Technol. Sci. 2013, 56, 739–748. [Google Scholar] [CrossRef]
  34. Li, L.; Ouellet, S.; Aubertin, M. An improved definition of rock quality designation, RQDc. In Proceedings of the ROCKENG09: Proceedings of the 3rd CANUS Rock Mechanics Symposium, Toronto, ON, Canada, 9–15 May 2009. [Google Scholar]
  35. Palmström, A. Measurement and characterization of rock mass jointing. In In Situ Characterization of Rocks; Sharma, V.M., Saxena, K.R., Eds.; Taylor & Francis: Abingdon, UK, 2001; pp. 49–97. [Google Scholar]
  36. Palmström, A. Measurements of and correlations between block size and rock quality designation (RQD). Tunn. Undergr. Space Technol. 2005, 20, 362–377. [Google Scholar] [CrossRef]
  37. Azimian, A. A New Method for Improving the RQD Determination of Rock Core in Borehole. Rock Mech. Rock Eng. 2016, 49, 1559–1566. [Google Scholar] [CrossRef]
  38. Lowson, A.; Bieniawski, Z. Critical Assessment of RMR-Based Tunnel Design Practices: A Practical Engineer’s Approach. In Proceedings of the SME, Rapid Excavation and Tunnelling Conference, Washington, DC, USA, 23–26 June 2013; pp. 180–198. [Google Scholar]
  39. Celada, B.; Tardáguila, I.; Varona, P.; Rodríguez, A.; Bieniawski, Z. Innovating Tunnel Design by an Improved Experience-Based RMR System. In Proceedings of the World Tunnel Congress, Foz do Iguaçu, Brazil, 9–15 May 2014; p. 9. [Google Scholar]
  40. Rehman, H.; Naji, A.M.; Kim, J.-J.; Yoo, H. Extension of tunneling quality index and rock mass rating systems for tunnel support design through back calculations in highly stressed jointed rock mass: An empirical approach based on tunneling data from Himalaya. Tunn. Undergr. Space Technol. 2019, 85, 29–42. [Google Scholar] [CrossRef]
  41. Balla, Z.; Albert, G.; Chikán, G.; Dudko, A.; Fodor, L.; Forián-Szabó, M.; Földvári, M.; Gyalog, L.; Havas, G.; Horváth, I.; et al. A Felszíni Földtani Kutatási Zárójelentése, Bátaapáti (Üveghuta), 2002–2003. (Final Report of the Surface Geological Survey, Bátaapáti (Üveghuta), 2002–2003)); MÁFI, Bátatom Kft.: Budapest, Hungary, 2003; p. BA–03–156. (In Hungarian) [Google Scholar]
  42. MBFSZ Mining and Geological Survey of Hungary. Geological Base Sections of Hungary on the 1:100.000 Scale Surface Geology Base Map of Hungary. Mining and Geological Survey of Hungary: Budapest, Hungary, 2021. Available online: https://map.mbfsz.gov.hu/fdt_alapszelvenyek/ (accessed on 18 August 2023).
  43. Kovács, L.; Kádár, B.; Krupa, Á.; Mészáros, E.; Pöszmet, T.; Rátkai, O.; Somodi, G.; Amigyáné Reisz, K.; Vásárhelyi, B. The Revision and Upgrade of Geotechnical Interpretative Report. Manuscript. Puram (RHK Kft.), RHKK-028/16. (In Hungarian). 2016. Available online: https://www.mta-kozettan.hu/sites/default/files/pdf/IV_KGV_kiadv%C3%A1nya.pdf (accessed on 27 September 2023).
  44. Deák, F.; Kovács, L.; Vásárhelyi, B. Geotechnical rock mass documentation in the Bátaapáti radioactive waste repository. Centr. Eur. Geol. 2014, 57, 197–211. [Google Scholar] [CrossRef]
  45. Somodi, G.; Krupa, Á.; Kovács, L.; Vásárhelyi, B. Comparison of different calculation methods of Geological Strength Index (GSI) is a specific underground site. Eng. Geol. 2018, 243, 50–58. [Google Scholar] [CrossRef]
  46. Vásárhelyi, B.; Somodi, G.; Krupa, Á.; Kovács, L. Determining the Geological Strength Index (GSI) using different methods. In Proceedings of the 2016 ISRM International Symposium, EUROCK 2016, Cappadocia, Turkey, 29–31 August 2016; pp. 1049–1054. [Google Scholar]
  47. Davarpanah, M.; Somodi, G.; Kovács, L.; Vásárhelyi, B. Complex analysis of uniaxial compressive tests of the Mórágy granitic rock formation (Hungary). Stud. Geotech. Mech. 2019, 41, 21–32. [Google Scholar] [CrossRef]
  48. Davarpanah, M.; Somodi, G.; Kovács, L.; Vásárhelyi, B. Experimental Determination of the Mechanical Properties and Deformation Constants of Mórágy Granitic Rock Formation (Hungary). Geotech. Geol. Eng. 2020, 38, 3215–3229. [Google Scholar] [CrossRef]
  49. Narimani, S.; Davarpanah, S.M.; Kovács, L.; Vásárhelyi, B. Variation of Elastic Stiffness Parameters of Granitic Rock during Loading in Uniaxial Compressive Test. Appl. Mech. 2023, 4, 445–459. [Google Scholar] [CrossRef]
  50. Somodi, G.; Kovács, L.; Máté, K.; Geiger, J. A Geotechnikai Értelmező Jelentés (GÉJ) Felülvizsgálatát és Kiterjesztését Megalapozó Geostatisztikai Vizsgálatok. RHK Kft. Irattár. Paks. RHK-K031/122013. Available online: https://wslpwstoreprd.blob.core.windows.net/kentico-media-libraries-prod/watercarepublicweb/media/watercare-media-library-2/ci-consents/appendix_e_geotechnical_interpretive_report_volume_1.pdf (accessed on 27 September 2023).
  51. Somodi, G.; Krupa, Á.; Kovács, L.; Szujó, G. Reviewing length, density and orientation data of fractures in a granitic rock mass. In Geomechanics and Geodynamics of Rock Masses; Vladimir, L., Ed.; Taylor and Francis Group: Abingdon, UK, 2018; pp. 439–443. [Google Scholar]
  52. Deere, D.U.; Peck, R.B.; Monsees, J.E.; Schmidt, B. Design of Tunnel Liners and Support Systems; Report of University of Illinois to Office of High-Speed Ground Transportation; U.S. Department of Transportation (DOT): Washington, DC, USA, 1969; p. 420, NTIS Publication No. PB-183799.
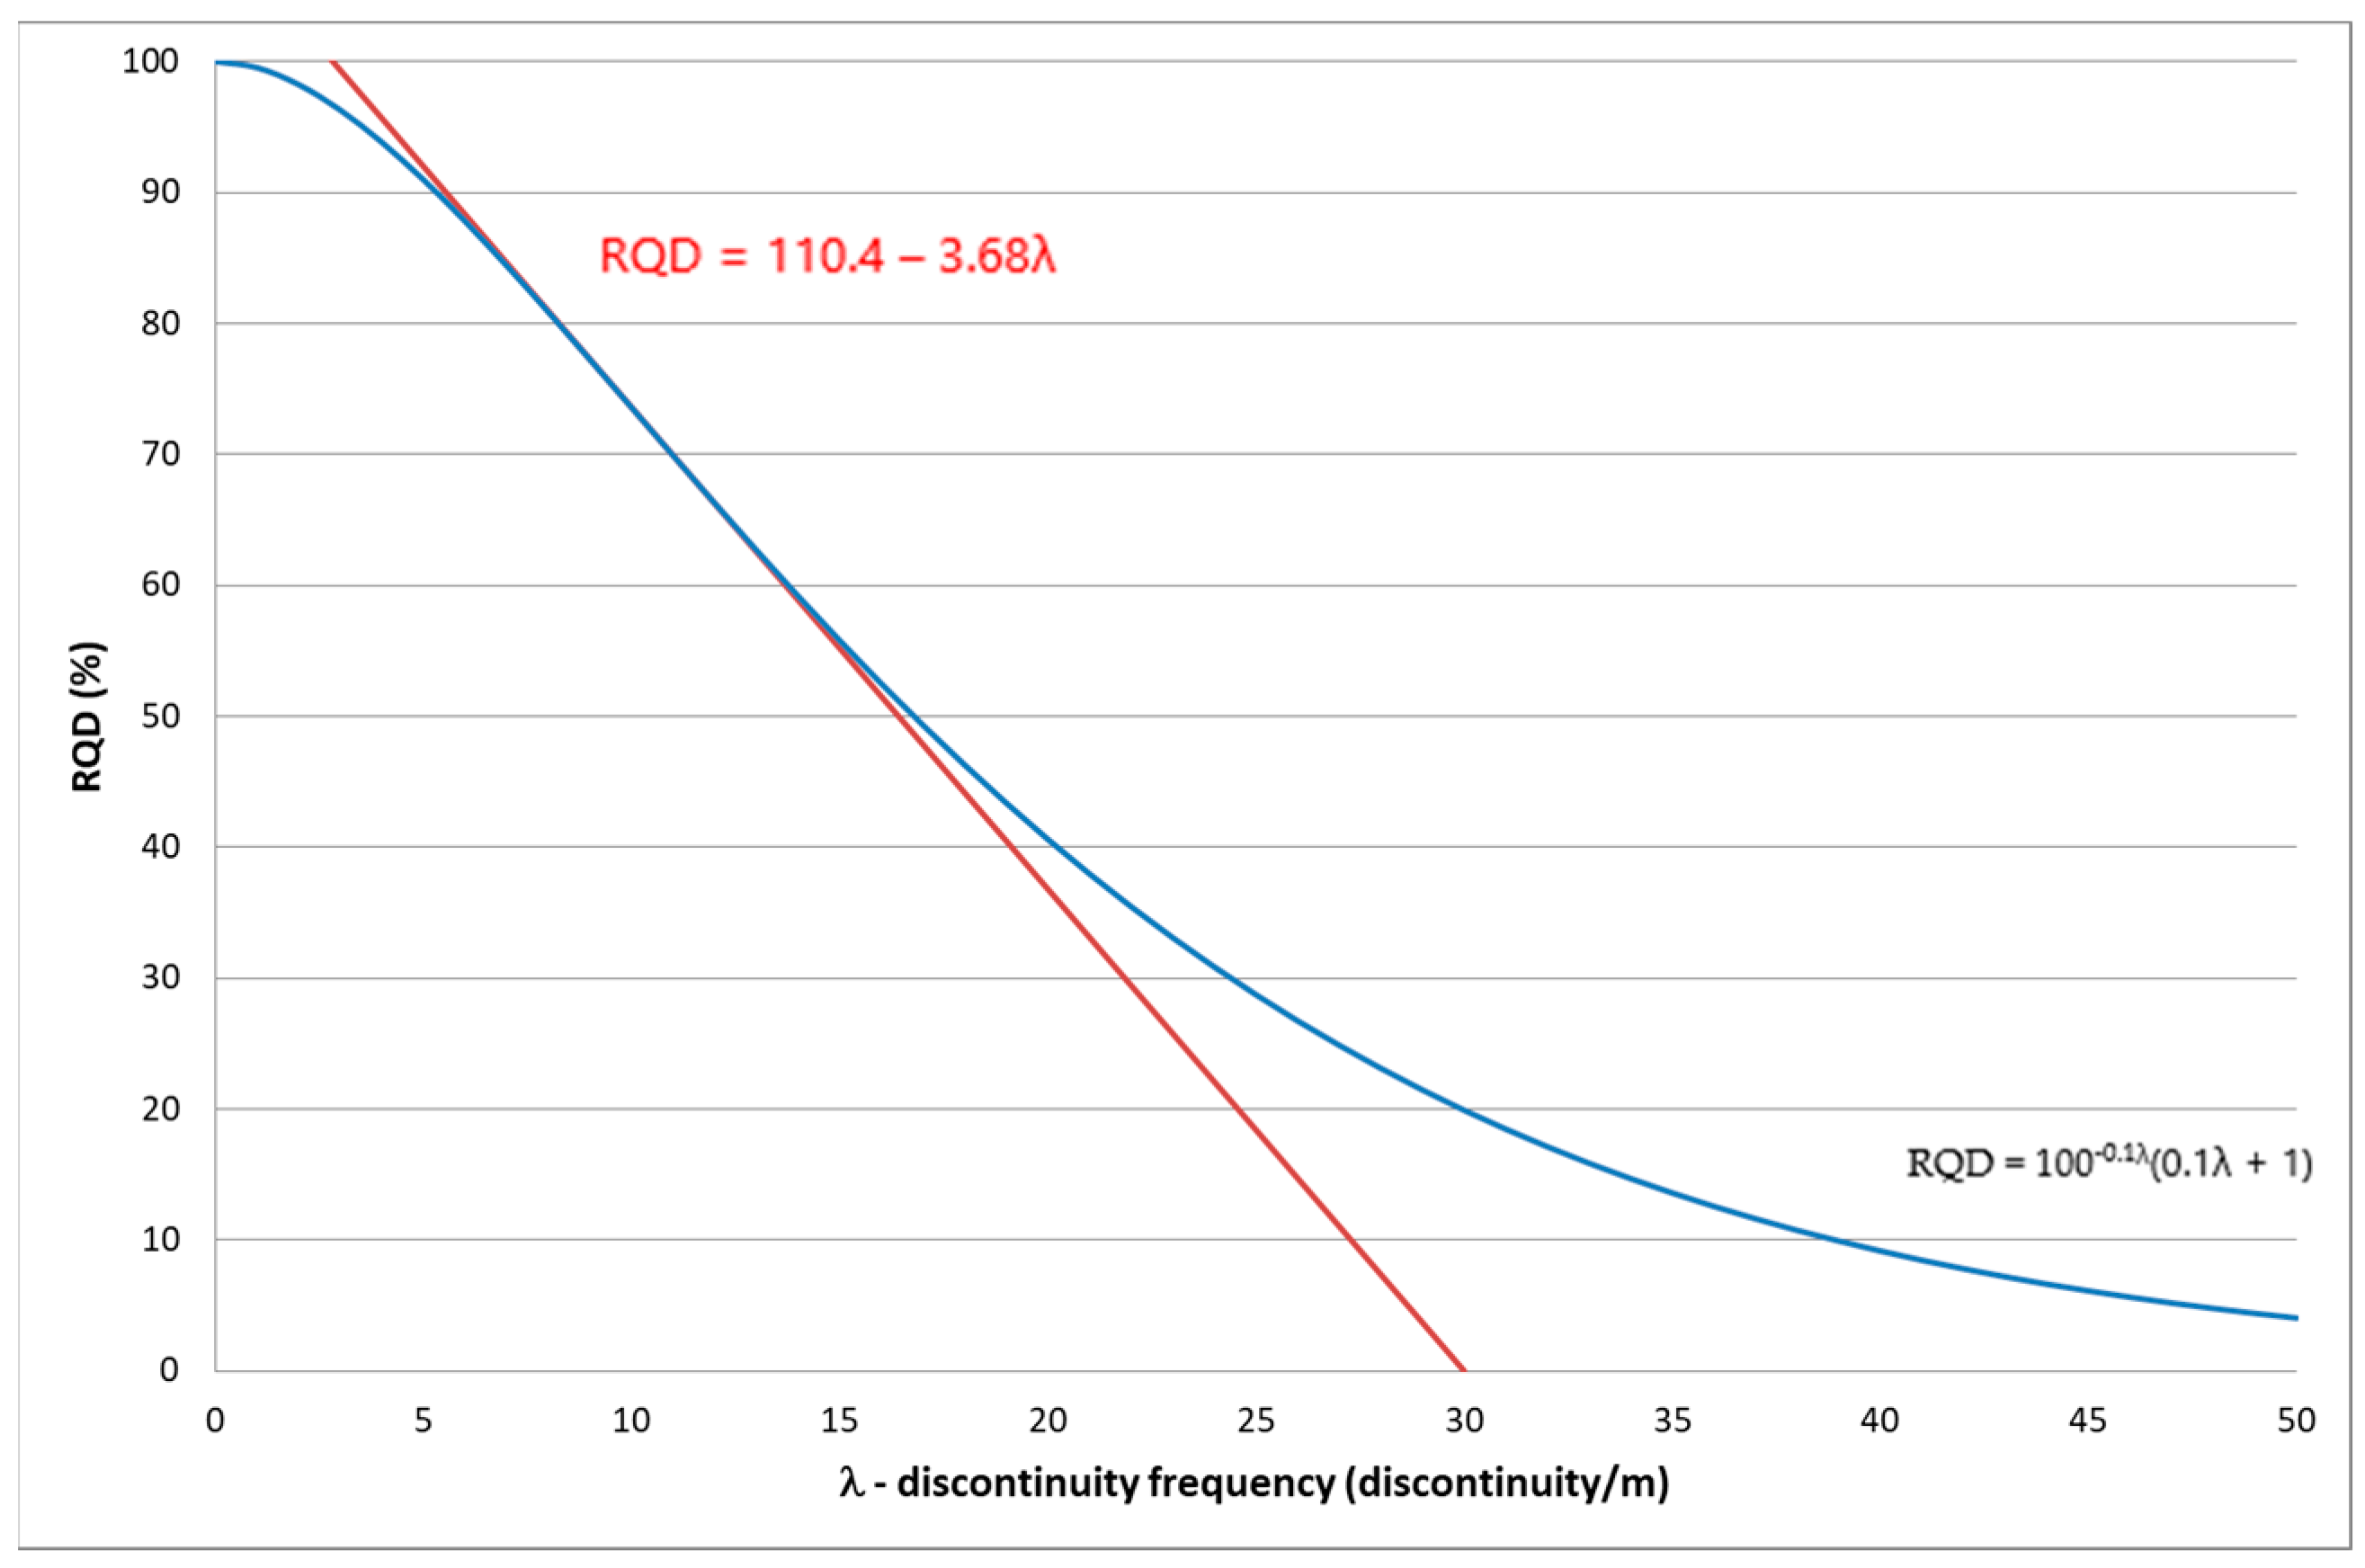
Figure 1. Relationship between RQD and discontinuity frequency λ.
Geotechnics 03 00055 g001
Figure 2. RQD* curves calculated using Equation (2) for different values of threshold t.
Geotechnics 03 00055 g002
Figure 3. Recommended relationships between RQD (%) and Em/Er, according to Zhang and Einstein [26].
Geotechnics 03 00055 g003
Figure 4. Example of minimum and (0%) and maximum (100%) RQD values (according to the critique of Palmström [39]).
Geotechnics 03 00055 g004
Figure 5. The location of the Bátaapáti Nuclear Waste Repository site in Hungary. Surface geological environment of the area of the repository [41].
Geotechnics 03 00055 g005
Figure 6. The geologic map of the repository chambers with the year of construction (left) [41] and a picture of a characteristic tunnel face (right), (Left) Light green: Monzonite and hybrid rocks. Purple: Monzogranite rock. Red lines: Main shear zones. Green line: Trachyte dyke.
Geotechnics 03 00055 g006
Figure 7. Rock cores with different fracture density of the Mórágy Granite Formation.
Geotechnics 03 00055 g007
Figure 8. Plots of different n % values for the tested 3 m long crore sections.
Geotechnics 03 00055 g008
Figure 9. Relationship between RQD5 and RQD50 jointing values and conventional RQD determination.
Geotechnics 03 00055 g009
Figure 10. Relationship between RQD10 and RQDn and the definition of integral RQD.
Geotechnics 03 00055 g010
Figure 11. Functional relationship between Integrated RQD (Int_RQD) and conventional RQD10.
Geotechnics 03 00055 g011
Figure 12. The RQD10 value in the function of the Int_RQD value.
Geotechnics 03 00055 g012
Figure 13. Different RQD values in the function of depth along a studied borehole.
Geotechnics 03 00055 g013
Table 1. Classification of rock types according to EUROCODE 7-1 with rock mechanics designations [13].
RQD %Rock Mass Classification
(EUROCODE 7)
Description
>25very poorDisintegrated/Soil
25–50poorShattered, very blocky
50–75fairBlocky and seamy
75–90goodMassive, slightly blocky
90–100excellentIntact
Table 2. Average rock mechanical parameters of the intact rock.
PropertyValue
Uniaxial compressive strength 102 MPa
Tensile strength 6.4 MPa
Young’s modulus45.9 GPa
Poisson’s ratio0.17
Bulk density27.10 kN/m3
Table 3. The different RQDn values for the samples shown in Figure 9.
RQD5RQD10RQD50RQD10%
A91917198
B78761854
C57532477
D5744025
Table 4. Surface condition rating for discontinuities (according to [8]).
Infilling Rating (Rf)Value
None6
Hard (<5 mm)4
Hard (>5 mm)2
Soft (<5 mm)2
Soft (>5 mm)0
Weathering Rating (Rw)Value
Unweathered6
Slightly weathered5
Moderately weathered3
Highly weathered1
Decomposed 0
Roughness Rating (Rw)Value
Very rough6
Rough5
Slightly rough3
Smooth 1
Slickensided 0
Disclaimer/Publisher’s Note: The statements, opinions and data contained in all publications are solely those of the individual author(s) and contributor(s) and not of MDPI and/or the editor(s). MDPI and/or the editor(s) disclaim responsibility for any injury to people or property resulting from any ideas, methods, instructions or products referred to in the content.