Article

Evaluation of Shear Wave Velocity Prediction Models from Standard Penetration Test N Values Depending on Geologic Attributes: A Case Study in Busan, South Korea

1
Department of Civil and Environmental Engineering, Hanyang University, ERICA, 55 Hanyangdaehak-ro, Sangnok-gu, Ansan 15588, Gyeonggi-do, Republic of Korea
2
Department of Civil Engineering, Changwon National University, 20 Changwondaehak-ro, Uichang-gu, Changwon 51140, Gyeongsangnam-do, Republic of Korea
*
Author to whom correspondence should be addressed.
Geotechnics 2023, 3(4), 1004-1016; https://doi.org/10.3390/geotechnics3040054
Submission received: 28 August 2023 / Revised: 22 September 2023 / Accepted: 28 September 2023 / Published: 1 October 2023

Abstract

:
This study evaluates the effectiveness of the previously proposed Standard Penetration Test (SPT) N and shear wave velocity (VS) models in relation to the geological attributes of the Busan region, situated in the southeastern part of the Korean peninsula. The multiple empirical N-VS models, which used datasets collected from different regions in South Korea, resulted in distinct N-VS trends across models. To validate the predictive capabilities of each model, this study gathered boring logs containing SPT N and VS measurements within the Busan region, followed by a thorough residual analysis. The Busan area encompasses a delta region to the west and erosion basins within the mountains and hills to the east. Despite the relatively confined geographical scope, we found that models developed using data from fill areas exhibit superior performance for the delta region (western Busan), while models constructed from datasets within erosion basins perform better for the erosion basin region (eastern Busan). This comparative examination supports the dependence of the N-VS model on geologic attributes and offers the valuable insight that N-VS models developed with analogous geological attributes should be employed when estimating VS from SPT N values.

1. Introduction

Shear wave velocity (VS) can be directly measured in the field through geophysical investigation such as downhole, crosshole, SASW (Spectral Analysis of Surface Waves), and MASW (Multi-Channel Analysis of Surface Waves) tests. However, in South Korea, the direct measurement of VS using these geophysical investigations was not commonly conducted before significant earthquakes like 2016 ML 5.8 Gyeongju earthquake and 2017 ML 5.4 Pohang earthquake. The primary approach for site investigation has been Standard Penetration Tests (SPTs), which are a fundamental geotechnical investigation technique utilized for soil sampling and assessing subsurface conditions. SPT results are often accessible within the geotechnical investigation database for sites where construction projects were performed.
Leveraging the extensive dataset generated by SPT, various studies have proposed N-VS models for the prediction of VS [1,2,3,4,5,6,7,8,9,10]. Imai and Yoshimura [5] were the pioneers in establishing the N-VS relationships in Japan. Since then, multiple research endeavors have sought to refine and enhance the accuracy of these N-VS relationships. Certain investigations have refined the N to N60, representing 60% of the energy efficiency of the hammer blow [1,11,12,13,14]. Some studies have incorporated the (N1)60, integrating corrections for confining pressure [10,15]. Furthermore, specific studies have supported the N with additional parameters, such as depth or vertical effective stress, to further improve the precision of VS predictions [1,3,16].
N-VS models suggested previously are dependent on soil type, layer composition, and geological attributes. Rahim et al. [17] established N-VS relationships based on geological age, and Rao and Choudhury [9] proposed N-VS relationships tailored for the northwestern part of Haryana, India, specifically for sedimentary layers with a thickness of 230–340 m. Piratheepan [18] conducted a comparative study evaluating the effectiveness of N-VS relationships by analyzing depositional layers using data from accumulative sedimentary layers in the United States, Canada, and Japan. Ohta and Goto [8] proposed N-VS relationships grouped in geological age (Pleistocene and Holocene), and Ohsaki and Iwasaki [7] proposed N-VS relationships tailored to sedimentary layers formed through accumulative, fluvial Pliocene deposits across 200 regions in Japan. Imai and Tonouchi [4] proposed an N-VS relationship using 1600 boring logs across Japan, and Kwak et al. [16] developed N-Vs relationships contingent upon soil types using data from 1102 boring logs from the Kyoshin network (K-NET) seismic observation stations.
On the other hand, there are also studies that N-VS relationships are independent from soil type. Hasancebi and Ulusay [12] and Dikmen [19] proposed N-VS models that remain insensitive to soil type. Their comprehensive analysis across various soil layers concluded that the influence of soil type on N-VS relationships is negligible.
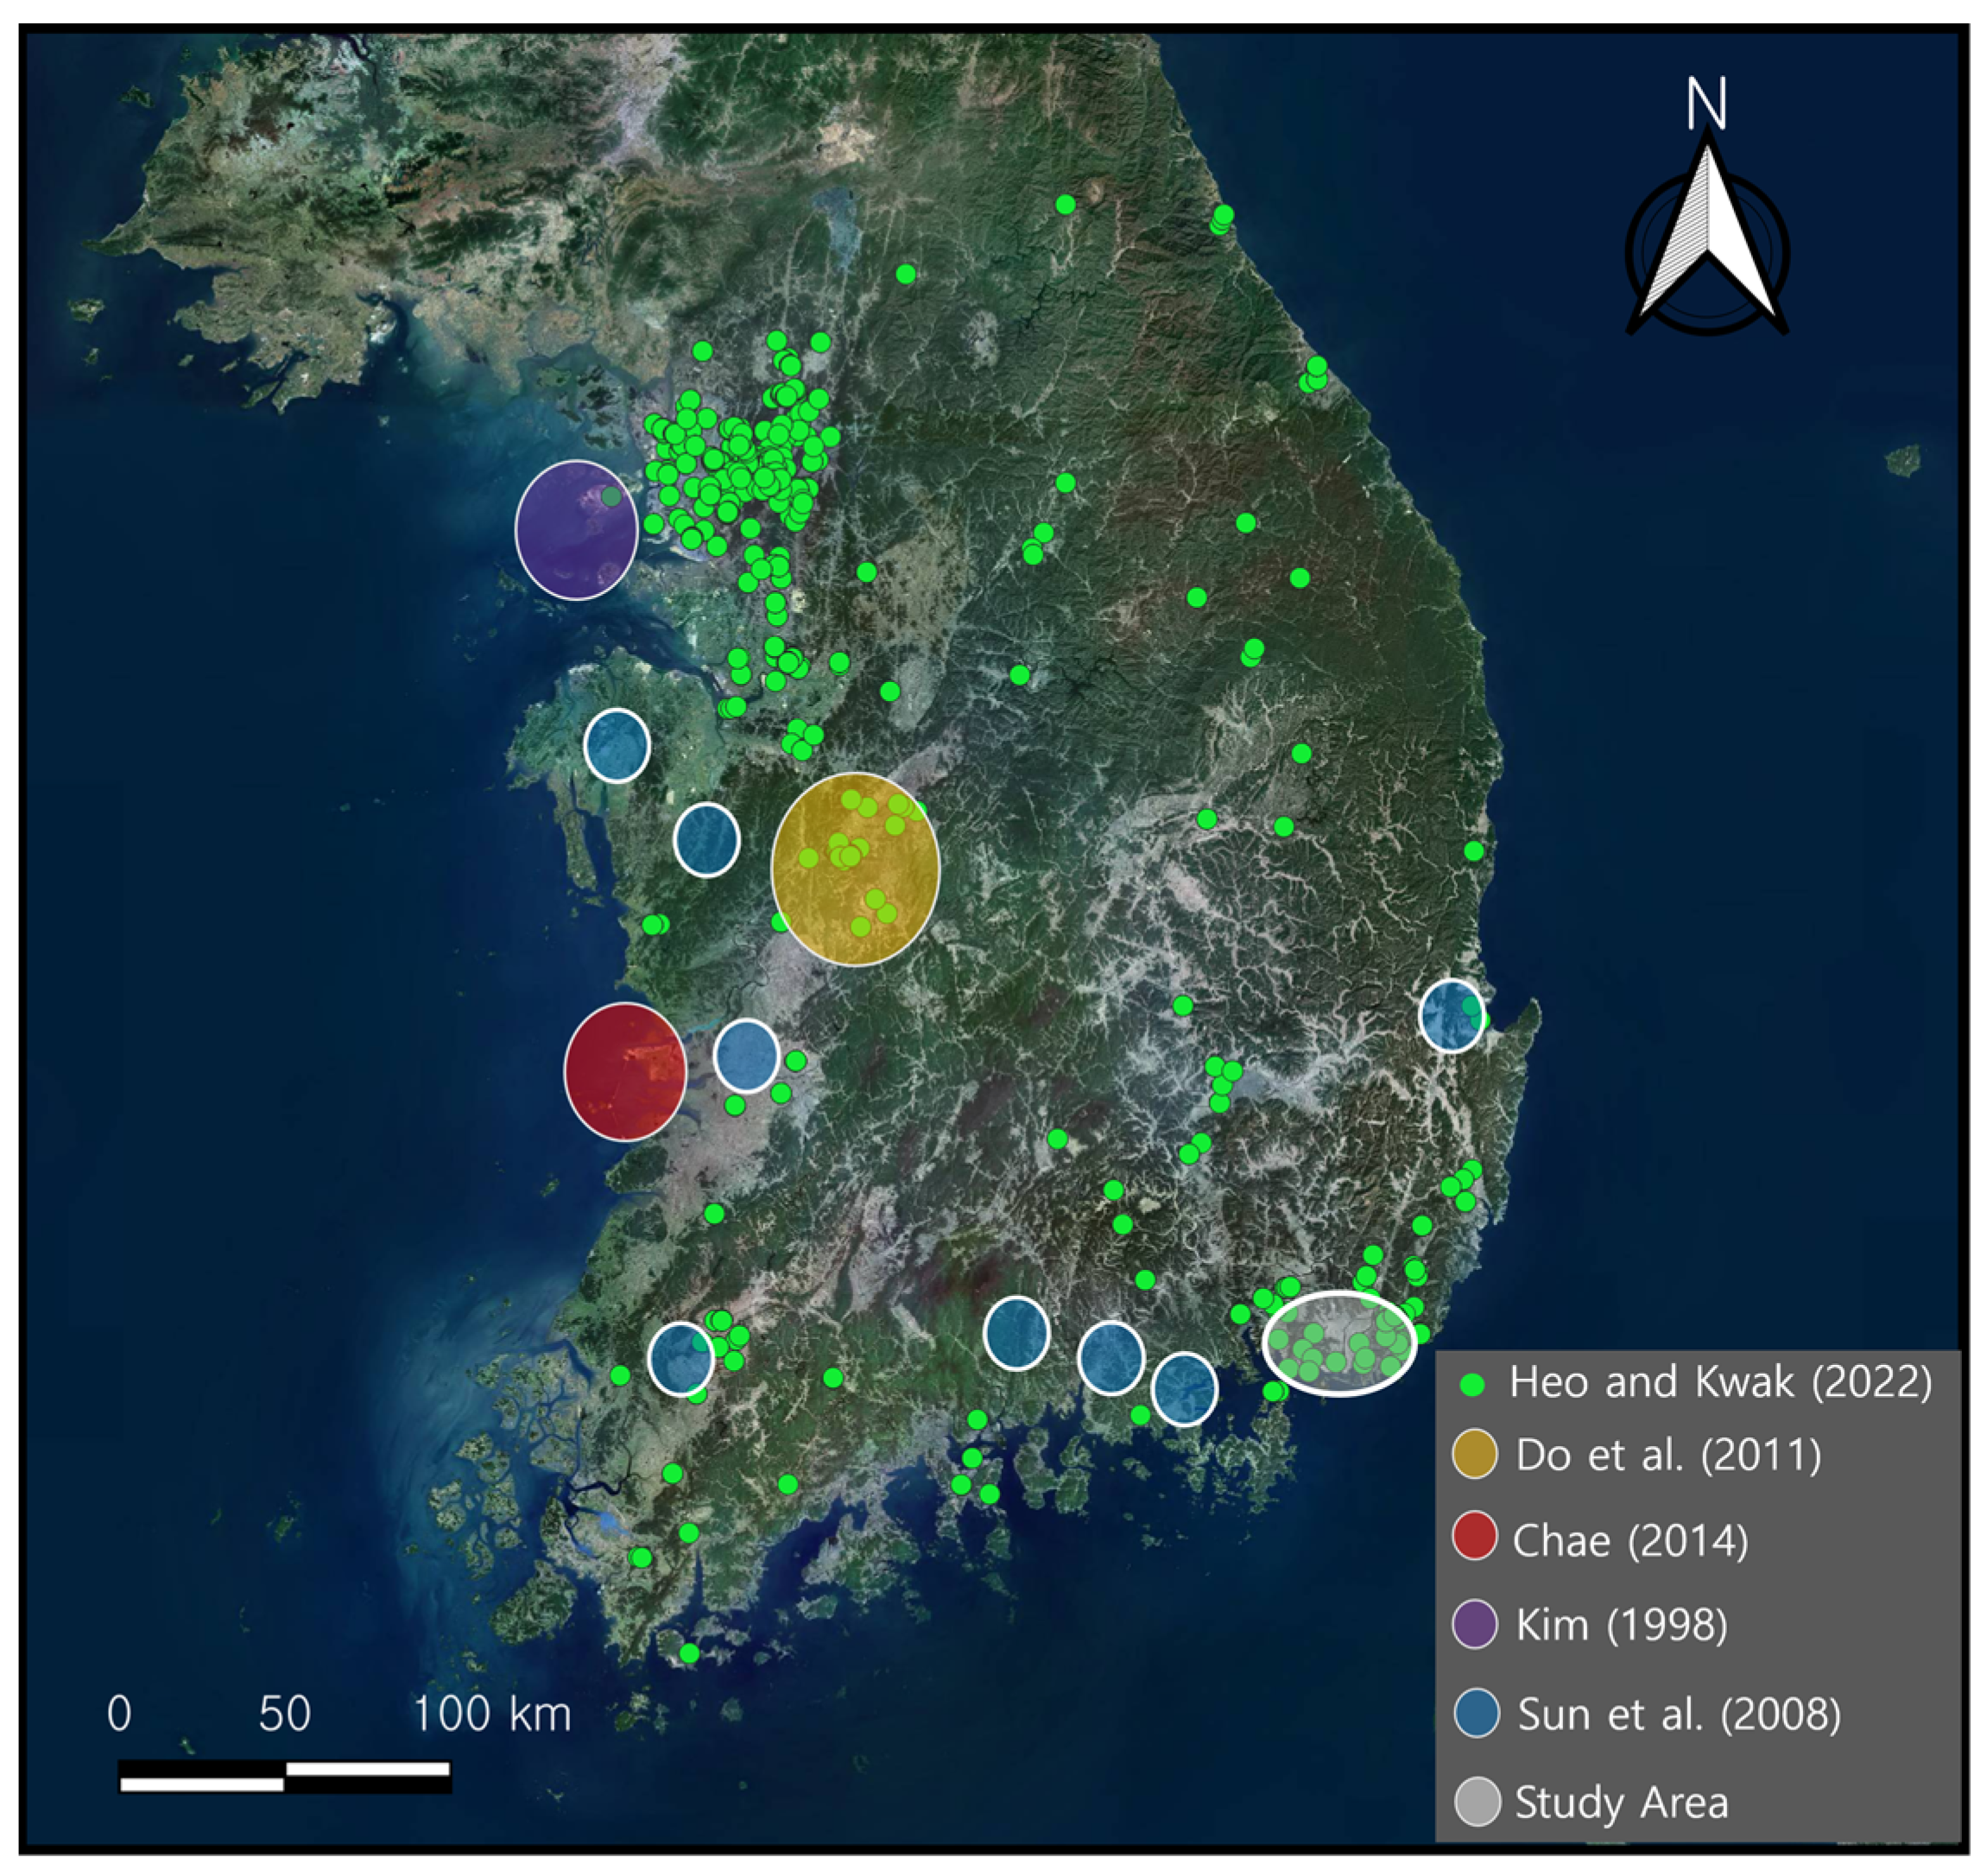
Within South Korea, Kim [6] gathered data from Yeongjong Island in Incheon, revealing a sedimentary layer of roughly 52 m in thickness superimposed over bedrock, complemented by an additional reclamation layer measuring approximately 7.5 m. Focusing on sedimentary layers of approximately 25 m thickness topped by a 10 m reclamation layer in the Saemangeum reclamation area, Chae [1] proposed the N-VS relationship while considering the energy efficiency of VS and N values. Sun et al. [10] suggested N-VS models through VS measurements acquired via crosshole, downhole, and uphole techniques, utilizing data from 26 boreholes situated across eight distinct regions. Do et al. [2] established N-VS empirical equations employing VS data acquired from suspension PS logging (SPS) tests performed in 19 boreholes within the Chungcheong-do region. Heo and Kwak [3] proposed N-VS models based on a comprehensive dataset obtained from 577 boreholes spanning the entire country. The geographical distribution of datasets employed for model development in each of these studies is depicted in Figure 1.
Table 1 provides an overview of previously proposed N-VS relationships, while Figure 2 shows N-VS relationships for all soil types grouped by country. Even though originating from diverse reclamation locations in South Korea, the N-Vs relationships introduced by Kim [6] and Chae [1] exhibit similar trends. Comparing them to international models, the N-VS relationships proposed for the reclamation area in South Korea [1,6] have similar trends with those proposed in Japan [4,5,7,8] and India [9], where sedimentary layer thickness ranges from 230 to 340 m. Conversely, in cases such as Do et al. [2] and Heo and Kwak [3], where a predominant proportion of the dataset is from erosion basins that are a common geological attribute of urbanized areas in South Korea, higher VS values for identical N values are anticipated compared to N-VS relationships derived from reclamation areas. The model outlined by Sun et al. [10] displays a distinct trend. It has the lowest VS at a low N-value (<10) and the highest VS at a stiff layer (N > 200) among Korean models. It may be attributed to the fact that the study locations of Sun et al. [10] are at a loose and deep stratum for a low N-value range.
As indicated above, N-VS relationships exhibit consistent trends when the geological attributes of the originating datasets are comparable. Conversely, distinct trends are shown if geological attributes differ.
This study evaluates the prediction performance of N-VS models suggested in South Korea through residual analyses, using datasets acquired from the Busan region. The Busan area encompasses disparate geological regions: a delta region to the west and erosion basins to the east. Based on the evaluation, a guideline is established for the enhanced prediction of VS from N values, aligning with the diverse geological features of the study area.

2. Study Area and Dataset

2.1. Study Area

The Busan region is located in the southeastern part of the Korean peninsula. It features distinct geological attributes, with the Nakdonggang delta area situated to the west of Busan and the eastern part of the Busan marked by erosion basins that are surrounded by mountains and hills. This geographic division is illustrated in Figure 3.
The Nakdonggang delta is located downstream of the Nakdonggang River in South Korea. This region has undergone the accumulation of substantial sediment layers due to fluctuations in sea levels [20,21]. It holds the distinction of being the largest delta area on the Korean peninsula. A study conducted by Lee et al. [22] covered a span from 1984 to 2015, investigating the changes of sedimentation in the terrain of the Nakdonggang River estuary over a 31-year period. The changes of sediment thickness are attributed to a combination of natural factors such as sea level rise, tides, and seismic activity, as well as human interventions including the construction of artificial structures like harbors and alterations to waterways.
The eastern part of Busan features erosion basins surrounded by mountains and hills, which is a common geological formation in urban areas of South Korea [23,24,25,26]. These erosion basins typically have mountainous perimeters and lower-lying central areas, formed through processes like differential weathering and erosion. Within these basins, alluvial fans often form due to the accumulation of weathered layers and the presence of small streams [24,25]. However, the thickness of sediment layers in these alluvial fans is generally not as substantial as in other alluvial fan regions, leading to the classification of these areas as pediments rather than traditional alluvial fans [27]. The distinction between pediments and alluvial fans based on sediment thickness has been a topic of global discussion [28], and recent studies have undertaken comparisons between Korean alluvial fans and those in other countries [29,30].
In Japan, in contrast, mountainous watersheds play a significant role in generating substantial sediment production. Particularly in areas with steep terrain, the annual sediment production can exceed 1000 m3/km2, and in certain cases, it can even reach over 10,000 m3/km2. These values are comparable to the highest levels of sediment production recorded in mountainous watersheds worldwide and are much higher than those observed in most other mountainous regions globally. As a consequence of this abundant sediment supply, alluvial fans are widely distributed along the fronts of mountains in Japan [31,32]. These geological differences between South Korea and Japan can lead to variations in N-VS relationships, as illustrated in Figure 2.

2.2. Dataset

Figure 3 shows the borehole locations where borehole profiles have been collected from the South Korean geotechnical database, GeoInfo (National Geotechnical Information Center). GeoInfo serves as a repository for ground investigations conducted at construction sites across South Korea [33]. The borehole records were excluded following the filtering criteria suggested in Heo and Kwak [3]. As a result, a total of 1794 borehole records remained for analysis containing SPT data and stratigraphic information. Additionally, the dataset includes 123 borehole records with measurements of VS obtained through downhole tests. Using the compiled dataset, various geotechnical attributes are determined. Specifically, the thickness of sedimentary layers, defined as the alluvial soil layer, and the depth to the underlying bedrock, defined as the soft rock or stiffer layer, are calculated. It is important to note that the thickness of sedimentary layers and the depth to the bedrock are distinct attributes. Soil layers within the profiles typically include fill, alluvial soil (AS), weathered soil (WS), and weathered rock (WR), extending from the surface to the bedrock. The bedrock depth is calculated by adding up the thicknesses of all soil layers, whereas the sedimentary layer thickness specifically refers to the thickness of the alluvial soil layer.
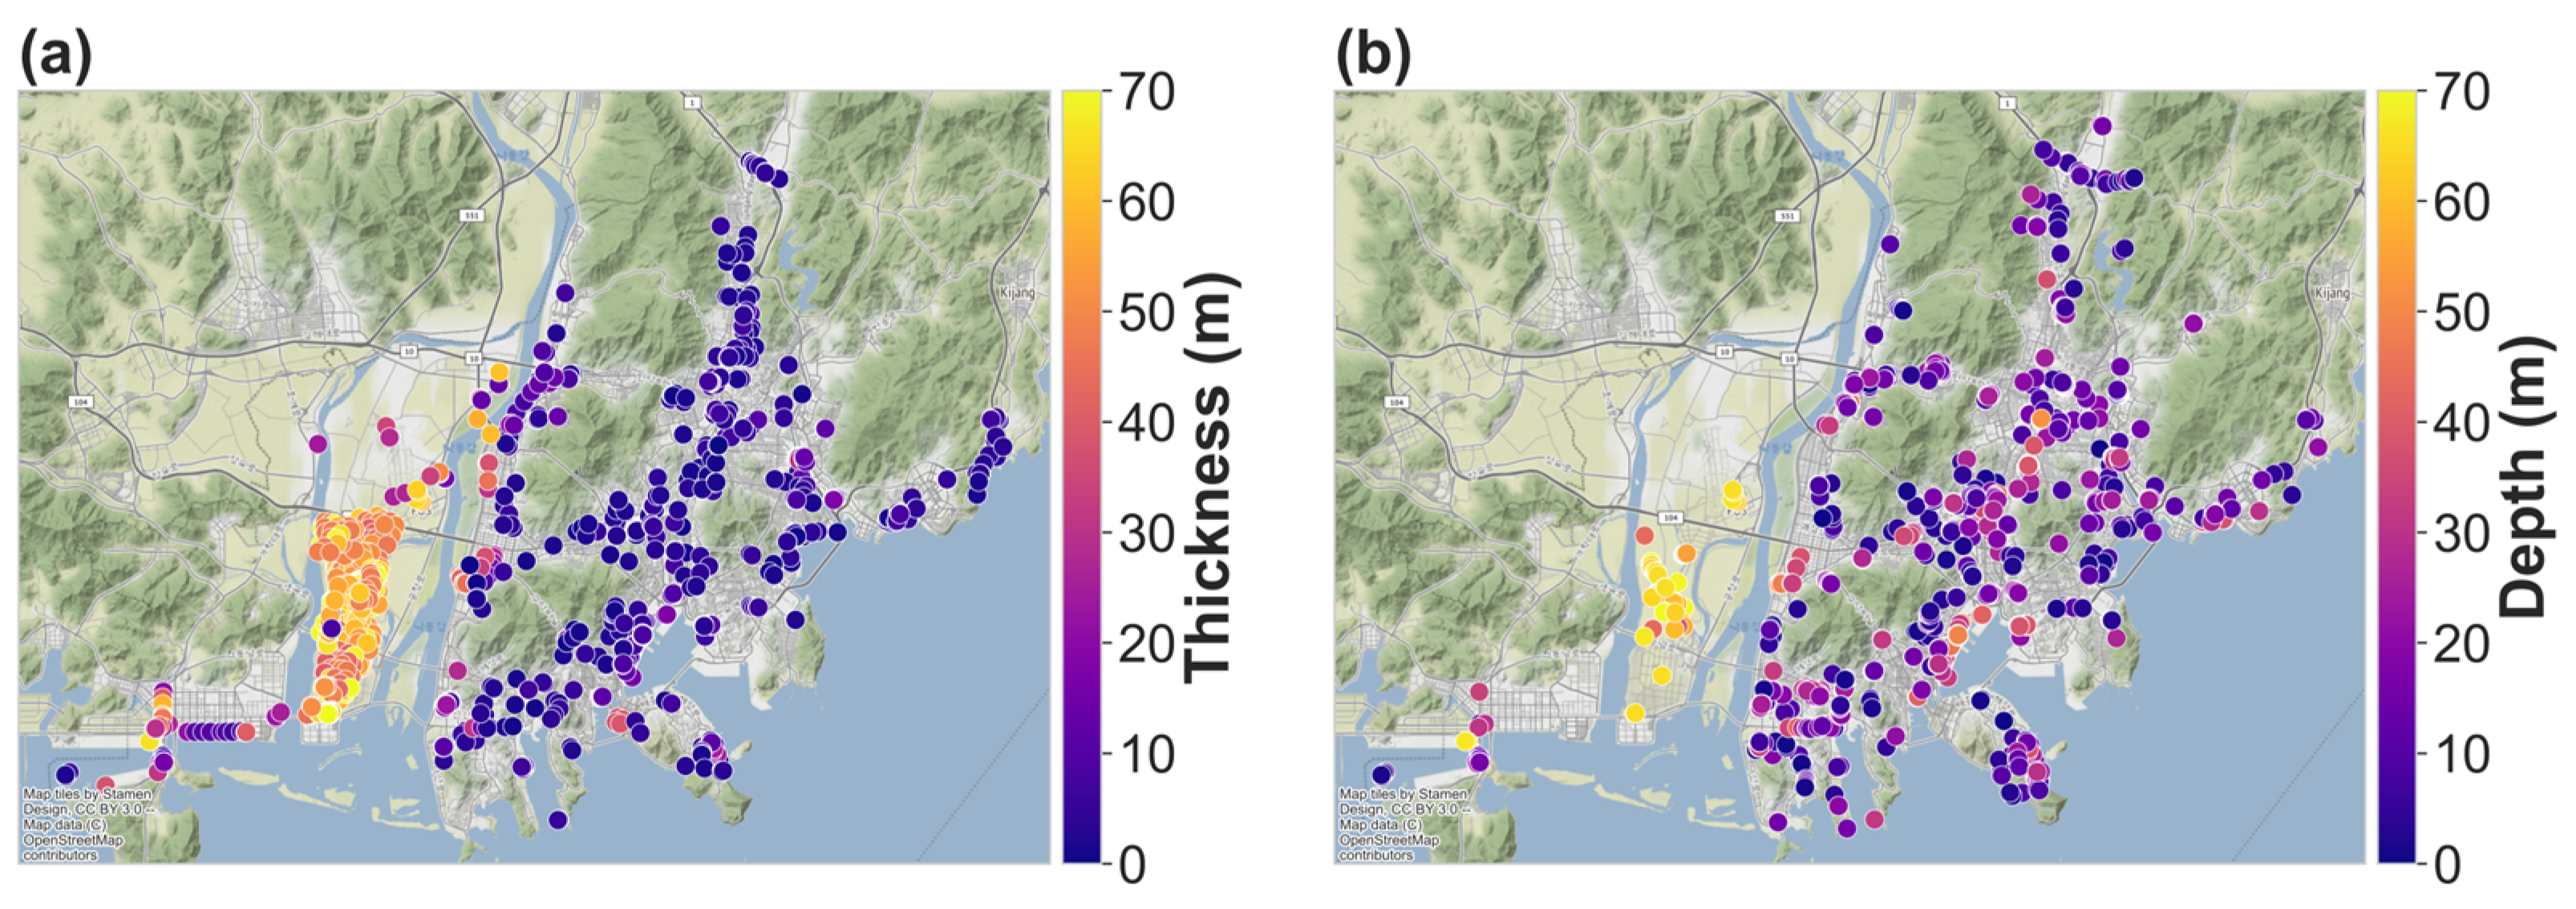
The distribution of the depth to the bedrock and sedimentary layer thickness across the study area is illustrated in Figure 4. In the Nakdonggang delta, there is a widespread occurrence of sites with sedimentary layers exceeding 70 m in thickness. However, it is notable that there is a lack of measurements for bedrock depth in this region. This suggests that there are numerous boreholes that do not reach the bedrock layer. The bedrock depth in the Nakdonggang delta area is known to range from 20 to 90 m [34]. On the contrary, the erosion basins located in the eastern part of Busan exhibit sedimentary layers that are approximately 10 m thick, with bedrock depths ranging within 30 m.
Table 2 provides quartile values representing the depth of each soil layer in both the Nakdonggang delta and the erosion basins. While the median thickness of the landfill layer (Fill) is relatively similar between the delta (1.4 m) and the erosion basin (2.3 m), the median thickness of sedimentary layers (AS) differs significantly. In the delta region, sedimentary layers have a median thickness value of approximately 58 m, whereas in the erosion basin, the value is approximately 5 m. This results in a substantial difference of about 12 times in the sedimentary layer thickness between these two terrains. The weathered soil layer thickness also differs between the delta and the erosion basin. In the delta, this layer has a medium thickness of 2 m, whereas in the erosion basin, it is approximately 7 m. Despite the shallower depth, the erosion basin exhibits a thicker weathered soil layer than the delta region. On the other hand, the medium thickness of the weathered rock layer is similar, where both regions have 6 m of thickness.
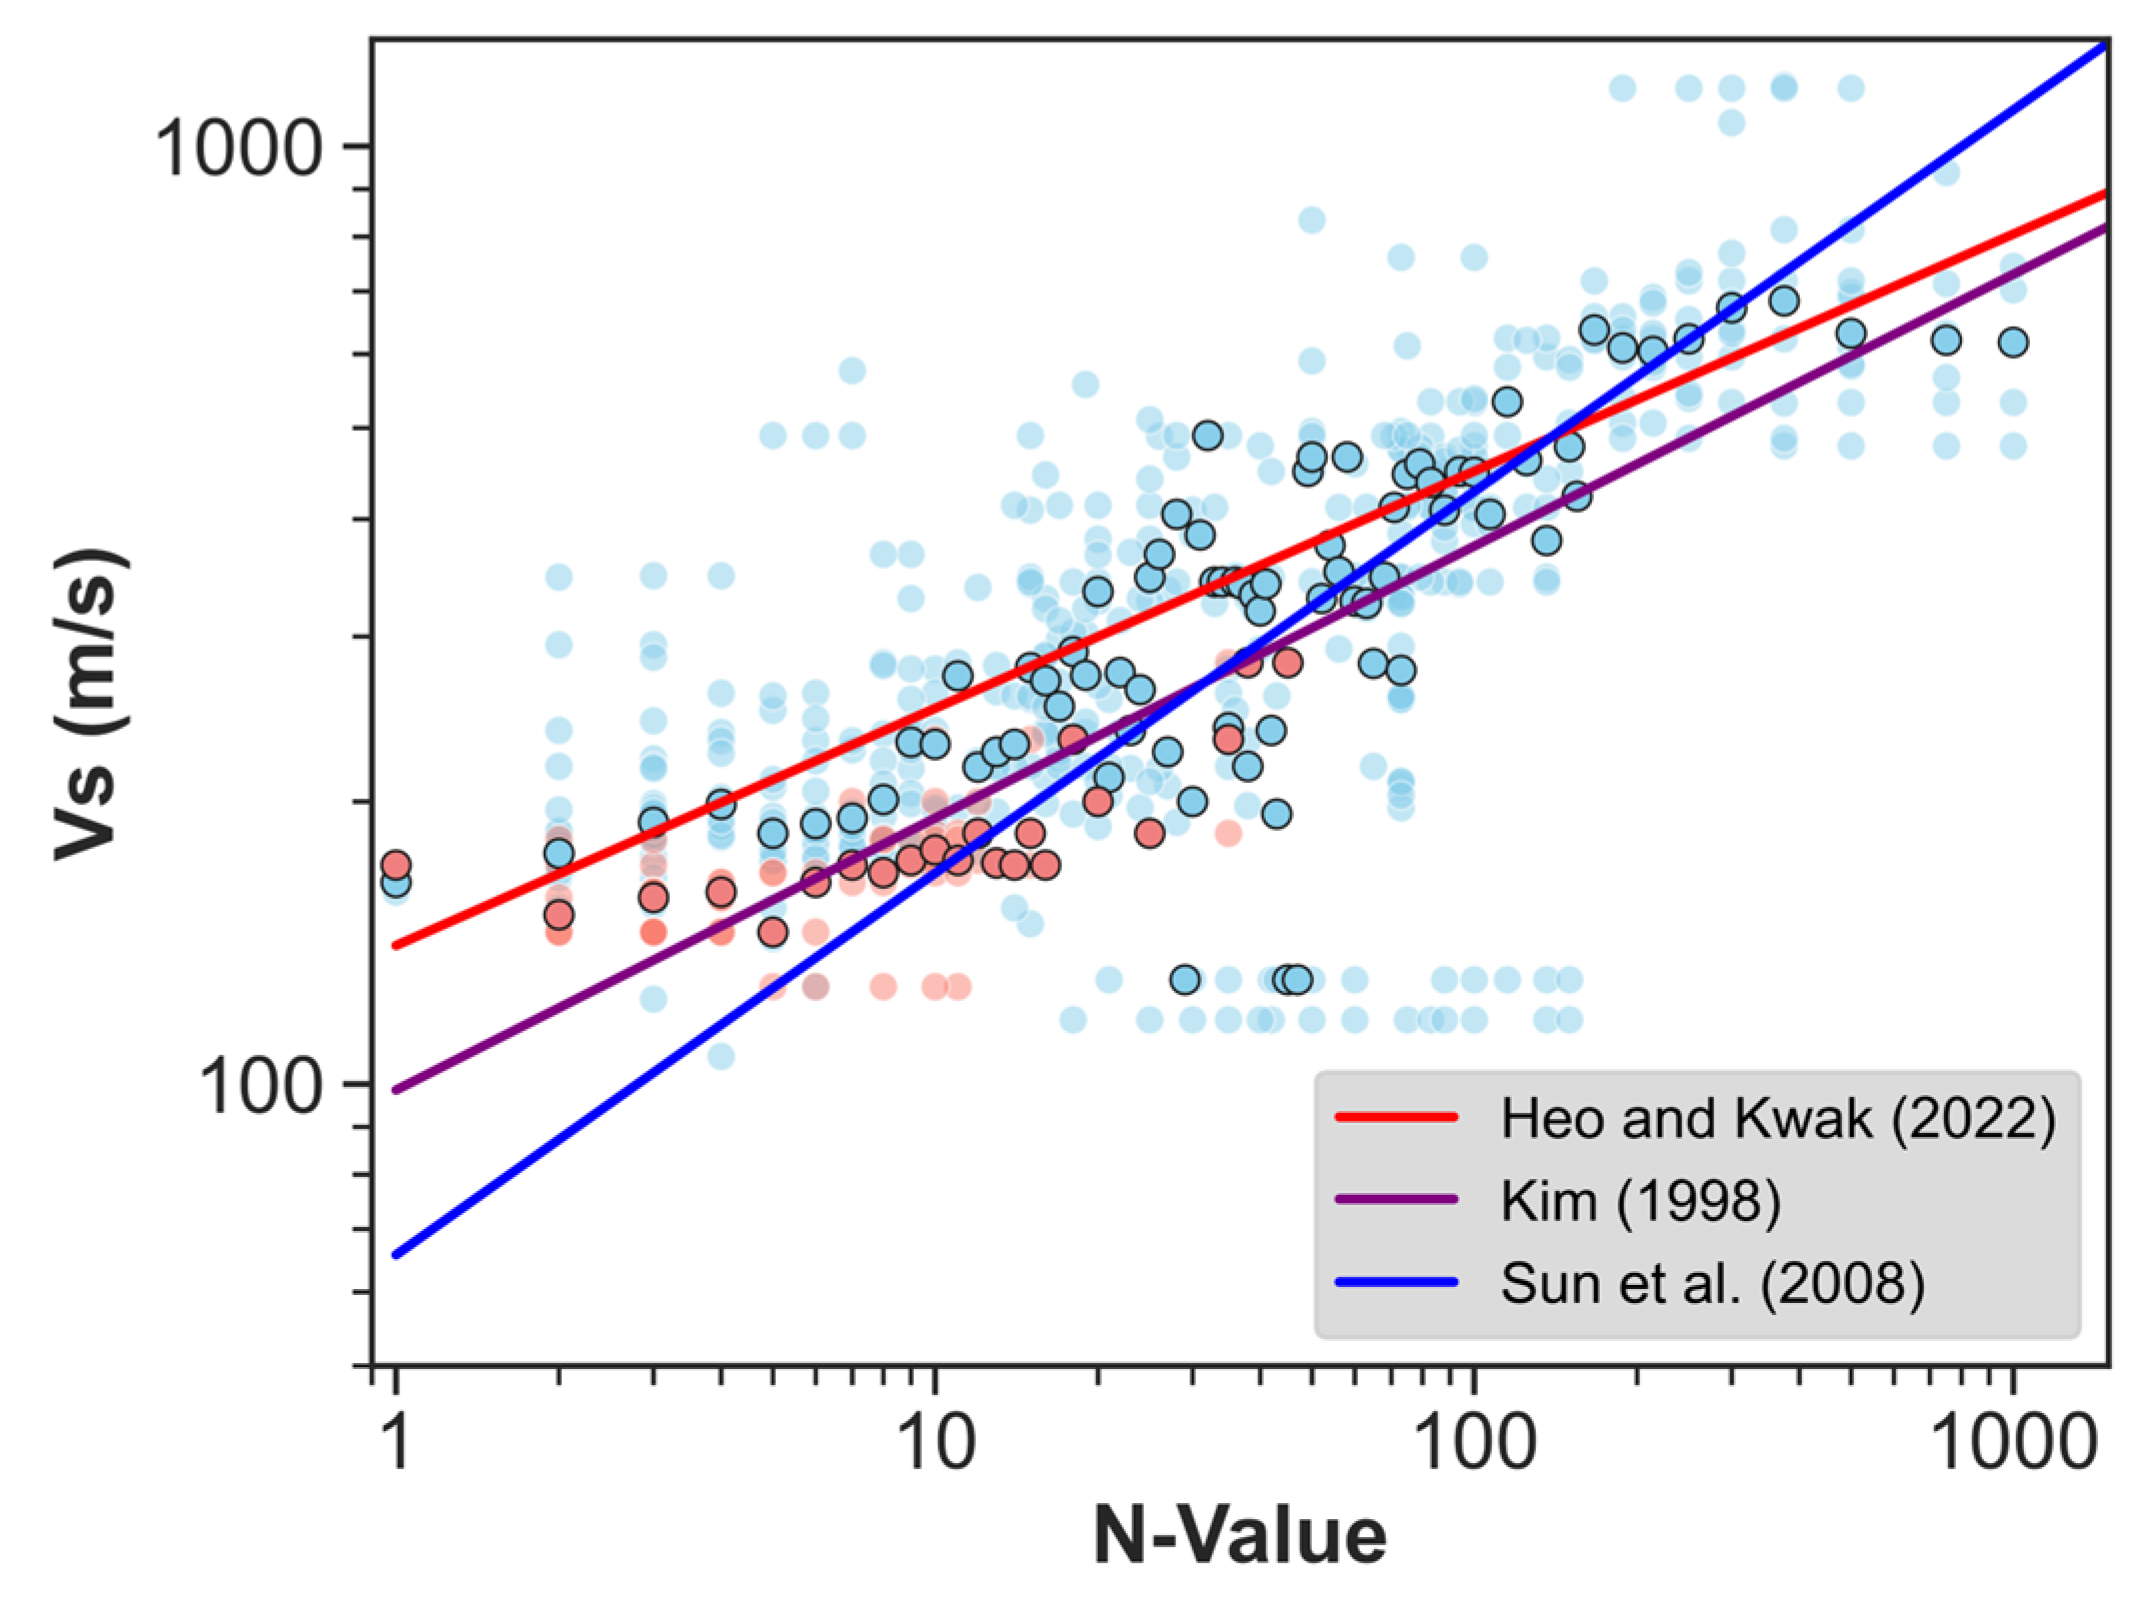
Figure 5 visually represents the distribution of N values and VS measurements obtained for both the Nakdonggang delta (indicated by red points) and the erosion basin terrains (indicated by blue points). It is evident that the delta region tends to have lower VS values compared to the erosion basin terrain for the same N values. This disparity in VS values based on N values is important because it highlights the geological influence on the N-VS relationship. As a consequence, when dealing with the Nakdonggang delta terrain, utilizing N-VS relationships that are derived from terrains resembling erosion basins could potentially lead to an overestimation of VS values [3]. Conversely, applying N-VS relationships formulated for delta-like terrains to the erosion basin terrain might result in an underestimation of VS values [6]. This finding emphasizes the need to consider the geological context and terrain characteristics when selecting appropriate N-VS relationships for different regions to ensure accurate predictions of VS. This study further emphasizes the use of proper N-VS relationships when predicting VS from N in analyzing the time-averaged VS of soil layers in subsequent sections.

3. Methodology

Among the collected dataset, there are VS measurements as well as SPT N measurements at 123 boreholes. The primary evaluation metric used in this study to assess the effectiveness of N-VS models depending on geological attribute is the time-averaged VS of soil layers (Vs,soil). The choice of Vs,soil as the primary evaluation metric is justified by its ability to provide a comprehensive representation of the potential N-VS relationship bias at a specific site. Vs,soil serves as a valuable single value that captures the cumulative impact of any potential bias in the N-VS relationship for a particular location. By utilizing Vs,soil as the evaluation metric, the study aims to gauge how well the N-VS models account for the geological attributes specific to each terrain type in the Busan region. This approach allows for a more comprehensive understanding of the model’s effectiveness in predicting VS under varying geological conditions.
To calculate Vs,soil, both the thickness of soil layers and their corresponding VS down to the bedrock depth are required. However, if the depth of the borehole does not extend to the bedrock level, determining the thickness of the soil layers becomes challenging, preventing the calculation of Vs,soil. In such cases, an alternative metric, Vs30, is computed and utilized for validation. The calculation of Vs,soil is performed as follows:
V s , s o i l = i n h i i n h i V s , i  
where hi and Vs,i are the thickness and VS of the ith layer, respectively, and n indicates the number of soil layers. The Vs30 can be calculated as follows:
V s 30 = i n 30 h i i n 30 h i V s , i
where n30 refers to the number of layers down to the 30 m depth.
If VS measurements are available for a site, both Vs,soil and Vs30 can be directly calculated. However, in cases where VS measurements are not available, VS must be estimated using SPT N values through N-VS relationships. Using the N-VS models proposed by Kim [6] (K98), Sun et al. [10] (SEA08), and Heo and Kwak [3] (HK22), calculations were performed to determine either Vs,soil or Vs30. To avoid overestimating VS, the threshold N values suggested by Heo and Kwak [3] for each soil layer type were employed during the calculations, regardless of N-VS models.
Boring logs were excluded from residual analysis described in the subsequent section if they met the following criteria:
  • The depth of the borehole was shallower than both the bedrock depth and 30 m;
  • SPT measurements were conducted with intervals greater than 5 m;
  • Neither SPT nor VS measurements were available down to a depth of 30 m.
Consequently, a total of 82 boreholes with calculated Vs,soil or Vs30 using field-measured VS and 770 boreholes using N-Vs relationships were retained for residual analysis.
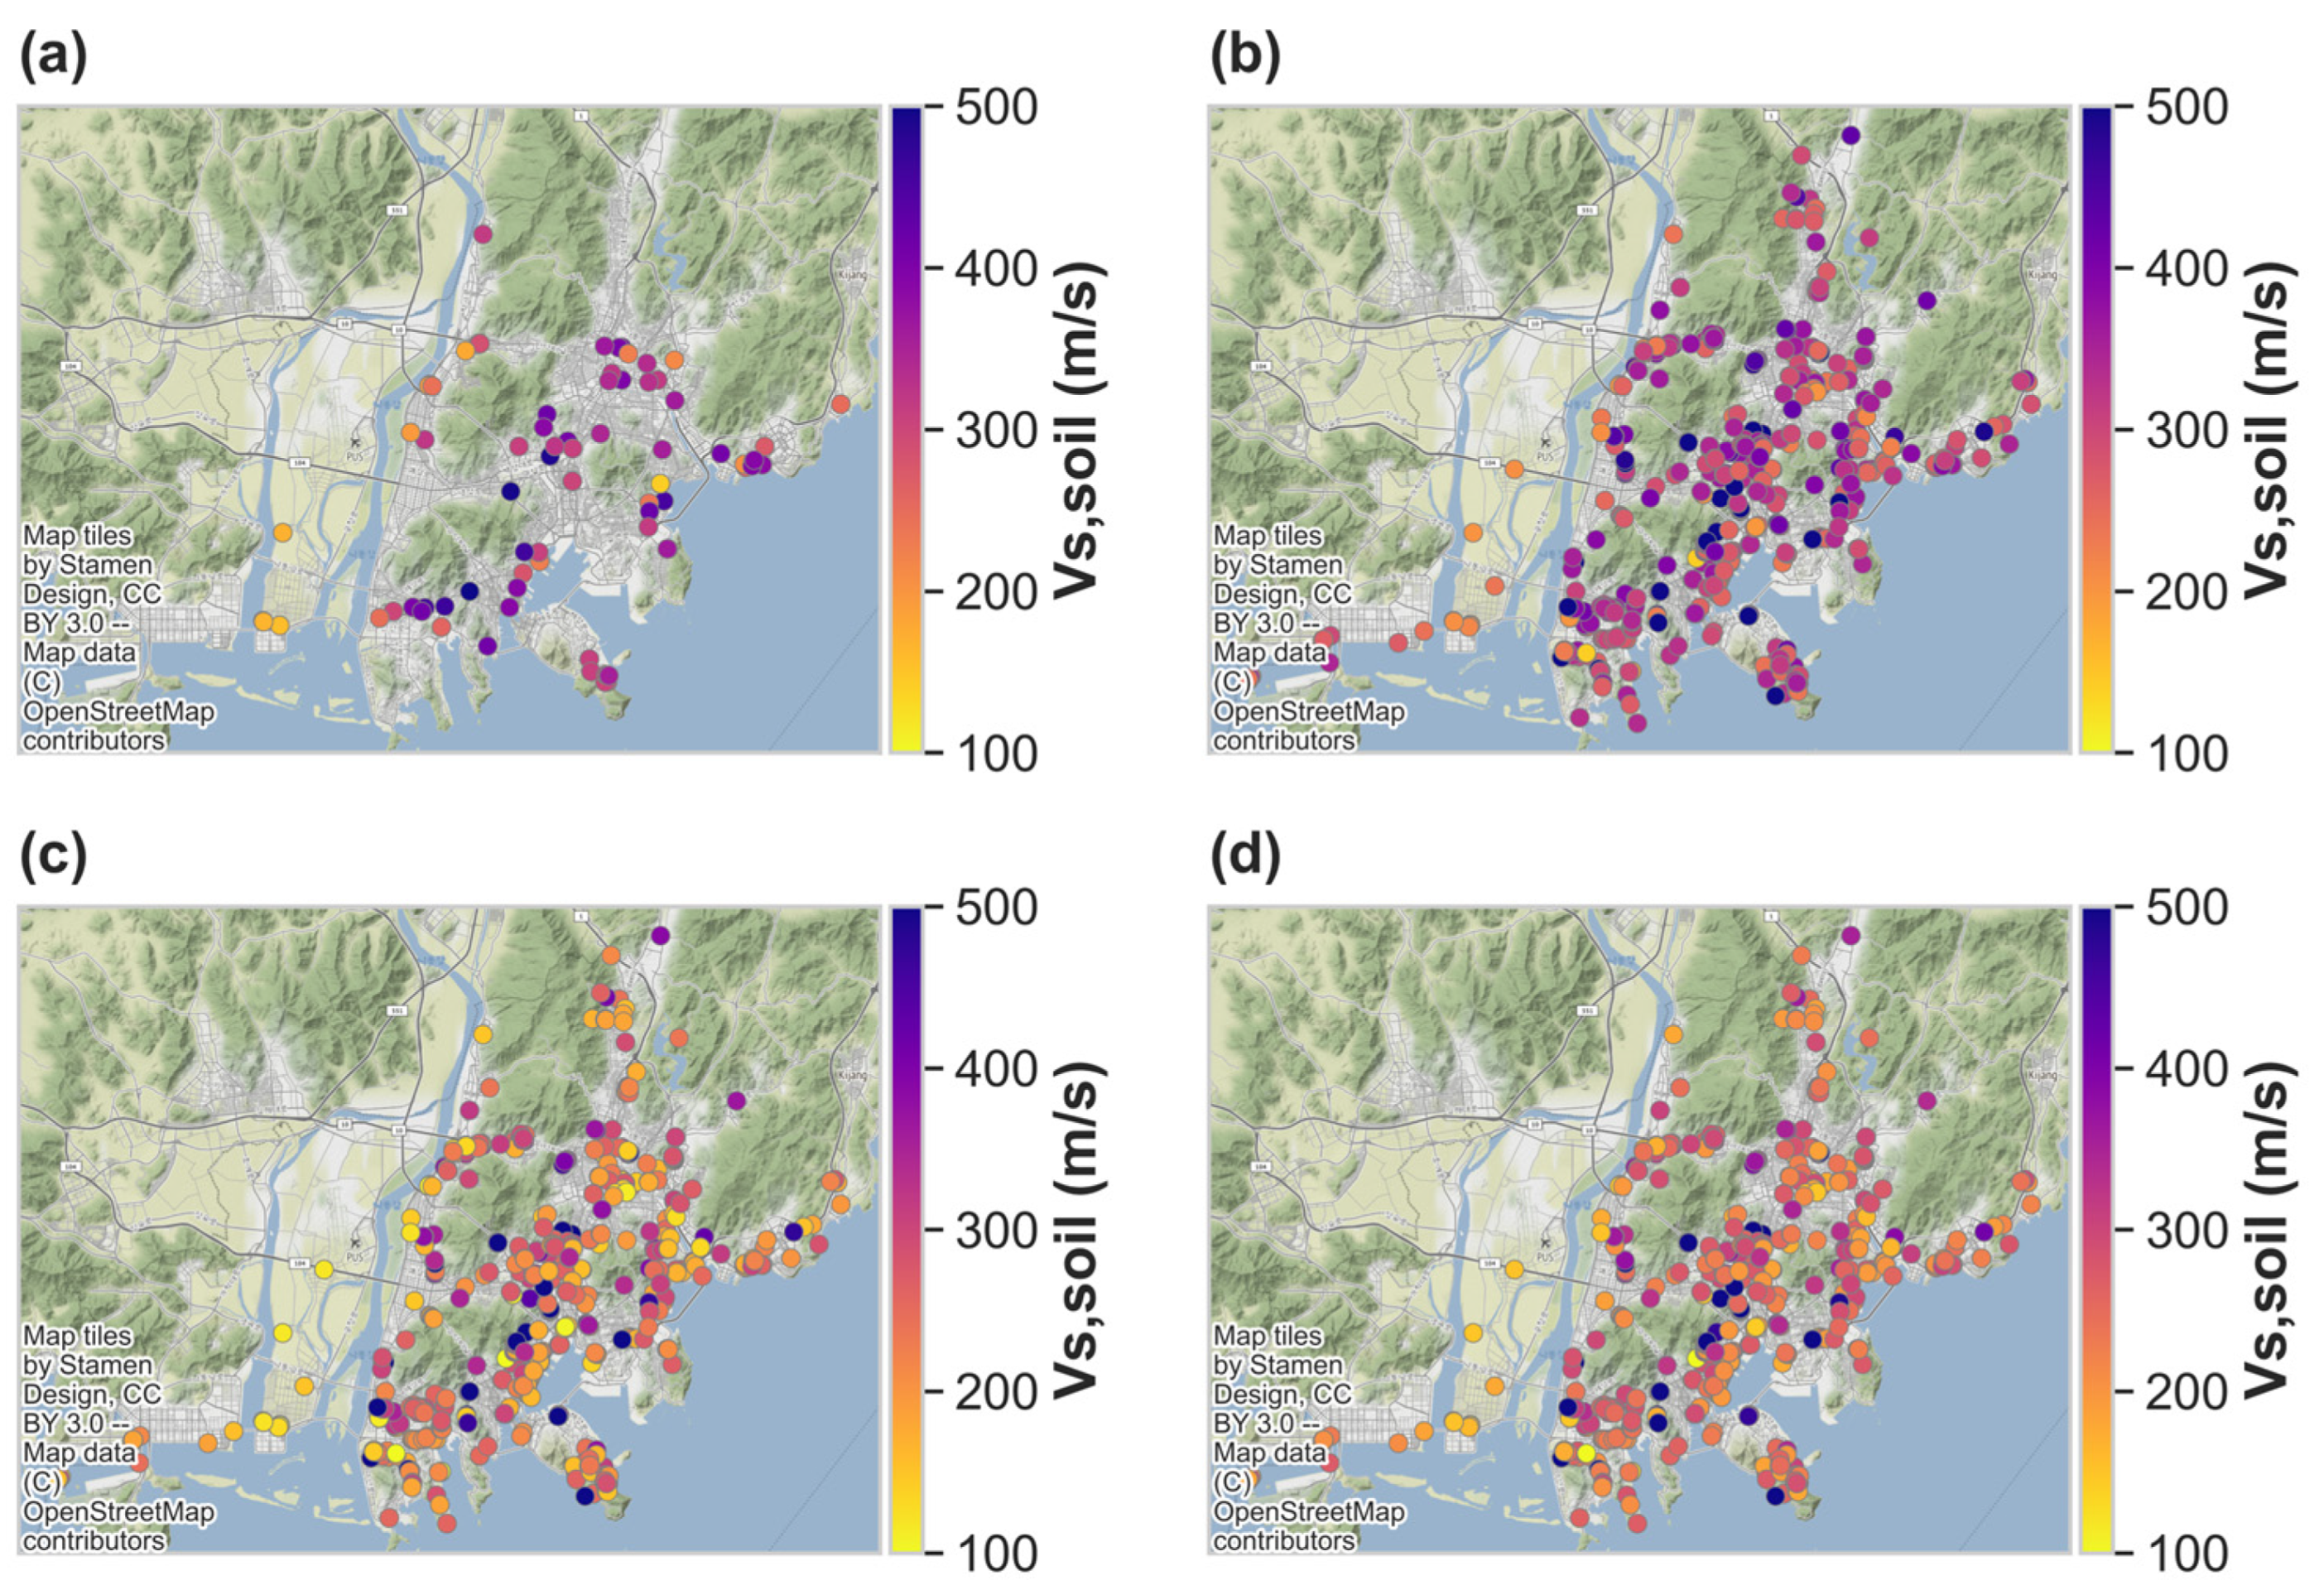
Figure 6 illustrates the distribution of Vs,soil or Vs30 values across different boreholes. In the Nakdonggang delta region, the range of Vs,soil spans approximately 150 to 250 m/s, while in the erosion basin area, the distribution is predominantly above 300 m/s. Specifically, Figure 6a displays the Vs,soil values obtained from field-measured VS data, while Figure 6b–d present Vs,soil values calculated from the N-VS models of HK22, SEA08, and K98, respectively. Within the Nakdonggang delta region, the Vs,soil distributions from the K98 and SEA08 models closely align with the field-measured Vs,soil distribution, falling around 100 to 200 m/s. In contrast, the HK22 model exhibits a higher distribution ranging from 200 to 300 m/s. Conversely, in the erosion basin areas surrounded by mountains and hills, the HK22 model’s Vs,soil distribution surpasses 300 m/s, consistent with the distribution of field-measured Vs,soil. In this region, the K98 and SEA08 models show distributions primarily between 200 to 300 m/s. These observations highlight the variations in predicted Vs,soil values across different N-VS models and terrains, emphasizing the importance of geological attributes in influencing the model’s performance and accuracy.

4. Result and Discussions

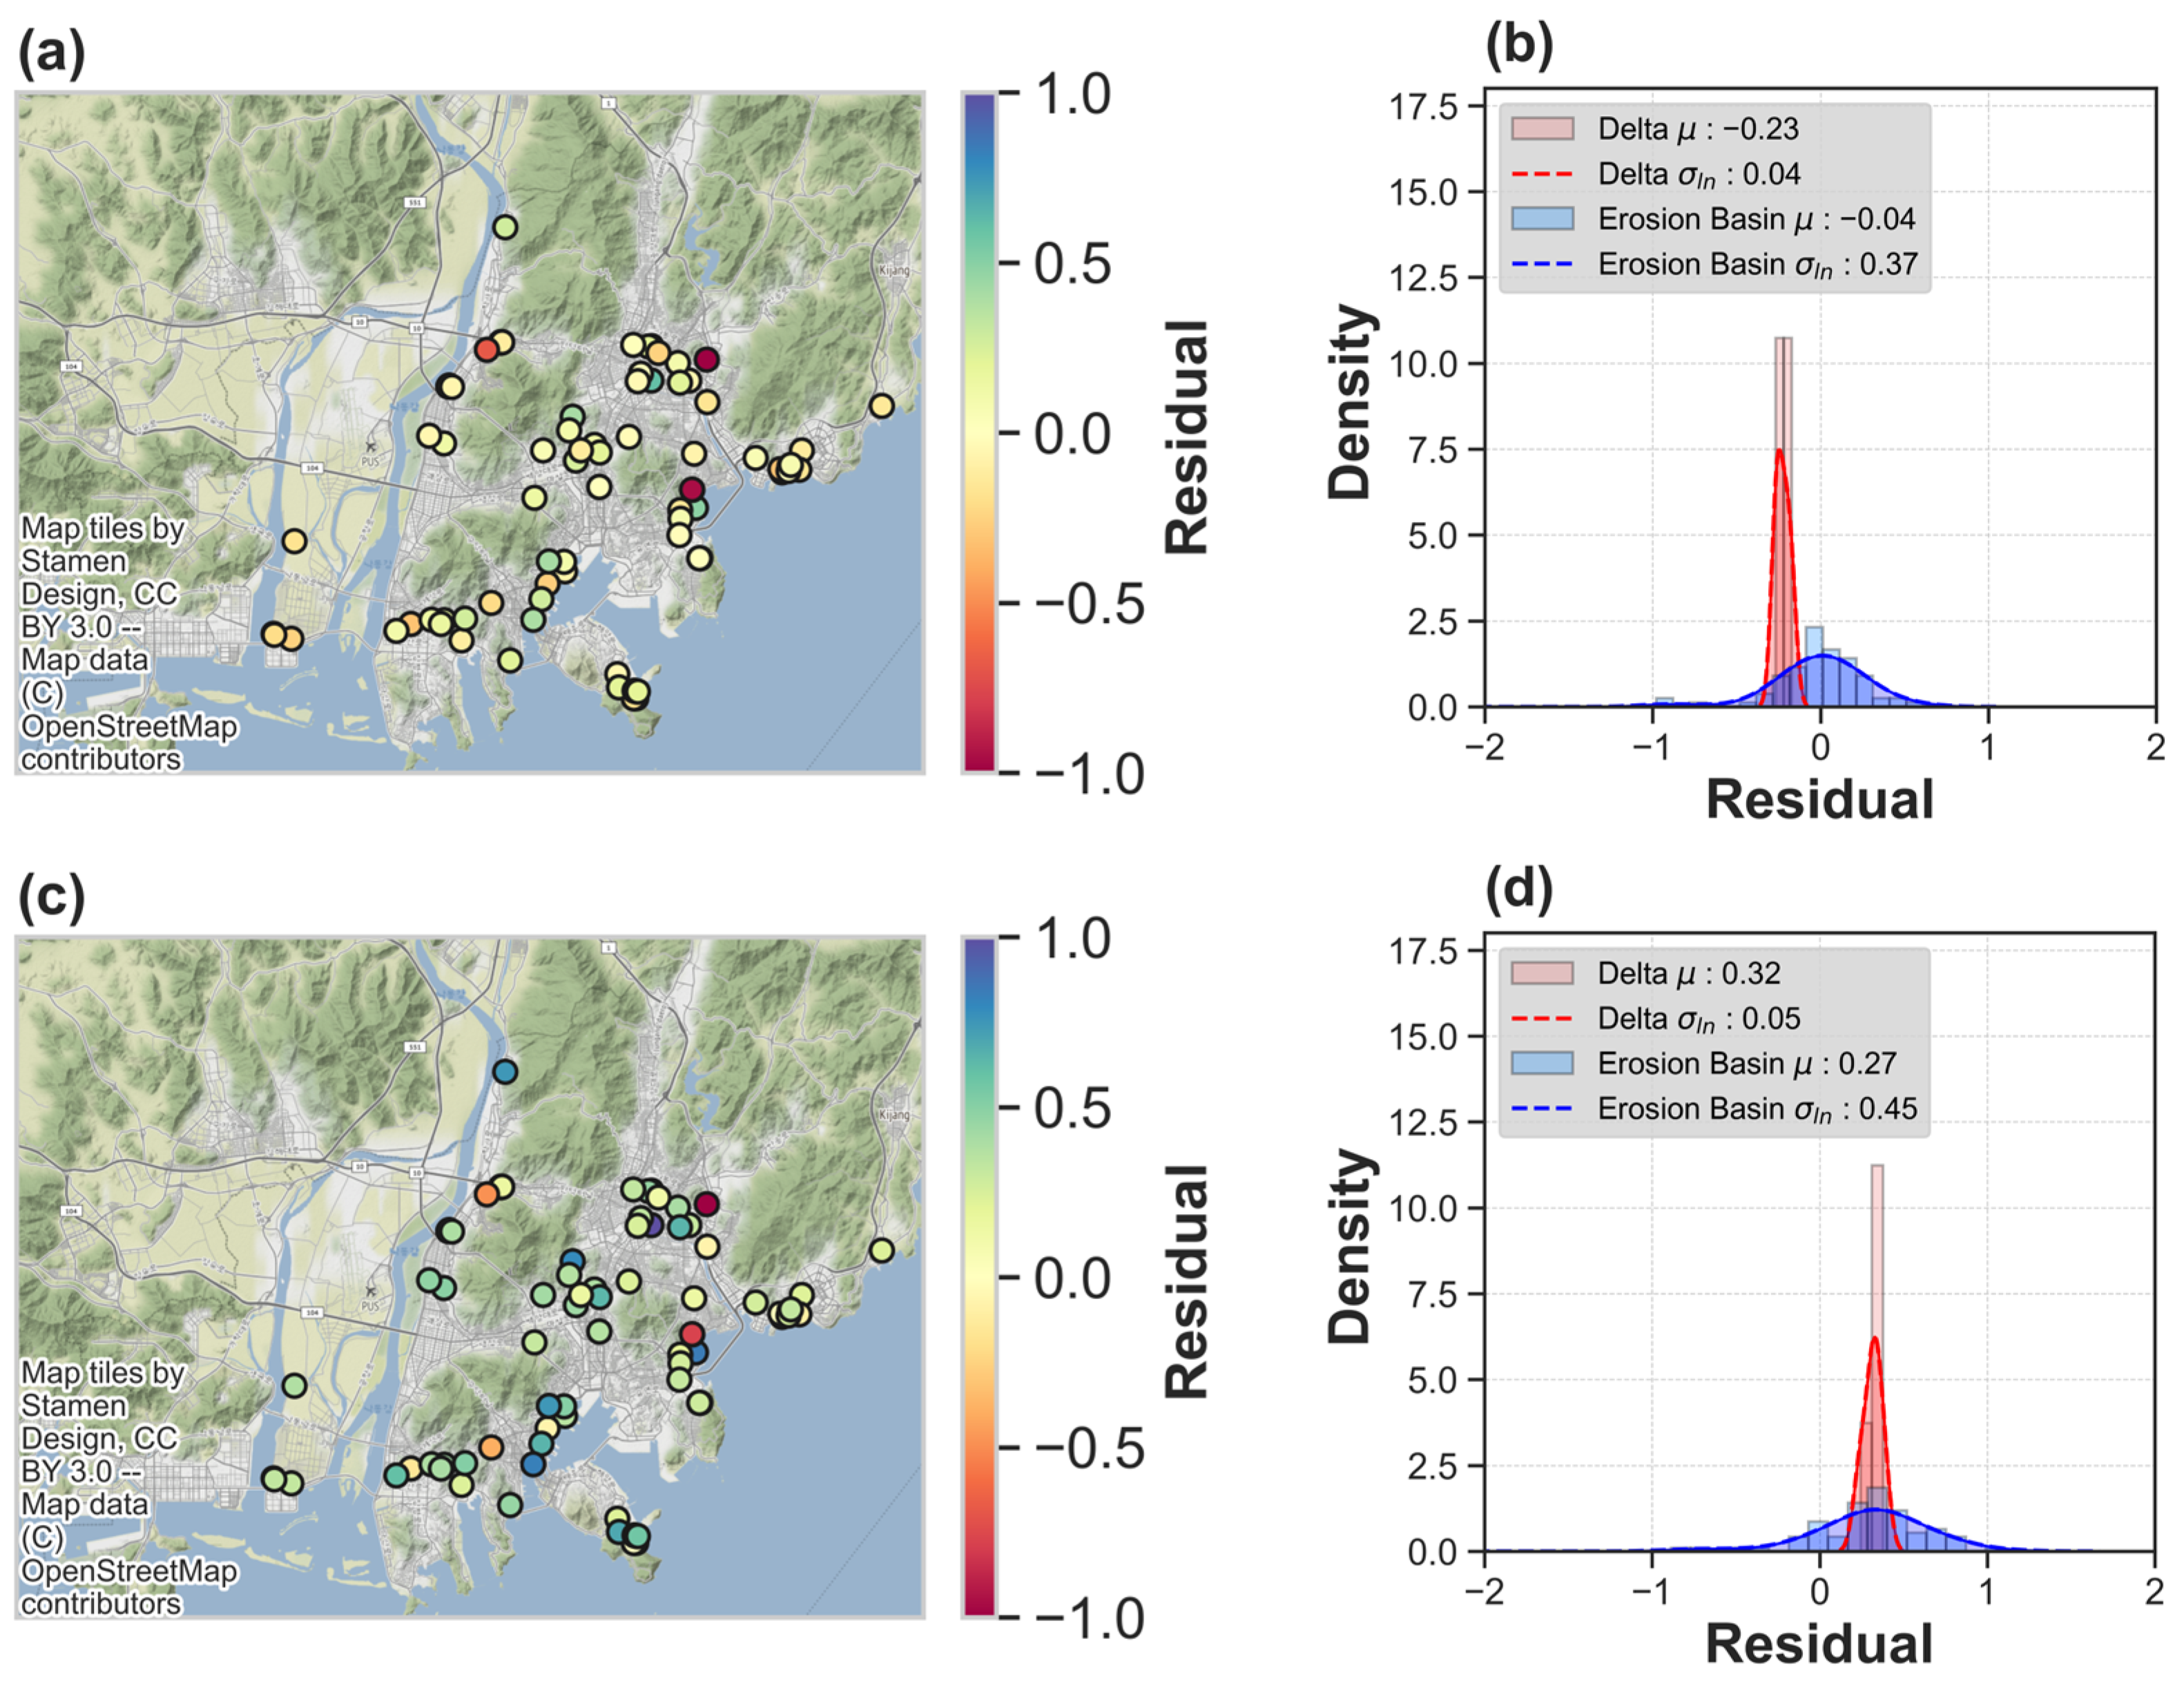
For the purpose of residual analysis, the Vs,soil obtained from measured VS profiles were utilized as the reference. Residuals were calculated as the discrepancy between the log-normal-transformed measured Vs,soil and the predicted log-normal Vs,soil values from each of the three N-VS models [3,6,10]. The log-normal transformation was employed due to the log-normal distribution typically observed in the Vs,soil data. The evaluation of the three models’ performances in both the delta and erosion basin regions involved determining the mean (µ) and standard deviation (σln) of the residuals for each geological attribute within these regions. Figure 7 visually represents the spatial distribution and probability density function of these residuals, while Table 3 offers a summarized account of the µ and σln values associated with each model and region.
Within the delta region, the K98 model exhibited the most favorable performance, demonstrating a µ value near zero. In contrast, the HK22 model predicted higher VS values, resulting in a negative µ, while the SEA08 model predicted lower VS values, leading to a positive µ. The σln values for all models were relatively low (ranging from 0.04 to 0.05), owing to the limited number of reference data points available in the delta region.
Conversely, within the erosion basin region, the HK22 model displayed superior performance. Its µ value was close to zero, and its σln value was the lowest among the three models. The SEA08 and K98 models predicted lower VS values for the erosion basin regions, consequently yielding positive µ values.
Among the three N-VS models evaluated, the HK22 model showcased the most impressive performance in the erosion basin regions. This achievement can be attributed to the fact that the HK22 model incorporated data from the general urban area (depicted in Figure 1) during its development. This wide data inclusion likely contributed to its accurate predictions within the erosion basin regions. However, it should be noted that the HK22 model faced challenges in accurately predicting Vs,soil for the delta region. The K98 model, developed based on reclaimed layers from Yeongjong Island (as shown in Figure 1), demonstrated strong performance within the Nakdonggang delta area. This success aligns with the area’s characteristics, including the presence of thick sedimentary layers and a shallow groundwater table. The SEA08 model exhibited distinct trends in comparison to locally calculated Vs,soil values within the Busan region. This discrepancy might stem from the utilization of a different regional dataset during the development of the SEA08 model. Such discrepancies emphasize the significance of considering the geological attributes of a specific region when selecting and applying N-VS models for accurate predictions.
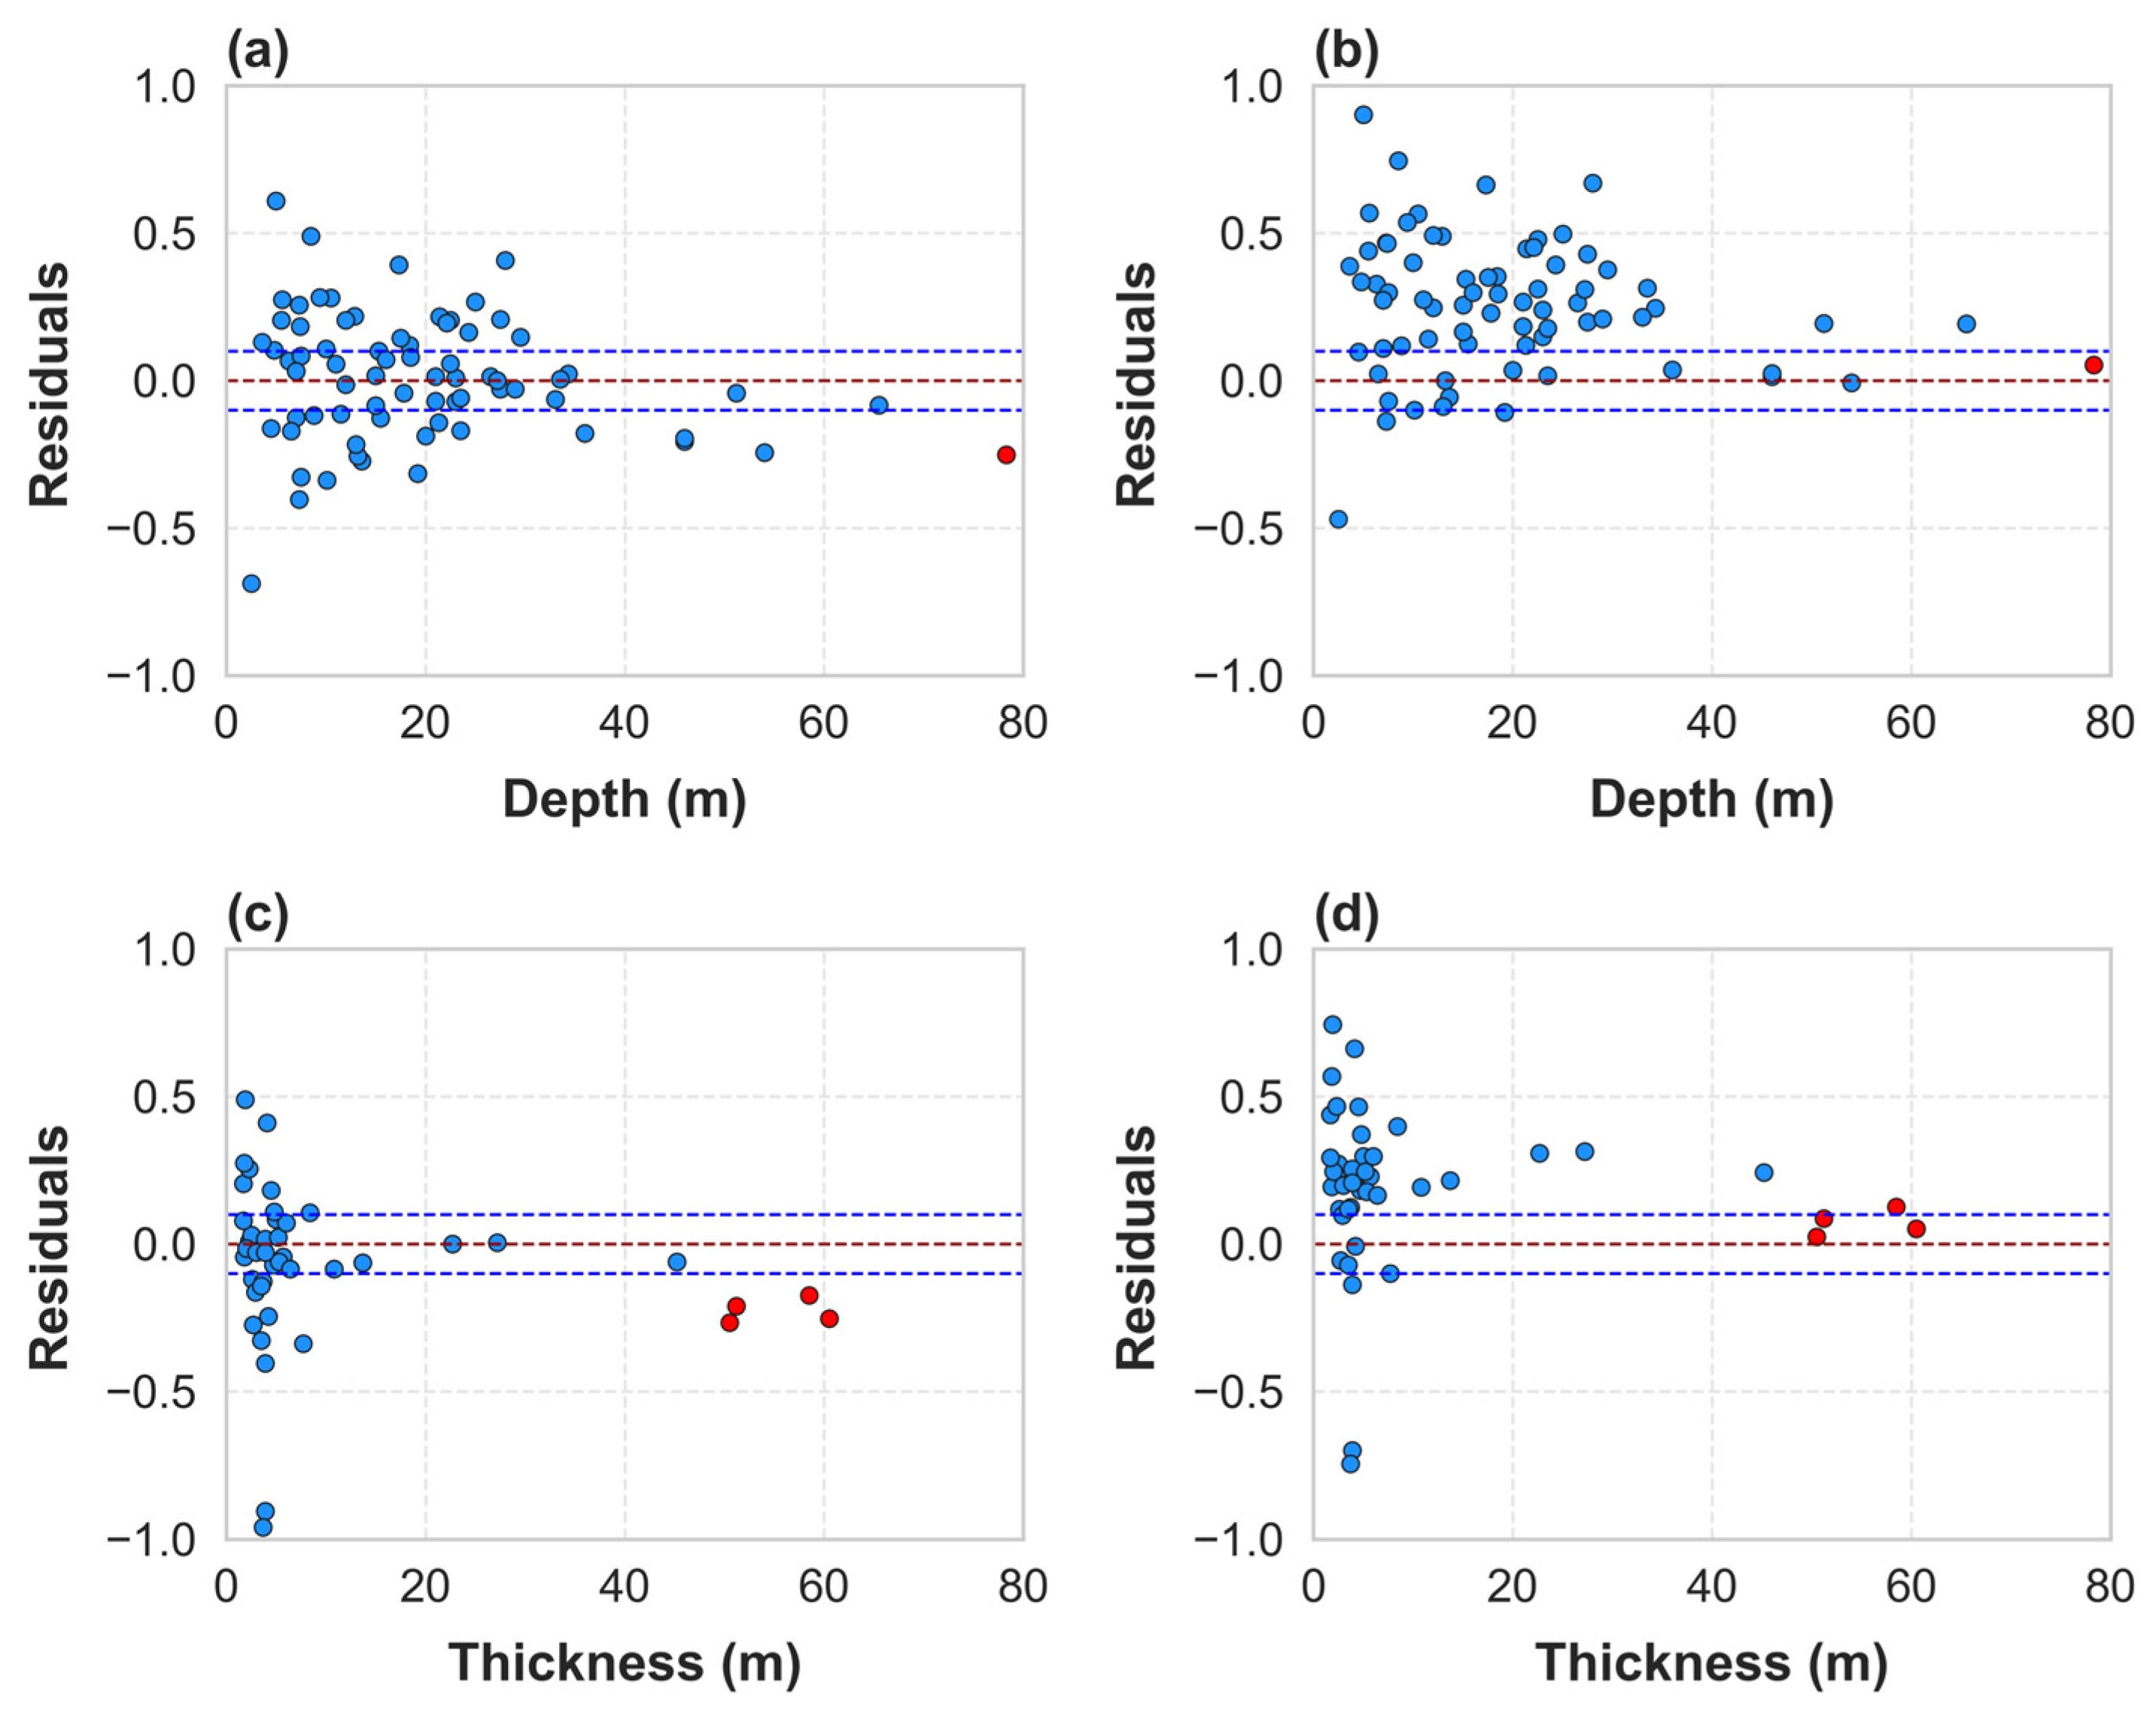
The study conducted a more in-depth analysis of the performance of the HK22 and K98 models based on the variables of bedrock depth and sedimentary layer thickness. Figure 8 provides a visual representation of the residuals in relation to these variables. In the figure, blue dots represent sites within erosion basins, while red dots represent sites in the delta region. The analysis revealed certain trends in the residuals produced by the two models. Residuals generated by the HK22 model exhibited a negative tendency as the bedrock depth increased. Conversely, residuals from the K98 model were distributed near zero when the bedrock depth was deep. In terms of sedimentary layer thickness, the HK22 model resulted in negative residuals for the delta region, whereas the K98 model yielded residuals close to zero in the same region. These observed trends suggest that, apart from geological attributes, the bedrock depth of a specific site plays a significant role in influencing the residuals. This highlights the complex interplay between geological characteristics and other factors when assessing the performance of N-VS models.

5. Conclusions

This study conducted an assessment of previously proposed N-VS relationships by validating the predicted Vs,soil values in two distinct geological regions: the Nakdonggang delta and the erosion basin in Busan, South Korea. The results of the analysis revealed the significant impact of geological conditions on the performance of N-VS relationships. The main findings of this study are summarized as follows:
  • International N-VS models tend to exhibit consistent trends when the geological attributes of the dataset used for model developments are similar. This pattern was observed in cases of deep sedimentary basins including Kim [6] and Chae [1] in South Korea, Rao and Choudhury [9] in India, and Imai and Tonouchi [4] and Ohsaki and Iwasaki [7] in Japan;
  • Through residual analyses, comparisons were made between Vs,soil values derived from field-measured VS and those calculated using N-VS models by Kim [6], Sun et al. [10], and Heo and Kwak [3]. These analyses were conducted separately for the Nakdonggang delta and erosion basin regions. The model developed for reclamation land [6] exhibited satisfactory performance for the delta region. Conversely, the model based on locally sourced data [3] performed well in the erosion basin regions. Residual analyses were conducted, comparing field-measured Vs,soil values with those calculated using N-VS models developed by Kim, Sun et al., and Heo and Kwak. These analyses were performed separately for the Nakdonggang delta and erosion basin regions. The model developed for reclamation land showed satisfactory performance for the delta region, while the model based on data primarily from the urban area demonstrated good performance in the erosion basin regions;
  • In the erosion basin region, a more detailed analysis of the residuals predicted by Heo and Kwak [3] and Kim [6] was conducted, focusing on factors like bedrock depth and sedimentary layer thickness. The presence of negative residuals in areas with deep bedrock depths, similar to the delta region, indicates that geological conditions significantly influence the performance of N-VS relationships.
These findings emphasize the importance of considering the geological context and terrain characteristics when assessing and refining N-VS relationships for predicting VS in different regions. The validated N-VS models presented in this study, tailored to specific geological conditions, can prove valuable in scenarios requiring accurate VS estimations, such as liquefaction assessments using VS values [35,36,37,38,39,40,41,42].

Author Contributions

Conceptualization, G.H., J.K., S.J. and D.K.; methodology, G.H. and D.K.; formal analysis, G.H.; investigation, G.H. and J.K.; resources, S.J. and D.K.; data curation, G.H. and J.K.; writing—original draft preparation, G.H.; writing—review and editing, J.K., S.J. and D.K.; visualization, G.H.; supervision, D.K.; project administration, D.K.; funding acquisition, D.K. All authors have read and agreed to the published version of the manuscript.

Funding

This work was supported by the Ministry of Land, Infrastructure and Transport (MLIT) with the grant number RS-2022-00143584.

Data Availability Statement

The data presented in this study are available on request from the corresponding author.

Acknowledgments

We are grateful to MLIT for operating and maintaining the GeoInfo geotechnical database.

Conflicts of Interest

The authors declare no conflict of interest. The funders had no role in the design of the study; in the collection, analyses, or interpretation of data; in the writing of the manuscript; or in the decision to publish the results.

References

  1. Chae, H.Y. Evaluation of Saemangeum Dreged Solil by Shear Wave Velocity in the Geophysical Logging. Ph.D. Thesis, Hanyang University, Seoul, Republic of Koea, 2014. [Google Scholar]
  2. Do, J.; Hwang, P.; Chung, S.; Chun, B. Analysis on Relation of S-wave Velocity and N Value for Stratums in Chungcheong Buk-do. J. Korean GEO-Environ. Soc. 2011, 12, 13–22. [Google Scholar]
  3. Heo, G.S.; Kwak, D.Y. Vs Prediction Model Using SPT-N Values and Soil Layers in South Korea. J. Korean Geotech. Soc. 2022, 38, 53–66. [Google Scholar]
  4. Imai, T.; Tonoughi, K. Correlation of N value with S-wave velocity and shear modulus. In Penetration Testing, Volume 1; Routledge: Oxfordshire, UK, 2021; pp. 67–72. [Google Scholar]
  5. Imai, T.; Yoshimura, Y. Elastic wave velocity and soil properties in soft soil. Tsuchito-Kiso 1970, 18, 17–22. [Google Scholar]
  6. Kim, D.S. Development of Quality Evaluation Technique of Ground Improvement on Sands Using SASW Method; Ministry of Land, Infrastructure and Transport: Sejong-Si, Republic of Koea, 1998.
  7. Ohsaki, Y.; Iwasaki, R. On dynamic shear moduli and Poisson’s ratios of soil deposits. Soils Found. 1973, 13, 61–73. [Google Scholar] [CrossRef]
  8. Ohta, Y.; Goto, N. Empirical shear wave velocity equations in terms of characteristic soil indexes. Earthq. Eng. Struct. Dyn. 1978, 6, 167–187. [Google Scholar] [CrossRef]
  9. Rao, V.D.; Choudhury, D. Estimation of shear wave velocity and seismic site characterization for new nuclear power plant region, India. Nat. Hazards Rev. 2020, 21, 06020004. [Google Scholar] [CrossRef]
  10. Sun, C.-G.; Kim, H.-J.; Chung, C.-K. Deduction of correlations between shear wave velocity and geotechnical in-situ penetration test data. J. Earthq. Eng. Soc. Korea 2008, 12, 1–10. [Google Scholar]
  11. Akkaya, İ.; Özvan, A.; Özvan, E.E. A new empirical correlation between pressuremeter modules (EM) and shear wave velocity (Vs) for clay soils. J. Appl. Geophys. 2019, 171, 103865. [Google Scholar] [CrossRef]
  12. Hasancebi, N.; Ulusay, R. Empirical correlations between shear wave velocity and penetration resistance for ground shaking assessments. Bull. Eng. Geol. Environ. 2007, 66, 203–213. [Google Scholar] [CrossRef]
  13. Pitilakis, K.; Raptakis, D.; Lontzetidis, K.; Tika-Vassilikou, T.; Jongmans, D. Geotechnical and geophysical description of EURO-SEISTEST, using field, laboratory tests and moderate strong motion recordings. J. Earthq. Eng. 1999, 3, 381–409. [Google Scholar] [CrossRef]
  14. Uma Maheswari, R.; Boominathan, A.; Dodagoudar, G. Use of surface waves in statistical correlations of shear wave velocity and penetration resistance of Chennai soils. Geotech. Geol. Eng. 2010, 28, 119–137. [Google Scholar] [CrossRef]
  15. Brandenberg, S.J.; Bellana, N.; Shantz, T. Shear wave velocity as function of standard penetration test resistance and vertical effective stress at California bridge sites. Soil Dyn. Earthq. Eng. 2010, 30, 1026–1035. [Google Scholar] [CrossRef]
  16. Kwak, D.Y.; Brandenberg, S.J.; Mikami, A.; Stewart, J.P. Prediction equations for estimating shear-wave velocity from combined geotechnical and geomorphic indexes based on Japanese data set. Bull. Seismol. Soc. Am. 2015, 105, 1919–1930. [Google Scholar] [CrossRef]
  17. Rahimi, S.; Wood, C.M.; Wotherspoon, L.M. Influence of soil aging on SPT-Vs correlation and seismic site classification. Eng. Geol. 2020, 272, 105653. [Google Scholar] [CrossRef]
  18. Piratheepan, P. Estimating Shear-Wave Velocity from SPT and CPT Data. Master’s Thesis, Clemson University, Clemson, SC, USA, 2002. [Google Scholar]
  19. Dikmen, Ü. Statistical correlations of shear wave velocity and penetration resistance for soils. J. Geophys. Eng. 2009, 6, 61–72. [Google Scholar] [CrossRef]
  20. Jeong, E. Evolution Study of Sedimentary Environments of Late Pleistocene Caused by Sea-Level Changes in the Nakdong River Estuary, Korea; Kangwon National University: Chuncheon, Republic of Korea, 2017. [Google Scholar]
  21. Yoon, H.S.; Yoo, C.-I.; Kang, Y.-K.; Ryu, C.-R. Delta development in the Nakdong river estuary: A literature survey. J. Ocean Eng. Technol. 2007, 21, 22–34. [Google Scholar]
  22. Lee, S.; Yang, M.; Lee, C. Time series analysis of area of deltaic barrier island in Nakdong River using Landsat satellite image. J. Korean Soc. Surv. Geod. Photogramm. Cartogr. 2016, 34, 457–469. [Google Scholar] [CrossRef]
  23. Chang, C.H. A study on shapes and genetic process of erosion basins. J. Photo Geogr. 1997, 6, 1–16. [Google Scholar]
  24. Lee, G.R. Formation Ages of Alluvial Fans in Granite Erosional Basins, South Korea. J. Korean Geomorphol. Assoc. 2022, 29, 21–34. [Google Scholar] [CrossRef]
  25. Lee, G.R.; Park, C.S.; Kim, J.Y.; Lee, H.B.; Jeong, J.-Y. Analysis on Surface Relief of Granitic Erosional Basin in the Middle Part of the Korean Peninsula—A Case Study on the Chuncheon, Wonju, Yeongju and Boeun Basins–. J. Korean Geomorphol. Assoc. 2022, 29, 1–12. [Google Scholar]
  26. Youn, I.H. The Geomorphic Characteristics of Okcheon Basin & Jincheon Basin. J. Korean Assoc. Reg. Geogr. 2001, 7, 93–104. [Google Scholar]
  27. Hwang, S.I. The Geomorphic development of alluvial fans in Cheongdo basin, Gyeongsangbuk-do (Province), South Korea. J. Korean Geogr. Soc. 2004, 39, 514–527. [Google Scholar]
  28. Bull, W.B. The alluvial-fan environment. Prog. Phys. Geogr. 1977, 1, 222–270. [Google Scholar] [CrossRef]
  29. Yoon, S.O.; Saito, K.; Hwang, S.I.; Oguchi, T.; Tanaka, Y. Morphometric Characteristics of Alluvial Fans in South Korea and Comparisons with those of Japan, Taiwan and the Philippines. J. Korean Geogr. Soc. 2010, 45, 431–443. [Google Scholar]
  30. Yoon, S.O.; Saito, K.; Hwang, S.I.; Tanaka, Y.; Oguchi, T. The theoretical study and distributional characteristics of alluvial fans in Korean Peninsula. J. Korean Geogr. Soc. 2005, 40, 335–352. [Google Scholar]
  31. Oguchi, T.; Saito, K.; Kadomura, H.; Grossman, M. Fluvial geomorphology and paleohydrology in Japan. Geomorphology 2001, 39, 3–19. [Google Scholar] [CrossRef]
  32. Yoshikawa, T. Denudation and tectonic movement in contemporary Japan. Bull. Dep. Geogr. Univ. Tokyo 1974, 6, 1–14. [Google Scholar]
  33. Choi, I.H.; Kwak, D.Y. Comparison of Methods Predicting Vs30 from Shallow Vs Profiles and Suggestion of Optimized Coefficients. J. Korean Geotech. Soc. 2020, 36, 15–23. [Google Scholar]
  34. Kim, J.; Heo, G.; Kwak, D.; Jeong, S. The Relationship between Bedrock Depth and Site Fundamental Frequency in the Nakdonggang Delta Region, South Korea. Geotechnics 2023, 3, 550–560. [Google Scholar] [CrossRef]
  35. Andrus, R.D.; Stokoe II, K.H. Liquefaction resistance of soils from shear-wave velocity. J. Geotech. Geoenviron. Eng. 2000, 126, 1015–1025. [Google Scholar] [CrossRef]
  36. Andrus, R.D.; Piratheepan, P.; Ellis, B.S.; Zhang, J.; Juang, C.H. Comparing liquefaction evaluation methods using penetration-Vs relationships. Soil Dyn. Earthq. Eng. 2004, 24, 713–721. [Google Scholar] [CrossRef]
  37. Aytaş, Z.; Alpaslan, N.; Özçep, F. Evaluation of liquefaction potential by standard penetration test and shear wave velocity methods: A case study. Nat. Hazards 2023, 118, 2377–2417. [Google Scholar] [CrossRef]
  38. Ji, Y.; Kim, B.; Kim, K. Evaluation of liquefaction potentials based on shear wave velocities in Pohang City, South Korea. Int. J. Geo-Eng. 2021, 12, 3. [Google Scholar] [CrossRef]
  39. Johari, A.; Khodaparast, A.; Javadi, A. An analytical approach to probabilistic modeling of liquefaction based on shear wave velocity. Iran. J. Sci. Technol. Trans. Civ. Eng. 2019, 43, 263–275. [Google Scholar] [CrossRef]
  40. Kayabali, K. Soil liquefaction evaluation using shear wave velocity. Eng. Geol. 1996, 44, 121–127. [Google Scholar] [CrossRef]
  41. Oshnavieh, D.; Bagherzadeh Khalkhali, A. Use of shear wave velocity in evaluation of soil layer’s condition after liquefaction. J. Civ. Eng. Mater. Appl. 2019, 3, 119–135. [Google Scholar]
  42. Ulmer, K.J.; Green, R.A.; Rodriguez-Marek, A. A consistent correlation between Vs, SPT, and CPT metrics for use in liquefaction evaluation procedures. In Proceedings of the Geo-Congress 2020, Minneapolis, MN, USA, 25–28 February 2020; pp. 132–140. [Google Scholar]
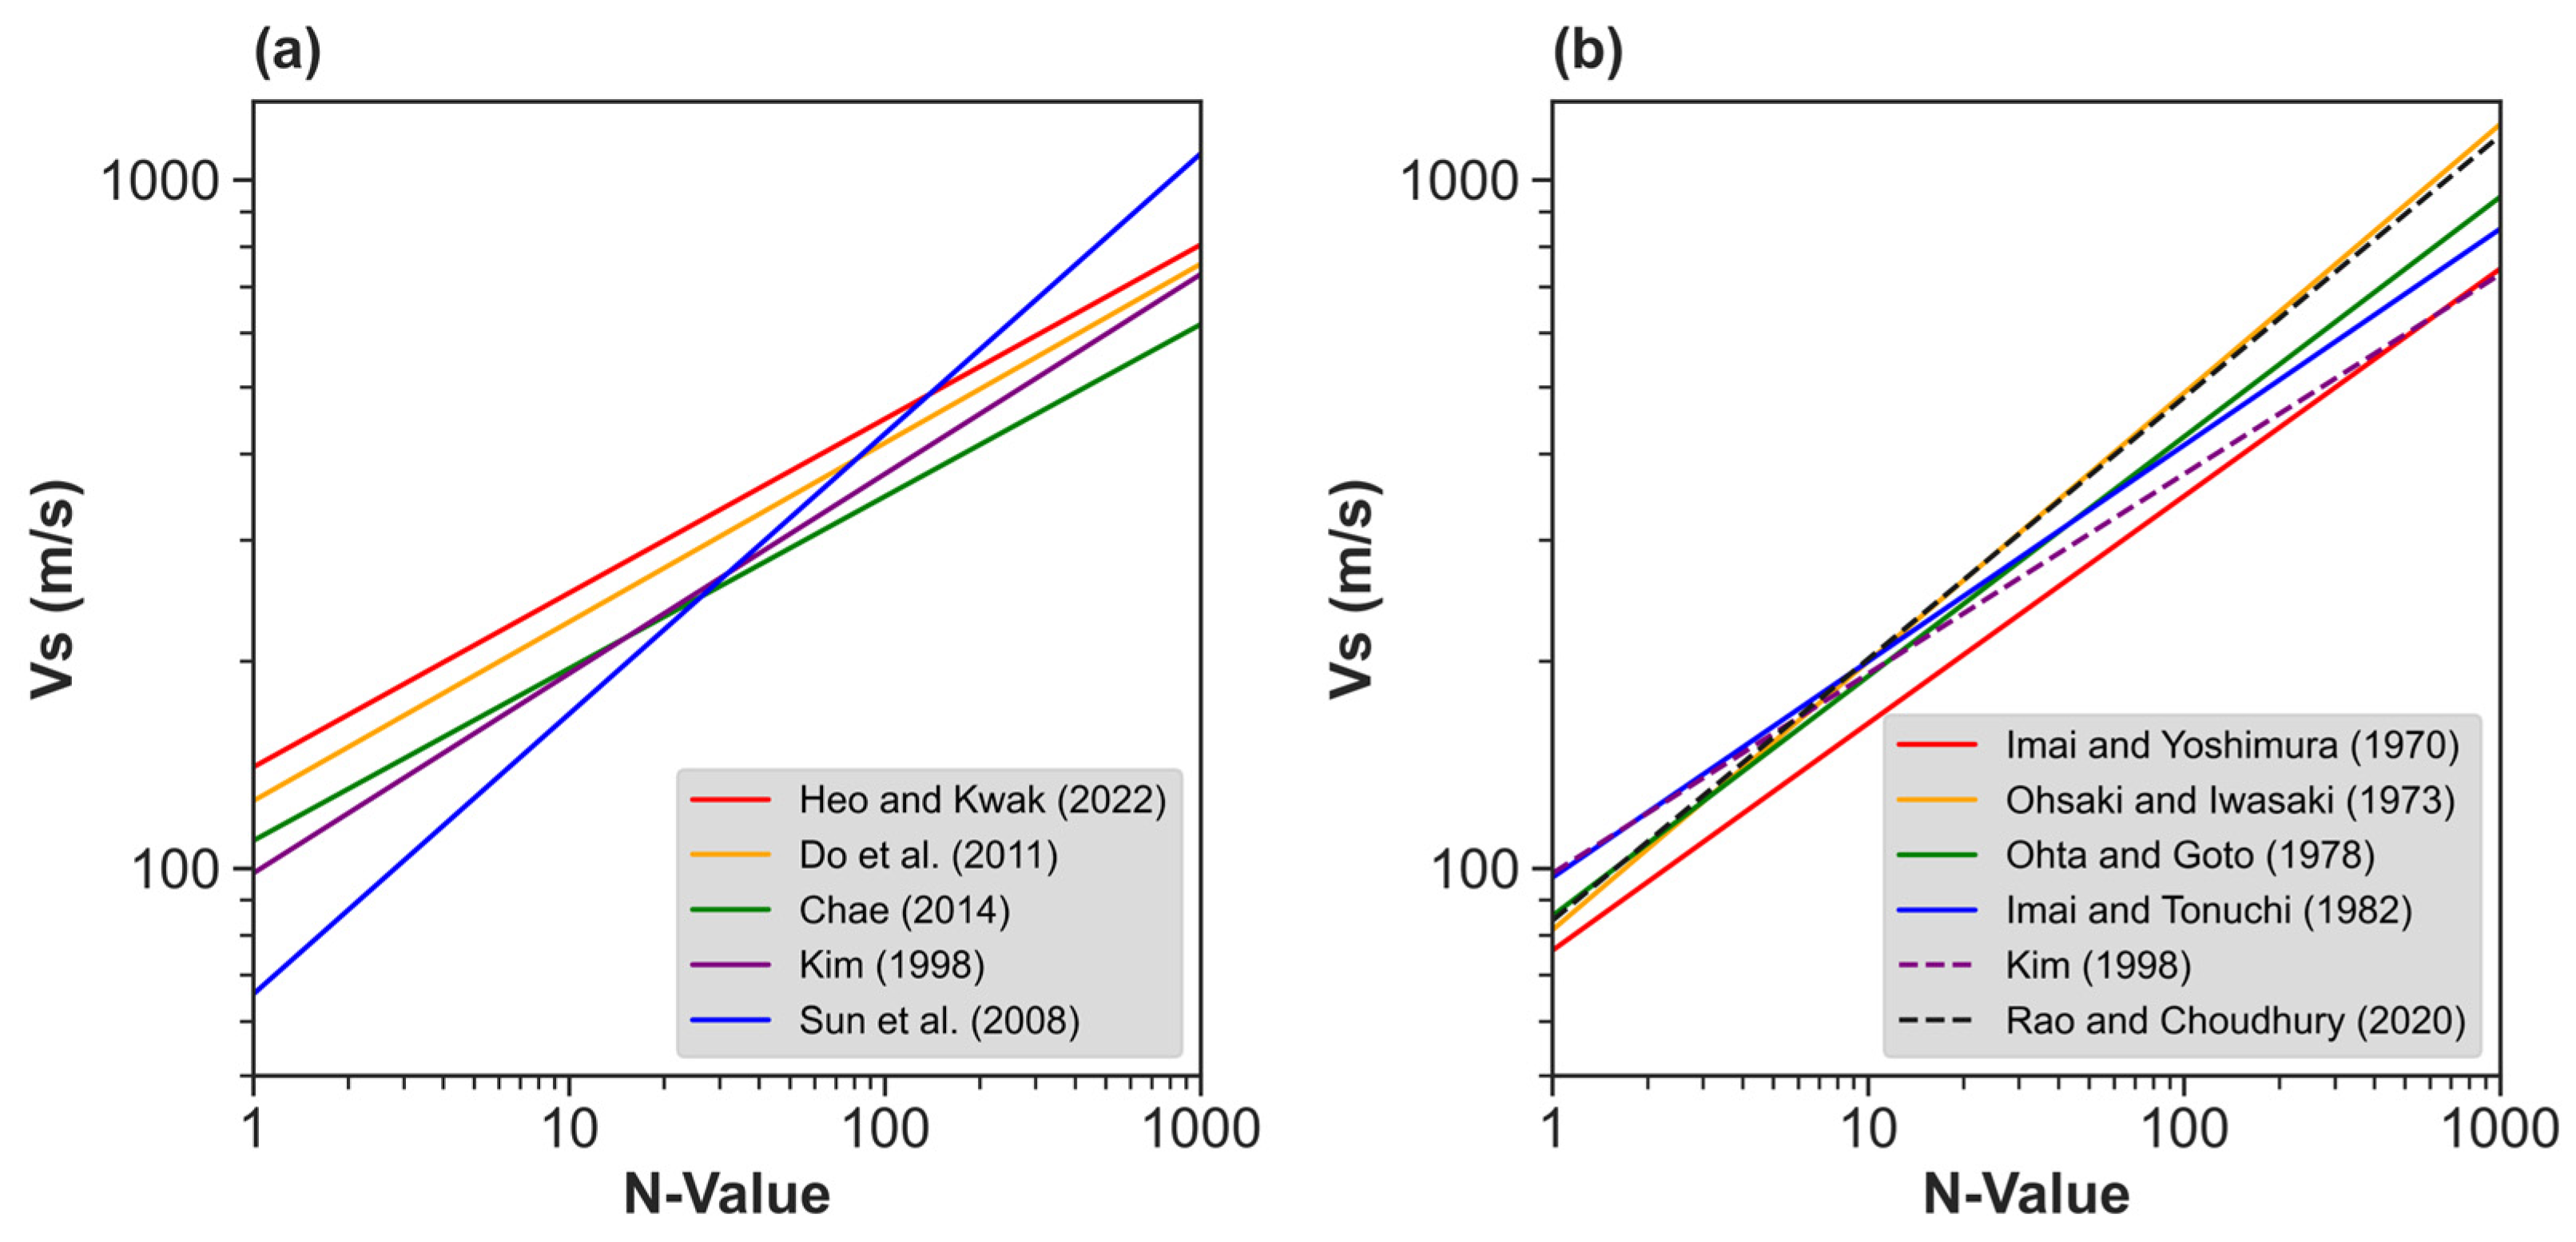
Figure 1. Location of dataset used for model development for each model [1,2,3,6,10].
Geotechnics 03 00054 g001
Figure 2. N-VS models proposed in different countries: (a) South Korea and (b) other countries [1,2,3,4,5,6,7,8,9,10].
Geotechnics 03 00054 g002
Figure 3. Regions of the Nakdonggang delta and erosion basin and locations of boring log data in Busan.
Geotechnics 03 00054 g003
Figure 4. (a) Thickness of sedimentary layers and (b) depth to the bedrock of boreholes in the Busan region.
Geotechnics 03 00054 g004
Figure 5. Relationship between N value and VS. Blue dots indicate sites at erosion basins and red dots indicate sites at the delta region. Regression models [3,6,10] are overlapped.
Geotechnics 03 00054 g005
Figure 6. Distribution of Vs,soil at boreholes in Busan region calculated using various ways: (a) direct VS measurements, (b) VS predicted using HK22, (c) VS predicted using SEA08, and (d) VS predicted using K98.
Geotechnics 03 00054 g006
Figure 7. Spatial distribution of Vs,soil residuals using (a) HK22, (c) SEA08, and (e) K98 and population density at the delta region (red) and erosion basin regions (blue) using (b) HK22, (d) SEA08, and (f) K98.
Geotechnics 03 00054 g007aGeotechnics 03 00054 g007b
Figure 8. Distribution of residuals versus the bedrock depth for (a) HK22 and (b) K98 and thickness of sedimentary erosion basin regions for (c) HK22 and (d) K98.
Geotechnics 03 00054 g008
Table 1. N-VS models of previous studies for each country.
CountryStudyN-VS (m/s) Model *Type R 2
JapanImai and Yoshimura [5] V S = 76 N 0.33 All soil-
Ohsaki and Iwasaki [7] V S = 81.4 N 0.39 All soil0.89
V S = 59.4 N 0.47 Sand-
Ohta and Goto [8] V S = 85.35 N 0.348 All soil (Pleistoene)0.72
V S = 92.2 N 0.27 All soil (Holocene)-
V S = 88.4 N 0.333 Sand (Pleistoene)-
V S = 86.9 N 0.333 Clay (Pleistoene)-
Imai and Tonouchi [4] V S = 97 N 0.314 All soil0.87
V S = 87.8 N 0.314 Sand 0.69
V S = 107 N 0.274 Clay0.72
KoreaSun et al. [10] V S = 65.64 N 0.407 All soil0.56
V S = 82.01 N 0.319 Sand and Silt0.34
V S = 78.63 N 0.361 Gravel0.33
V S = 75.76 N 0.371 Weathered soil0.25
V S = 107.94 N 0.418 Weathered rock0.22
Do et al. [2] V S = 125.3 N 0.26 All soil0.70
V S = 111.7 N 0.32 Sand0.65
V S = 117.6 N 0.28 Clay0.49
V S = 111.1 N 0.27 Gravel0.59
V S = 176.5 N 0.17 Weathered soil0.29
V S = 215.5 N 0.18 Weathered rock0.25
Heo and Kwak [3] V S = 140.3 N 0.2529 All soil0.72
V S = 129.5 N 0.22 D 0.098 All soil0.73
V S = 159.2 N 0.1706 Sand0.17
V S = 140.5 N 0.2142 Clay and Silt0.18
V S = 153.2 N 0.201 Gravel0.23
V S = 151 N 0.2363 Weathered soil0.32
V S = 313.8 N 0.1149 Weathered rock0.06
Chae [1] V S = 109.7 N 0.25 All soil0.69
V S = 75.5 N 0.176 D 0.196 All soil0.83
V S = 85.5 N 0.31 Sand 0.77
V S = 132.4 N 0.187 Clay and Silt0.41
Kim [6] V S = 98.38 N 0.29 All soil-
IndiaRao and Choudhury [9] V S = 84 N 0.38 All soil0.90
* N: SPT N-value; D: depth in meter unit.
Table 2. Quantile of depth for each type of layer depending on regions.
DeltaErosion Basin
Top–Bot (m)Top–Bot (m)
LayerCount25%50%75%Count25%50%75%
Fill4350.0–0.80.0–1.40.0–3.514490.0–1.50.0–2.30.0–4.0
AS4710.7–491.2–592.8–657261.5–5.02.4–7.54.0–15
WS4627–3165–6767–7011542.0–6.54.2–118.0–18
WR11559–6567–7373–8110776.5–1012–1819–28
Table 3. Mean and standard deviation of residuals.
RegionModelMean (μ)Standard Deviation (σln)
DeltaHeo and Kwak [3] (HK22)−0.230.04
Sun et al. [10] (SEA08)0.320.05
Kim [6] (K98)0.070.04
Erosion basinHeo and Kwak [3] (HK22)−0.040.37
Sun et al. [10] (SEA08)0.270.45
Kim [6] (K98)0.210.39
Disclaimer/Publisher’s Note: The statements, opinions and data contained in all publications are solely those of the individual author(s) and contributor(s) and not of MDPI and/or the editor(s). MDPI and/or the editor(s) disclaim responsibility for any injury to people or property resulting from any ideas, methods, instructions or products referred to in the content.