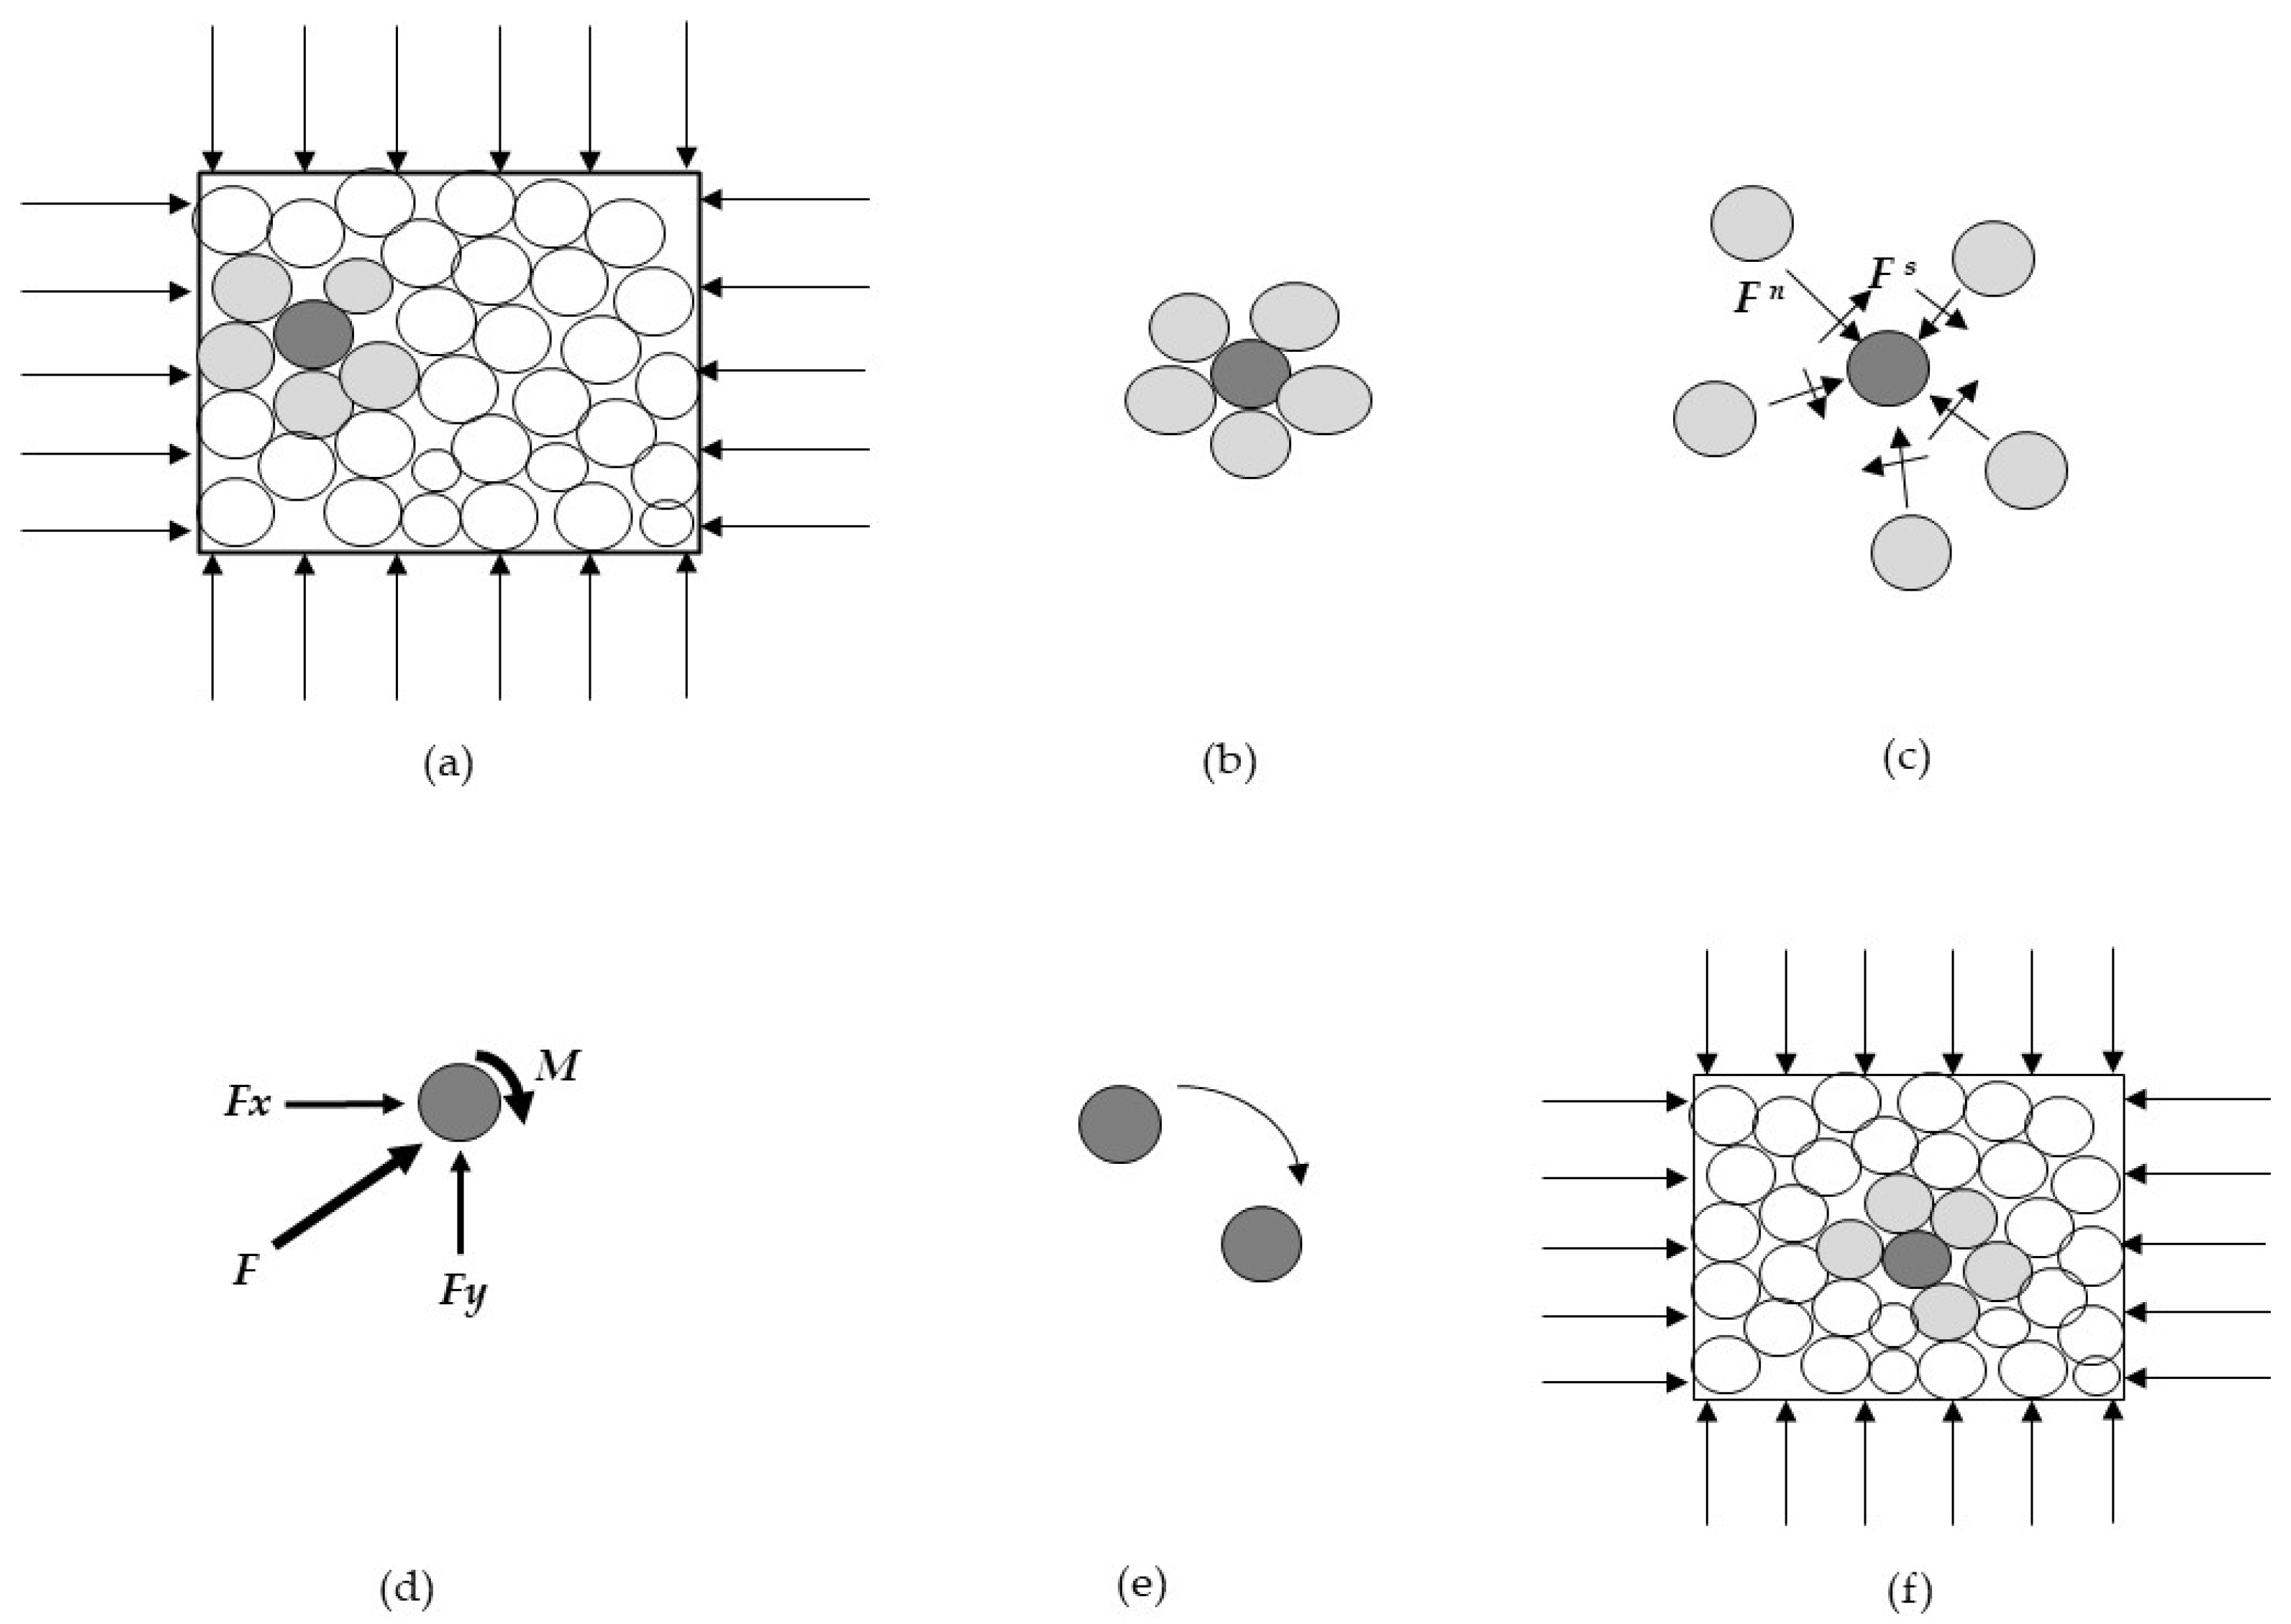
Thirty biaxial tests in total were conducted to investigate the sensitivity of inter-particle properties on the micro–macro mechanical behaviour. The initial condition, such as the initial geometry of the biaxial chamber, particle size distribution, particle shape, contact model, porosity and isotropic stress state condition, and the lateral boundary condition for all these tests, were similar. Initially, non-overlapping disk particles in the range of 0.5 and 3 (mm) corresponding to the well grade of sand were randomly placed at half their size within four enclosed rigid walls. Their radii were then expanded to reach a porosity of 0.12. Next, the rigid boundaries of the biaxial cell were moved based on the applied strain control to approach the stress at the boundaries at 100 (kPa). Once the sample was isotopically consolidated to 100 (kPa), further cycles were needed to reach system equilibrium. It is to be noted that the porosity 0.12 mentioned in
Table 2 is the porosity after radius enlargement. Next, the confining pressure on the vertical rigid boundaries was kept constant while the top and bottom rigid boundaries moved towards each other to apply deviatoric stress. The strain rate (i.e.,
) applied for this test was
, such that the incremental acceleration of each particle at each time step is small. All the imposed energy generated during the simulation was dissipated through both frictional sliding between particles and loss of contacts. In the sensitivity analysis, the critical parameters and the range over which the parameters impact the macro-mechanical behaviour are investigated. From each combination of normal stiffness, shear stiffness, and inter-particle coefficient of friction (i.e.,
), the macro-mechanical parameters comprising Young’s modulus, Poisson’s ratio, and angle of internal friction were computed. These values will then be compared with typical values of elastic modulus, Poisson’s ratio, and angle of internal friction of sand obtained from the literature (see
Table 4).
4.4.1. The Sensitivity of Sand System to the Inter-Particle Coefficient Friction
To investigate the sensitivity of the micro–macro-mechanical behaviour of particulate sand to the inter-particle coefficient friction, the ratio between normal contact stiffness and shear contact stiffness is assumed to be unity. By doing this, the number of biaxial tests required to be implemented was reduced to fifteen tests. The inter-particle properties used for these tests are listed in
Table 5.
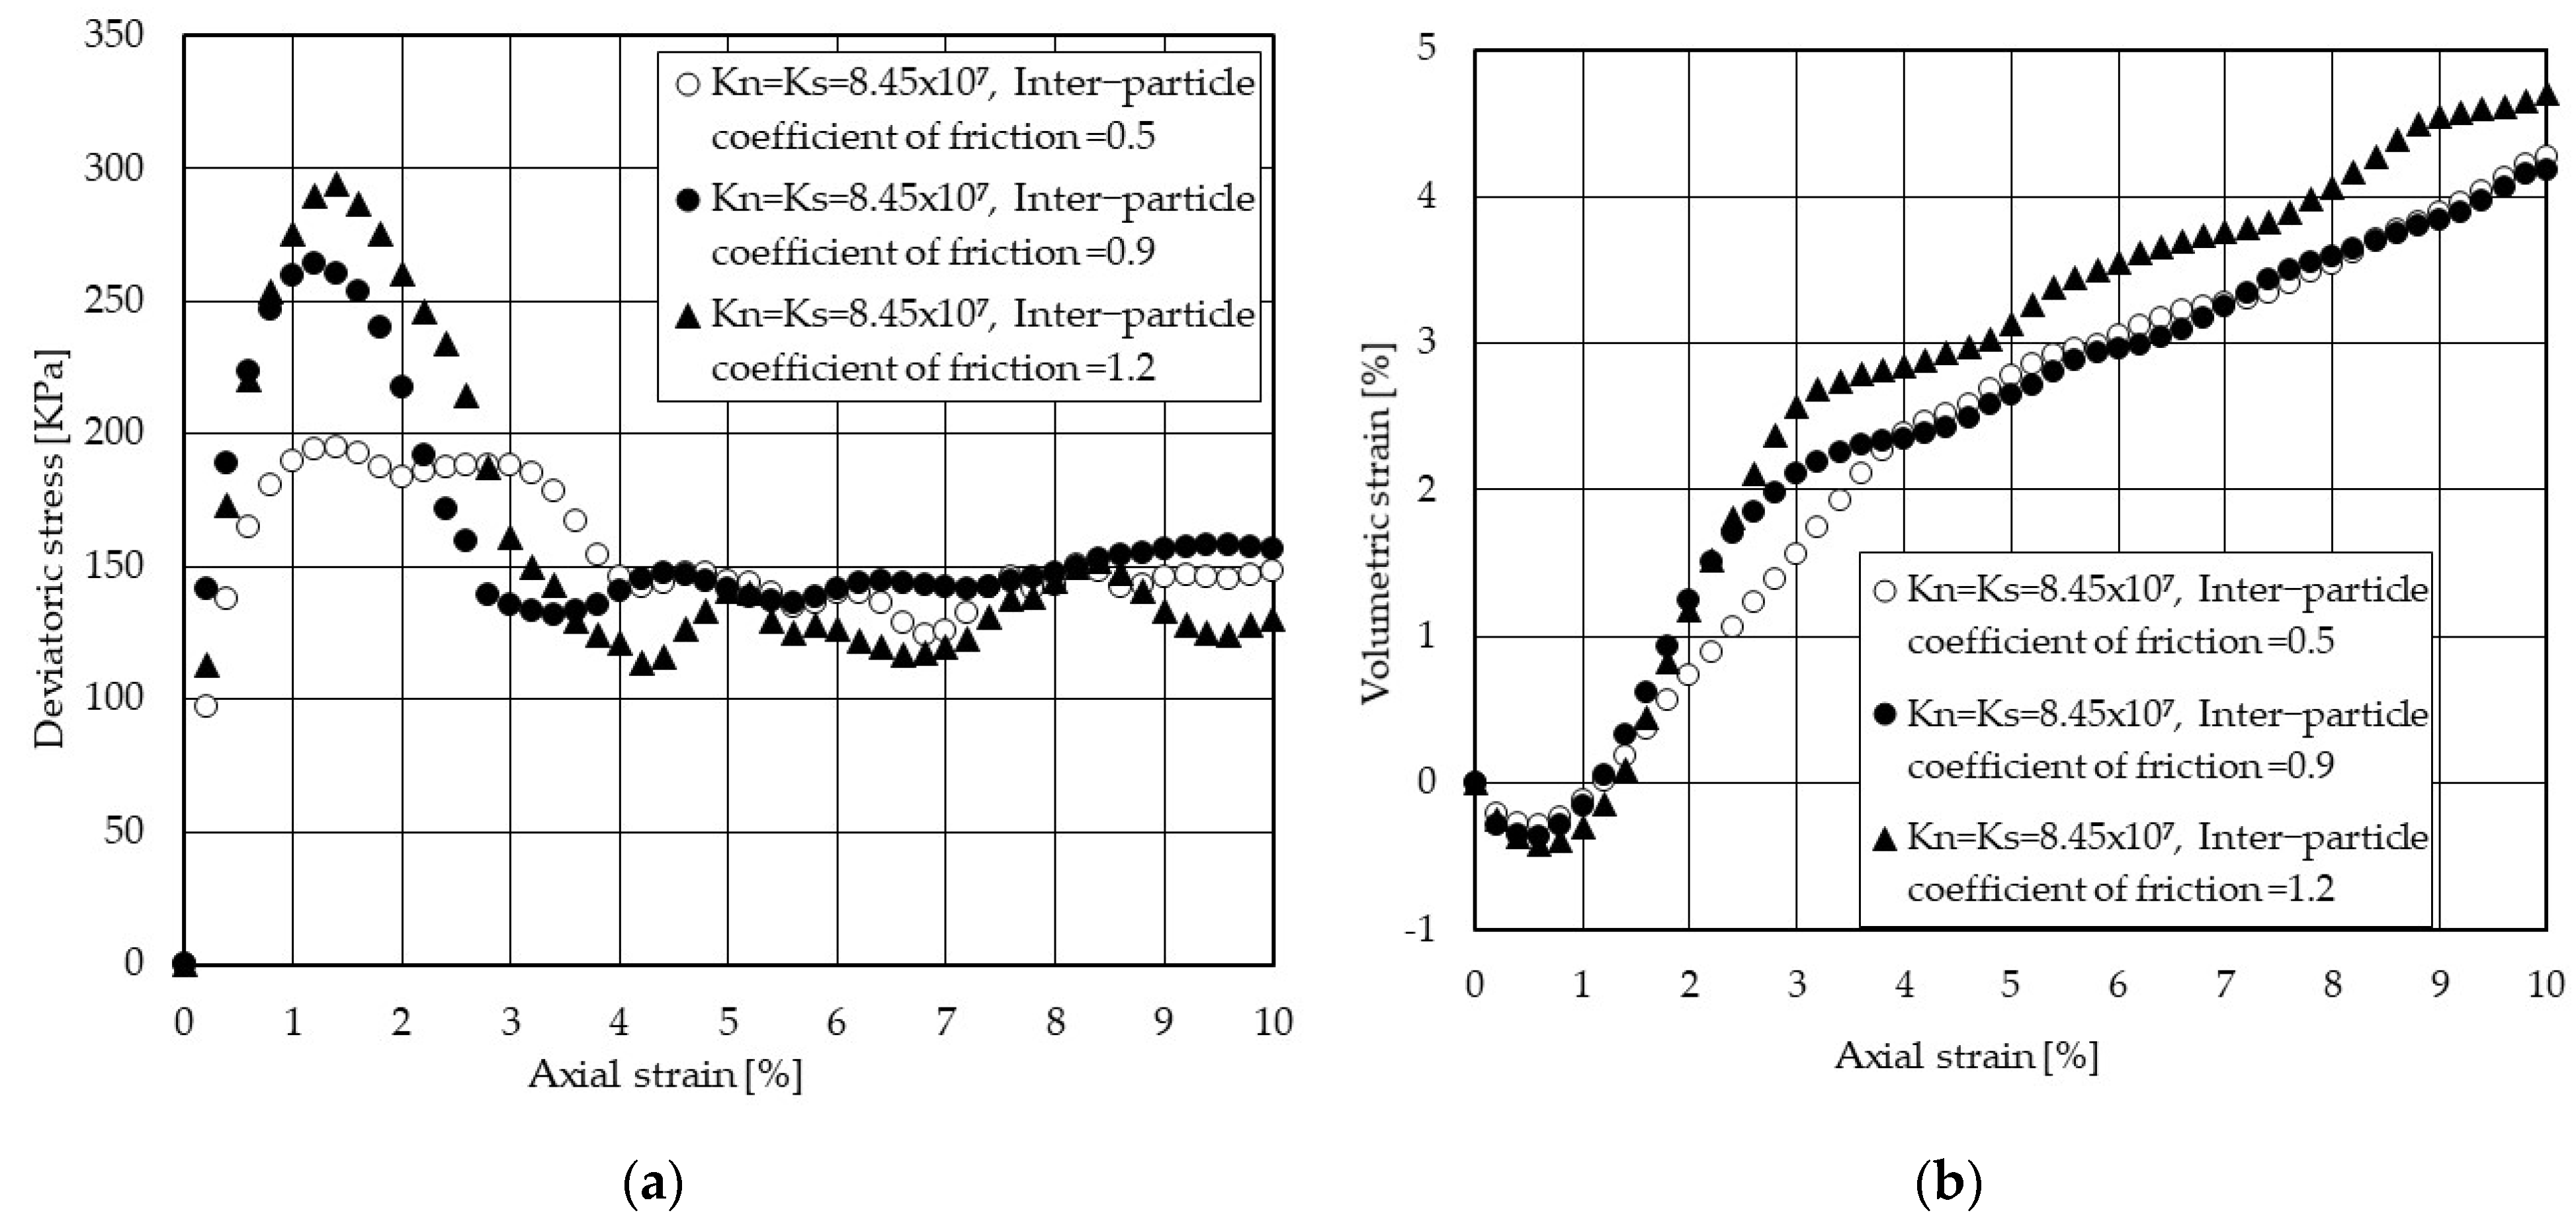
Figure 5a illustrates the variations of deviatoric stress with axial strain for different inter-particle coefficients of friction where normal and shear contact stiffness is 8.45 × 10
7 (N/m). As seen, for a fixed value of contact stiffness, the peak stress is profoundly controlled by inter-particle frictions, while the axial strain corresponding to the peak stress together with the slope of the stress–strain is less influenced by inter-particle frictions.
Figure 5b shows that the contraction behaviour of particulate sand is less impacted by inter-particle frictions, though the model with bigger inter-particle coefficient friction (i.e., 1.2) shows slightly more dilative behaviour.
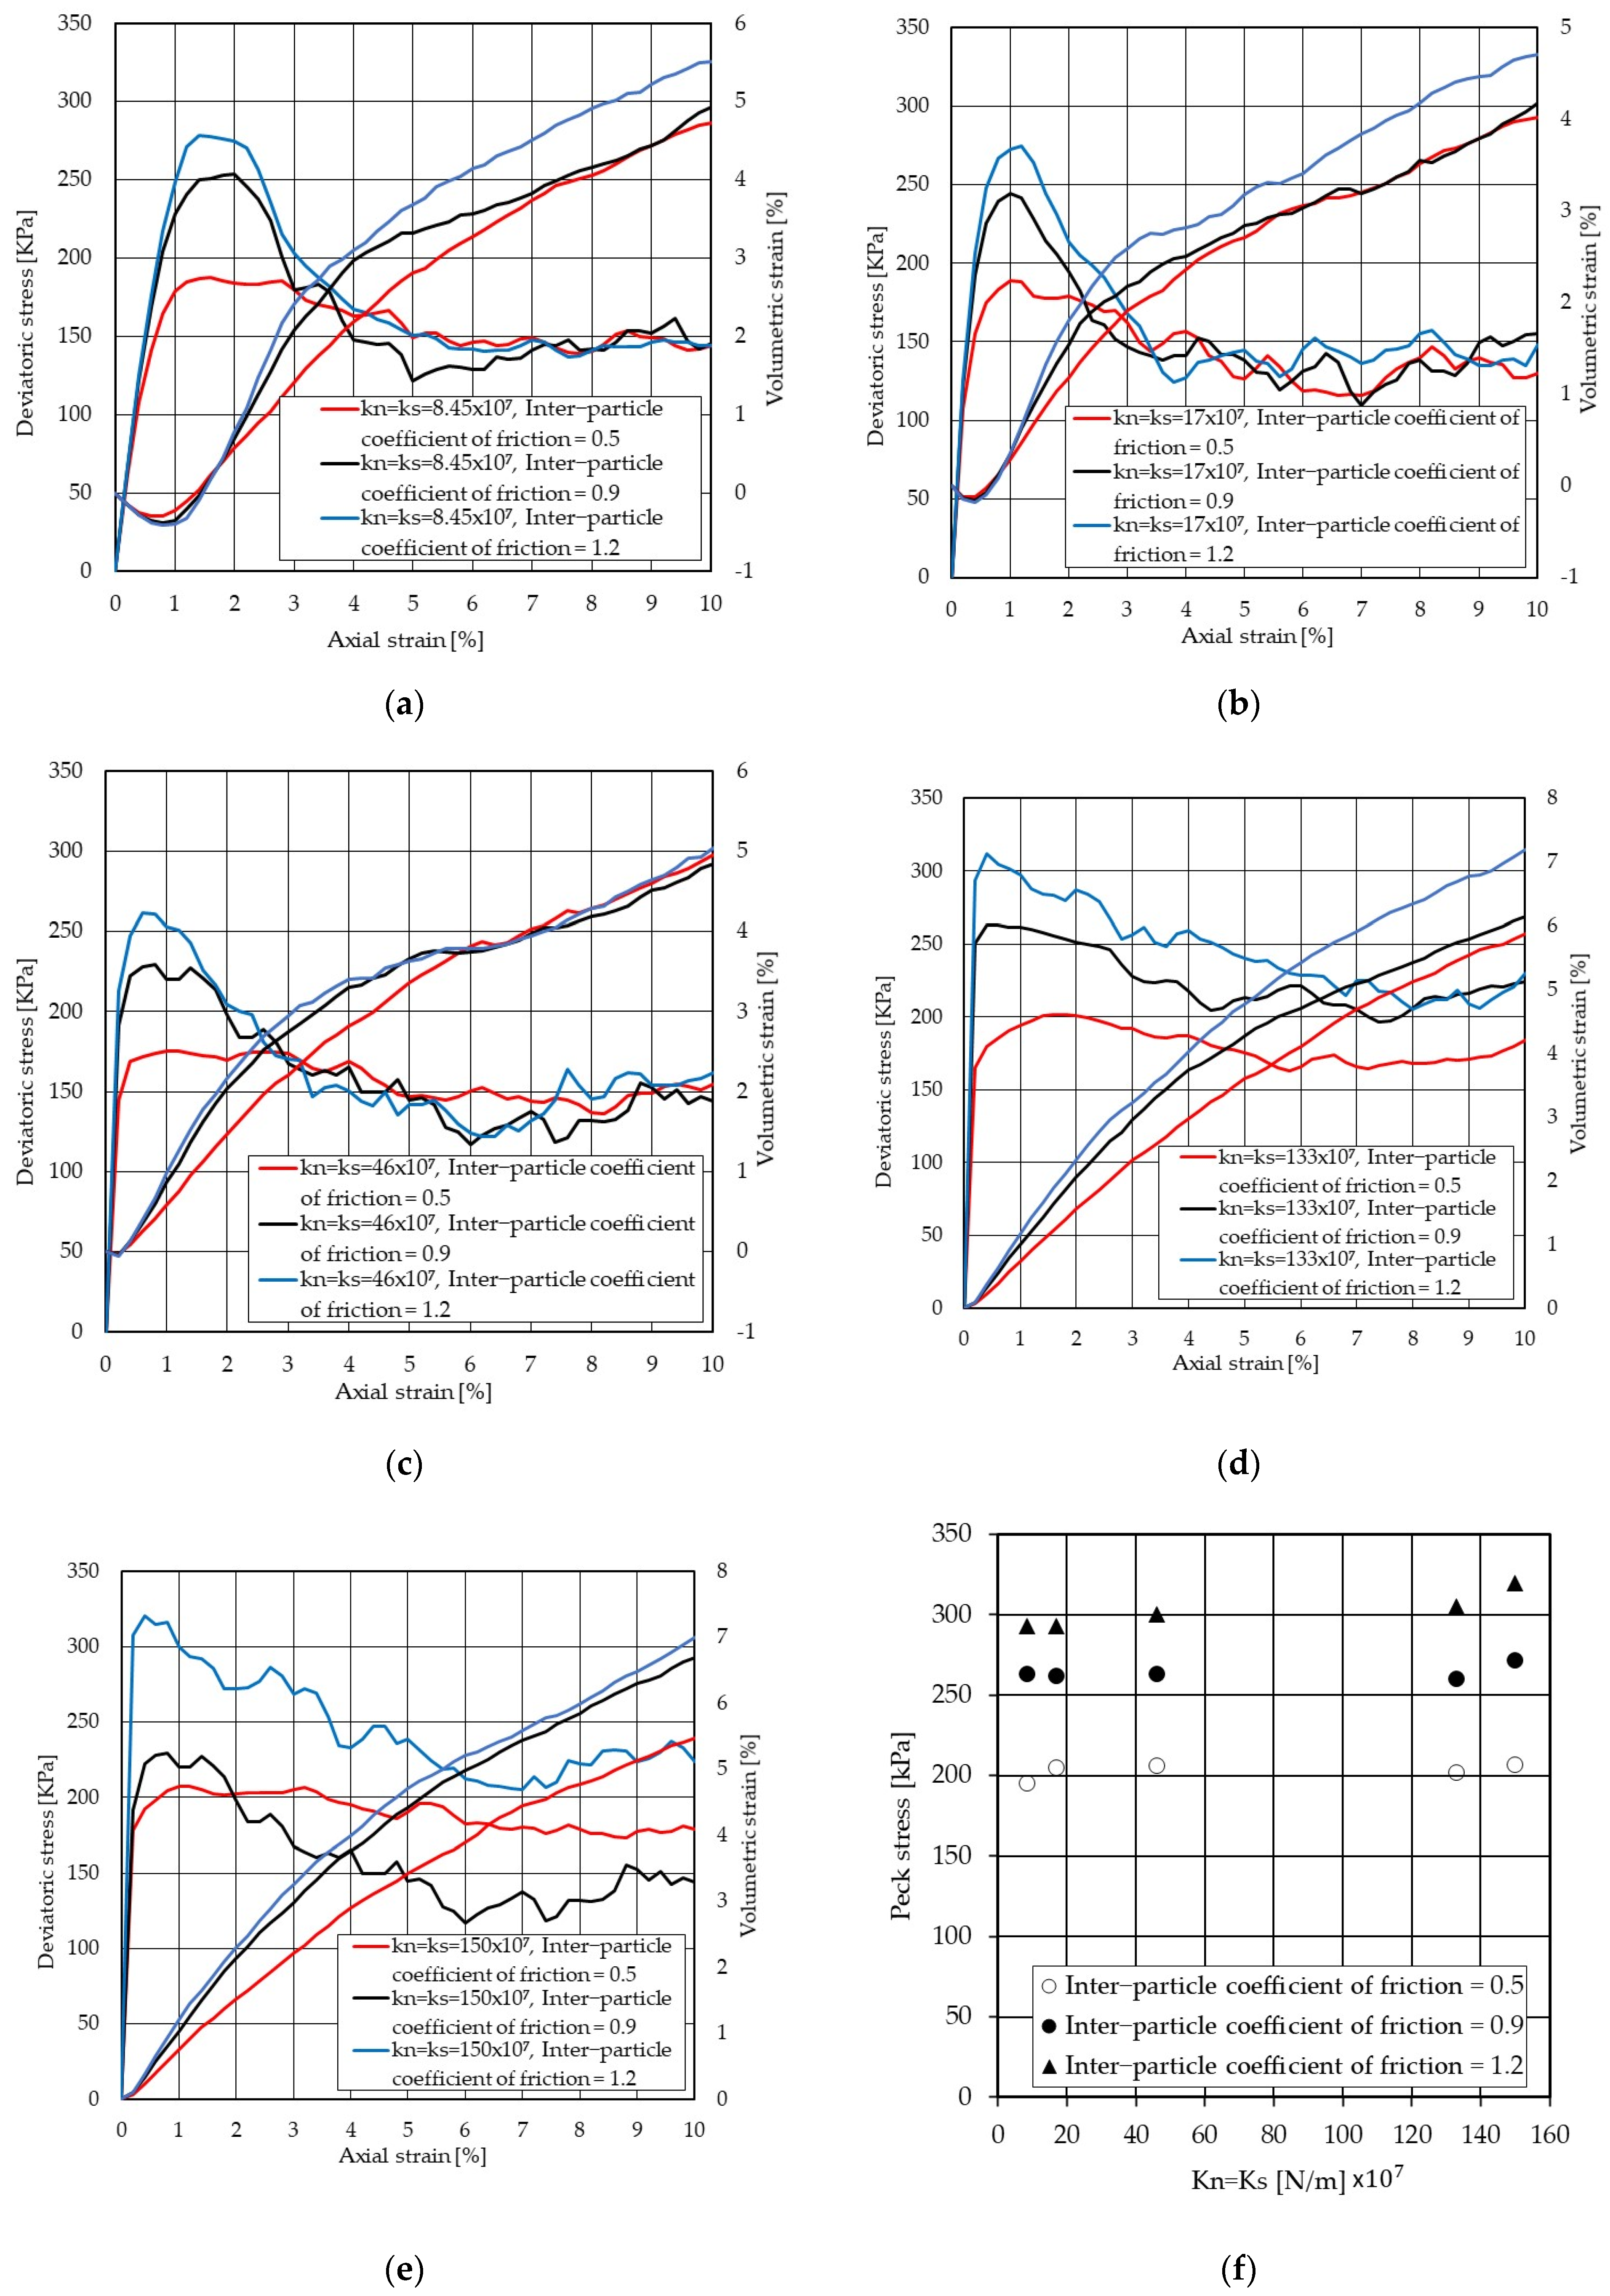
Figure 6a summarises the sensitivity of peak stress to the various inter-particle coefficient of friction for all these fifteen tests. As seen for each fixed value of contact stiffness, peak stress is significantly governed by inter-particle frictions. For example, for a fixed contact stiffness value of 8.45 × 10
7 (N/m), changing the inter-particle coefficient of friction from 0.5 to 0.9 and 1.2 results in an increase in peak stress by 37% and 53%, respectively, resulting in an increase in the angle of internal friction from 20° to 26° and 29°, for the inter-particle coefficient of friction of 0.5 to 0.9 and 1.2, respectively (see
Figure 6b). The angle of friction between 28° and 37° is typical for medium and dense sand. Based on the data provided for this study, a relationship between the inter-particle coefficient of friction and the angle of friction can be developed as follows:
where
and
are the angle of friction and inter-particle coefficient of friction. Note that this relationship is developed for inter-particle of coefficient between 0.5 and 1.2. It can be concluded that inter-particle friction mainly controls the peak stress and internal angle of friction.
Table 6 summarises E
50 with an inter-particle coefficient of friction for both plane stress and plane stress conditions, indicating that Young’s modulus is significantly governed by contact stiffness rather than the inter-particle coefficient of friction. For instance, changing the inter-particle coefficient of friction from 0.5 to 0.9 and 1.2 for a fixed contact stiffness value of 8.45 × 10
7 (N/m), the plane strain E
50 goes up by 8% and 0%, respectively. In the case of plane stress, E
50 goes up by 5% and 0%, where the inter-particle coefficient friction changed from 0.5 to 0.9 and 1.2. Young’s modulus 25 (MPa) to 80 (MPa) is typical for medium and dense sand. Therefore, the contact stiffness above 17 × 10
7 (N/m) produces unrealistic Young’s modulus values.
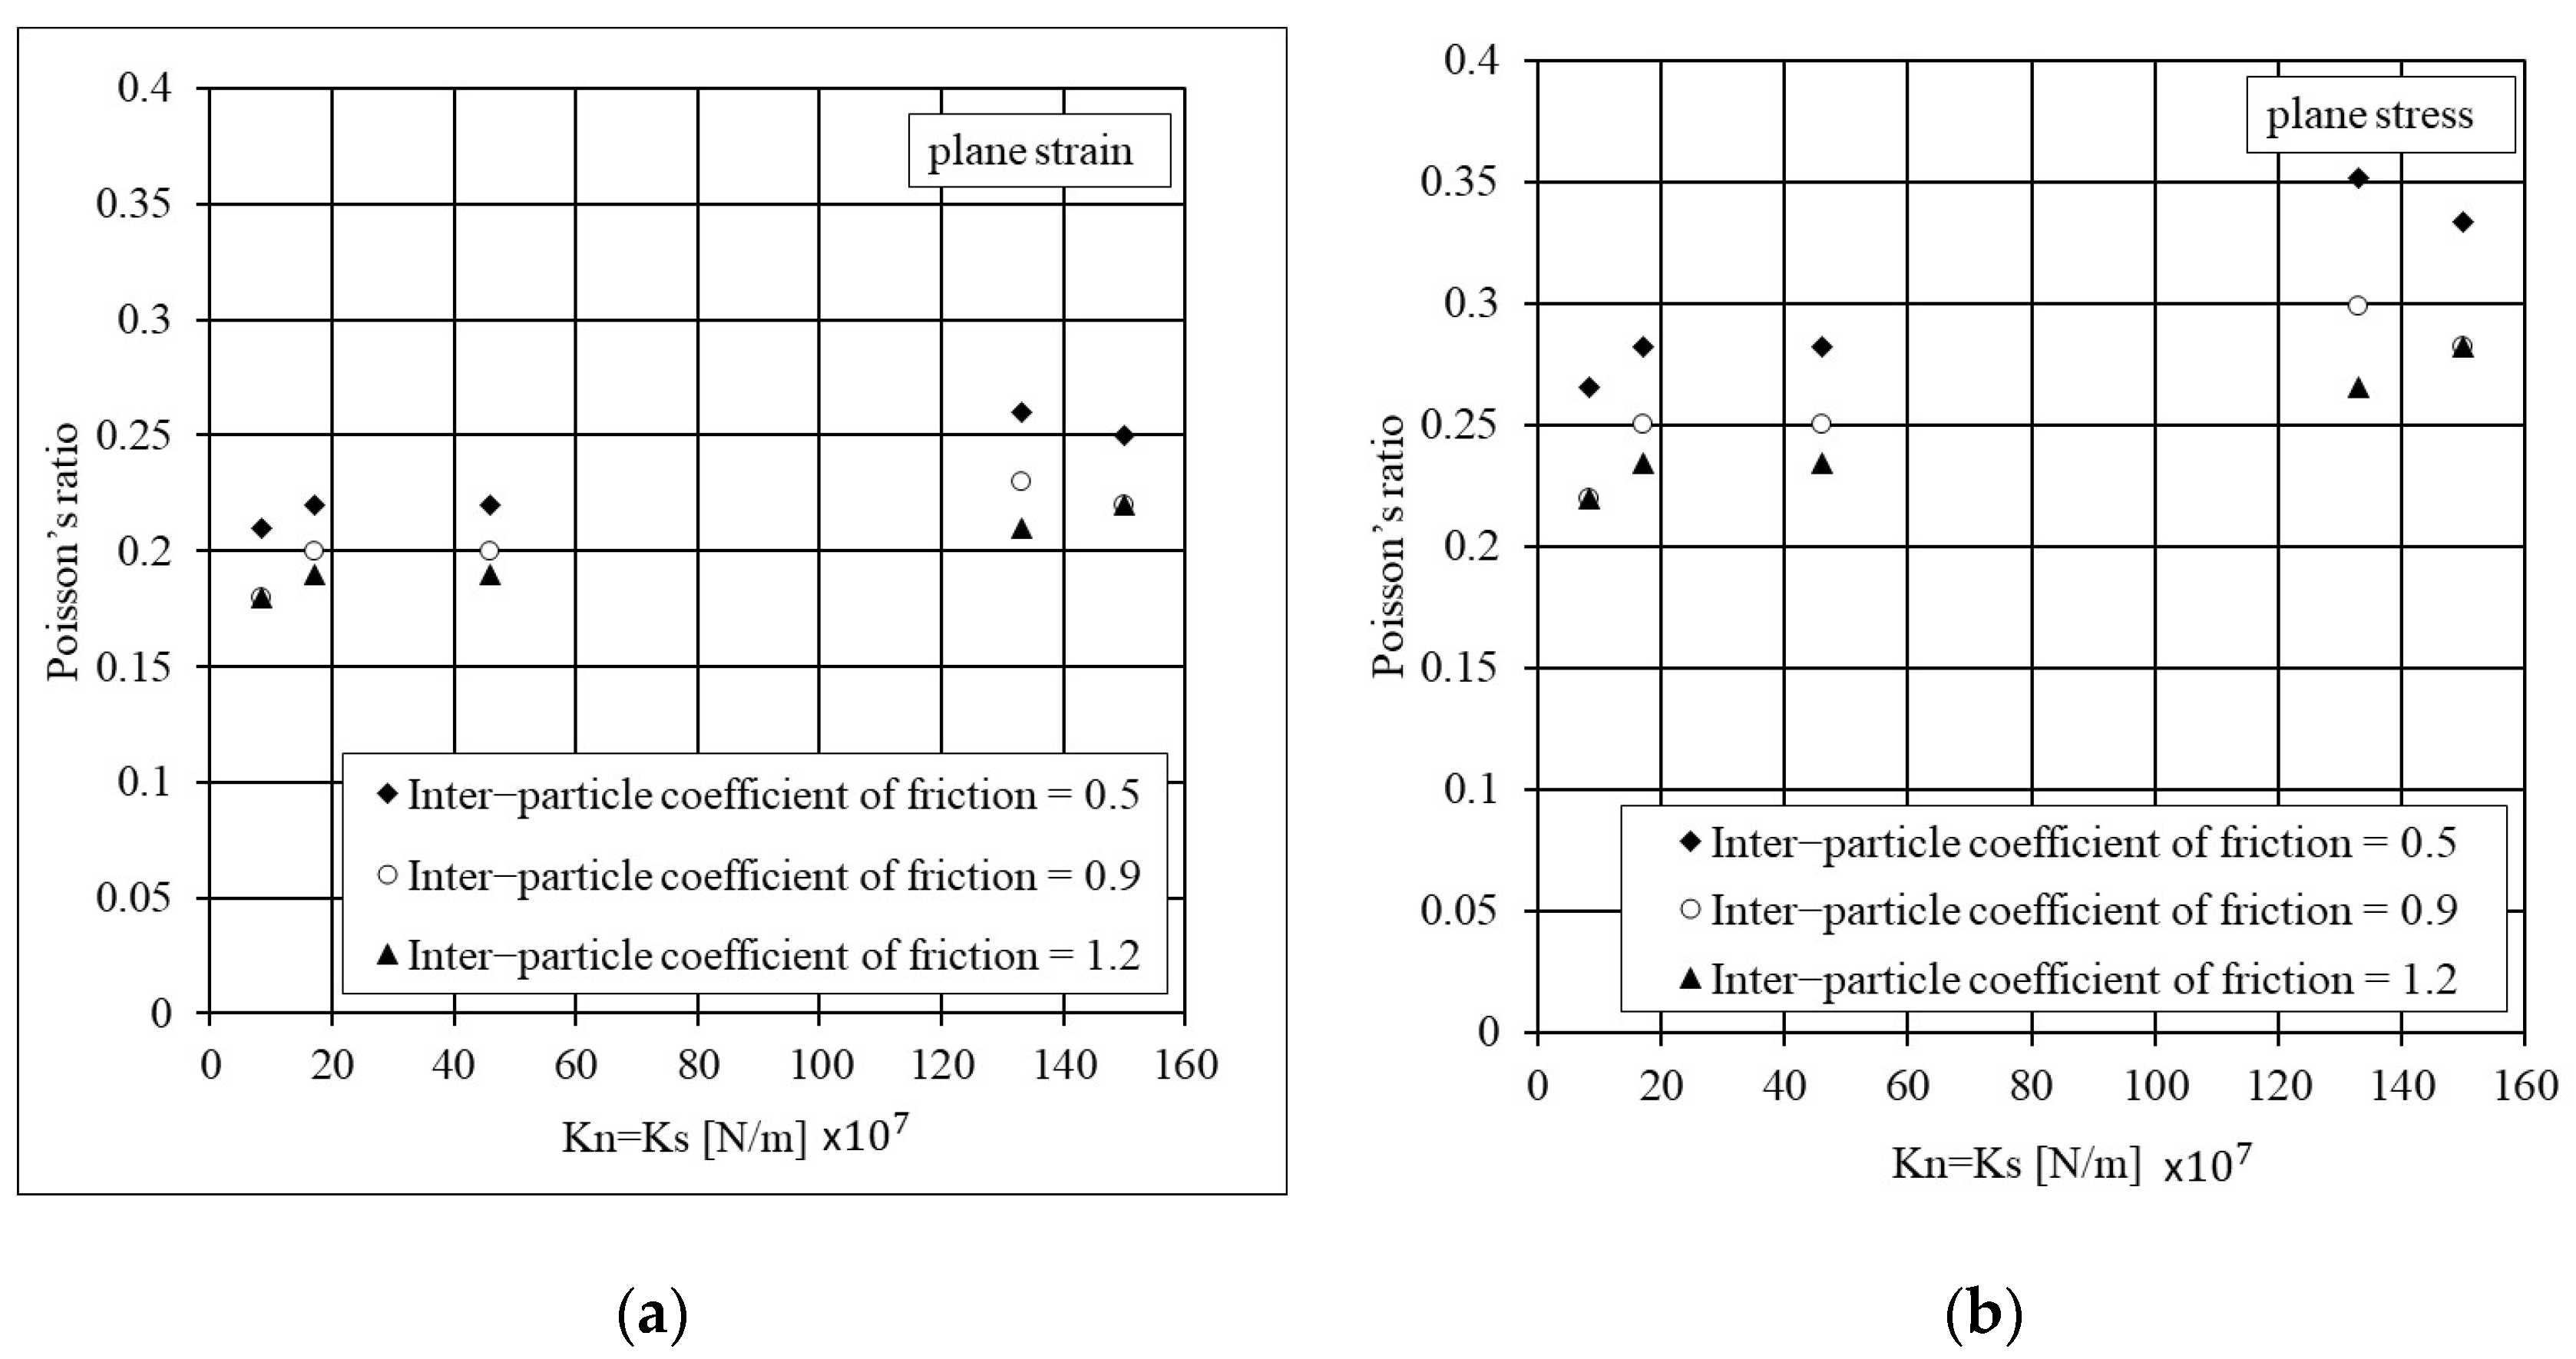
Table 7 shows that increasing the inter-particle coefficient of friction leads to an increase in Poisson’s ratio for both plane strain and plane stress conditions. However, the calculated Poisson’s ratio for plane stress is slightly greater than that calculated for plane strain. For instance, for inter-particle coefficient friction of 1.2 where the contact stiffness is 150 × 10
7 (N/m), the calculated Poisson’s ratio for plane strain and plane stress is 0.27 and 0.37, respectively. An increase in inter-particle coefficient friction leads to growth in both inter-particle sliding capacity and inter-particle forces, meaning the contact deformations and particle displacements rise. This leads to a rise in the lateral deformation of the system. The Poisson’s ratio between 0.2 and 0.3 is a typical value for medium and dense sand.
The trend of stress–strain behaviour presented in
Figure 5a is in good agreement with average anisotropy with axial strain shown in
Figure 7a.
Figure 7a shows the average fabric anisotropy with axial strain to the various inter-particle coefficient of friction when a fixed value of contact stiffness is applied. The average fabric anisotropy increases until a maximum at the peak stress and then reduces with further strain for all inter-particle coefficients of friction. This clearly shows that the inter-particle coefficients of friction have a significant effect on the results. The maximum average fabric anisotropy, which is approximately 0.37, shows how much the contact arrangement drifts from the isotropic state (i.e.,
= 0). This term shows how much the system being loaded can develop anisotropy in contact networks. It is also a variance term that statistically shows how well the contact networks are changing during loading. The more average fabric anisotropy there is, the more shear strength capacity can be attained [
6,
8].
Figure 7b shows that an increase in the inter-particle coefficient of friction has little effect on the average coordination number to peak deviatoric stress up to the axial strain of 1.5%, which is representative of the peak deviatoric stress (refer to
Figure 5a). The coordination number is then slightly increased though the value depends on the inter-particle coefficient of friction.
4.4.2. The Sensitivity of Sand System to Normal Contact Stiffness
A series of 15 biaxial tests were performed to determine the effect of the normal contact stiffness on the micro–macro properties of the particulate sand samples. The input data for these 15 tests are listed in
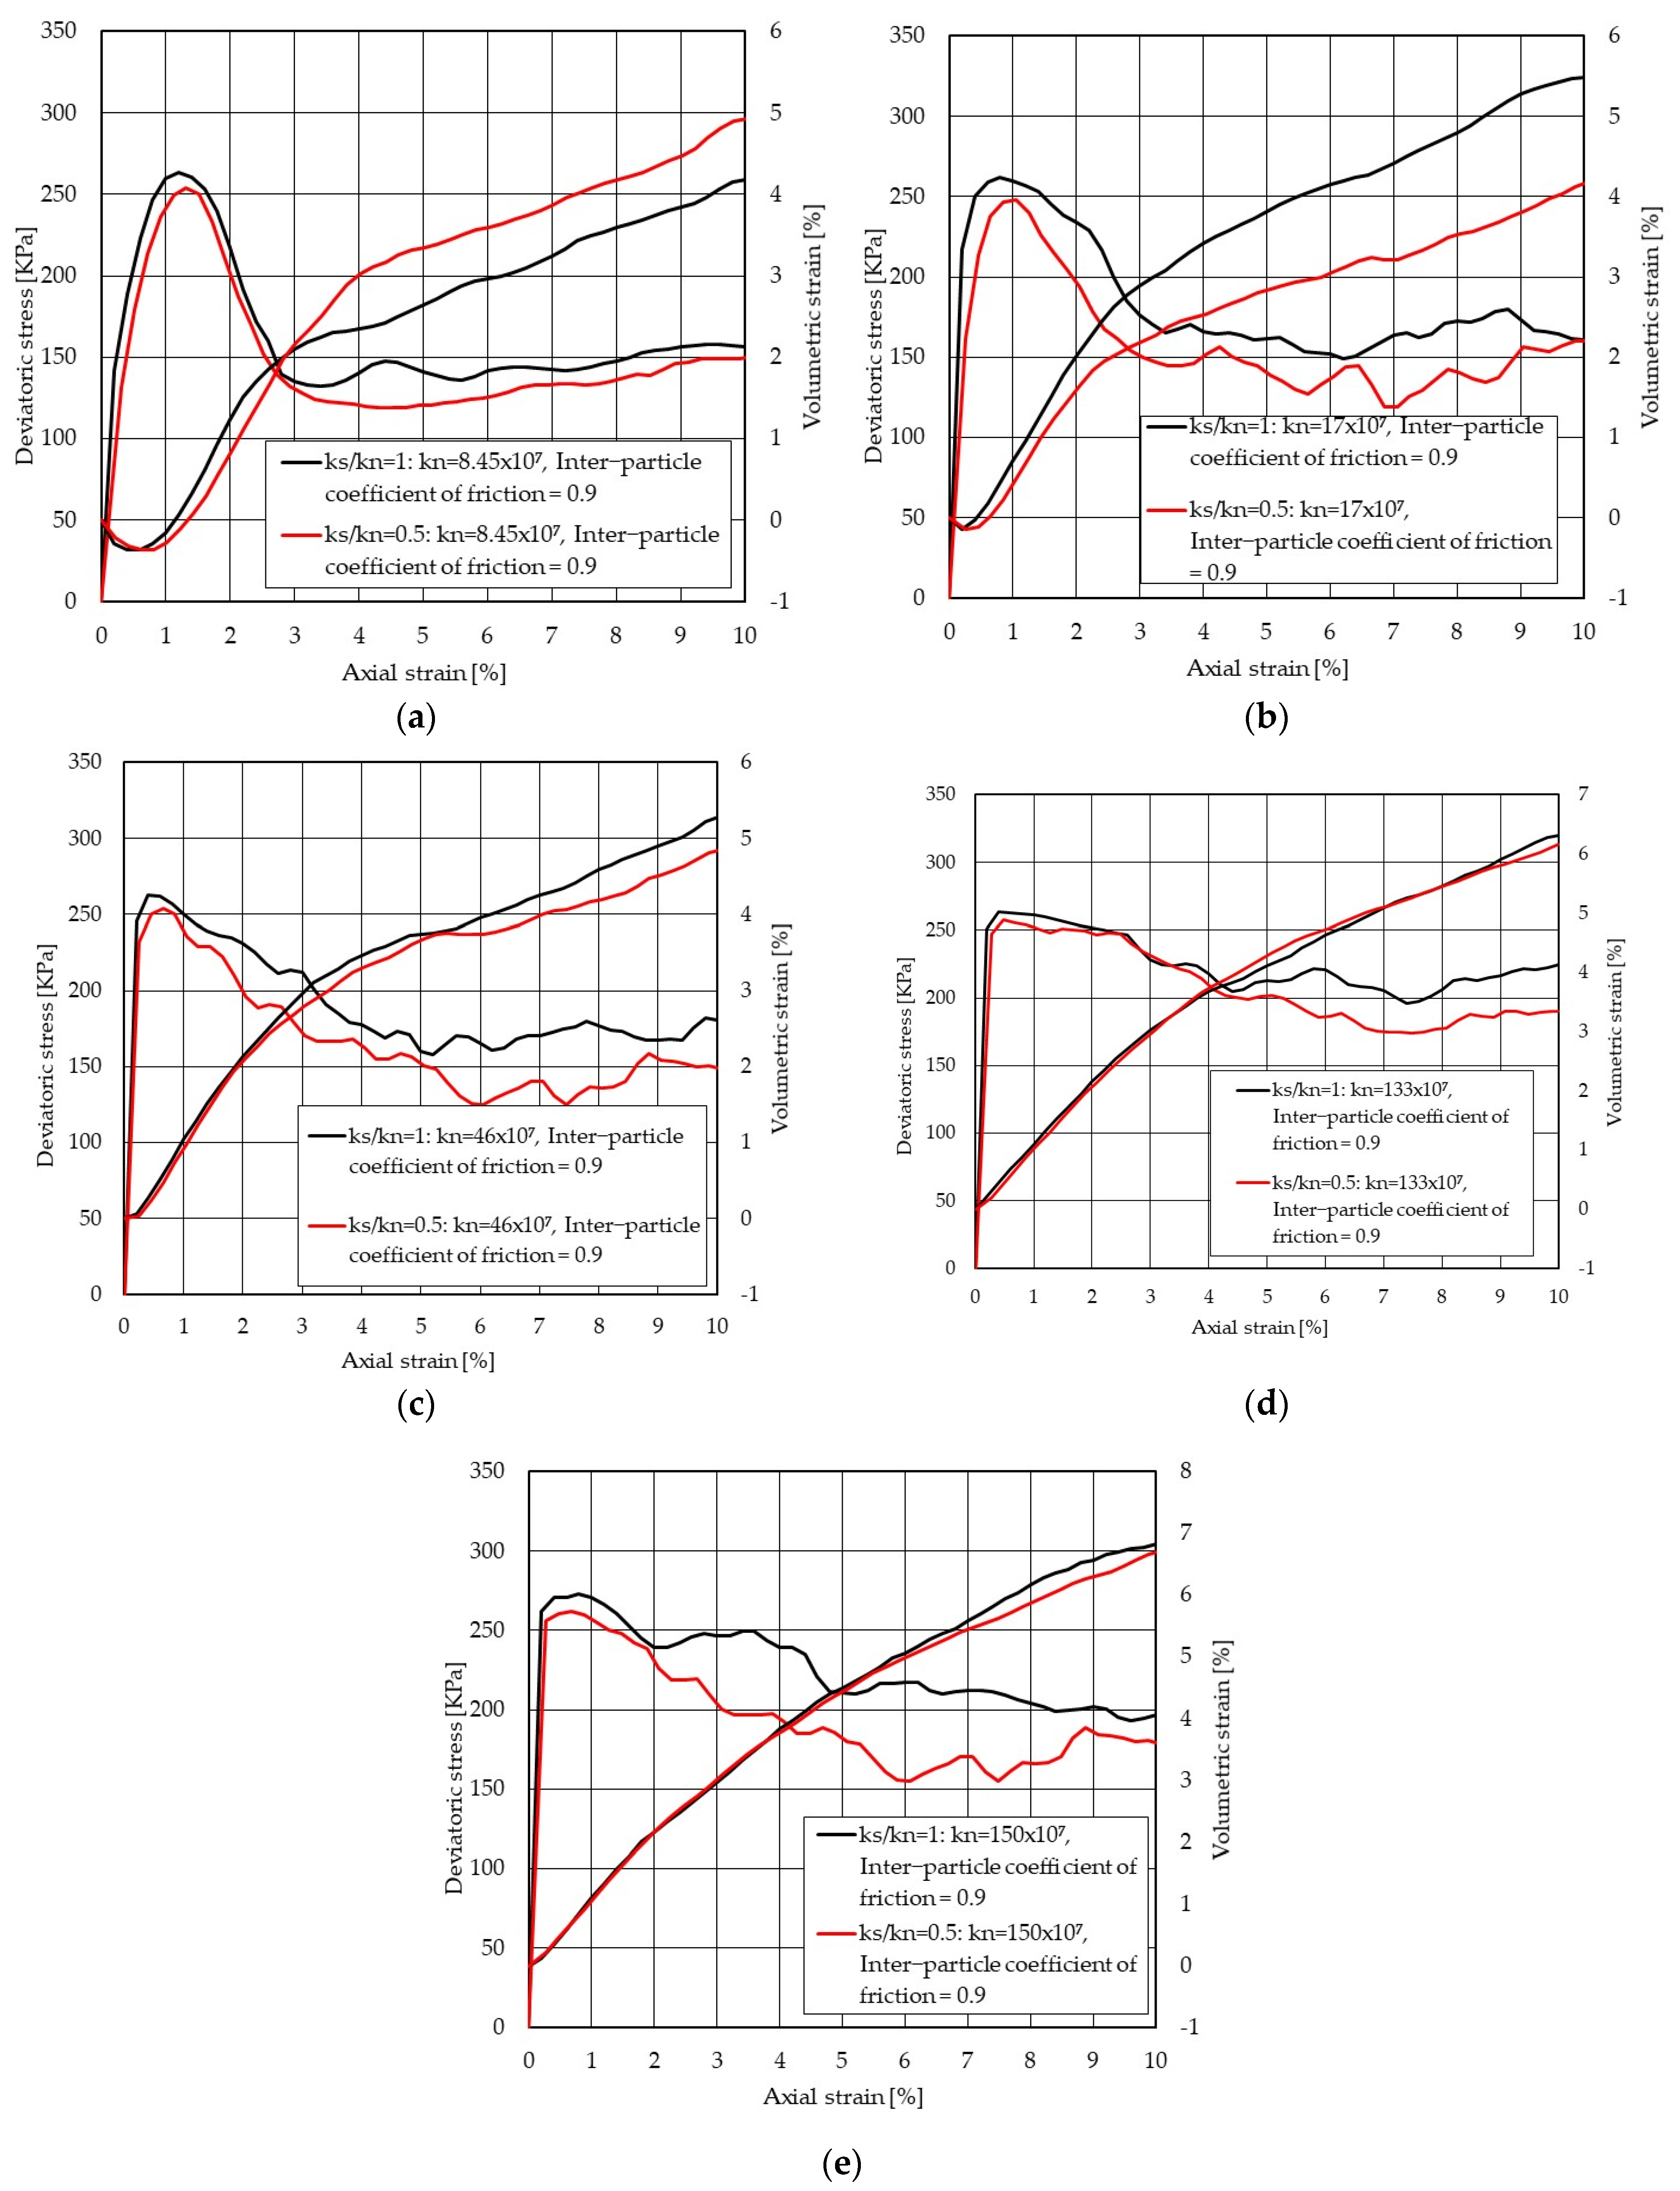
Table 5. The ratio between normal contact stiffness and shear contact stiffness is assumed to be unity, while the inter-particle coefficient of friction varies between 0.5, 0.9, and 1.2. The sensitivity of combined deviatoric stress and volumetric strain with axial strain for a wide range of contact stiffness values is presented in
Figure 8. It can be seen that the axial strain corresponding to the peak stress notably becomes smaller by increasing the contact stiffness, showing the particulate sand system behaves denser. However, the particulate systems with the lower contact stiffness demonstrate more softening strain behaviour at post-peak, while the particulate systems with higher contact stiffness show more hardening strain behaviour up the peak stress. Additionally, the peak stress for higher values of contact stiffness becomes sharper.
Figure 8 also summarises the sensitivity of peak stress to the various normal contact stiffnesses and inter-particle coefficients of friction. Increasing the contact stiffness has less impact on the peak deviatoric stress. For instance, an increase in the normal contact stiffness from 8.45 × 10
7 (N/m) to 150 × 10
7 (N/m), where a fixed value of the inter-particle coefficient of friction 0.9 is applied, results in a slight increase to the peak stress by about 2%.
Figure 8 shows that the particulate sand system with the lower value of contact stiffness (e.g., 8.45 × 10
7 (N/m) and 17 × 10
7 (N/m)) demonstrates more contraction behaviour due to the shearing followed by dilation behaviour, which is similar to the normal volumetric bulk behaviour of medium and dense sand. In contrast, the model with a higher value of contact stiffness (e.g., 47 × 10
7 to 150 × 10
7 (N/m)) demonstrates notable dilation behaviour with small initial contraction.
As highlighted in
Figure 8, an increase in contact stiffness results in the slope of deviatoric stress with axial strain becoming steeper, meaning the bulk stiffness of particulate sand rises. It is because the increase in contact stiffness value and inter-particle friction leads to an increase in the sliding capacity of the contacts. That is, the risk of losing the contacts per particle reduces, and the number of contacts contributing to taking the load is high.
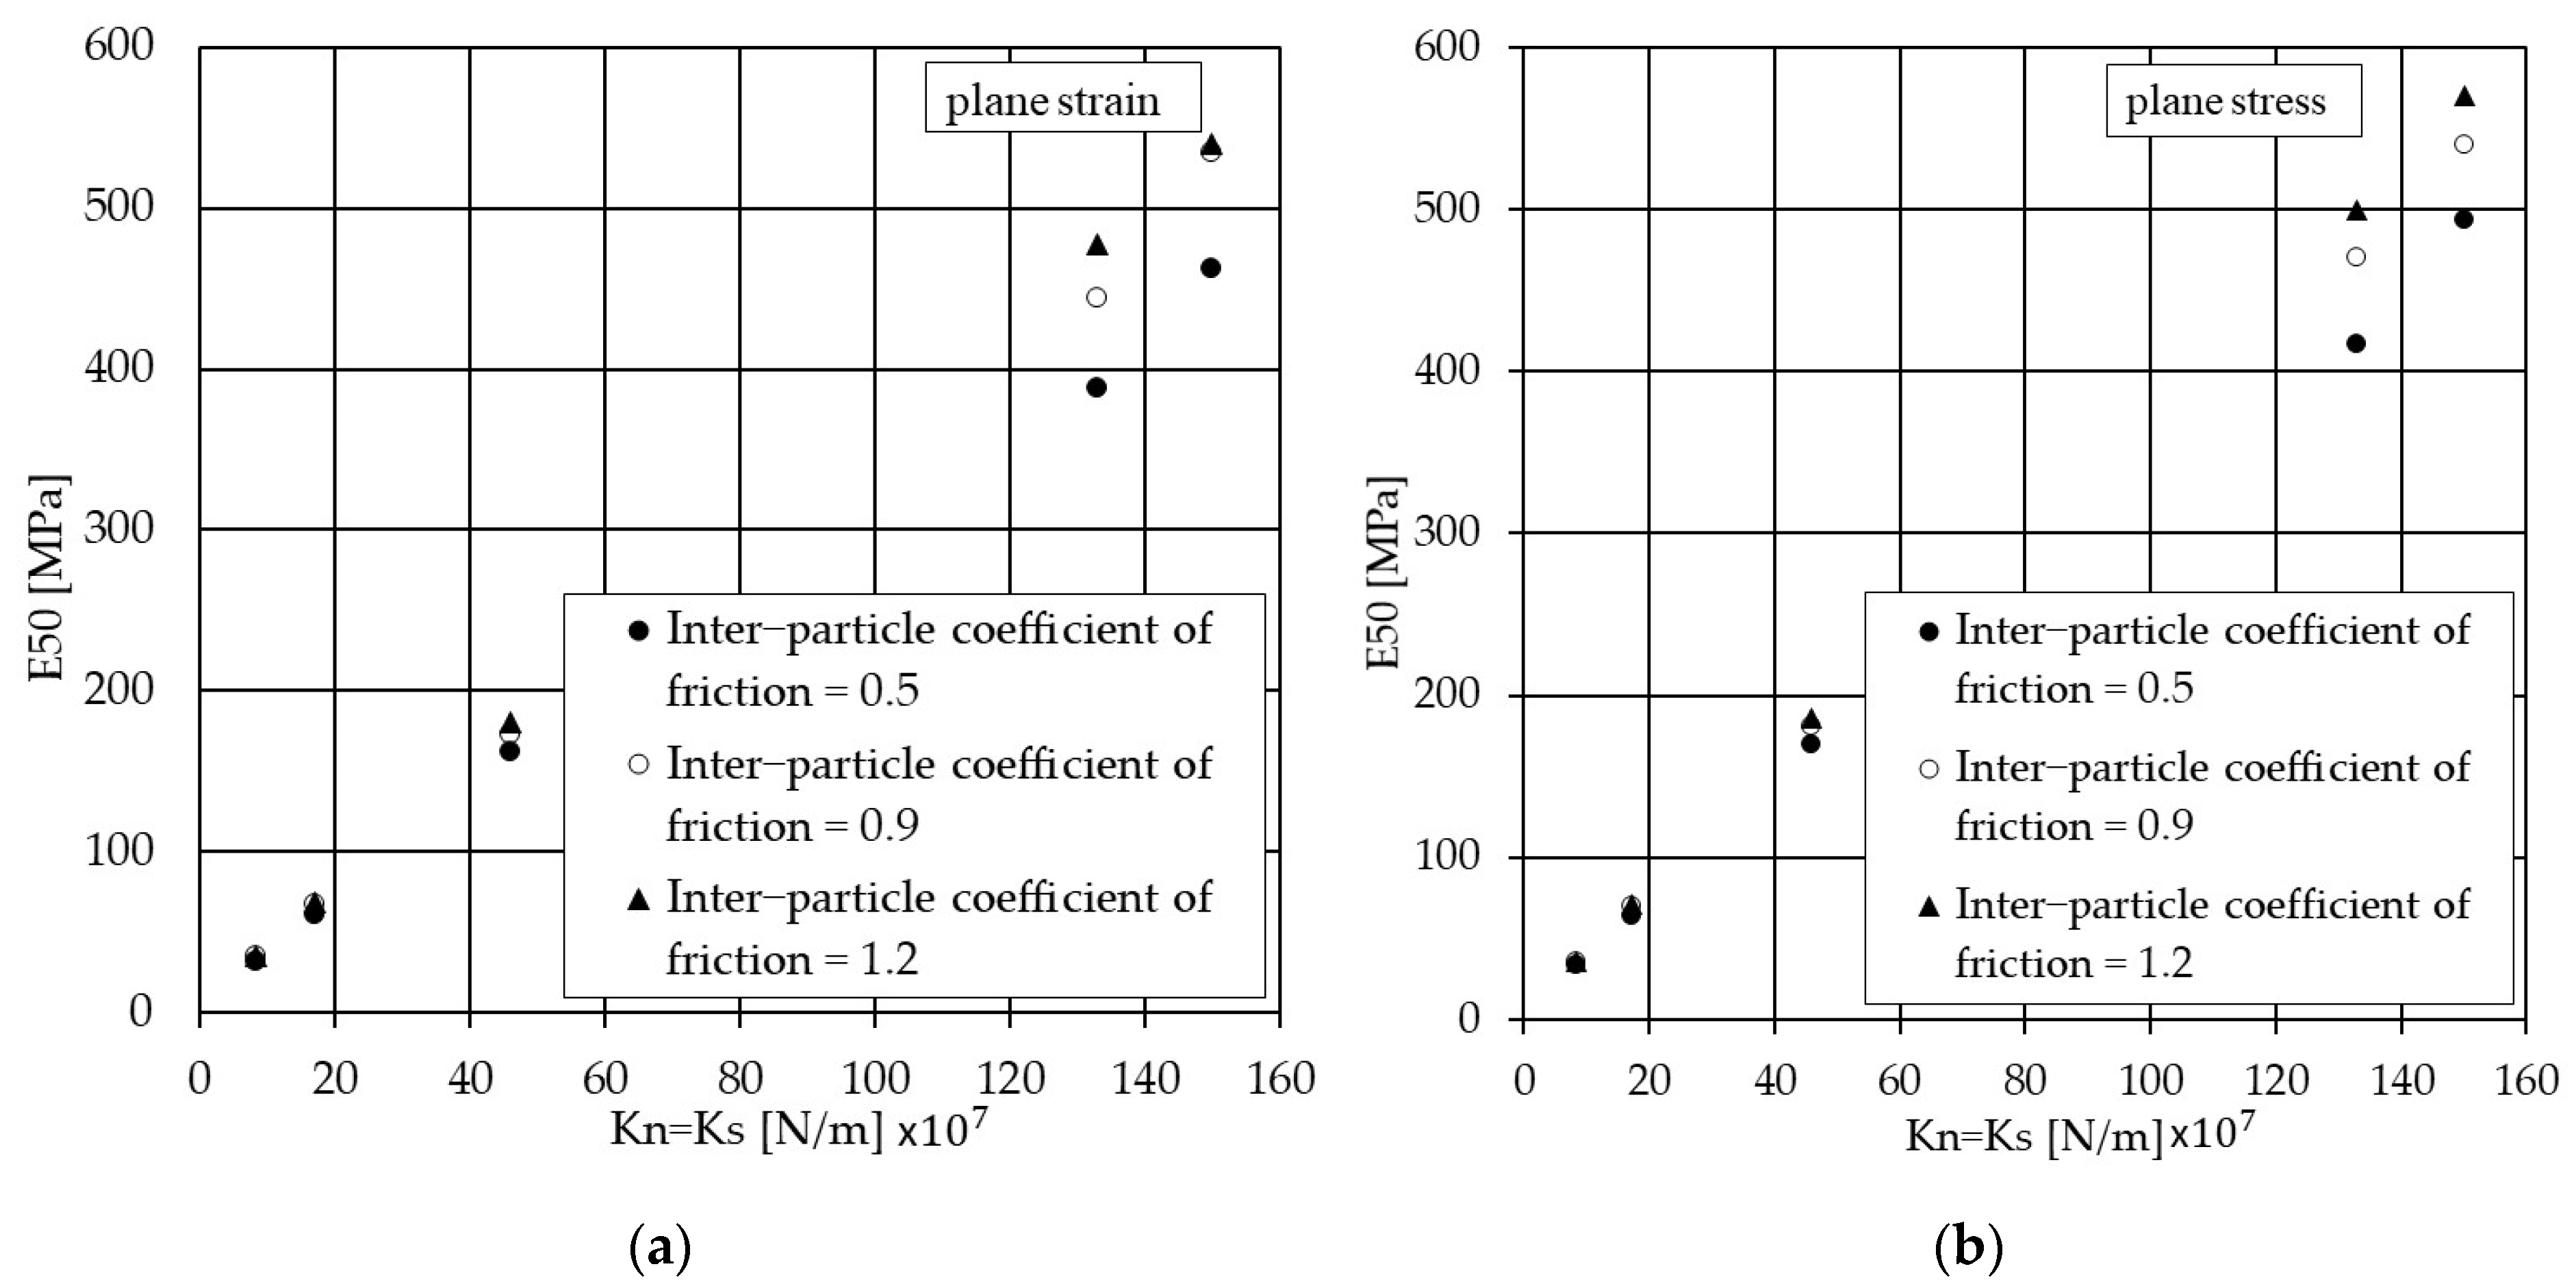
Figure 9 and
Table 6 show the plane stress and plane strain secant elastic modulus of the particulate sand systems for a wide range of contact stiffness and inter-particle coefficient of friction. A linear relationship can be established for each inter-particle coefficient of friction. In the case of plane strain,
In the case of plane stress, another set of linear relationships can be established for each inter-particle coefficient of friction:
The values of normal contact stiffness between 8.45 × 10⁷ (N/m) and 17 × 107 (N/m) lead to values of E50, which fall within the range typical for medium and dense sand, i.e., between 25 (MPa) and 50 (MPa) and 50 (MPa) and 80 (MPa), respectively.
Figure 10 and
Table 7 show that an increase in the normal contact stiffness leads to an increase in Poisson’s ratio with a ranged value between 0.2 and 0.4. The contact stiffness of particles between 8.45 × 10
7 (N/m) and 17 × 10
7 (N/m) produces typically ranged values of Poisson’s ratio for medium sand if the inter-particle coefficient of friction is between 0.9 and 0.5. For the higher value of the inter-particle coefficient of friction (i.e., 1.2), the interpreted value of Poisson’s ratio is less than typical values. A linear relationship can also be established between Poisson’s ratio and the inter-particle coefficient of friction (in the case of plane strain):
A linear relationship can also be established between Poisson’s ratio and the inter-particle coefficient of friction (in the case of plane stress):
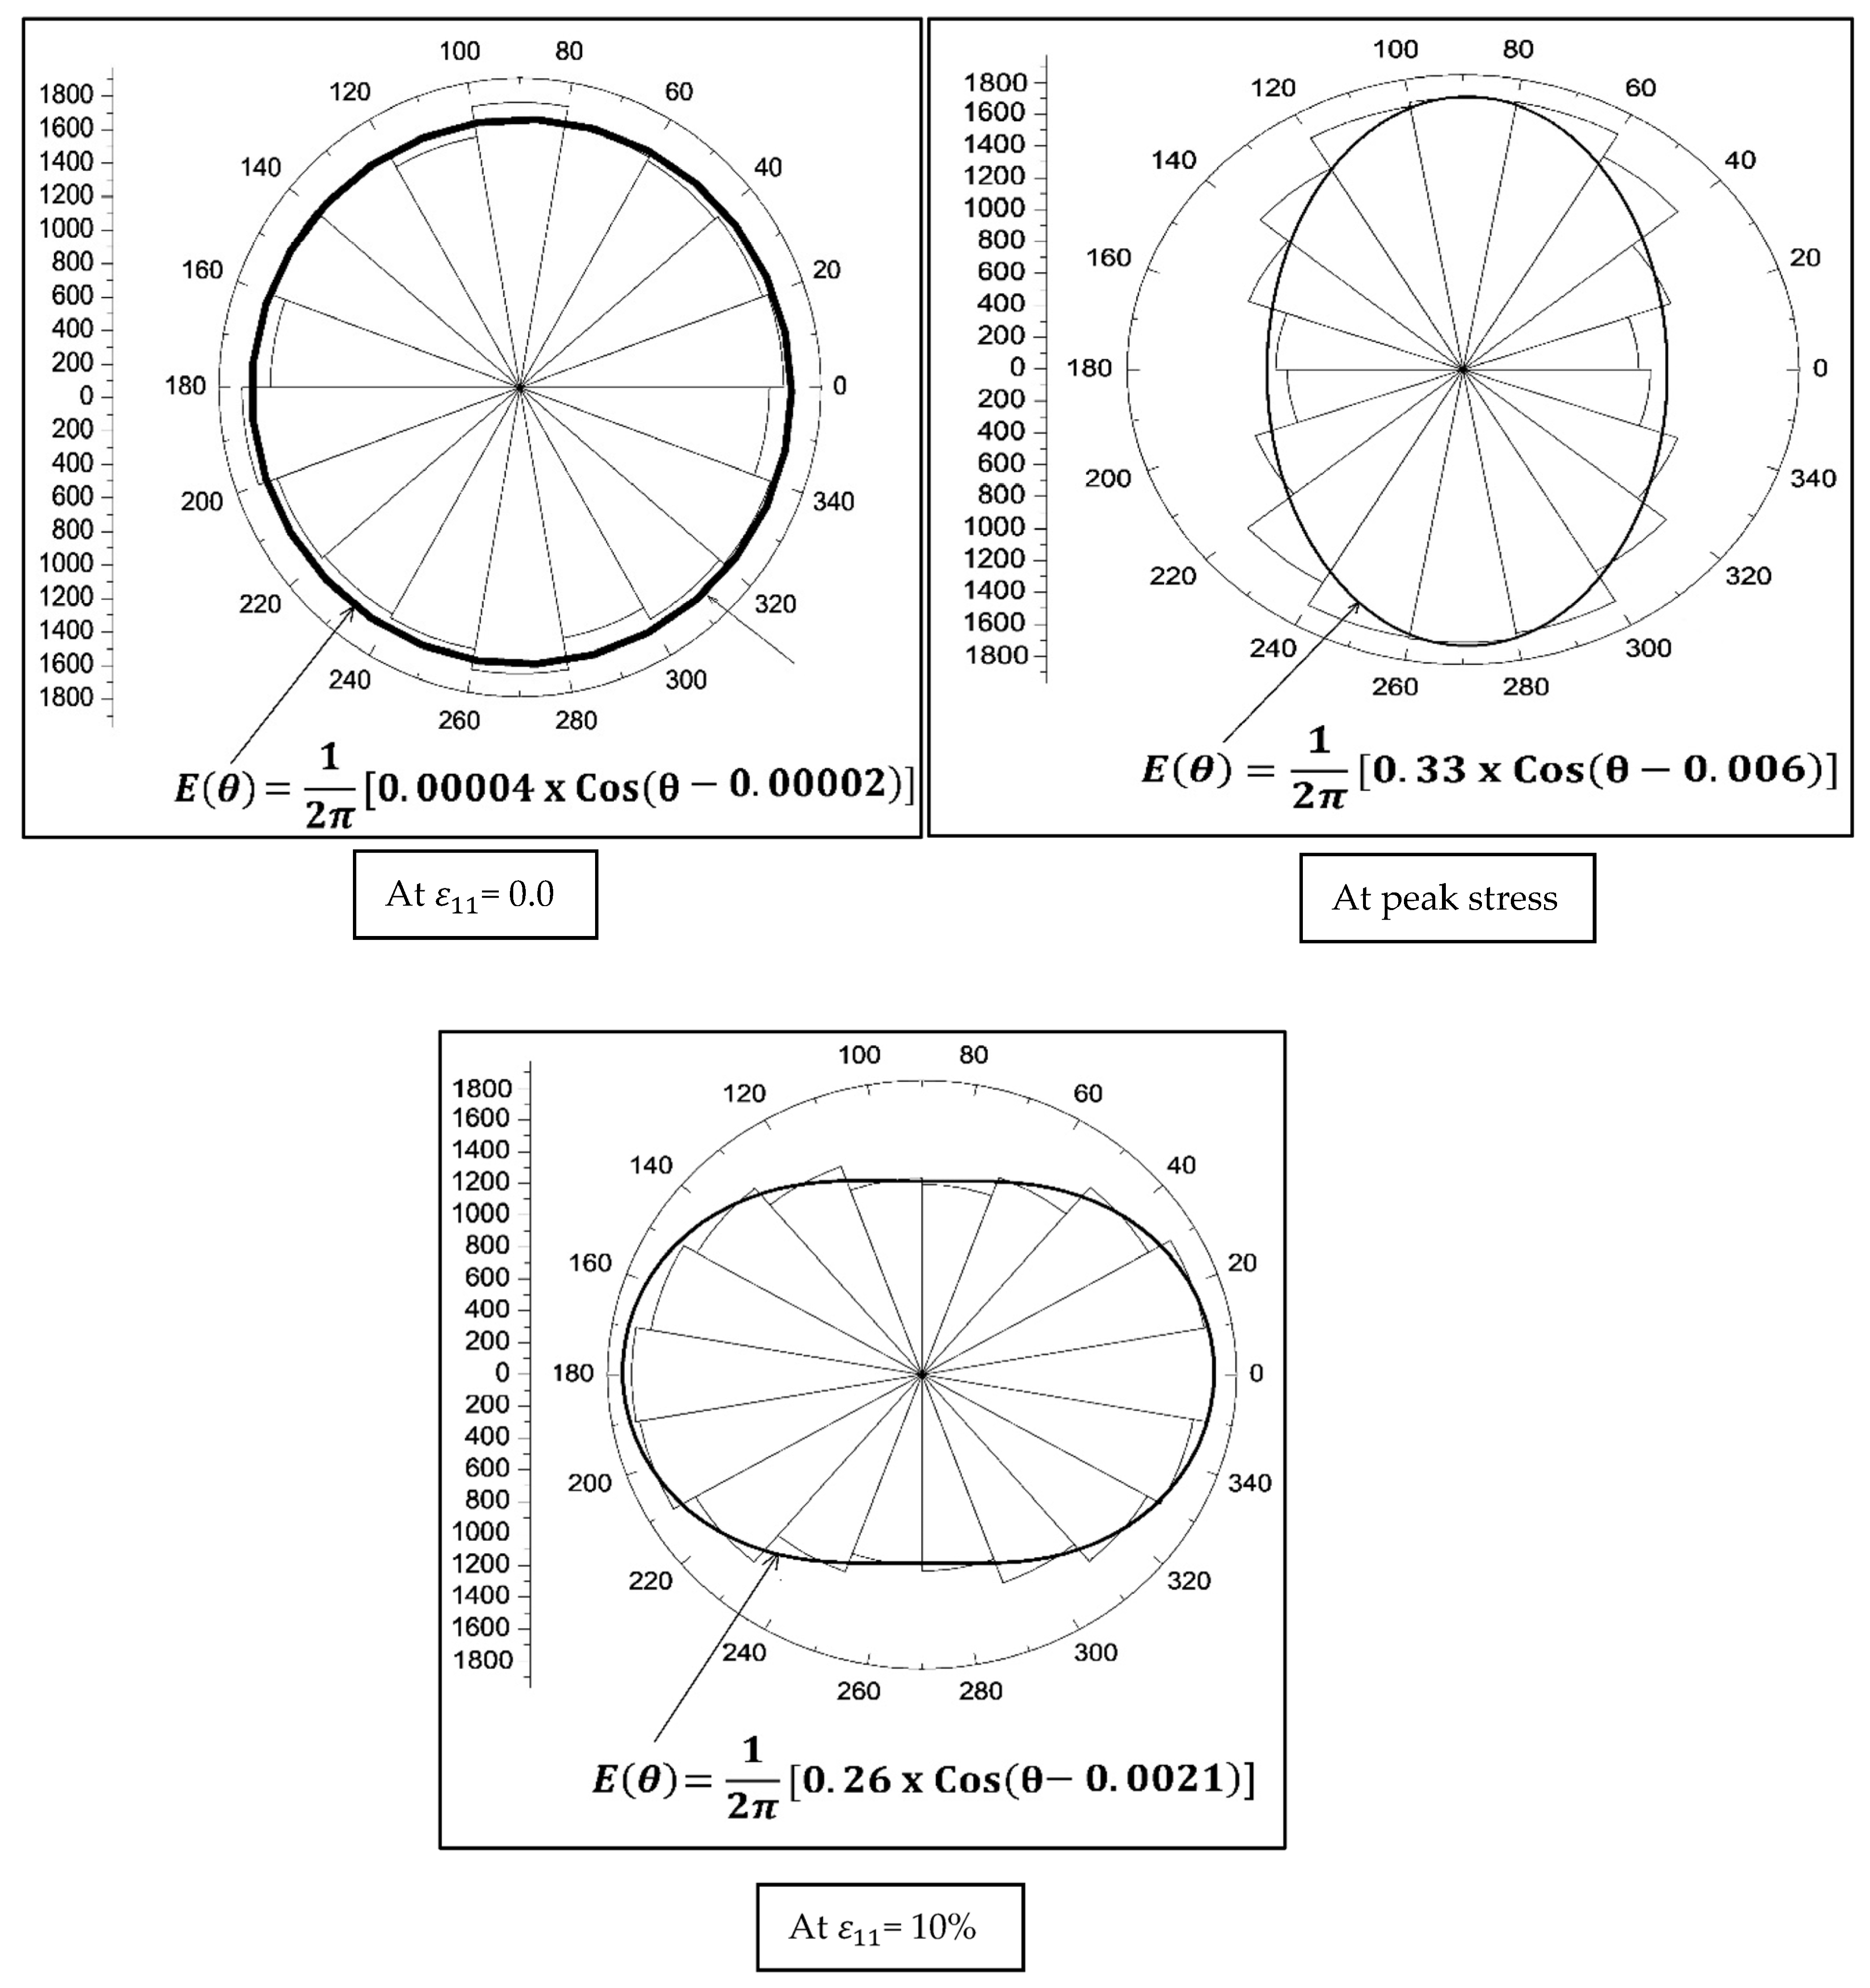
Figure 11 demonstrates the evolution of contact distribution during the shearing of particulate and where a fixed value is applied to the inter-particle properties. At this isotropic state, the average fabric anisotropy is 0.0007, and a circle presents the polar diagram distribution of contacts. At this stage, the number of contacts is distributed almost equally within each segment. If the polar diagram is entirely circled, it shows that the distribution of contacts is in an isotropic state. At the peak bulk deviatoric stress, the orientation of the contacts will be toward the direction of major stress, indicating the contacts within the particulate sand are fully mobilised to take the load. The average fabric anisotropy rises to 0.35. At the post-peak state where
= 10%, the orientation of contact points will be mainly toward the confining stress, and average fabric anisotropy will be reduced to 0.27, showing the particulate system has collapsed.
An increase in contact stiffness from 8.45 × 10
7 (N/m) to 150 × 10
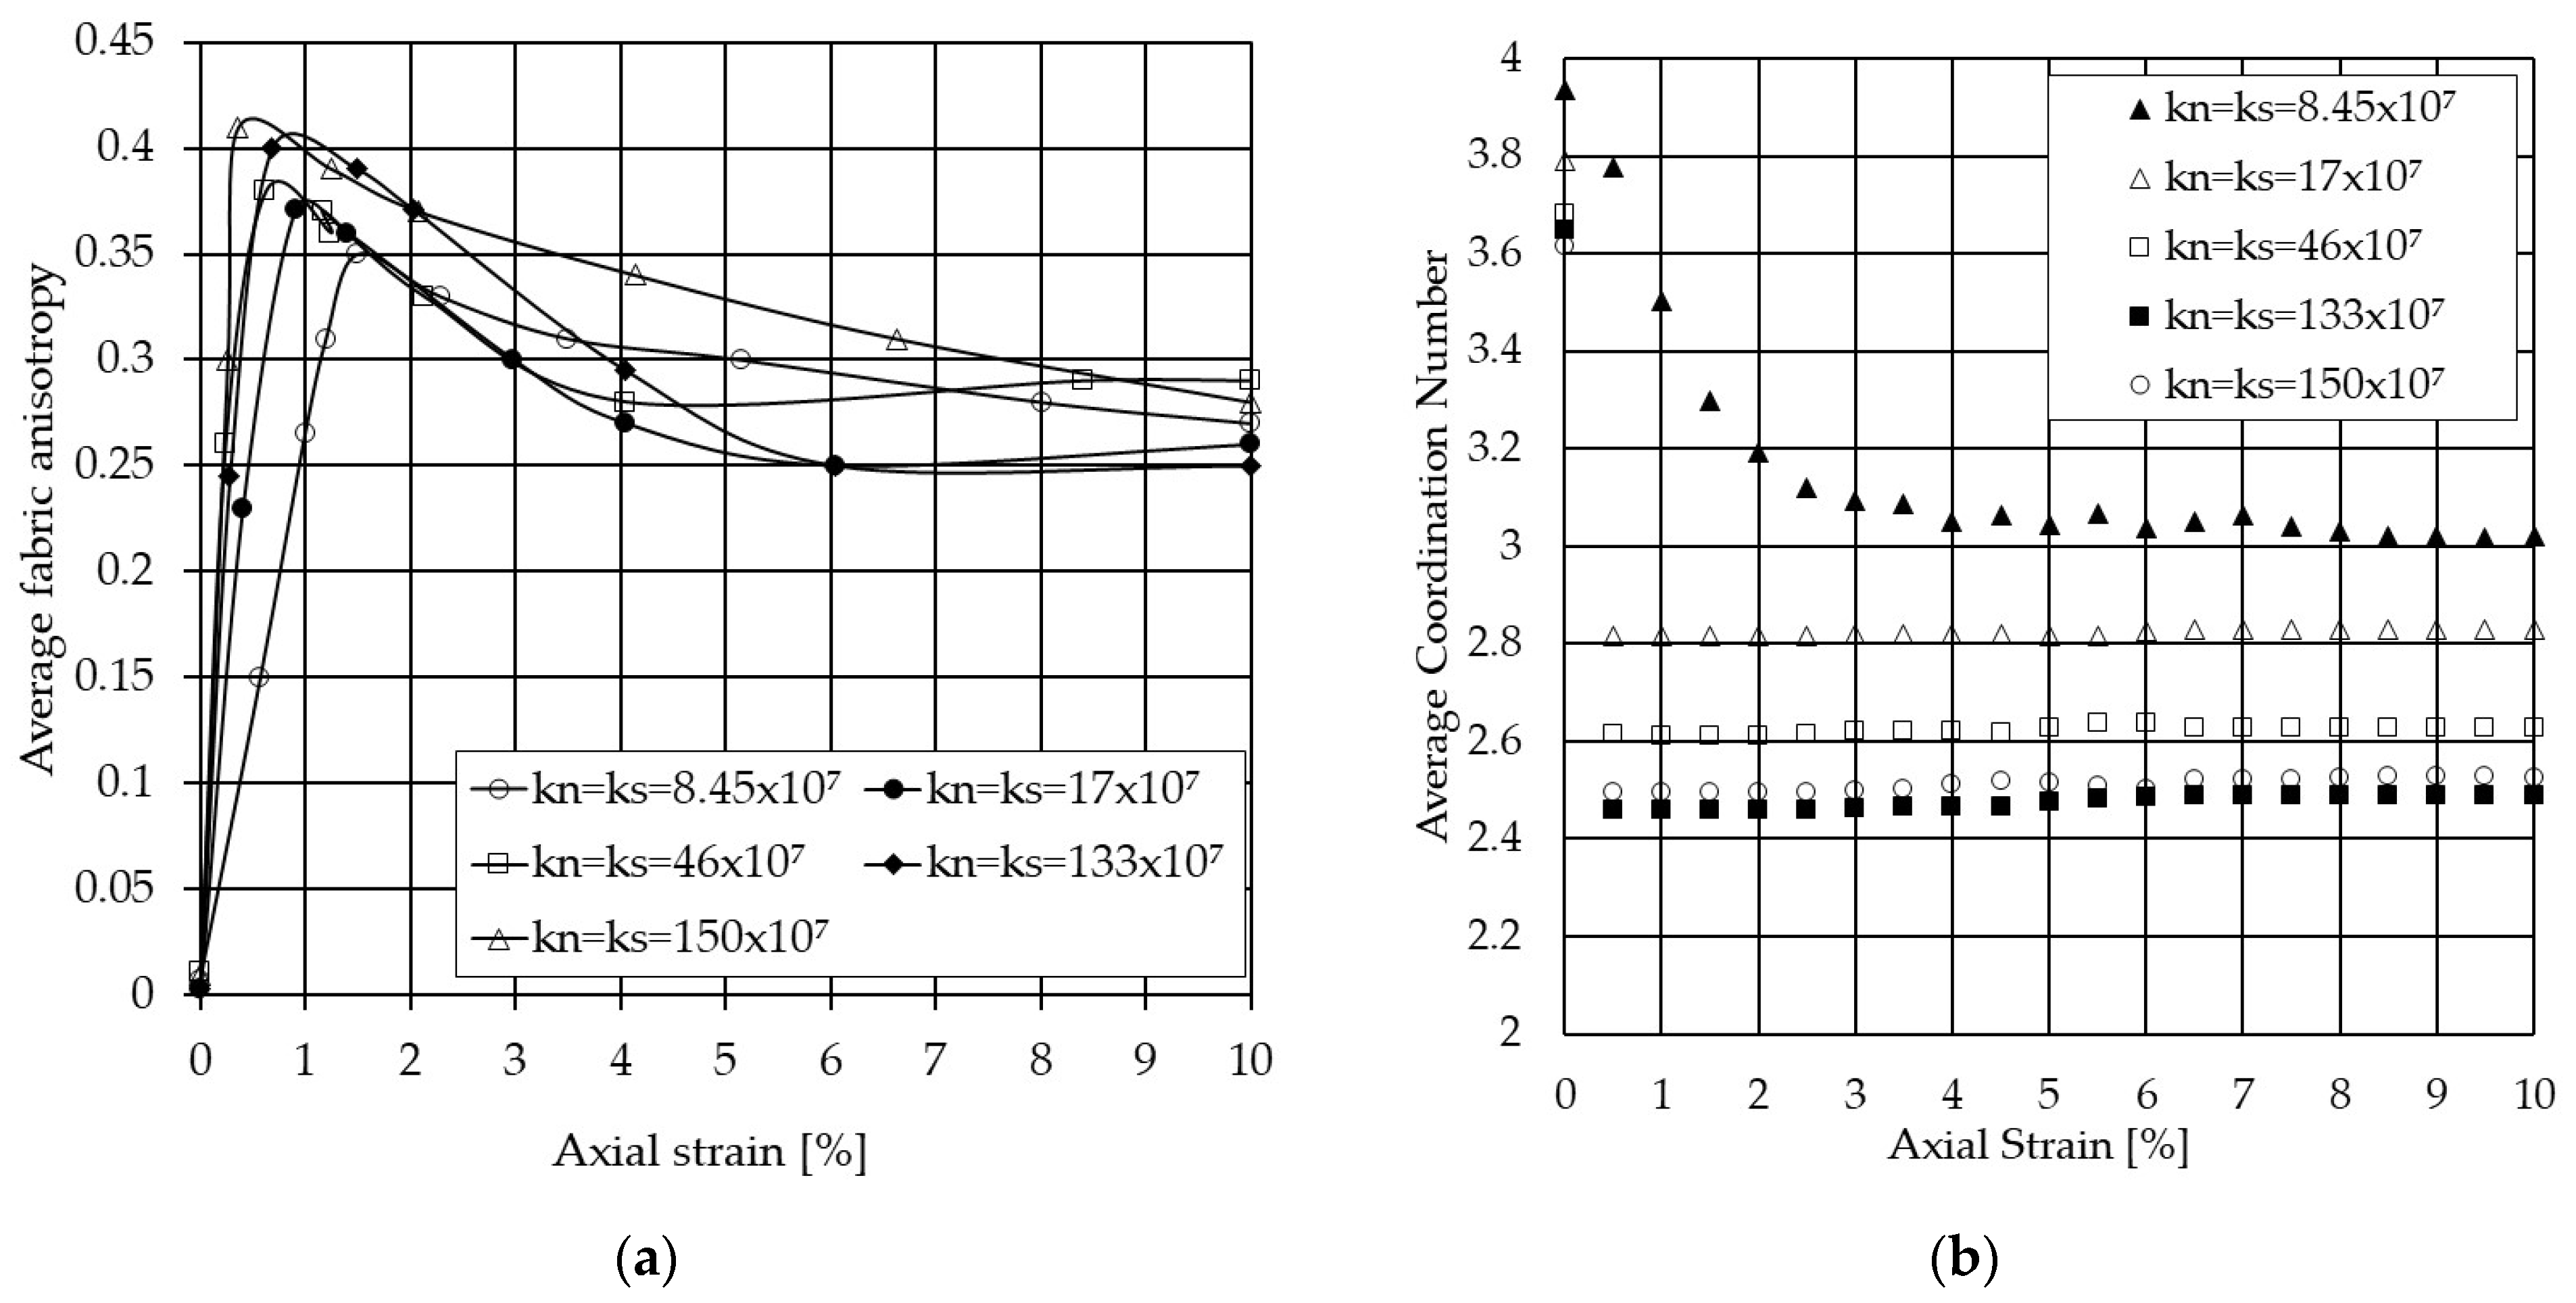
7 (N/m) leads to an increase in average fabric anisotropy (see
Figure 12a). Raising the ability of particulate systems to develop the fabric anisotropies results in an increase in their shear capacity. Comparing
Figure 8 and
Figure 12a shows that both have a similar trend, and the maximum fabric anisotropy takes place around peak deviatoric stress.
Figure 12b indicates the sensitivity of the average coordination number to the normal particle stiffness when the inter-particle coefficient of friction is 0.9. The average coordination number after peak deviatoric stress (see
Figure 8) for the models using
kn = 17 × 10
7 (N/m) to
kn = 150 × 10
7 (N/m) falls below three contacts, which is less than the value required for static equilibrium. It is because an increase in contact stiffness or inter-particle friction leads to an increase in the inter-particle contact forces and sliding capacity between particles. The developed chain contact forces at each contact during shearing rise to maintain the particulate sand in a static equilibrium and carry the load. Therefore, a lower average coordination number is expected to develop for higher contact stiffness to resist shearing. The average coordination number increases for the lower values of contact stiffness due to the dilatant behaviour of the particulate sand. For instance, for a model using
kn =
ks = 8.45 × 10
7 (N/m), the system contracts till axial strain of around 0.5% (see
Figure 8), demonstrating that the particulate sand becomes more compacted, and the tendency of particles to lose their contacts decreases. Therefore, the average coordination number is still high up to that point. By commencing the dilation behaviour, the tendency of particles to lose their contacts rises. That means the average coordination number drops significantly once dilation behaviour begins. By Reducing the dilation behaviour, the ability of the particulate sand to develop higher average fabric anisotropy in comparison to that for higher contact stiffness decreases.
4.4.3. The Sensitivity to the Shear Particle Stiffness
To study the sensitivity of the micro–macro mechanical behaviour of particulate sand to the shear contact stiffness, an additional fifteen biaxial tests were carried out. The ratio between normal contact stiffness and shear contact stiffness for these additional tests is assumed to be 0.5, while the inter-particle coefficient of friction varies between 0.5, 0.9, and 1.2. The input data for these additional fifteen biaxial tests are listed in
Table 8.
Figure 13 compares the sensitivity of combined deviatoric stress and volumetric strain with axial strain to the shear contact stiffness, for a wide range of contact stiffness and a fixed value of the inter-particle coefficient of friction of 0.9. The ratio of shear contact stiffness to the normal contact stiffness varies between 1 and 0.5. Changing the shear contact stiffness to half of the normal contact stiffness has a minor impact on the peak stress. The peak stress is about 260 (kPa), though the model with a contact stiffness of 150 × 10
7 (N/m) shows a slightly higher peak stress. For cohesionless particulate systems that are under the shearing, the number of contacts contributing to taking the load plays a major role in the magnitude of the peak stress that these systems can achieve. The sliding capacity of contact is a function of normal contact force and inter-particle coefficient of friction. The normal contact force is a function of contact stiffness and contact deformation. The latter can be dictated by the strain rate of loading applied to the sample. The higher the strain rate, the higher the peak stress that can possibly be gained, as presented by Yamamuro et al. [
49]. As the input data and initial conditions of these tests are similar (e.g., they are isotopically consolidated to 100 (kPa) and subjected to the same strain rate), the models with higher combined contact stiffness are stiffer and have a lower number of losing contacts during loading. That is, the stiffer models demonstrate higher hardening strain behaviour compared to those using
= 0.5. It also can be observed from
Figure 12 that shear contact stiffness significantly controls the pre-peak. A change in shear contact stiffness from
= 1 to
= 0.5 plays an important role in the slope of the backbone stress–strain curve and hardening strain behaviour. Chi et al. [
50], in their sensitivity study, showed that the slope of stress–strain behaviour of sand is influenced by shear contact stiffness. This alteration is more evident for the samples with contact stiffness 8.45 × 10
7 and 17 × 10
7 (N/m), while for models with higher contact stiffness, this change has less impact on the slope of the backbone stress–strain curve. This is because the models with
= 0.5 are less stiff, and the number of lost contacts can be larger during shearing for them in compression with the
= 1 models. Therefore, the models with
= 0.5 experience more axial displacement than
= 1 models under a similar stress level. As seen, the axial strain corresponding to the peak stress rises for the models with
= 0.5. Changing the shear contact stiffness to half of the normal contact stiffness also plays a major role in the post-peak and softening strain behaviour of particulate sand, such that those models using
= 0.5 show more softening strain behaviour post-peak. Reducing the shear contact stiffness to half of the normal contact stiffness value results in significant changes in the contraction and dilation volumetric behaviour of sand, in particular for those two models using lower normal contact stiffness, 8.45 × 10
7 (N/m) and 17 × 10
7 (N/m).
Table 9 summarises the values of Young’s modulus for the wide range of inter-particle coefficients of friction and contact stiffnesses where the shear contact stiffness is half of the normal contact stiffness. As explained above and from comparing
Table 6 and
Table 9, a change in the shear contact stiffness from
= 1 to
= 0.5 results in an alteration in the value of Young’s modulus for both plane strain and plane stress. For instance, the value of Young’s modulus at plane strain conditions for the model with
= 1 and
= 0.5, where the normal contact stiffness is 8.45 × 10
7 (N/m), and the inter-particle coefficient of friction is 1.2, calculated as 35 (MPa) and 29 (MPa), respectively. This is about a 17% reduction in Young’s modulus. This reduction in Young’s modulus at plane strain conditions for contact stiffness 17 × 10
7 (N/m), 46 × 10
7 (N/m), 133 × 10
7 (N/m), and 150 × 10
7 (N/m) when shear contact stiffness changed from
= 1 to
= 0.5 is 12%, 21%, 13%, and 17%, respectively. A similar exercise was carried out to investigate the sensitivity of Young’s modulus shear contact stiffness where a fixed inter-particle coefficient friction of 0.9 is applied. The plane strain Young’s modulus value drops by 20%, 12%, 18%, 12%, and 17% for contact stiffness 8.45 × 10
7 (N/m), 17 × 10
7 (N/m), 46 x10
7 (N/m), 133 × 10
7 (N/m), and 150 × 10
7 (N/m). Changing the shear contact stiffness from
= 1 to
= 0.5 leads to an average reduction of 16% in plane strain Young’s modulus for the particulate sand.
Table 10 summarises the values of Poisson‘s ratio where the shear contact stiffness is half of the normal contact stiffness. To study the sensitivity of bulk Poisson’s ratio to the shear contact stiffness, the values of Poisson’s ratio summarised in
Table 7 and
Table 9 for
= 1 and
= 0.5 models were compared. Comparison between
Table 7 and
Table 10 shows that a reduction in shear contact stiffness to half of the normal contact stiffness leads to a notable increase in the value of Poisson’s ratio for both plane strain and plane stress. Coetzee and Els [
51] and Belheine et al. [
31] showed in their parametrical study that a change in the
ratio has an influence on the materials’ Poisson’s ratio. This reduction in Poisson’s ratio at plane strain conditions and fixed inter-particle coefficient friction of 0.9 for contact stiffness 8.45 × 10
7 (N/m), 17 × 10
7 (N/m), 46 × 10
7 (N/m), 133 × 10
7 (N/m), and 150 × 10
7 (N/m) when shear contact stiffness changed from
= 1 to
= 0.5 is 28%, 26%, 25%, 17%, and 12%, respectively. The impact of this reduction in shear contact stiffness value to the plane strain Poisson’s ratio was studied where a fixed inter-particle coefficient friction of 1.2 was used. The plane strain Poisson’s ratio value increases by 14%, 14%, 8%, 8%, and 7% for contact stiffness 8.45 × 10
7 (N/m), 17 × 10
7 (N/m), 46 × 10
7 (N/m), 133 × 10
7 (N/m), and 150 × 10
7 (N/m). Comparing the numbers shows that a reduction in shear contact stiffness to half of the normal contact stiffness has a significant impact on the models with lower contact stiffness (e.g., 8.75 × 10
7 (N/m) and 17 × 10
7 (N/m)).
As highlighted above, an increase in
from 0.5 to 1 has a small impact on the peak deviatoric stress. Using Equation (19), the value of the angle of internal friction can be calculated from peak stress and the applied confining pressure. The peak stress for the models using
= 0.5 and
= 1 is taken from
Figure 8 and
Figure 13, respectively.
Table 11 compares the angle of internal friction for
= 0.5 and
= 1. As seen, an increase in
from 0.5 to 1 plays a minor role in the angle of internal friction. For instance, the angle of friction for the model with contact stiffness 17 × 10
7 (N/m) and the inter-particle coefficient of friction of 0.9, where shear contact stiffness is reduced to half of the normal contact stiffness, changed from 27° to 26°.
The polar diagram of contact distribution during the shearing for the model with a contact stiffness of 8.45 × 10
7 (N/m), where
= 0.5 and a fixed value of 0.9 is applied to the inter-particle coefficient friction, is presented in
Figure 14. Comparing
Figure 11 and
Figure 14 show that at peak stress, the diameter of the polar diagram in the major direction, representing the number of contacts per segment, reduced from around 3400 to about 3200. This reduction in the number of contacts results in the particulate system becoming less stiff and taking less load. Additionally, the average fabric anisotropy drops from 0.35 to 0.33, indicating the ability of the system with
= 0.5 to generate the number of contacts to take more load reduces. The orientation of contacts at the post-peak is also toward the confining stress, with average fabric anisotropy reduced to 0.26.
This reduction in the number of contacts is observed in
Figure 15, where the sensitivity of the average coordination number to a reduction in shear contact stiffness from
= 1 and
= 0.5 for two sets of contact stiffness (i.e., 8.75 × 10
7 (N/m) and 17 × 10
7 (N/m)) is compared. At
= 0.0, the average coordination number for models with the lower shear contact stiffness value is approximately similar to that obtained from the model with higher shear contact stiffness. From
= 0.0 to the axial strain corresponds to the peak stress (see
Figure 14), and the average coordination number for all models reduces. However, the models with lower shear contact stiffness experience a higher reduction in average coordination number. At post-peak, the average coordination number significantly decreases for the model with lower shear contact stiffness.
