

Influence of Saline Pore Fluid on Soil Behavior during Evaporation


Abstract
:1. Introduction
2. Research Methodology
3. Results and Discussion
4. Summary and Conclusions
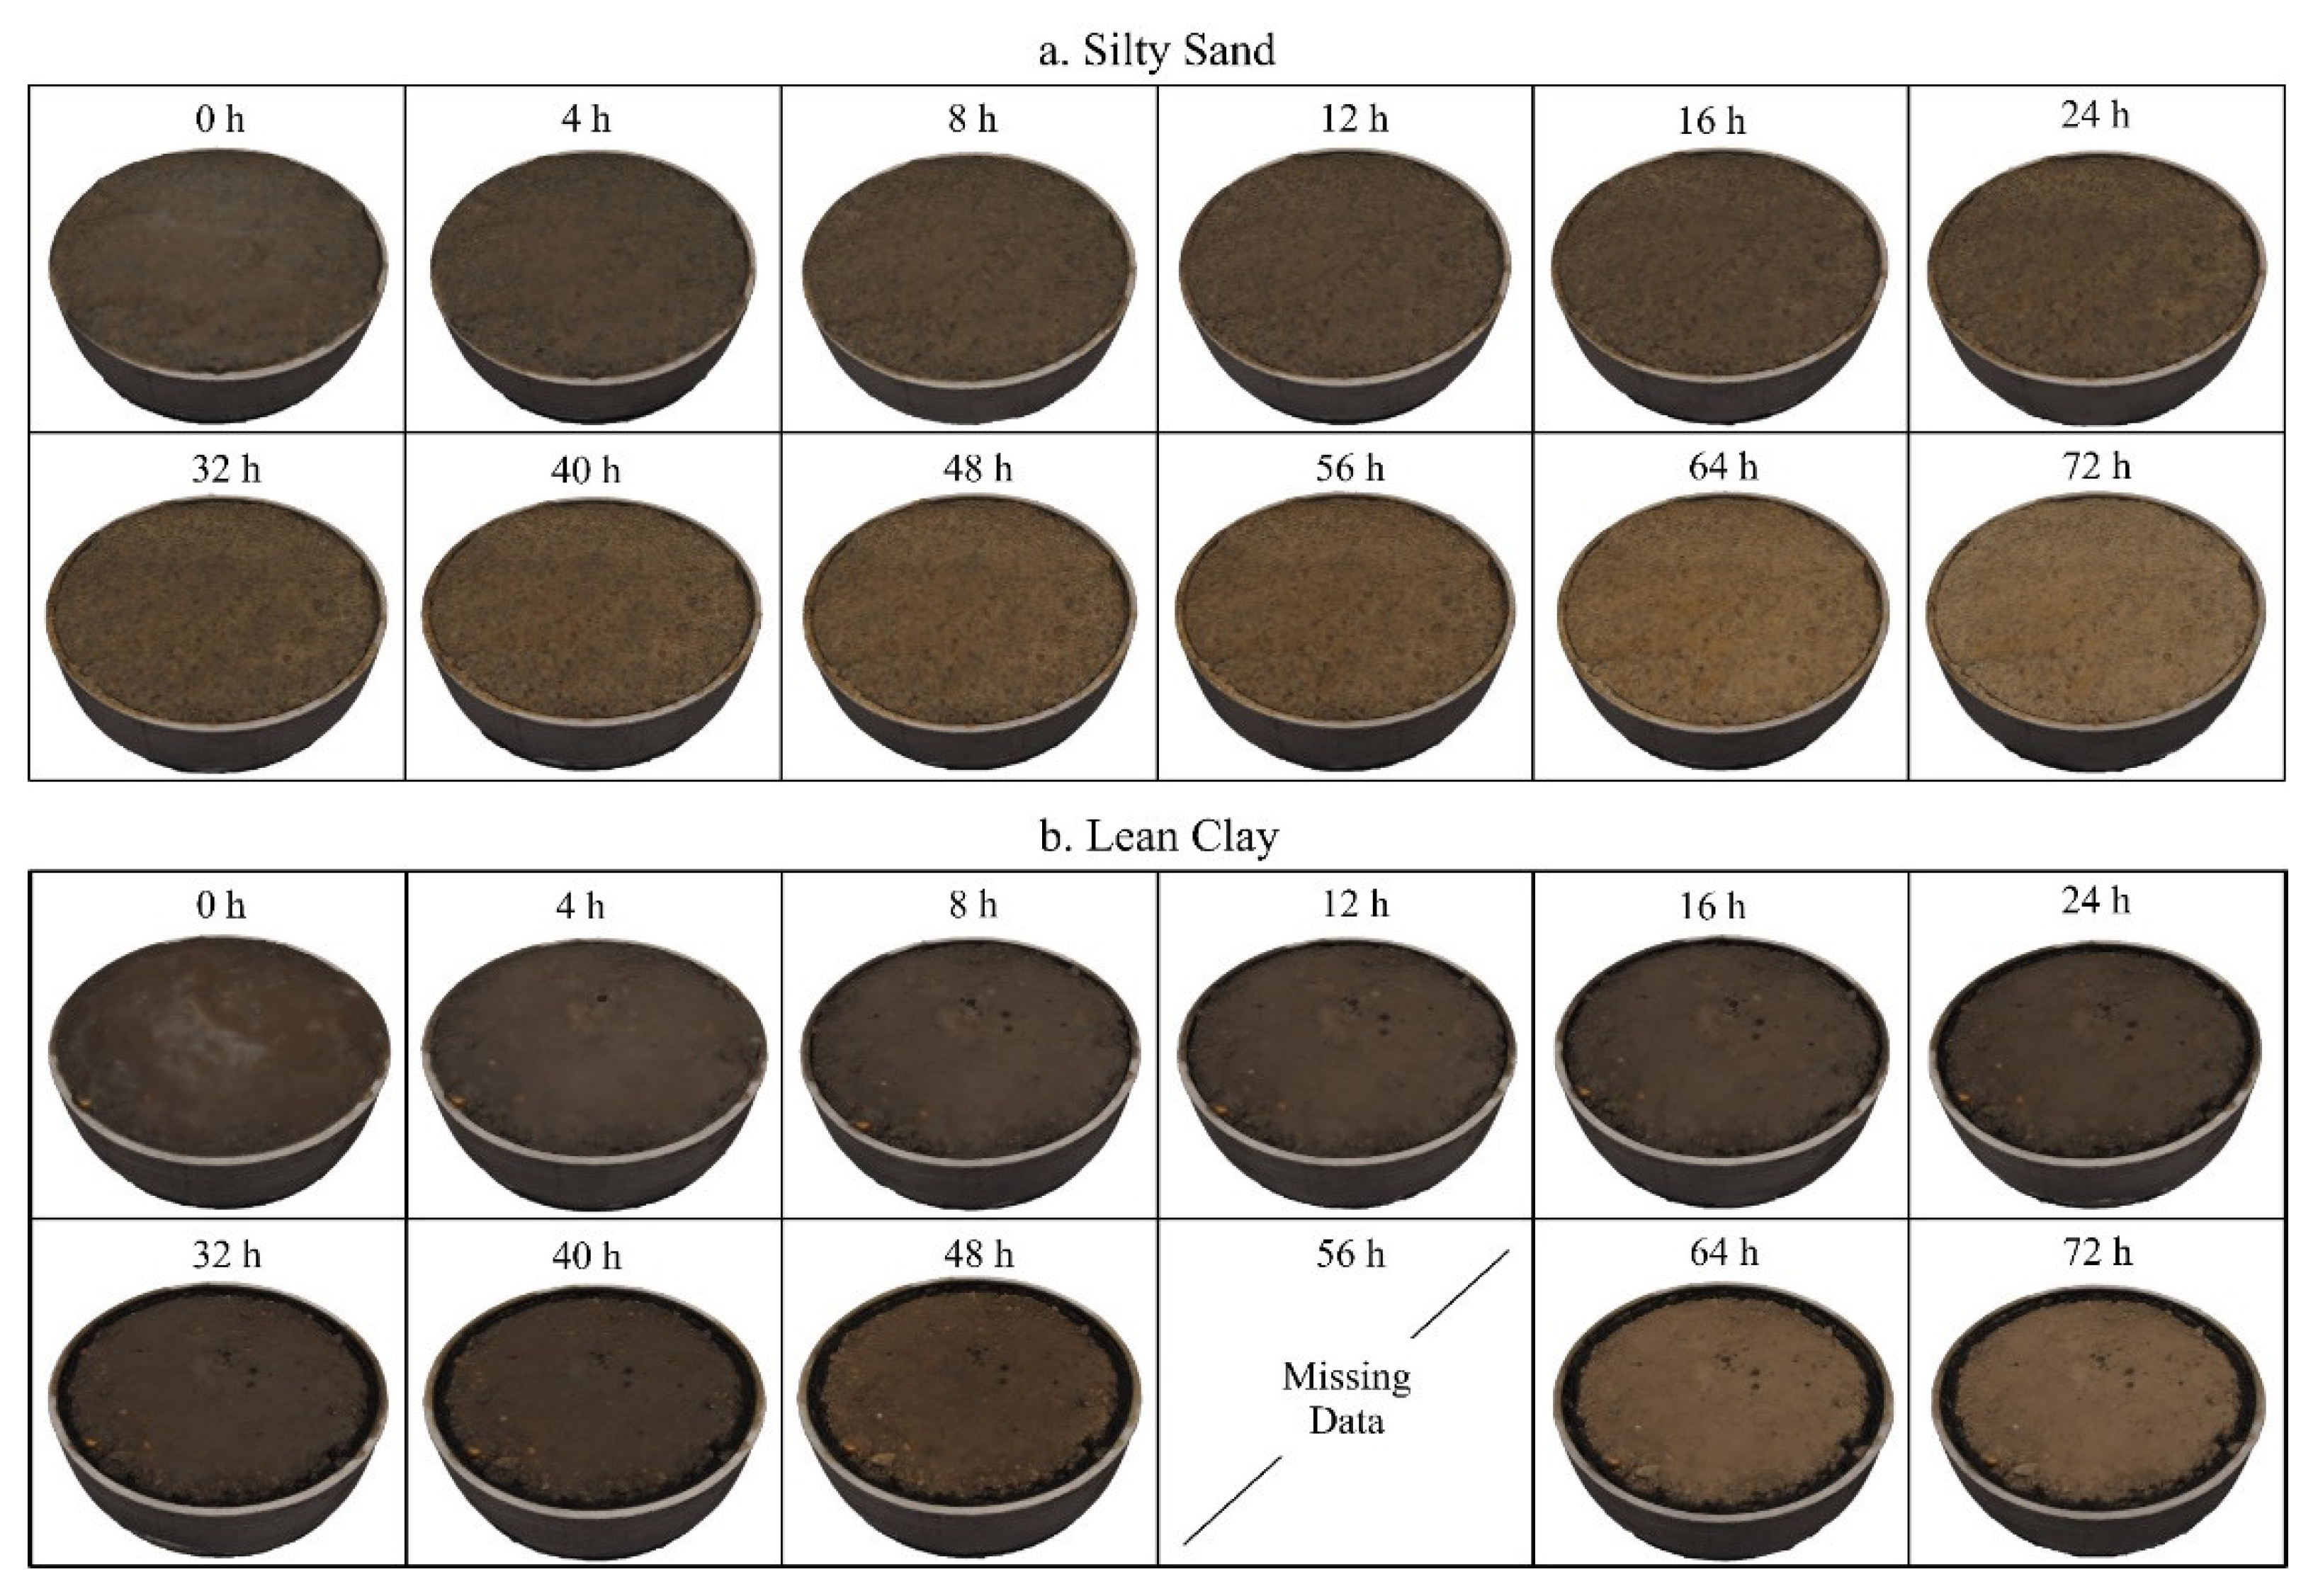
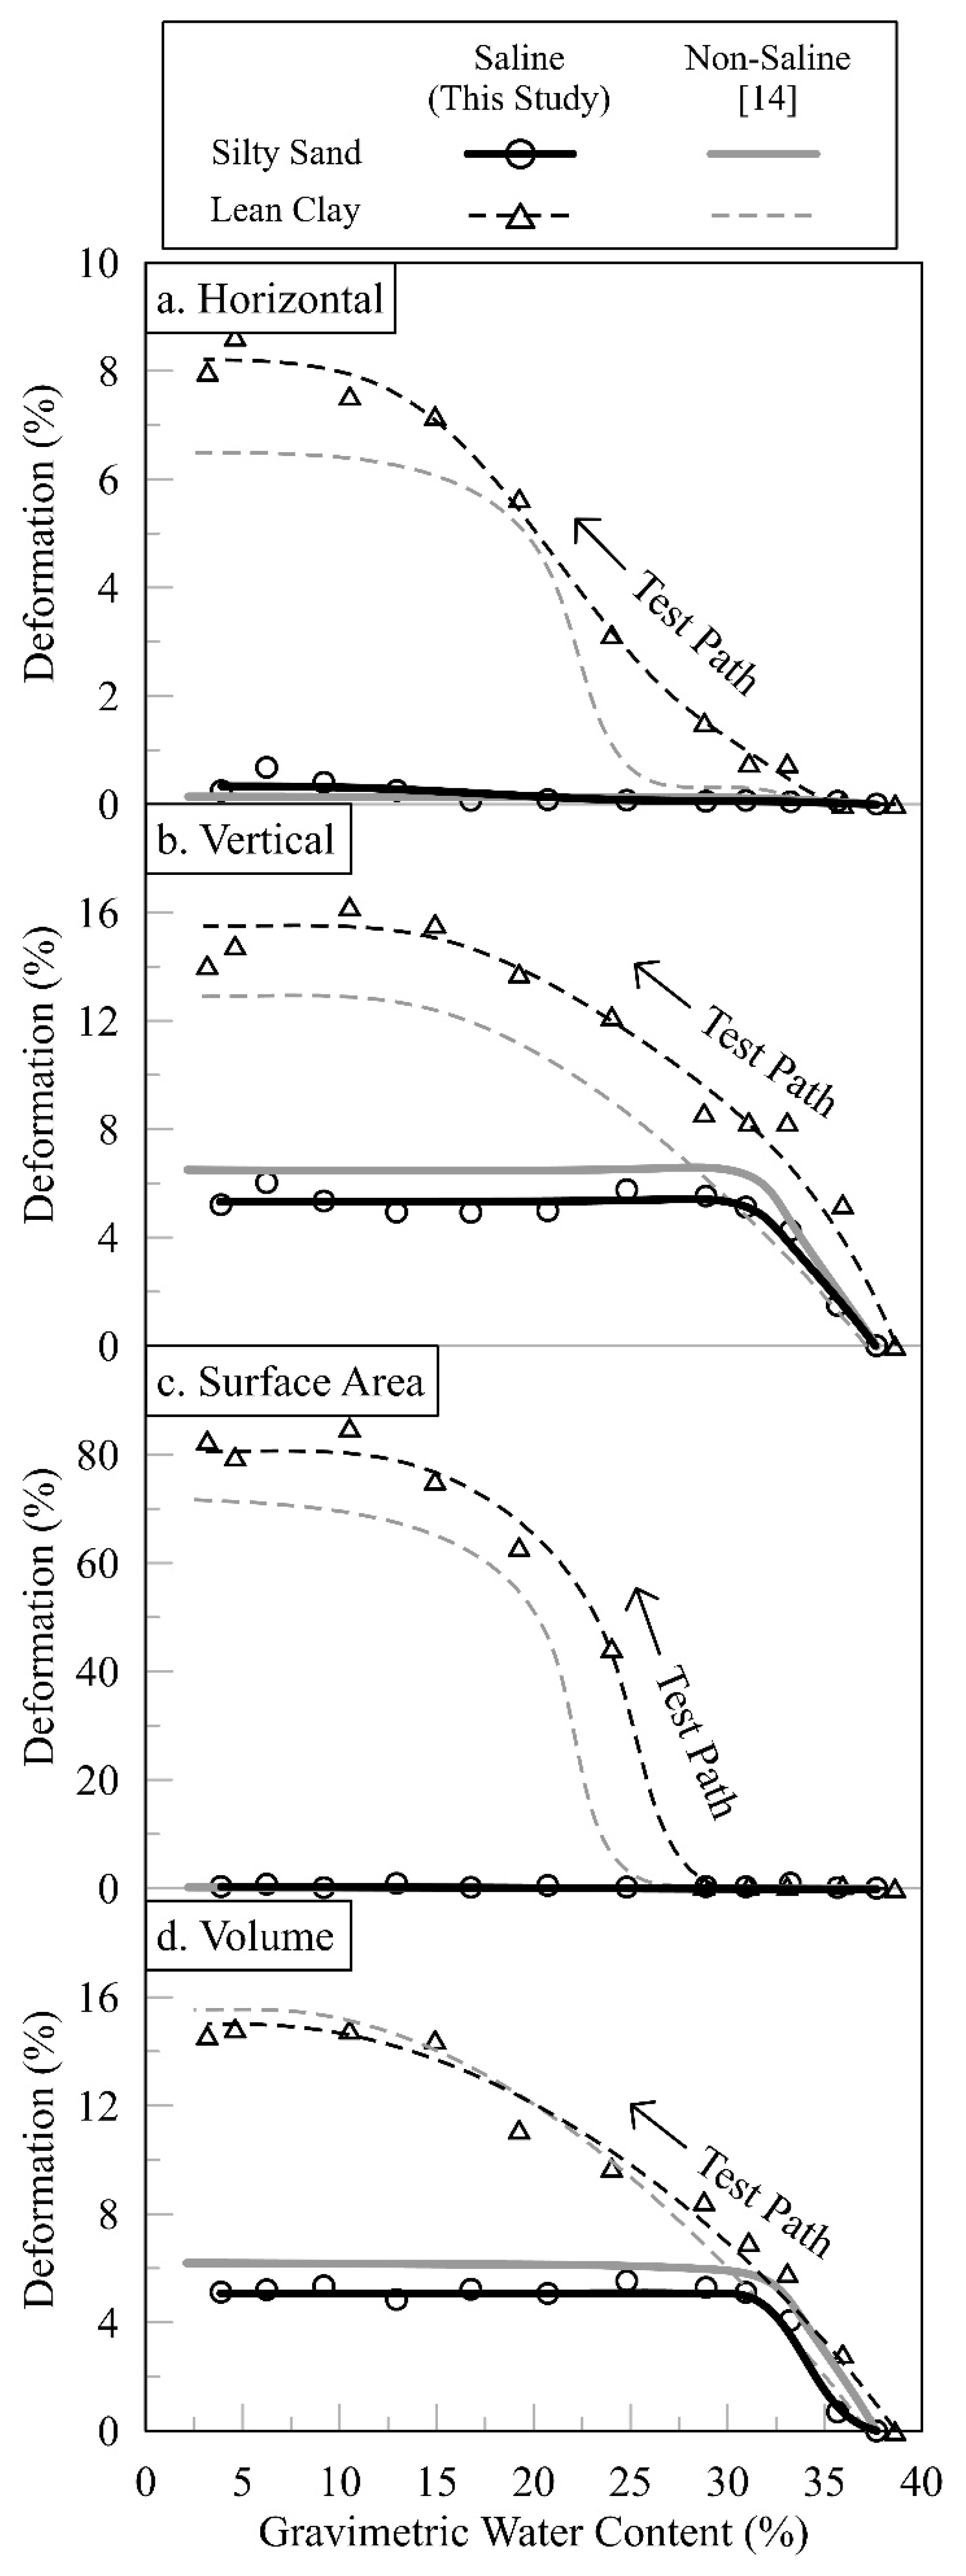
- Over the investigated range of water content, the sample color change from dark brown to light brown indicated the downward movement of the drying front. The silty sand exhibited negligible horizontal and surface area deformations with 5% vertical and volumetric reductions. The lean clay decreased 8% horizontally and 16% vertically, while the surface area deformed by 80% and the volume reduced by 15%.
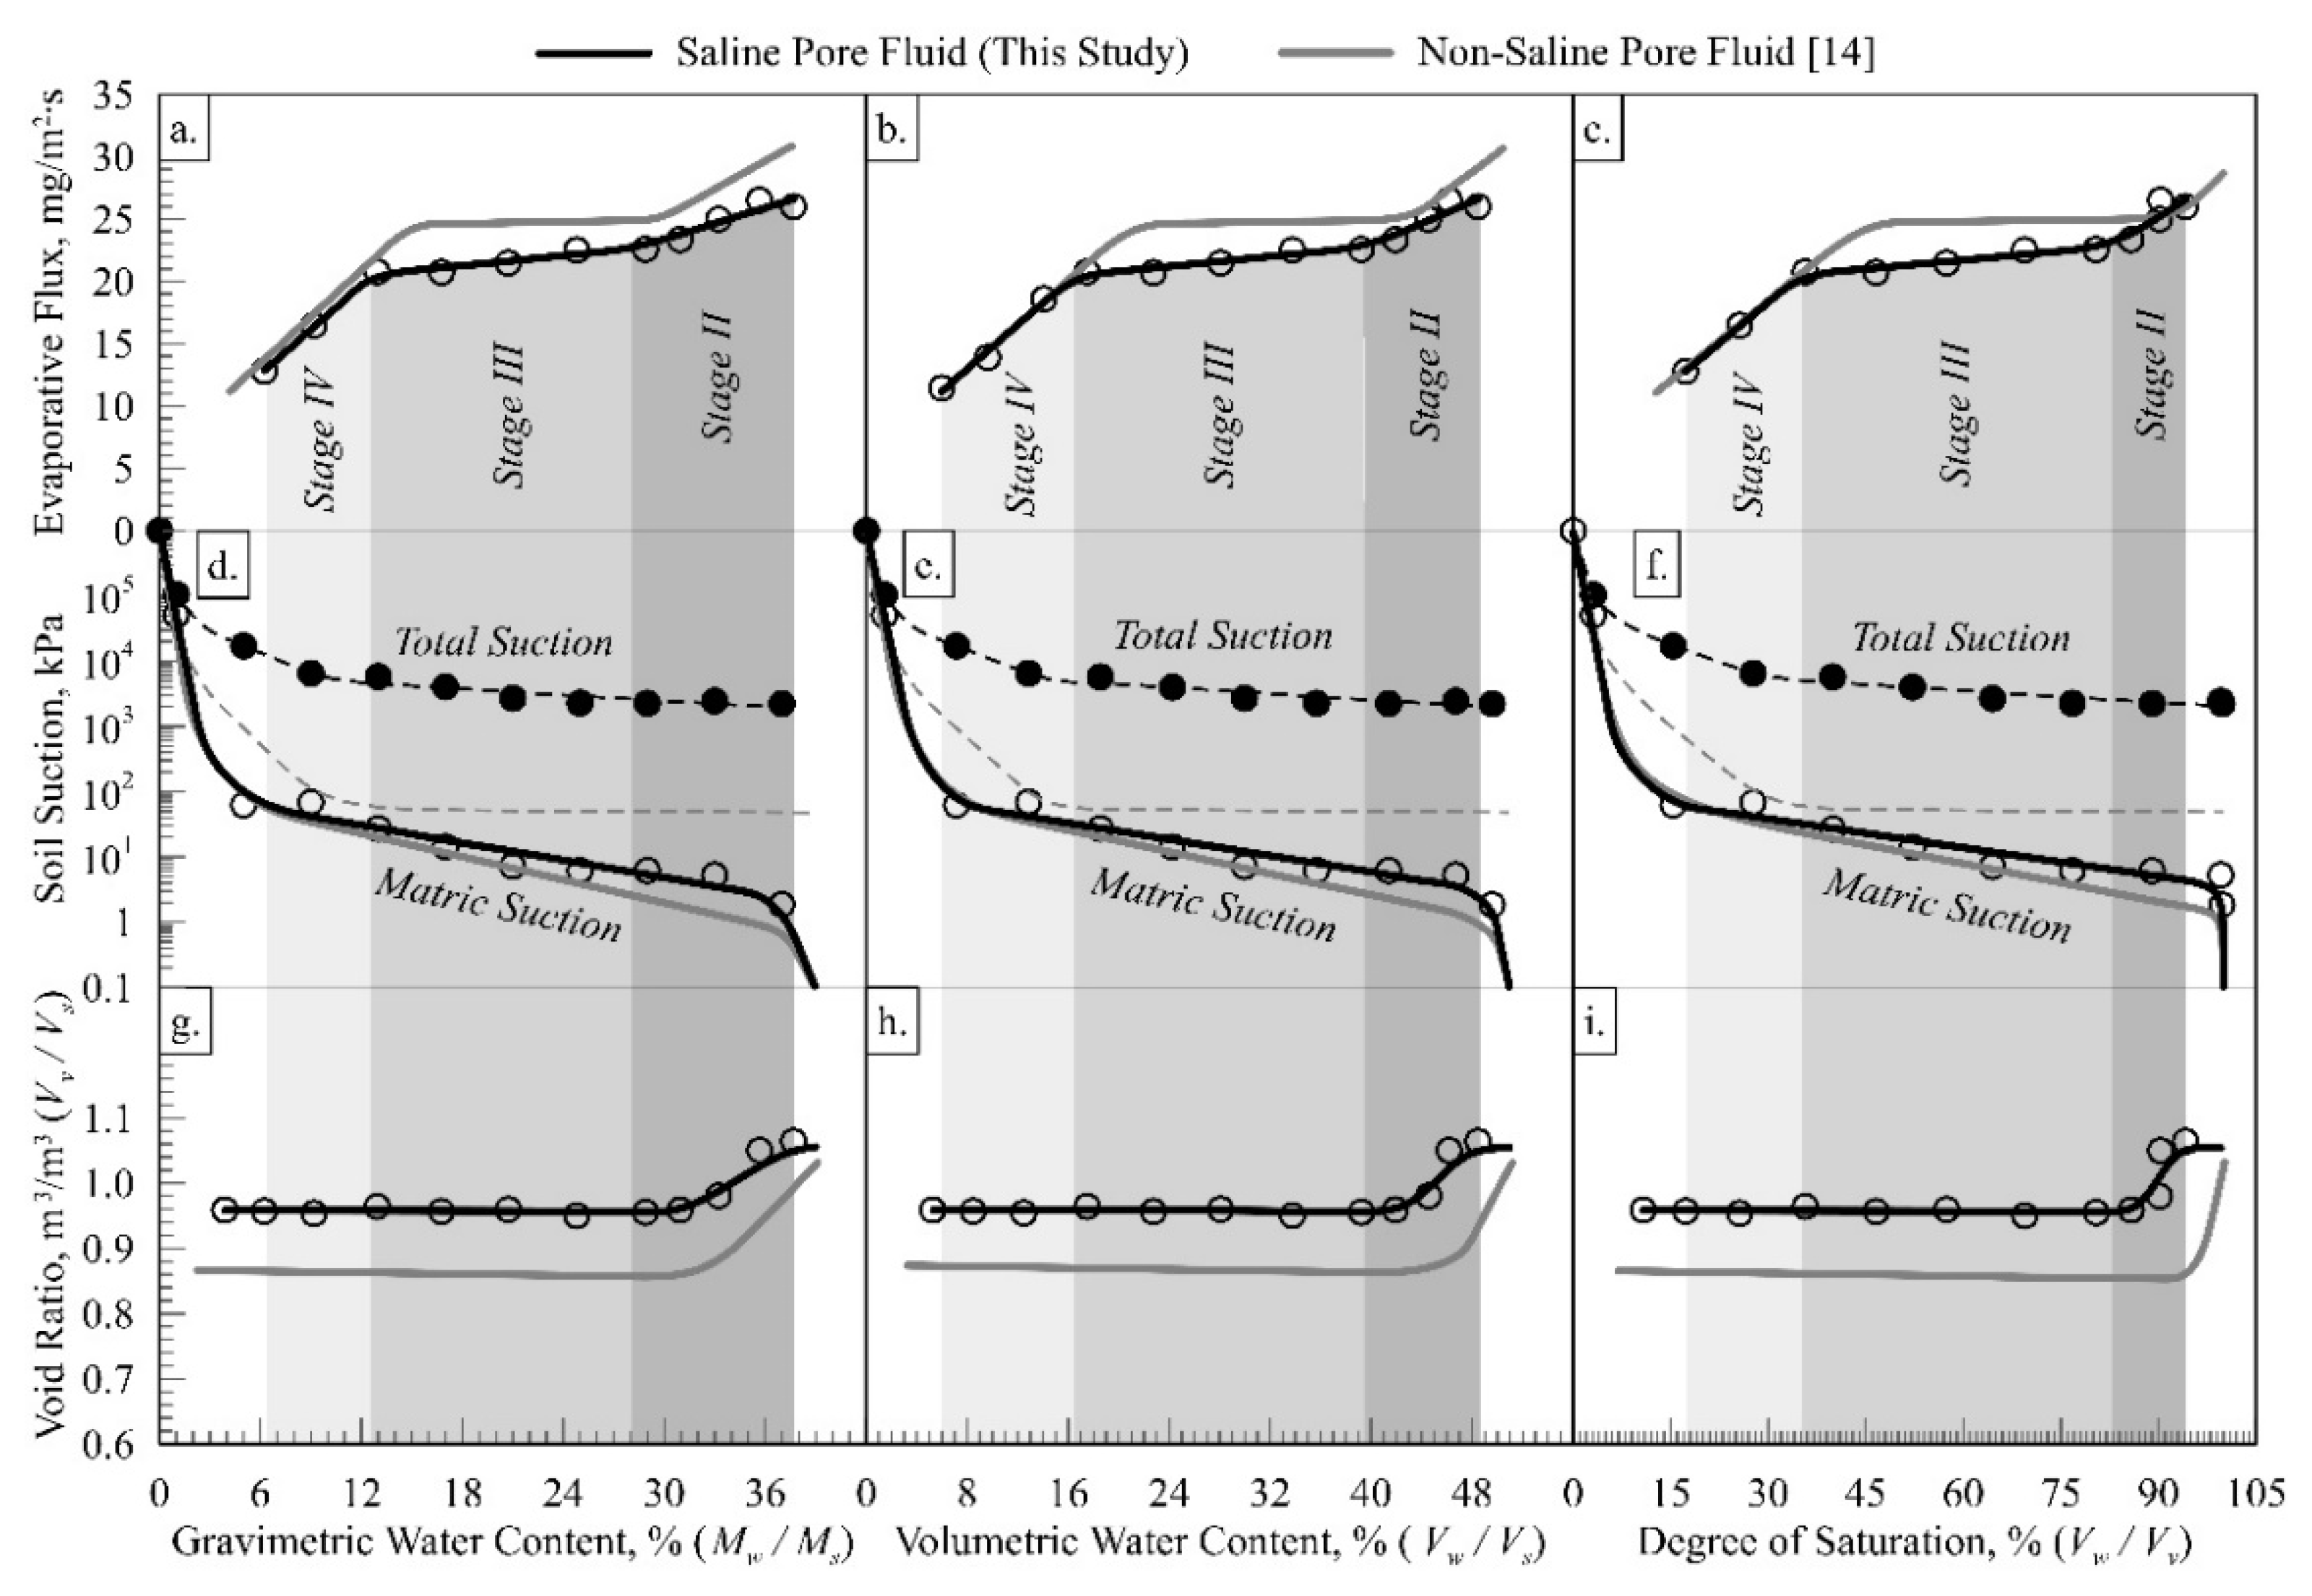
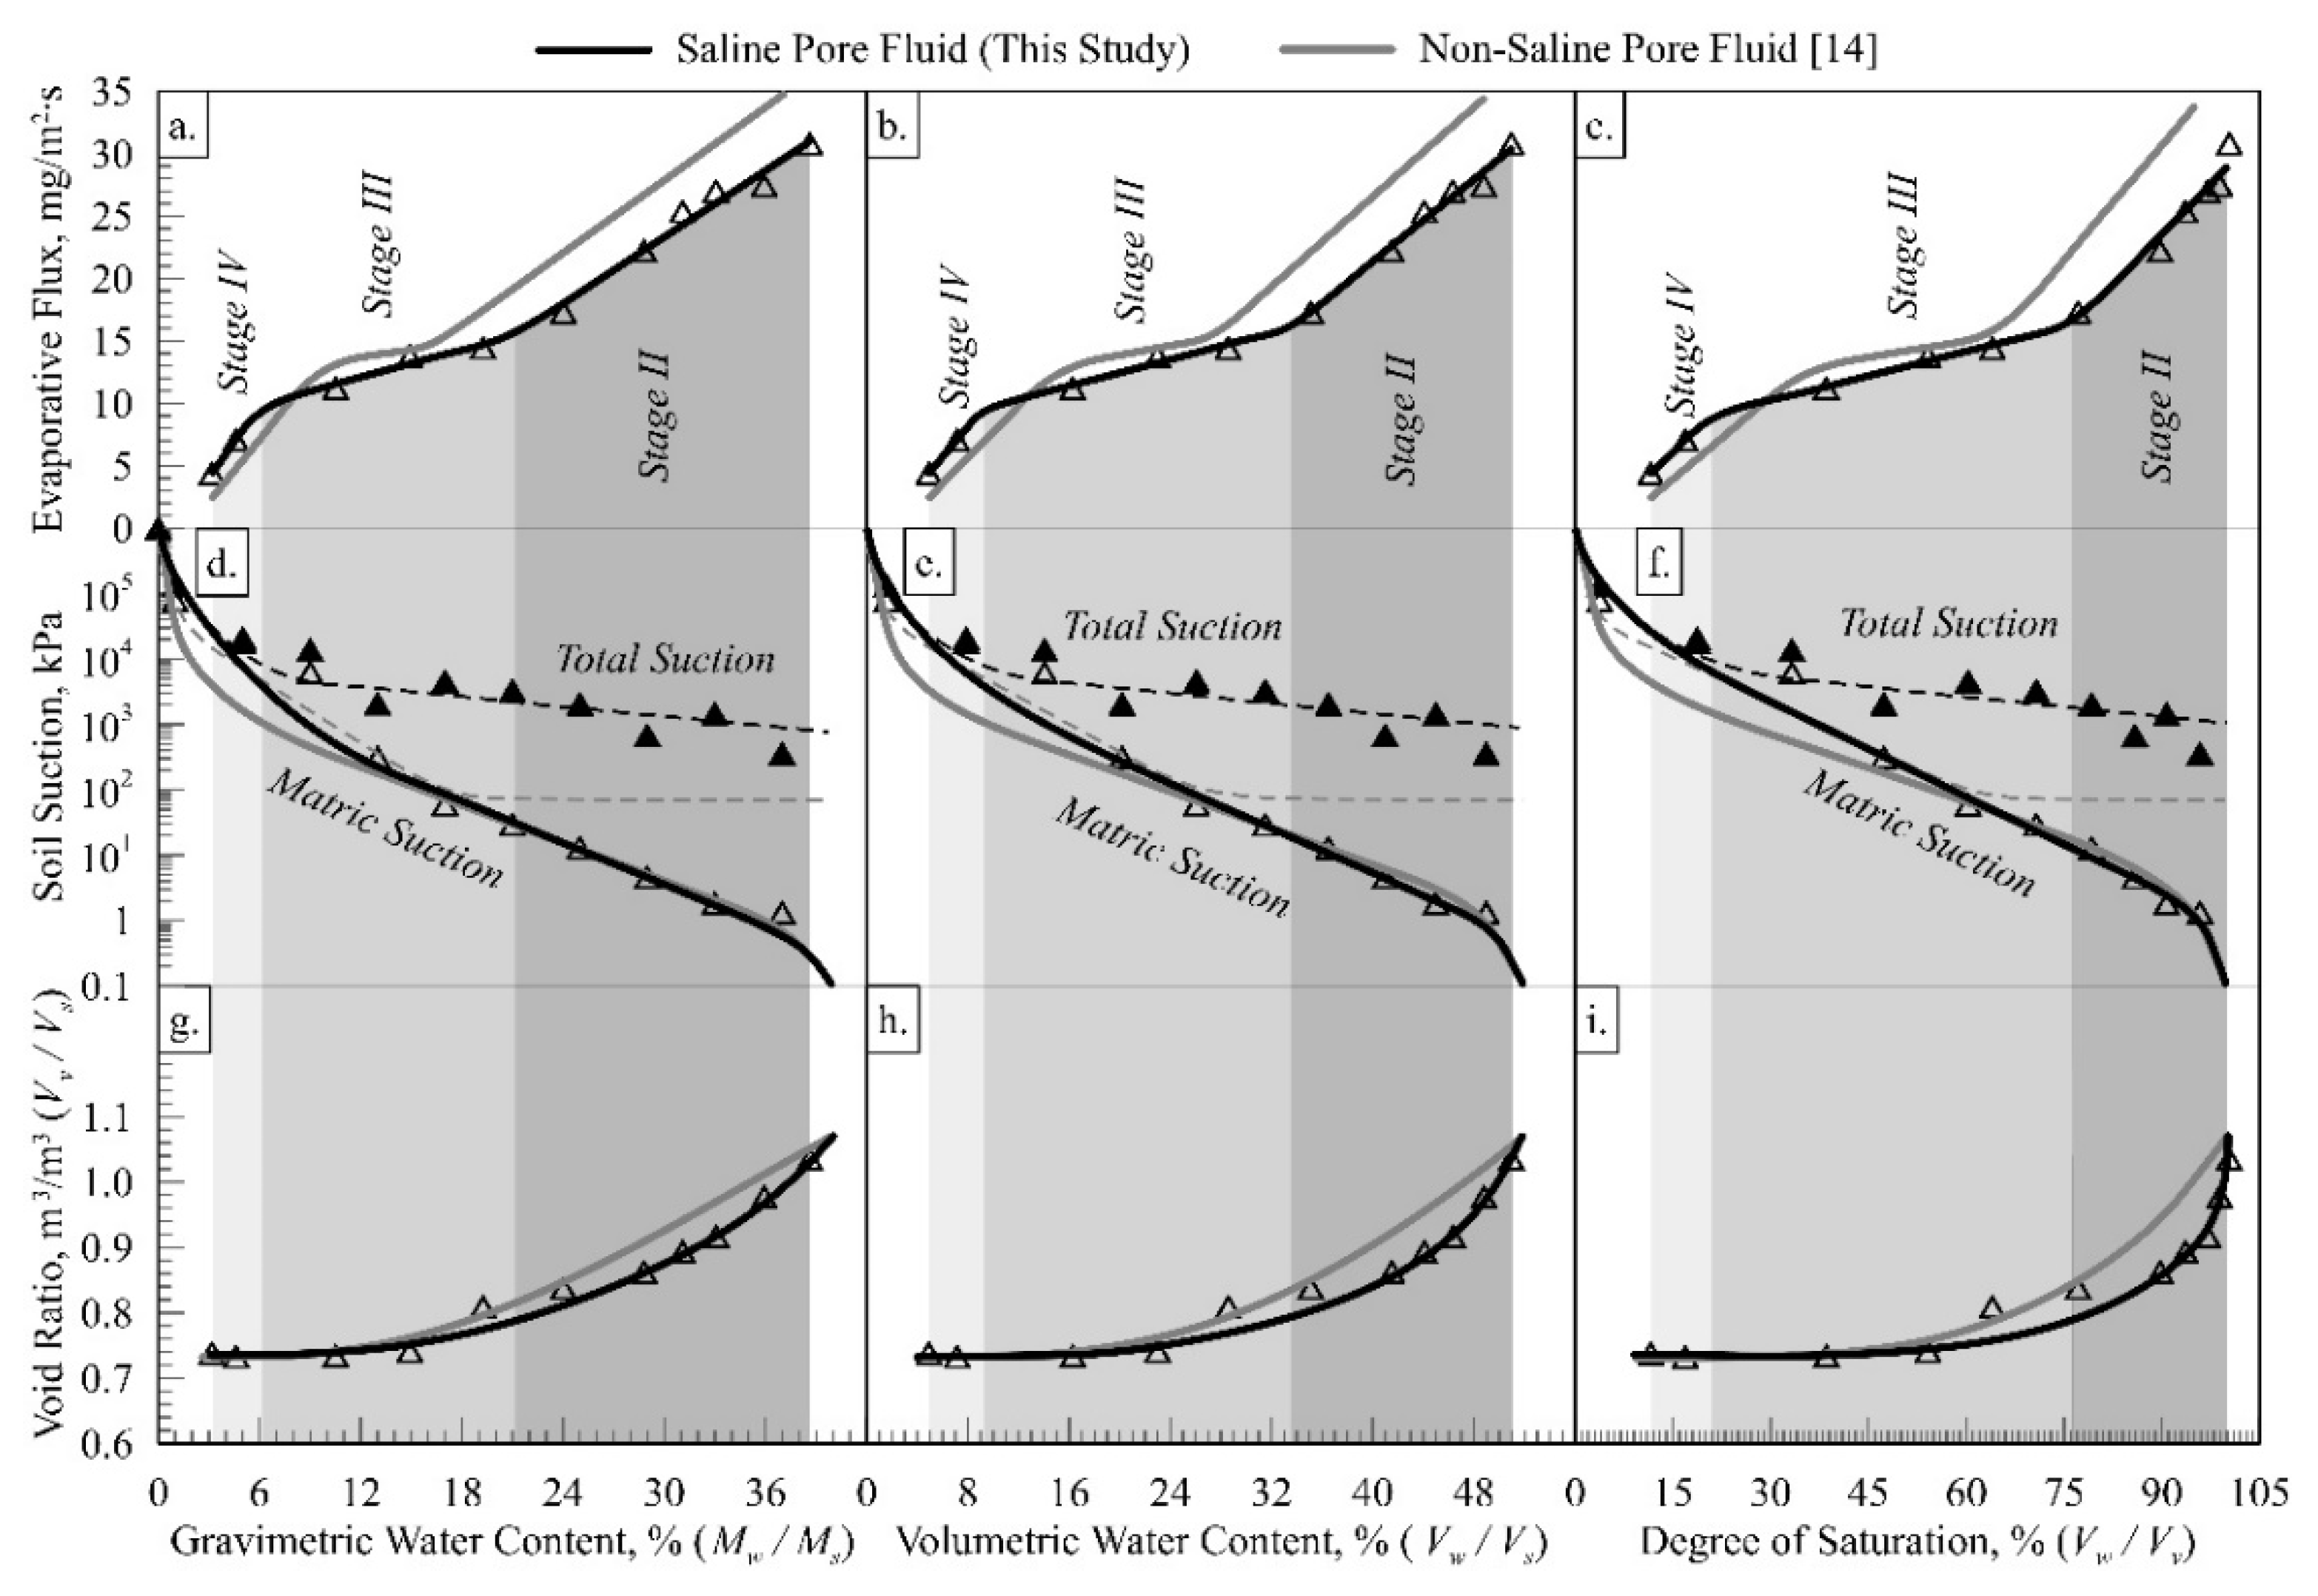
- The silty sand evaporative flux decreased from 26 mg/m2∙s to 22 mg/m2∙s in Stage II, remained at a constant flux in Stage III, and decreased to 13 mg/m2∙s in Stage IV. Based on matric suction, the AEV and RSV were 5 kPa and 100 kPa, respectively. The total suction was about 5000 kPa and merged with matric suction near the Stage II/Stage III boundary. The SSC was J-shaped, with the only void ratio decrease in Stage II.
- The lean clay evaporative flux decreased from 30 mg/m2∙s to 15 mg/m2∙s in Stage II, to 10 mg/m2∙s in Stage III, and then to 5 mg/m2∙s in Stage IV. The AEV was 5 kPa and the RSV was 2000 kPa. The total suction during Stage II and Stage III ranged from 1000 kPa to 6000 kPa with an average value of 3500 kPa. The SSC showed a major void ratio decrease in Stage II, marginal decrease in Stage III, and no decrease in Stage IV.
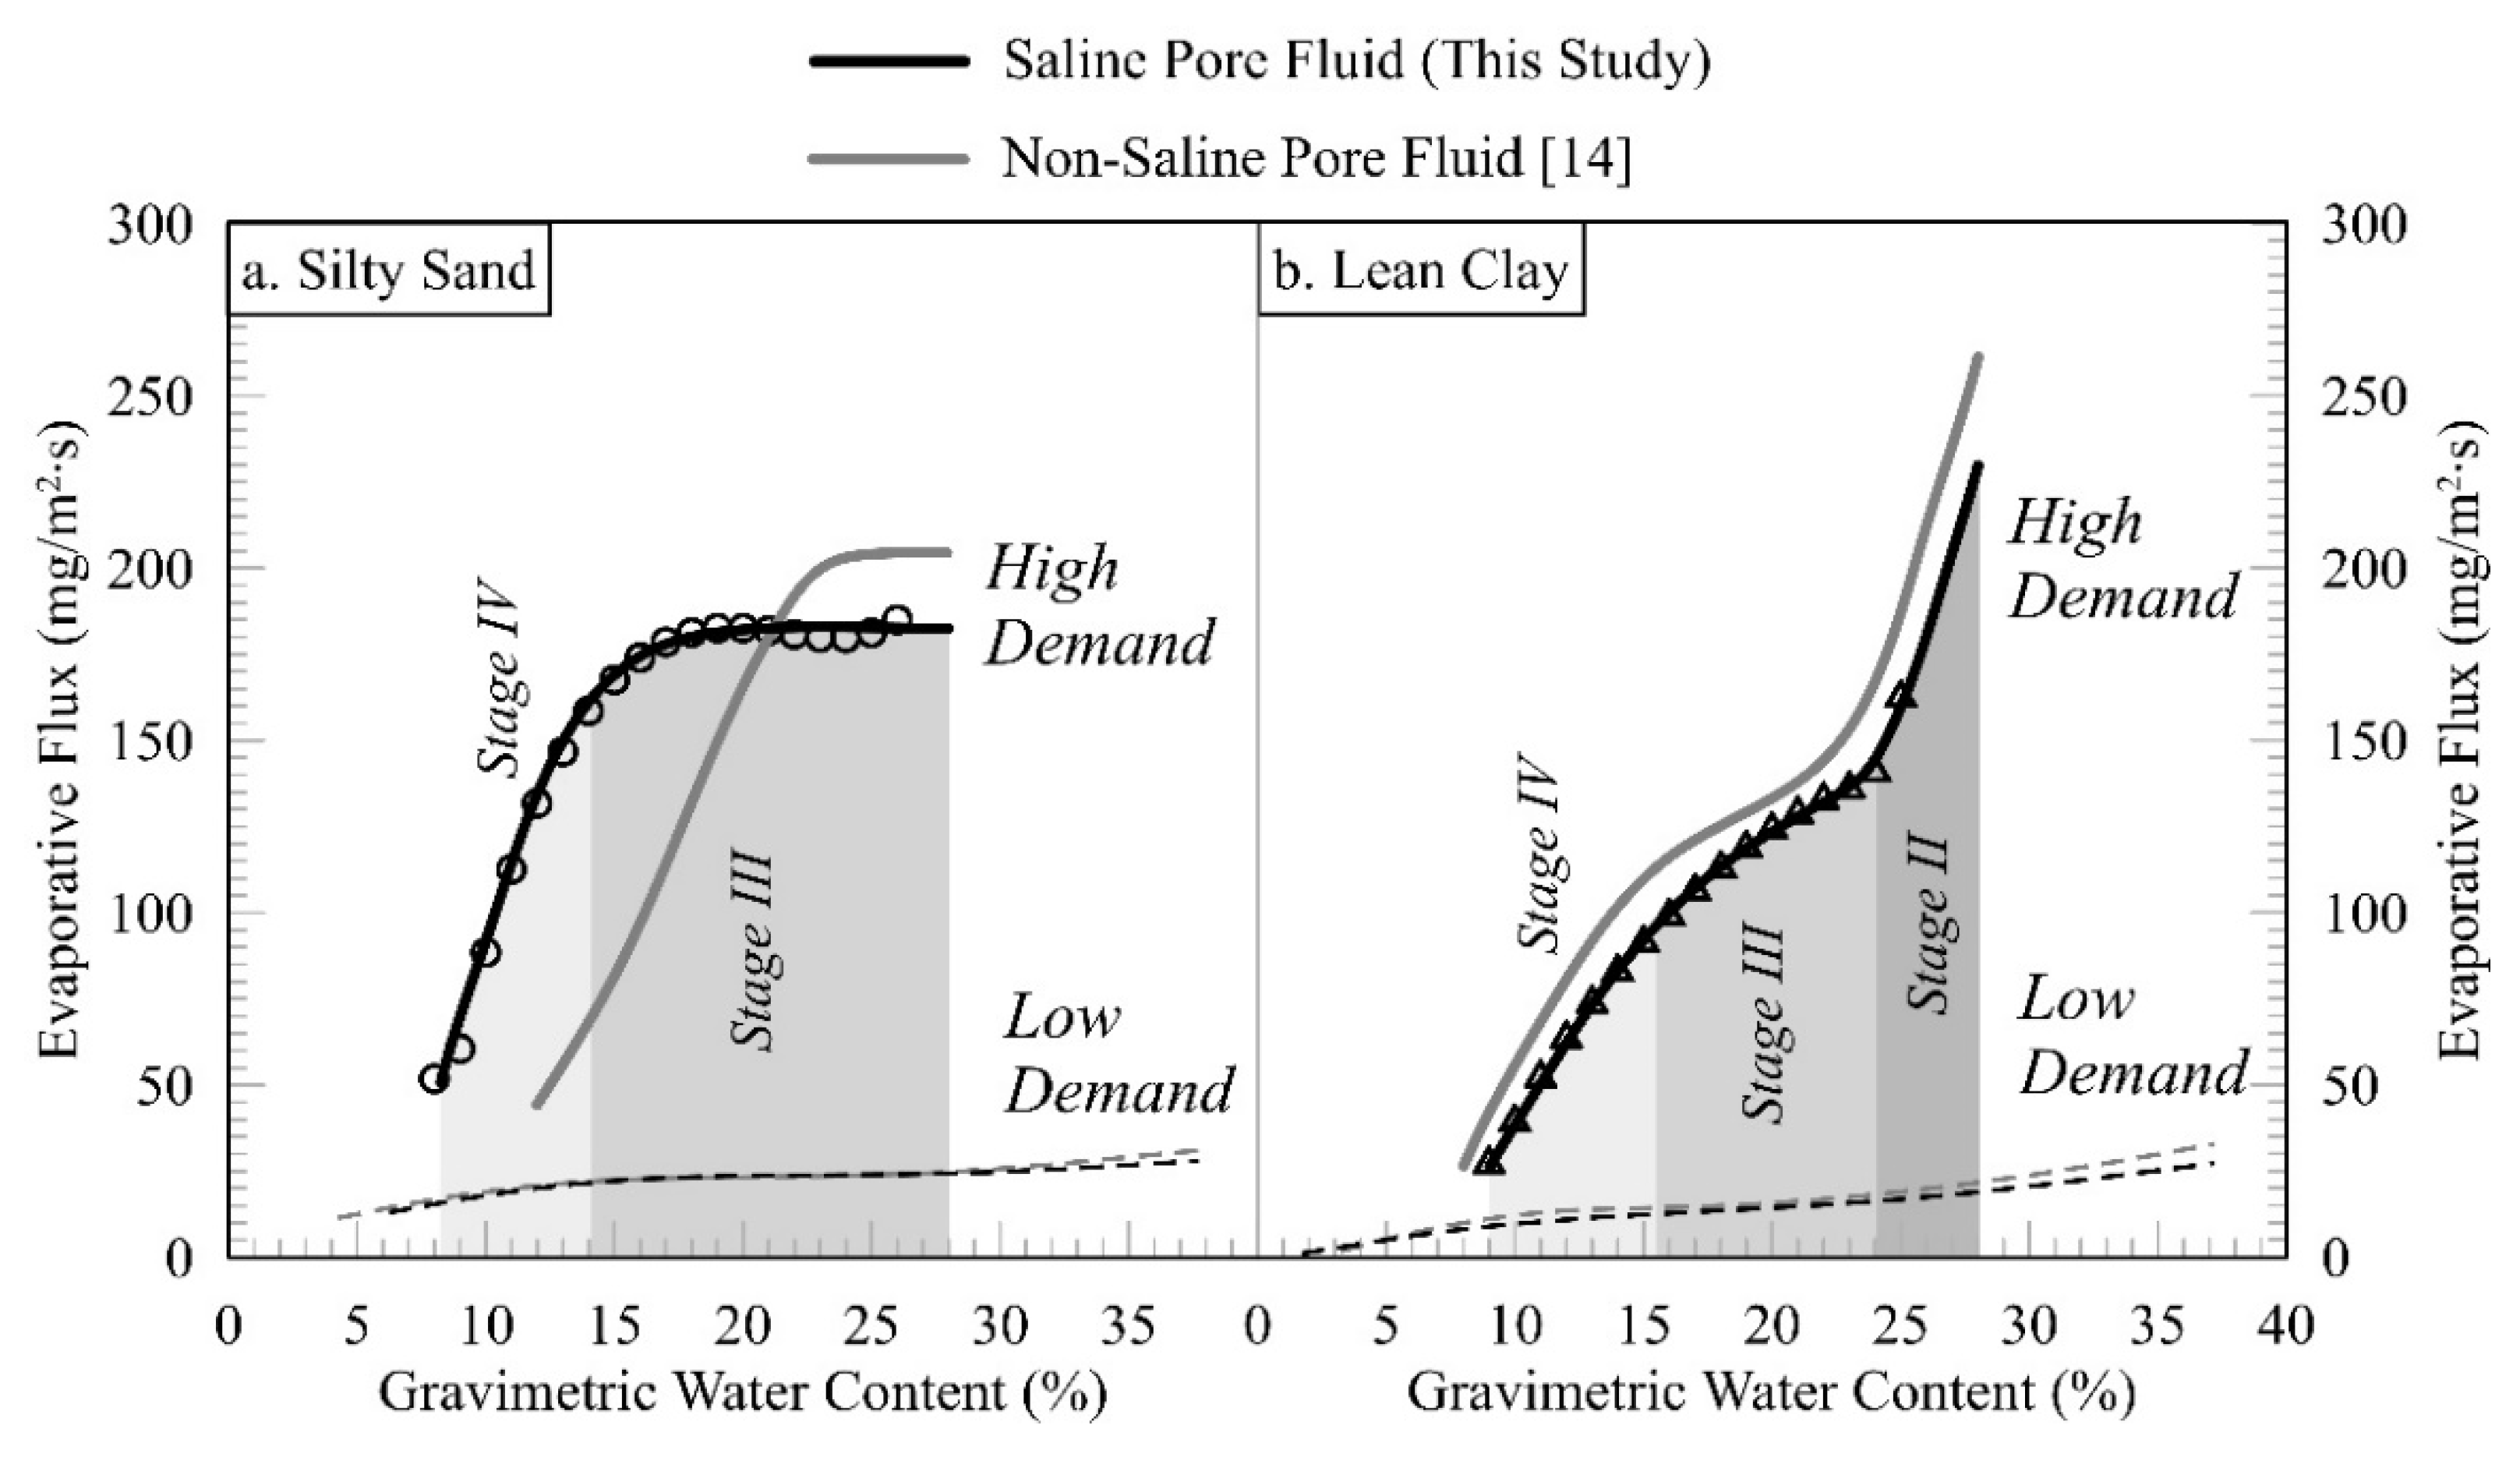
- Under high demand, the evaporative flux for silty sand was constant at 180 mg/m2∙s in Stage III and decreased to 50 mg/m2∙s in Stage IV. The lean clay decreased from 230 mg/m2∙s to 145 mg/m2∙s in Stage II, to 95 mg/m2∙s in Stage III, and to 25 mg/m2∙s in Stage IV. For both soils, the total water loss was found to be six times that under low demand.
Author Contributions
Funding
Acknowledgments
Conflicts of Interest
References
- Sauchyn, D.; Kennedy, S.; Stroich, J. Drought, climate change, and the risk of desertification on the Canadian prairies. Prairie Forum 2005, 30, 143–156. [Google Scholar]
- Joly, M. Prairie Prosperity, 1st ed.; Government of Canada: Ottawa, ON, Canada, 2020.
- Florinsky, I.V.; Eilers, R.G.; Wiebe, B.H.; Fitzgerald, M.M. Dynamics of soil salinity in the Canadian prairies: Application of singular spectrum analysis. Environ. Model. Softw. 2009, 24, 1182–1195. [Google Scholar] [CrossRef]
- Shuttleworth, W.J. Evaporation. In Handbook of Hydrology, 1st ed.; Maidment, D.R., Ed.; McGraw-Hill Inc.: New York, NY, USA, 1993; Volume 1, pp. 4.1–4.53. [Google Scholar]
- Kobayashi, T.; He, W.; Nagai, H. Mechanisms of evaporation from soil with a dry surface. Hydrol. Processes 1998, 12, 2185–2191. [Google Scholar] [CrossRef]
- Or, D.; Lehmann, P.; Shahraeeni, E.; Shokri, N. Advances in Soil Evaporation Physics-A Review. Vadose Zone J. 2013, 12, 1–16. [Google Scholar] [CrossRef]
- Shokri-Kuehni, S.M.S.; Rad, M.N.; Webb, C.; Shokri, N. Impact of type of salt and ambient conditions on saline water evaporation from porous media. Adv. Water Resour. 2017, 105, 154–161. [Google Scholar] [CrossRef]
- Spears, M.; Huntington, J.; Subhrendu, G. Improving Reservoir Evaporation Estimates; U.S. Department of the Interior, Bureau of Reclamation Research and Development Office: Denver, CO, USA, 2016; Volume 1, pp. 1–63.
- Khan, F.S.; Azam, S. Spatial variability in swelling of aggregated expansive clays. Innov. Infrastruct. Solut. 2016, 1, 1–6. [Google Scholar] [CrossRef]
- Wilson, G.W.; Fredlund, D.; Barbour, S. Coupled soil-atmosphere modelling for soil evaporation. Can. Geotech. J. 1994, 31, 151–161. [Google Scholar] [CrossRef]
- Staple, W. Evaporation from soil and vegetation. Neth. J. Agric. Sci. 1956, 4, 39–42. [Google Scholar] [CrossRef]
- Rahardjo, H.; Nio, A.S.; Harnas, F.R.; Leong, E. Comprehensive Instrumentation for Real Time Monitoring of Flux Boundary Conditions in Slope. Procedia Earth Planet. Sci. 2014, 9, 23–43. [Google Scholar] [CrossRef]
- Trautz, A.C.; Illangasekare, T.H.; Howington, S. Experimental Testing Scale Considerations for the Investigation of Bare-Soil Evaporation Dynamics in the Presence of Sustained Above-Ground Airflow. Water Resour. Res. 2018, 54, 8963–8982. [Google Scholar] [CrossRef]
- Suchan, J.; Azam, S. Influence of Desaturation and Shrinkage on Evaporative Flux from Soils. Geotechnics 2022, 2, 412–426. [Google Scholar] [CrossRef]
- Wilson, G.W.; Fredlund, D.G.; Barbour, S.L. The effect of soil suction on evaporative fluxes from soil surfaces. Can. Geotech. J. 1997, 34, 145–155. [Google Scholar] [CrossRef]
- Le Bray, Y.; Prat, M. Three-dimensional pore network simulation of drying in capillary porous media. Int. J. Heat Mass Transf. 1999, 42, 4207–4224. [Google Scholar] [CrossRef]
- An, N.; Tang, C.-S.; Xu, S.-K.; Gong, X.-P.; Shi, B.; Inyang, H.I. Effects of soil characteristics on moisture evaporation. Eng. Geol. 2018, 239, 126–135. [Google Scholar] [CrossRef]
- Lehmann, P.; Assouline, S.; Or, D. Characteristic lengths affecting evaporative drying of porous media. Phys. Rev. E 2008, 77, 056309. [Google Scholar] [CrossRef]
- Yiotis, A.G.; Tsimpanogiannis, I.N.; Stubos, A.K.; Yortsos, Y.C. Pore-network study of the characteristic periods in the drying of porous materials. J. Colloid Interface Sci. 2006, 297, 738–748. [Google Scholar] [CrossRef]
- Shahraeeni, E.; Lehmann, P.; Or, D. Coupling of evaporative fluxes from drying porous surfaces with air boundary lay-er: Characteristics of evaporation from discrete pores. Water Resour. Res. 2012, 48, W09525. [Google Scholar] [CrossRef]
- Gran, M.; Carrera, J.; Massana, J.; Saaltink, M.W.; Olivella, S.; Ayora, C.; Lloret, A. Dynamics of water vapor flux and water sepa-ration processes during evaporation from a salty dry soil. J. Hydrol. 2011, 396, 215–220. [Google Scholar] [CrossRef]
- Rad, M.N.; Shokri, N. Nonlinear effects of salt concentrations on evaporation from porous media. Geophys. Res. Lett. 2012, 39. [Google Scholar] [CrossRef]
- Mishra, P.N.; Scheuermann, A.; Bore, T.; Li, L. Salinity effects on soil shrinkage characteristic curves of fine-grained geomaterials. J. Rock Mech. Geotech. Eng. 2018, 11, 181–191. [Google Scholar] [CrossRef]
- Zhang, T.; Deng, Y.; Cui, Y.; Lan, H.; Zhang, F.; Zhang, H. Porewater salinity effect on flocculation and desiccation cracking behaviour of kaolin and bentonite considering working condition. Eng. Geol. 2019, 251, 11–23. [Google Scholar] [CrossRef]
- Ho, Y.A.; Pufahl, D.E. The effects of brine contamination on the properties of fine-grained soils. In Geotechnical Special Publication No. 13. Geotechnical Practice for Waste Disposal ’87; American Society of Civil Engineers: New York, NY, USA, 1987; pp. 547–561. [Google Scholar]
- Barbour, S.L.; Fredlund, D.G. Mechanisms of osmotic flow and volume change in clay soils. Can. Geotech. J. 1989, 26, 551–562. [Google Scholar] [CrossRef]
- Azam, S.; Khan, F. Geohydrological properties of selected badland sediments in Saskatchewan, Canada. Bull. Eng. Geol. Environ. 2013, 73, 389–399. [Google Scholar] [CrossRef]
- Paranthaman, R.; Azam, S. Effect of compaction on desiccation and consolidation behavior of clay tills. Innov. Infrastruct. Solutions 2021, 7, 1–8. [Google Scholar] [CrossRef]
- Khan, F. Engineering Properties of Badlands in Semi-Arid Regions; University of Regina: Regina, SK, Canada, 2012. [Google Scholar]
- Paranthaman, R.; Azam, S. Effect of Composition on Engineering Behavior of Clay Tills. Geosciences 2021, 11, 427. [Google Scholar] [CrossRef]
- Smith, J.L.; Doran, J.W. Measurement and use of pH and electrical conductivity for soil quality analysis. Methods Assess. Soil Qual. 1997, 49, 169–182. [Google Scholar]
- Mishra, P.N.; Scheuermann, A.; Li, L. Significance of Corrections and Impact of Saline Pore Fluid on Kaolin. J. Mater. Civ. Eng. 2018, 30, 06018016. [Google Scholar] [CrossRef]
- Suchan, J.; Azam, S. Controlled photogrammetry system for determination of volume and surface features in soils. MethodsX 2021, 8, 101368. [Google Scholar] [CrossRef]
- Suchan, J.; Azam, S. Determination of Evaporative Fluxes Using a Bench-Scale Atmosphere Simulator. Water 2021, 13, 84. [Google Scholar] [CrossRef]
- Suchan, J.; Azam, S. Development of BAS2 for determination of evaporative fluxes. MethodsX 2021, 8, 101424. [Google Scholar] [CrossRef]
- Suchan, J.; Azam, S. Effect of Salinity on Evaporation from Water Surface in Bench-Scale Testing. Water 2021, 13, 2067. [Google Scholar] [CrossRef]
- Suits, L.D.; Sheahan, T.; Leong, E.; He, L.; Rahardjo, H. Factors Affecting the Filter Paper Method for Total and Matric Suction Measurements. Geotech. Test. J. 2002, 25, 8198. [Google Scholar] [CrossRef]
- Greacen, E.L.; Walker, G.R.; Cook, P.G. Procedure for Filter Paper Method of Measuring Soil Water Suction; CSIRO Division of Soils: Adelaide, Australia, 1987. [Google Scholar]
- Kim, H.; Prezzi, M.; Salgado, R. Calibration of whatman grade 42 filter paper for soil suction measurement. Can. J. Soil Sci. 2016, 97, 93–98. [Google Scholar] [CrossRef]
- Bulut, R.; Leong, E.C. Indirect measurement of suction. Geotech. Geol. Eng. 2008, 26, 633–644. [Google Scholar] [CrossRef]
- Narashimha Rao, S.; Mathew, P.K. Effects of exchangeable cations on hydraulic conductivity of a marine clay. Clays Clay Miner. 1995, 43, 433–437. [Google Scholar]
- Jambhekar, V.; Helmig, R.; Schroder, N.; Shokri, N. Free-Flow–Porous-Media Coupling for Evaporation-Driven Transport and Precipitation of Salt in Soil. Transp. Porous Media 2015, 110, 251–280. [Google Scholar] [CrossRef]
- Peng, X.; Horn, R.; Deery, D.; Kirkham, M.B.; Blackwell, J. Influence of soil structure on the shrinkage behaviour of a soil irrigated with saline—sodic water. Soil Res. 2005, 43, 555–563. [Google Scholar] [CrossRef]
- Mishra, P.N.; Liu, A.; Bore, T.; Scheuermann, A.; Li, L. Impact of pore fluid salinity on progressive volume change be-havior of kaolin. In Proceedings of the 7th International Conference on Unsaturated Soils (UNSAT-2018), Hong Kong, 3–5 August 2018. [Google Scholar]
- Nachshon, U.; Weisbrod, N.; Dragila, M.I.; Grader, A. Combined evaporation and salt precipitation in homogeneous and heterogeneous porous media. Water Resour. Res. 2011, 47, W03513. [Google Scholar] [CrossRef]
- Dunmola, A.S. Predicting Evaporative Fluxes in Saline Soil and Surface-Deposited Thickened Mine Tailings. Ph.D. Thesis, Carleton University, Ottawa, ON, Canada, 2018. [Google Scholar]
- Yao, C.; Wei, C.; Ma, T.; Chen, P.; Tian, H. Experimental Investigation on the Influence of Thermochemical Effect on the Pore–Water Status in Expansive Soil. Int. J. Géoméch. 2021, 21, 04021080. [Google Scholar] [CrossRef]
- Shokri-Kuehni, S.M.S.; Vetter, T.; Webb, C.; Shokri, N. New insights into saline water evaporation from porous media: Complex interaction between evaporation rates, precipitation, and surface temperature. Geophys. Res. Lett. 2017, 44, 5504–5510. [Google Scholar] [CrossRef] [Green Version]


| Material Property | ASTM * | Silty Sand | Lean Clay | ||
|---|---|---|---|---|---|
| Water ** | Saline | Water * | Saline | ||
| Pore Fluid | |||||
| Dissolved NaCl (ppm) | <10 | 5500 | <10 | 5500 | |
| Fluid Density at 20 °C (g∙cm−3) | 0.998 | 1.002 | 0.998 | 1.002 | |
| Soil | |||||
| (%) | D4318-17e1 | 27 | 24 | 32 | 29 |
| (%) | D4318-17e1 | 25 | 23 | 18 | 16 |
| (%) | [24] | - | - | 14 | 13 |
| Parameter | Unit | Symbol | Silty Sand | Lean Clay | ||
|---|---|---|---|---|---|---|
| Low Demand | High Demand | Low Demand | High Demand | |||
| Data Point Count | n | 9410 | 2161 | 10,404 | 2161 | |
| Air Velocity | m/s | <0.1 | 1.3 | <0.1 | 1.3 | |
| Air Pressure | Pa | 94,752 | 93,760 | 94,762 | 95,055 | |
| Relative Humidity | % | 32.0 | 55.5 | 23.5 | 55.2 | |
| Air Temperature | °C | 19.9 | 19.0 | 21.5 | 19.0 | |
| Shortwave Flux (↓) * | W/m2 | 0 | 325 | 0 | 325 | |
| Shortwave Flux (↑) ** | W/m2 | 0 | 1 | 0 | 1 | |
| Soil Temperature | °C | - | 22.1 | - | 22.0 | |
Publisher’s Note: MDPI stays neutral with regard to jurisdictional claims in published maps and institutional affiliations. |
© 2022 by the authors. Licensee MDPI, Basel, Switzerland. This article is an open access article distributed under the terms and conditions of the Creative Commons Attribution (CC BY) license (https://creativecommons.org/licenses/by/4.0/).
Share and Cite
Suchan, J.; Azam, S. Influence of Saline Pore Fluid on Soil Behavior during Evaporation. Geotechnics 2022, 2, 754-764. https://doi.org/10.3390/geotechnics2030036
Suchan J, Azam S. Influence of Saline Pore Fluid on Soil Behavior during Evaporation. Geotechnics. 2022; 2(3):754-764. https://doi.org/10.3390/geotechnics2030036
Chicago/Turabian StyleSuchan, Jared, and Shahid Azam. 2022. "Influence of Saline Pore Fluid on Soil Behavior during Evaporation" Geotechnics 2, no. 3: 754-764. https://doi.org/10.3390/geotechnics2030036
APA StyleSuchan, J., & Azam, S. (2022). Influence of Saline Pore Fluid on Soil Behavior during Evaporation. Geotechnics, 2(3), 754-764. https://doi.org/10.3390/geotechnics2030036