1. Introduction
Mining activities change the stress equilibrium in the underground rock mass by applying induced stress on the mining abutment rock mass. Seismic events, rockbursts, and bumps are the rock mass response to gain back its equilibrium in deep underground excavations [
1]. The stability of the excavation can be increased through continuous monitoring of the induced stress and mitigating the potential of rockburst occurrence. Variations of the applied stress in the underground rock mass can be investigated based on the variations in seismic wave velocity propagations, which technically are velocities of compressive (Vp) and shear body (Vs) waves passing through rocks [
2]. Experiments on rock samples showed a correlation between applied stress and P-wave velocity [
3,
4]. Additionally, field studies found that the seismic velocity of the area is relatively high in encompassing rock mass when major seismic events occur [
5,
6,
7,
8,
9]. Seismic energy, which is propagated as waves, is received by sensors, such as geophones, in different locations [
10]. Passive seismic tomography is a technique through which the seismic wave velocity in the underground can be modeled and its changes can be monitored, providing a method for improved understanding of induced stress distribution throughout a volumetric portion of a rock mass [
11,
12].
Usually, rockbursts are accompanied by several smaller seismic events, which can be detected by seismic monitoring networks [
5]. Major seismic events have been monitored in deep mines with regional mine seismic networks for many years [
8,
9,
13]. In some cases, it was observed that the seismicity in the underground rock mass increases prior to occurrence of rockburst, however not all rockbursts are associated with minor seismic events prior to the occurrence of the burst [
14]. The moment magnitude of rockbursts differs from 3 to 5 while major seismic events usually have moment magnitude between 1 and 3 [
15,
16]. A mine-scale seismic monitoring system, called a microseismic system, includes geophones encompassing the mining excavation and can record the seismic waves propagated from any seismic event even if they are as minor as −2 Mw [
15,
17]. Regional seismic systems were first applied in coal mines to calculate the locations of seismic events based on the travel time of the recorded seismic waves [
13].
The seismic velocity in a specified volume in the rock mass, called a voxel, can be estimated with passive seismic tomography based on the travel time of the recorded seismic rays [
8,
9,
12]. This method has been applied in longwall coal mining to monitor the seismic velocity changes correlated to variations of induced stress during the mining operations [
5,
18]. Additionally, the characteristics of petroleum reservoirs due to the fracturing procedure were monitored by passive seismic systems [
10,
11,
12,
13,
14,
15,
16,
17,
18,
19,
20,
21,
22]. Later it was applied in deep hard rock mines to identify the highly stressed areas and monitor the corresponding induced stress redistribution [
6,
23,
24,
25]. Passive seismic tomography has also been used to evaluate the stress change associated with damaged zones surrounding underground tunnels [
7].
As experienced in laboratory experiments on rock samples, the seismic body wave velocity increases correlated with the increase in compressive stress [
26]. This increase in seismic velocity continues until crack formation and propagation are in progress before the applied stress reaches to its peak. When the cracks merge and the dilation begins, the body wave velocity slightly decreases. After this point, the body wave velocity increases again in parallel to the loading direction [
4]. Beyond this mechanism relating changing stress levels to changing seismic body wave velocity, the stress path may also cause a change to body wave velocity. As an example, if a portion of a stressed rock mass is unloaded then fractures could form due to this destressing and the resulting fractures could then cause a related velocity reduction which occurs without the rockmass having approached its peak strength.
At the field scale, the seismic velocity increases by increasing the depth or by increased induced stress, such as due to mining activity [
8,
27]. It was observed that there are areas with higher seismic velocity than the average seismic velocity of the rock mass at a particular depth, the locations of these high-velocity zones are in the vicinity of the mining locations and have high seismicity [
5,
6,
27].
In this study, we investigated the daily changes in the seismic velocity of the rock mass prior to the occurrence of major seismic events in two active mining sections at a narrow-vein mine. Our hypothesis was to observe stress within the rock mass due to accumulation of the induced stress in the area. Therefore, the velocity near the subsequent hypocenter might increase in the days before the occurrence of the major seismic event. This hypothesis was investigated by evaluating the daily changes of high-velocity zones in the vicinity of the hypocenters before the events occurred. The seismic record of the mine during a year of operation showed five major events with a released energy of at least 2400 kJ and a magnitude of at least 1.4. Passive seismic tomography was used to analyze the daily seismic velocity difference in the surrounding rock mass within a week of the occurrence of the major seismic events.
Additionally, in order to consider the mining advance rate, the impact of blasting on three of the events in one of the mining sections was explored as well. Prior studies have shown that an increased amount of mining has been correlated to an increased level of seismicity [
28,
29]. Further, the mine blasts may also correlate to induced seismicity as the blast provides a dynamic load that can, in addition to the existing abutment load, cause the total induced stress to exceed the structural strength of the rockmass. The goal of this study was to evaluate if there is any observable change in the distribution of seismic velocity of the surrounding rock prior to the occurrence of major seismic events.
2. Data and Methodology
This study was based on the data of a mine located in the western USA, along a silver-rich belt including several silver veins with lead and copper byproducts [
30]. The active mining sections studied in this research are along this belt, and the dominant faults in the mining area strike WNW. The narrow veins, with an average width of two to three meters, include the ore contained in the shear zones in between the faults. The veins are steeply dipping with various extensions from 90 m to 900 m [
29]. The mining area includes a variety of weak to high-strength rocks with anisotropy in the direction of the steep bedding planes [
31,
32].
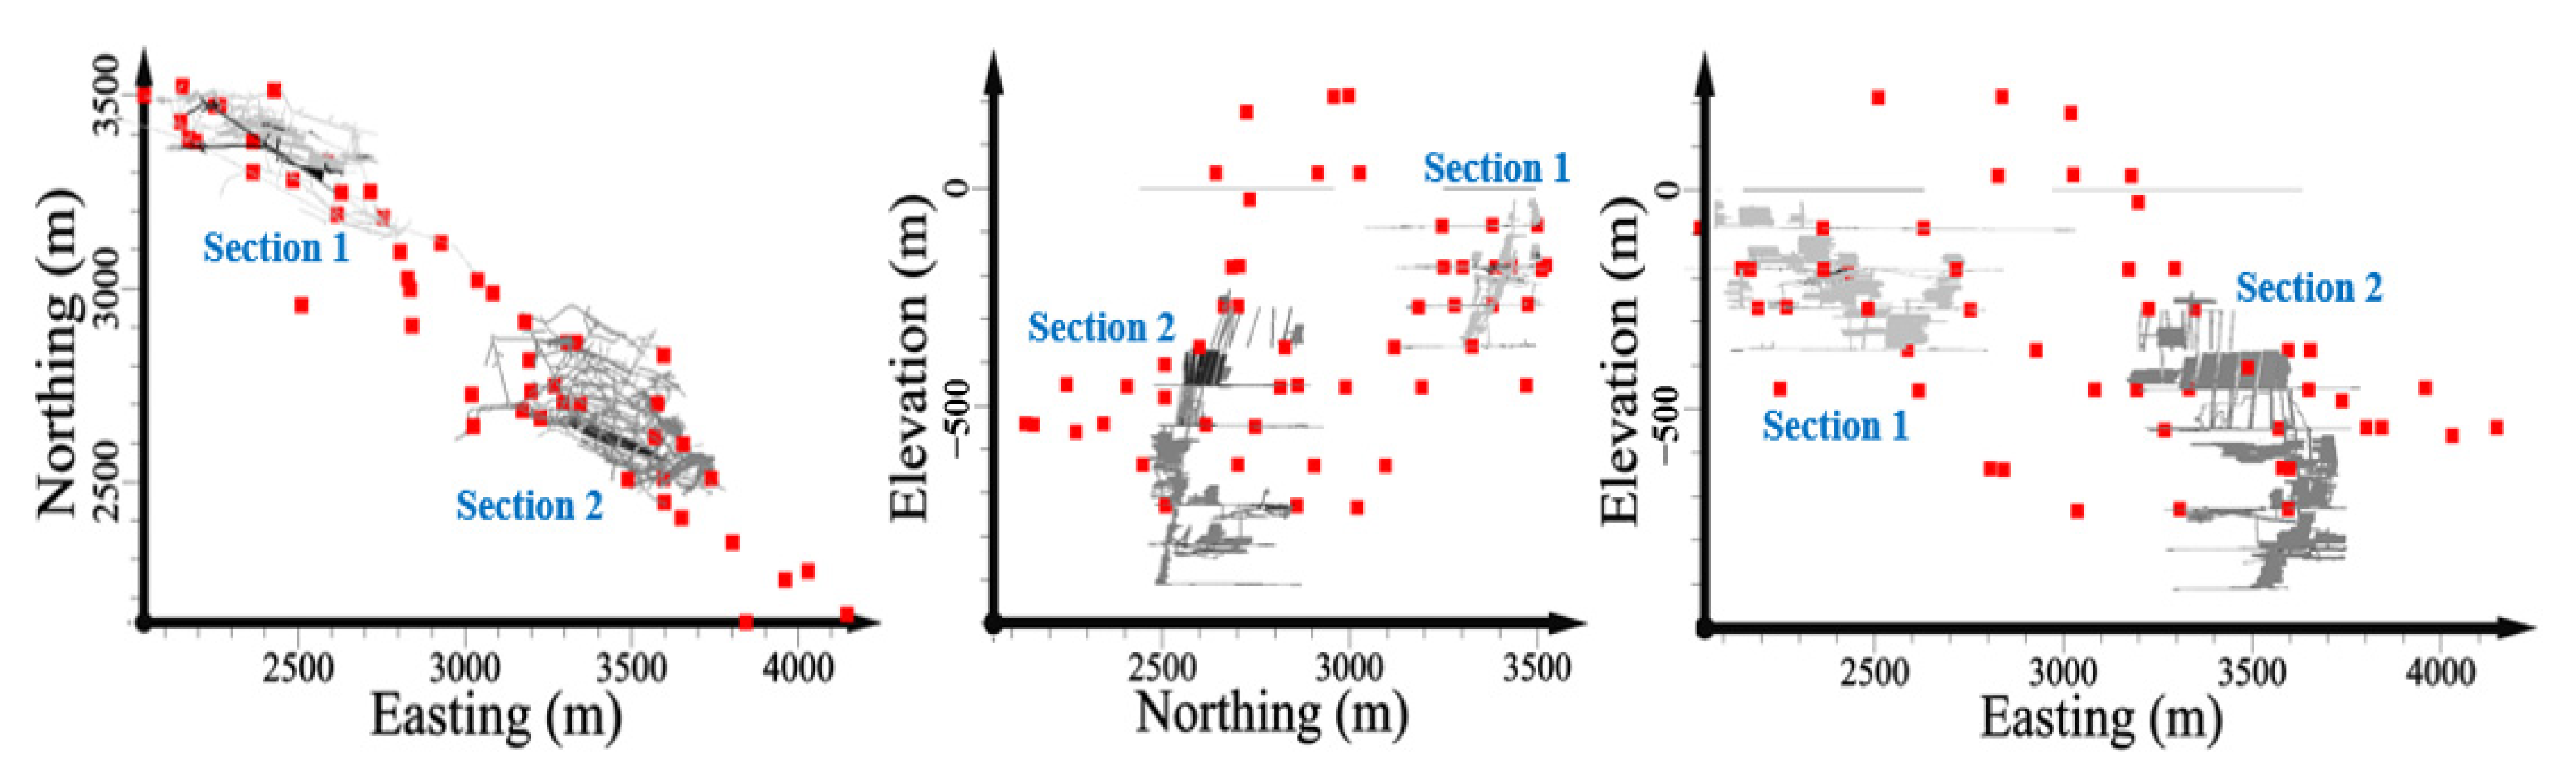
The data for this study was recorded by an ESG Paladin data acquisition system comprised of 50 mounted sensors in a narrow-vein mine with two active mining sections. The installed sensors consist of uniaxial accelerometers and triaxial geophones [
33]. The mine openings and location of sensors installed in this mine are as shown in
Figure 1; the uniaxial and triaxial sensors are not differentiated since only P-wave arrival times were used in the present study and those are not significantly different for the two types of sensor. The seismicity in the two active mining areas during a year were analyzed separately. Seismic velocity tomography was used to investigate the rock mass behavior in these two active mining sections.
During a year of seismic monitoring, more than 12,000 seismic events were located in Mining Section 1 through more than 132,000 recorded seismic rays. This number is higher in Mining Section 2 with more than 16,000 located seismic events through 172,000 recorded rays in a year. The average, background velocity in both sections is 5740 m/s.
The events with the highest released energy, which have relatively high moment magnitude, were chosen as the major seismic events. Five major seismic events were observed in the year of study.
Figure 2 shows the cumulative energy and moment magnitude of all of the recorded events in both mining sections. The five major seismic events are marked in
Figure 2. The event’s labels are based on the mining section number followed by the event number in order, for example, Event 1-2 is the second event in Mining Section 1. The moment magnitudes are 1.62, 1.81, 1.75, 1.48 and 1.76 for Events 1-1, 1-2, 1-3, 2-1 and 2-2, respectively. The source locations of the events and their magnitude and corresponding released energy were computed by ESG’s Windows-based Hyperion Seismic Software (HSS) Suite based on P-wave and S-wave arrival times.
As shown in
Table 1, the moment magnitudes of each of the five events is more than 1.4. The S-wave released energy of the two major events at Mining Section 2 is relatively much higher than their P-wave released energy, indicating that these two events are fault-slip events. The lower energy ratio of shear wave to compressive wave (Es/Ep) in Mining Section 1 can possibly be an indicator of the failure of rock bridges along existing discontinuities in this area rather than fault-slip with asperities.
The passive seismic tomography method was used to calculate the velocity of the rock mass adjacent to active mining areas. The average velocity of each voxel was calculated during the different time periods, such as 7 days or 24 h. The accuracy of the calculation depends on the number of recorded seismic rays passing through each voxel during a particular period. Therefore, larger voxels or larger timespans will include more raypaths and will thus be more reliable and accurate. However, if the voxel size is too large then the results will be overly smoothed. In this study, seven-day and six-day time spans were considered to have adequate ray coverage. The subtraction of two time spans, one of which included an additional day, provided the seismic variations on a daily basis. “Velocity difference” is defined as the difference in the seismic velocity of the two time spans with one overlapping day. In this study, for every day within a week of the occurrence of each event, the seven-day and six-day time spans were calculated and their average velocities were subtracted. The result was the velocity difference on a daily basis for the week prior to a major seismic event.
The daily velocity differences were graphed in three dimensions and compared with the blasting rate per day. The seismic tomography was based on the Simultaneous Iterative Reconstruction Technique (SIRT) algorithm [
34] which computes the total number of rays passing through each voxel through several iterations. The curved raypaths were calculated using the Fast Marching Method. A voxel size of 29 m per side was chosen to provide good raypath coverage in the areas of interest and the velocity of each voxel was computed iteratively. The root mean square of the difference between the calculated and measured travel times was found for each iteration. The elbow method was used to define the optimum number of iterations for the most accurate calculated velocities without overfitting the data [
35]; in this study, the results at iteration number 10 were used. The tomograms were calculated in three dimensions.
The boundary which confines the voxels with an adequate number of rays is considered as the “boundary of confidence”. For these results the boundary of confidence was measured as 10 rays per voxel. This means that voxels within this boundary had at least 10 rays and their computed average velocity had an error of less than the residual at the optimum iteration.
3. Blasting
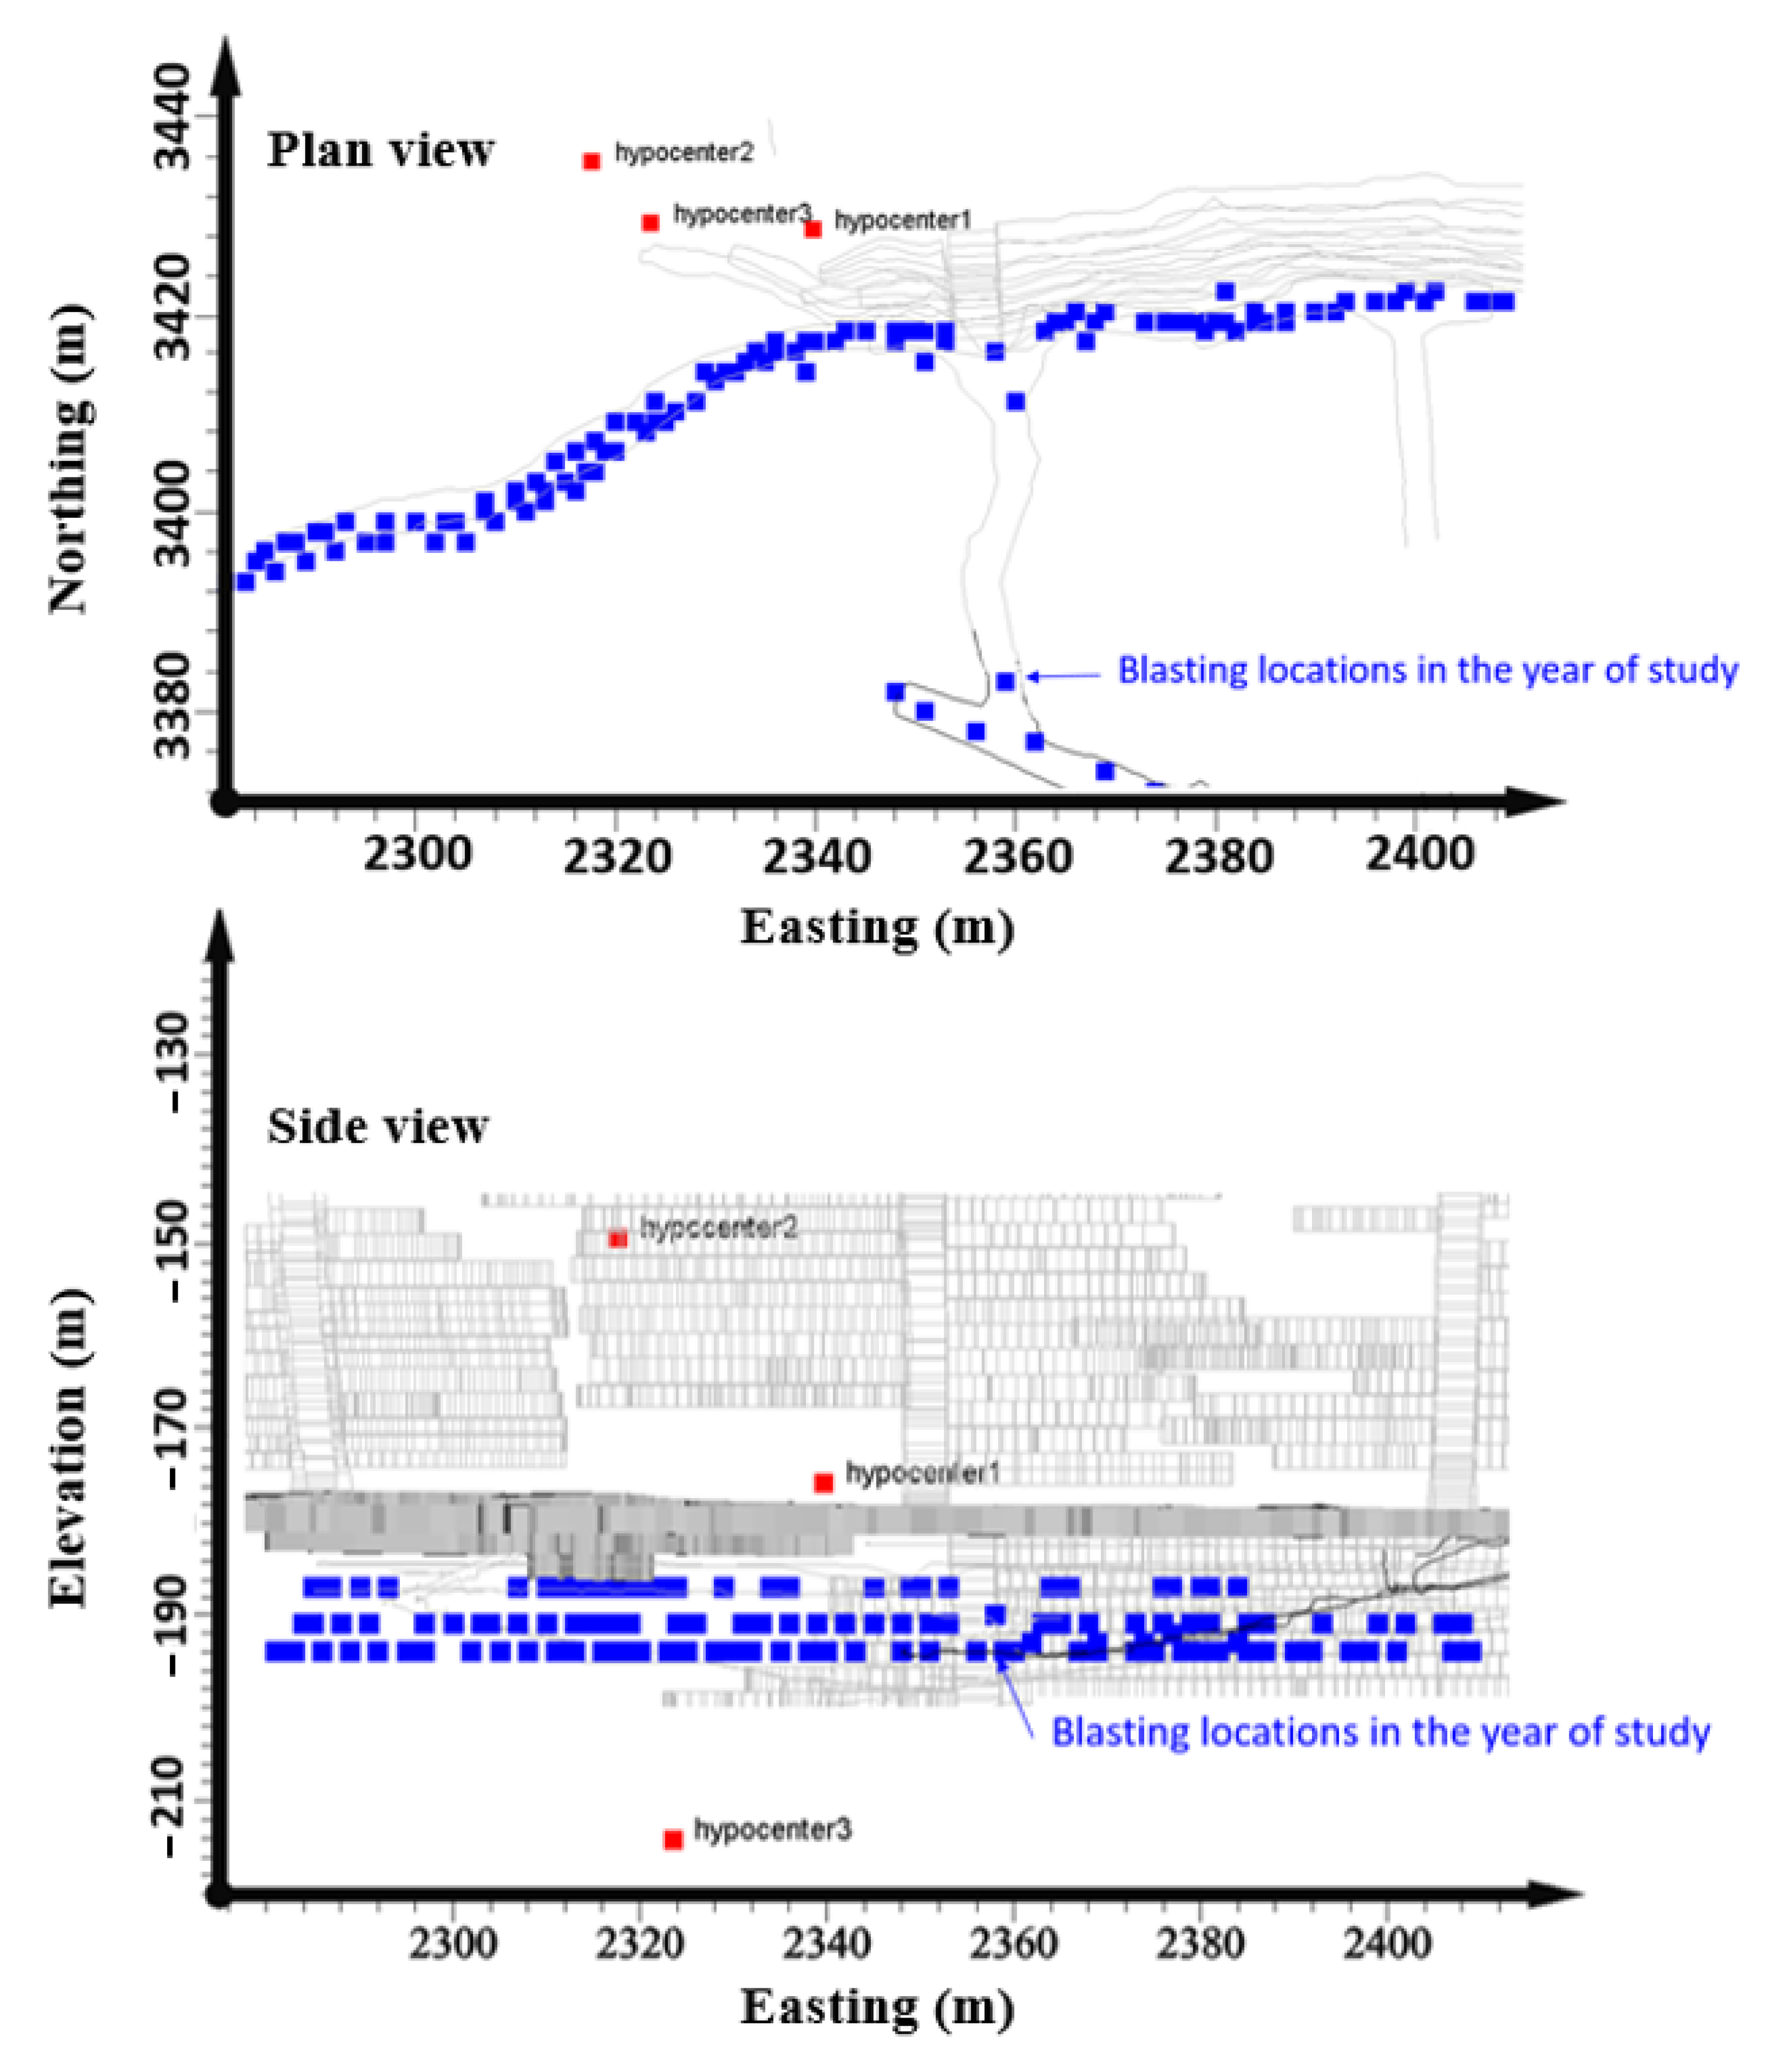
Blast frequency and location was included in the study in order to determine whether the rate of blasting was correlated to changes in P-wave velocity within the rockmass, or if the blasts triggered the major seismic events. The time and location of blasts in Mining Section 1 were provided by the mine site, and the number of blasts per day was considered as a possible influencing factor on the velocity distribution. The maximum of two blasts per day started in the third quarter in the year of production. Two of the major seismic events occurred at this quarter. There is no blasting within days 130 to 178. The average advance rate of the year of study including the no-blast period is 1.7 m per day.
Considering that the blasts within a week of occurrence of each event had the most influence on the surrounding rock mass behavior, the number of blasts in seven days prior to each major event are summarized in
Table 2. There were at least three blasts within a week of occurrence of all three events. For example, “Day 0” is the day of the event and for Events 1 and 3 there are one and two blasts in each, respectively.
Figure 3 shows the spacing of the blasts in the plan view and side view. It is observed that the blasts were in three different mining levels and proceeded from the highest level to the lowest.
4. Results
An increase in stress in the rock mass prior to occurrence of the major seismic events was anticipated according to the hypothesis of this study. This correlation is expected due to two potential mechanisms: the abutment loading could result in stresses that exceed the strength of the rockmass structure and/or the dynamic load from blasting could trigger a critically loaded portion of the rockmass. Therefore, the changes of high velocity zones were investigated. The minimum difference between the measured velocity by sensors and the calculated velocities by the SIRT tomography algorithm obtained at the 10th iteration for both mining sections showed a residual of less than 0.1 s. The tomograms of daily velocity difference for all five events were calculated.
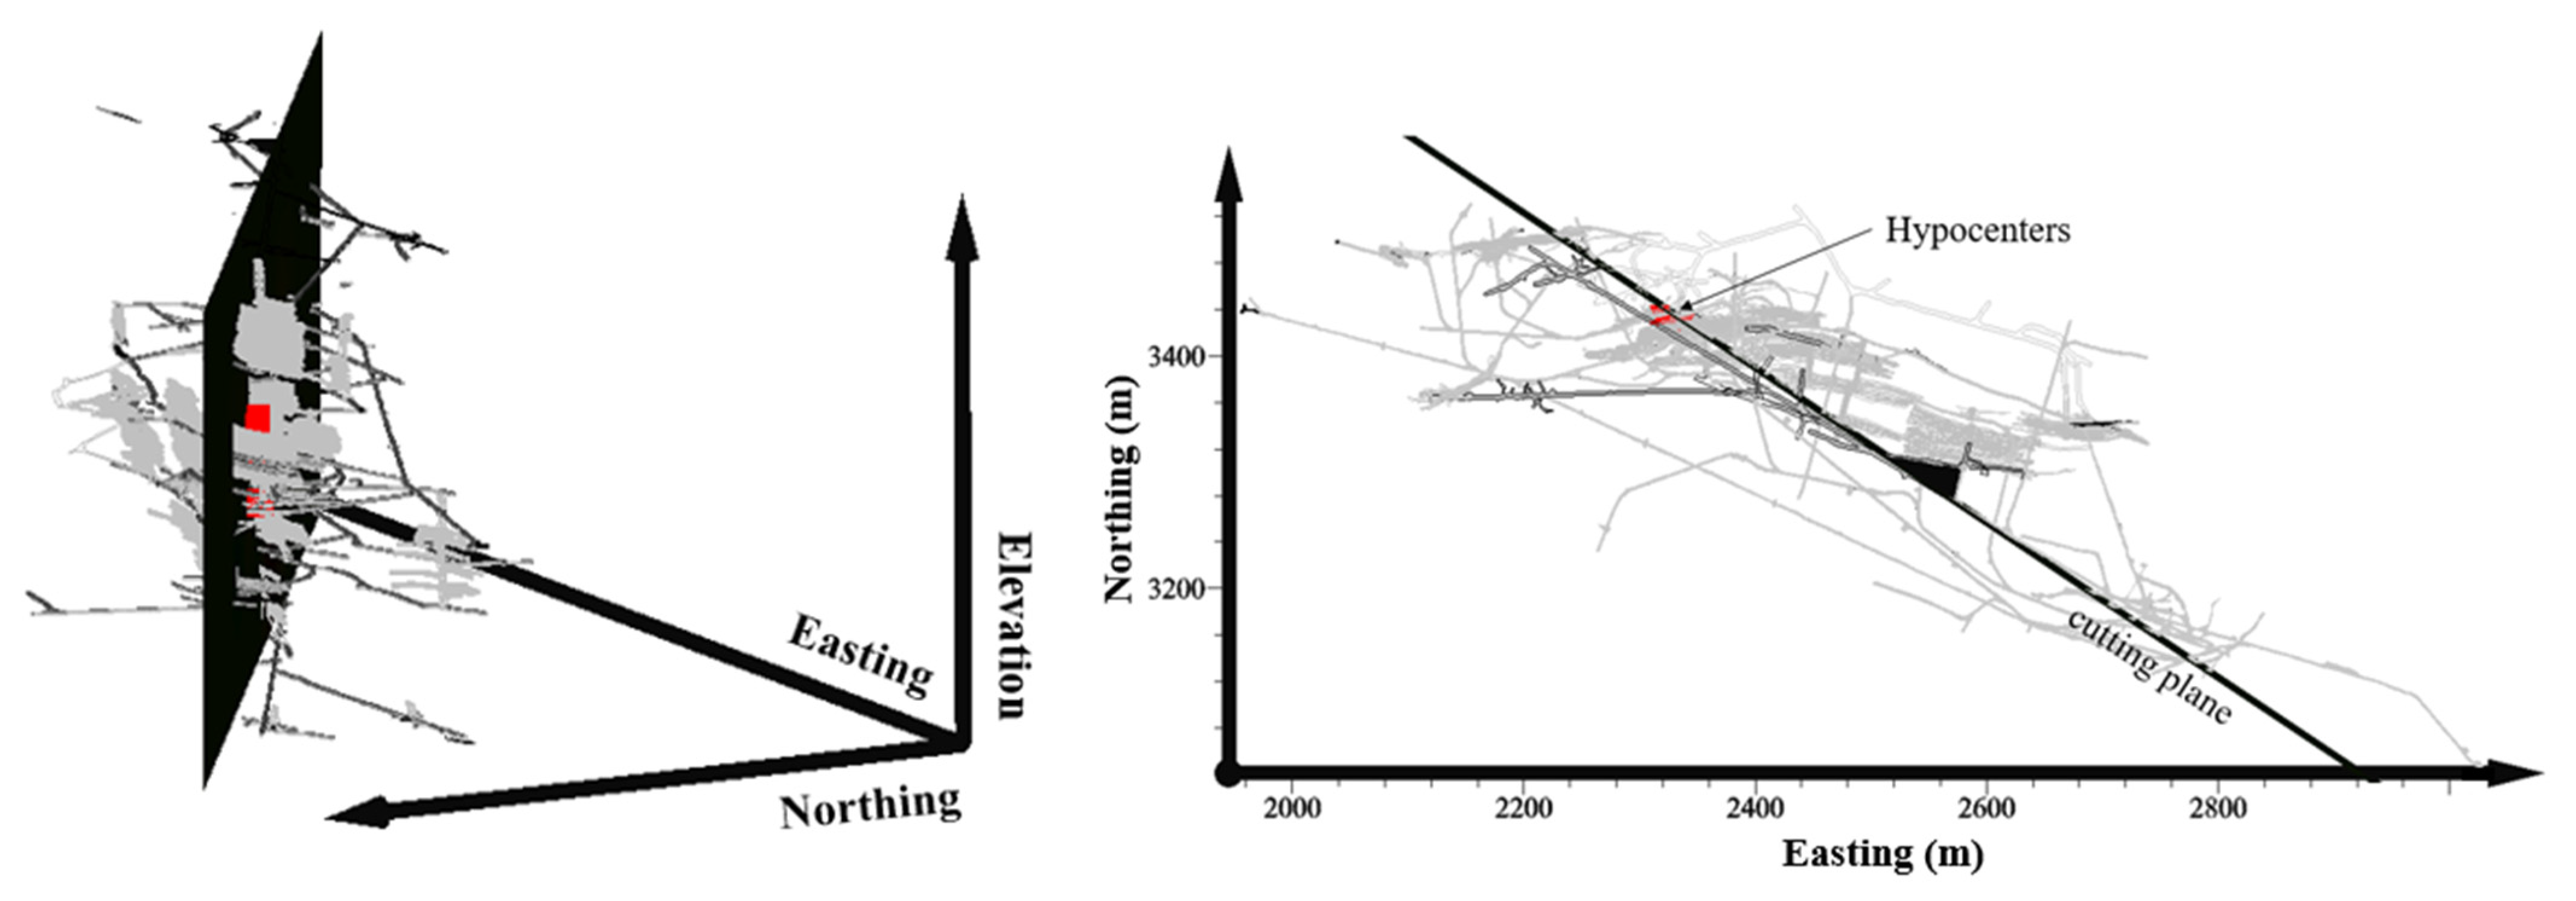
Figure 4 and
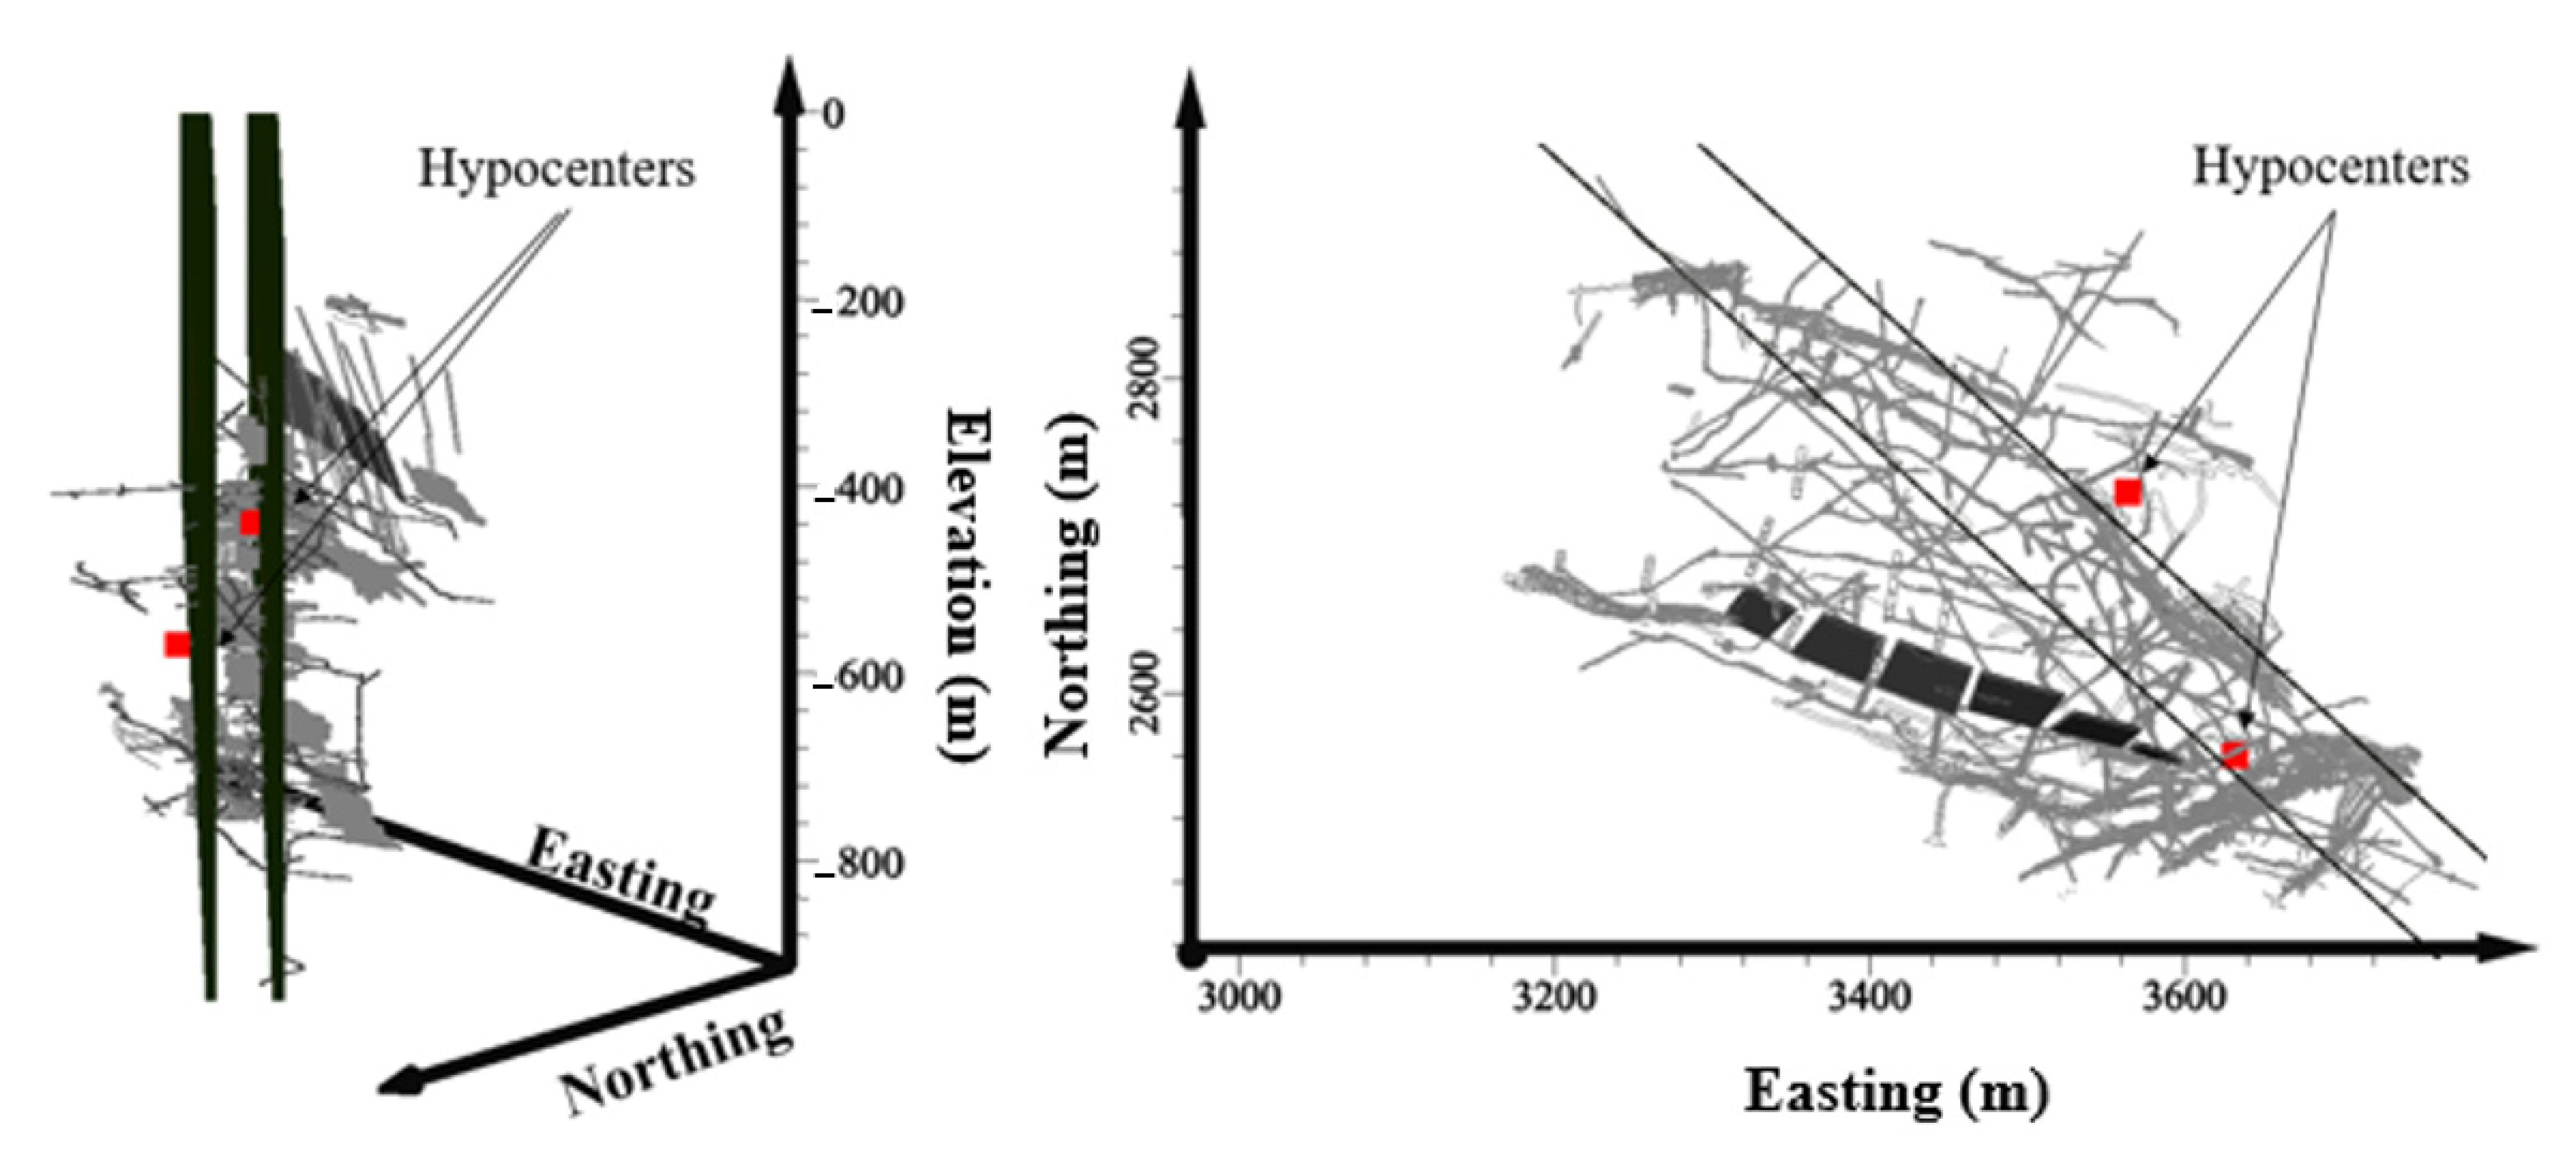
Figure 5 show the vertical cutting section chosen for Mining Sections 1 and 2, respectively, perpendicular to the main vein. The Euclidian distance between the hypocenter of the major events and their cutting section is less than 10 m. As the distance between Events 1 and 2 in Mining Section 2 is 195 m, two parallel cross-sections are considered for displaying the seismic velocity at these events.
Figure 5 shows these two cutting planes intercepting the mine opening in Mining Section 2. The planes are vertical and trend northeast; there is a 60 m distance between these two parallel planes.
The daily velocity differences for the events that occurred at Mining Section 1 were compared at the cutting sections within a week prior to each event. The boundary of the 10-rays-per-voxel for the accuracy of the calculations was provided as well. The blasting locations for this mining section were recorded and provided by the mine engineers. The same comparison was planned for Mining Section 2, however the locations and times of the blasts in this section were not available. The tomographic images of velocity differences in a week prior to an event, combined with the blasting locations in each day and the boundary of confidence of 10 rays per voxel, are shown in
Figure 6,
Figure 7 and
Figure 8 for Mining Section 1, and in
Figure 9 and
Figure 10 for Mining Section 2. As the locations of the blasting in Mining Section 2 were not provided, these images do not include the blasting data. The mine openings are shown as light gray lines.
5. Observations and Discussions
Passive seismic tomography was used to calculate the velocity of different voxels within a rock mass in a given time period. The behavior of the rock mass prior to the occurrence of five major mining-induced seismic events was investigated on a daily basis for a week prior to each event. The results (shown in
Figure 6,
Figure 7,
Figure 8,
Figure 9 and
Figure 10) include regions of relatively high confidence, having at least 10 rays per voxel and outlined in black on the figures. It is noted that results are plotted throughout the monitored area even though they may not be close to the microseismic source and may not reflect the changes in the stress state at the location of the major seismic event.
The daily change in velocity showed that for three of the five major seismic events an increase in seismic velocity difference of the rock mass near the event occurred at “Day 0”, which is the day of the event; in other words, the major seismic event resulted in an observable change to the velocity distribution within the rock mass. Considering each of the five major seismic events individually:
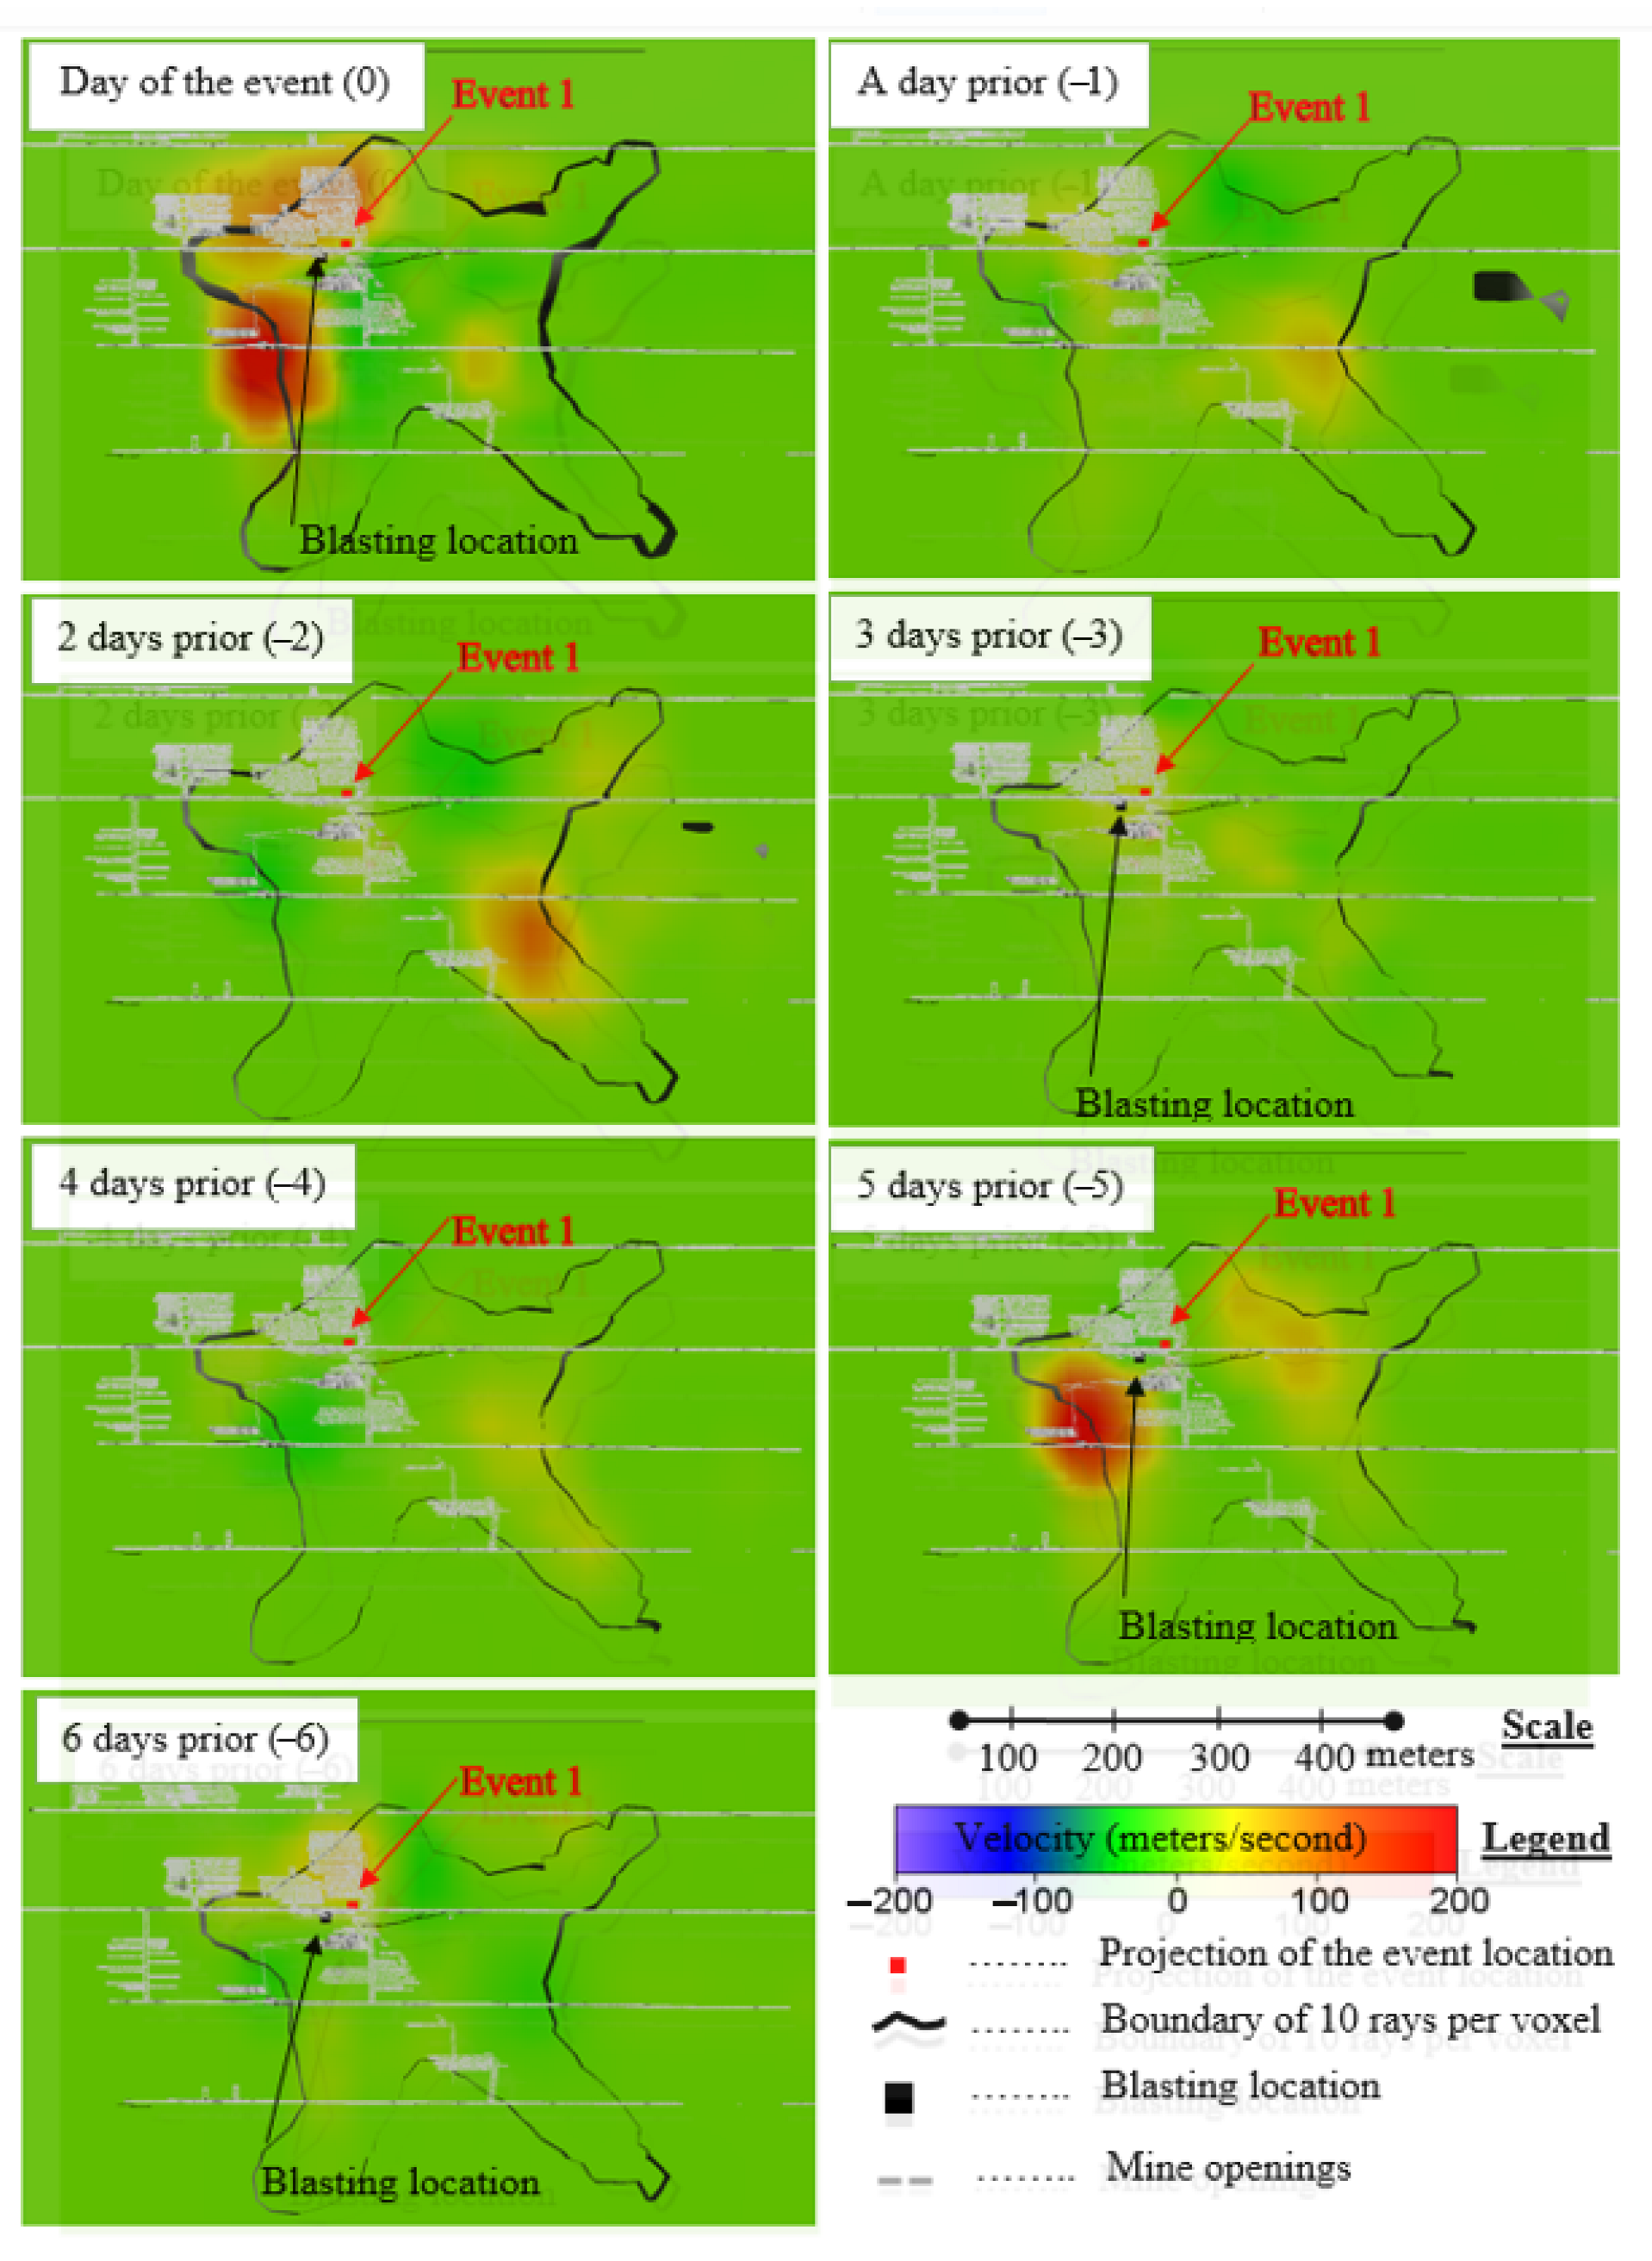
For Event 1 in Mining Section 1 the greatest velocity change was observed on the day of the event, termed “Day 0”. The only other significant change in the velocity was seen on “Day −5” which is possibly due to two consecutive days with blasts.
Significant changes in the seismic velocity were observed for Event 2 in Mining Section 1 on “Day 0” and the velocity difference at “Day 0” is more than 1% within 200 m of the hypocenter of event. A possible dilation is observed due to formation of low velocity zones in “Day −1” and “Day 0”. The High velocity zones observed on “Day −2” are potentially due to blasting on 3 and 4 days prior, however, no high velocity zone can be related to the blast on “Day −1”.
There was no significant change on the day of Event 3 in Mining Section 1. Subtle high velocity changes of about 1% within 200 m of the hypocenter of the event was observed from “Day −5” to “Day −2” and a possible dilation is observed from “Day −2” onwards. The high velocity observed on “Day −3” is potentially due to consecutive blasting on three days prior, however no significant changes were observed due to blasts on “Day −1” and “Day 0”.
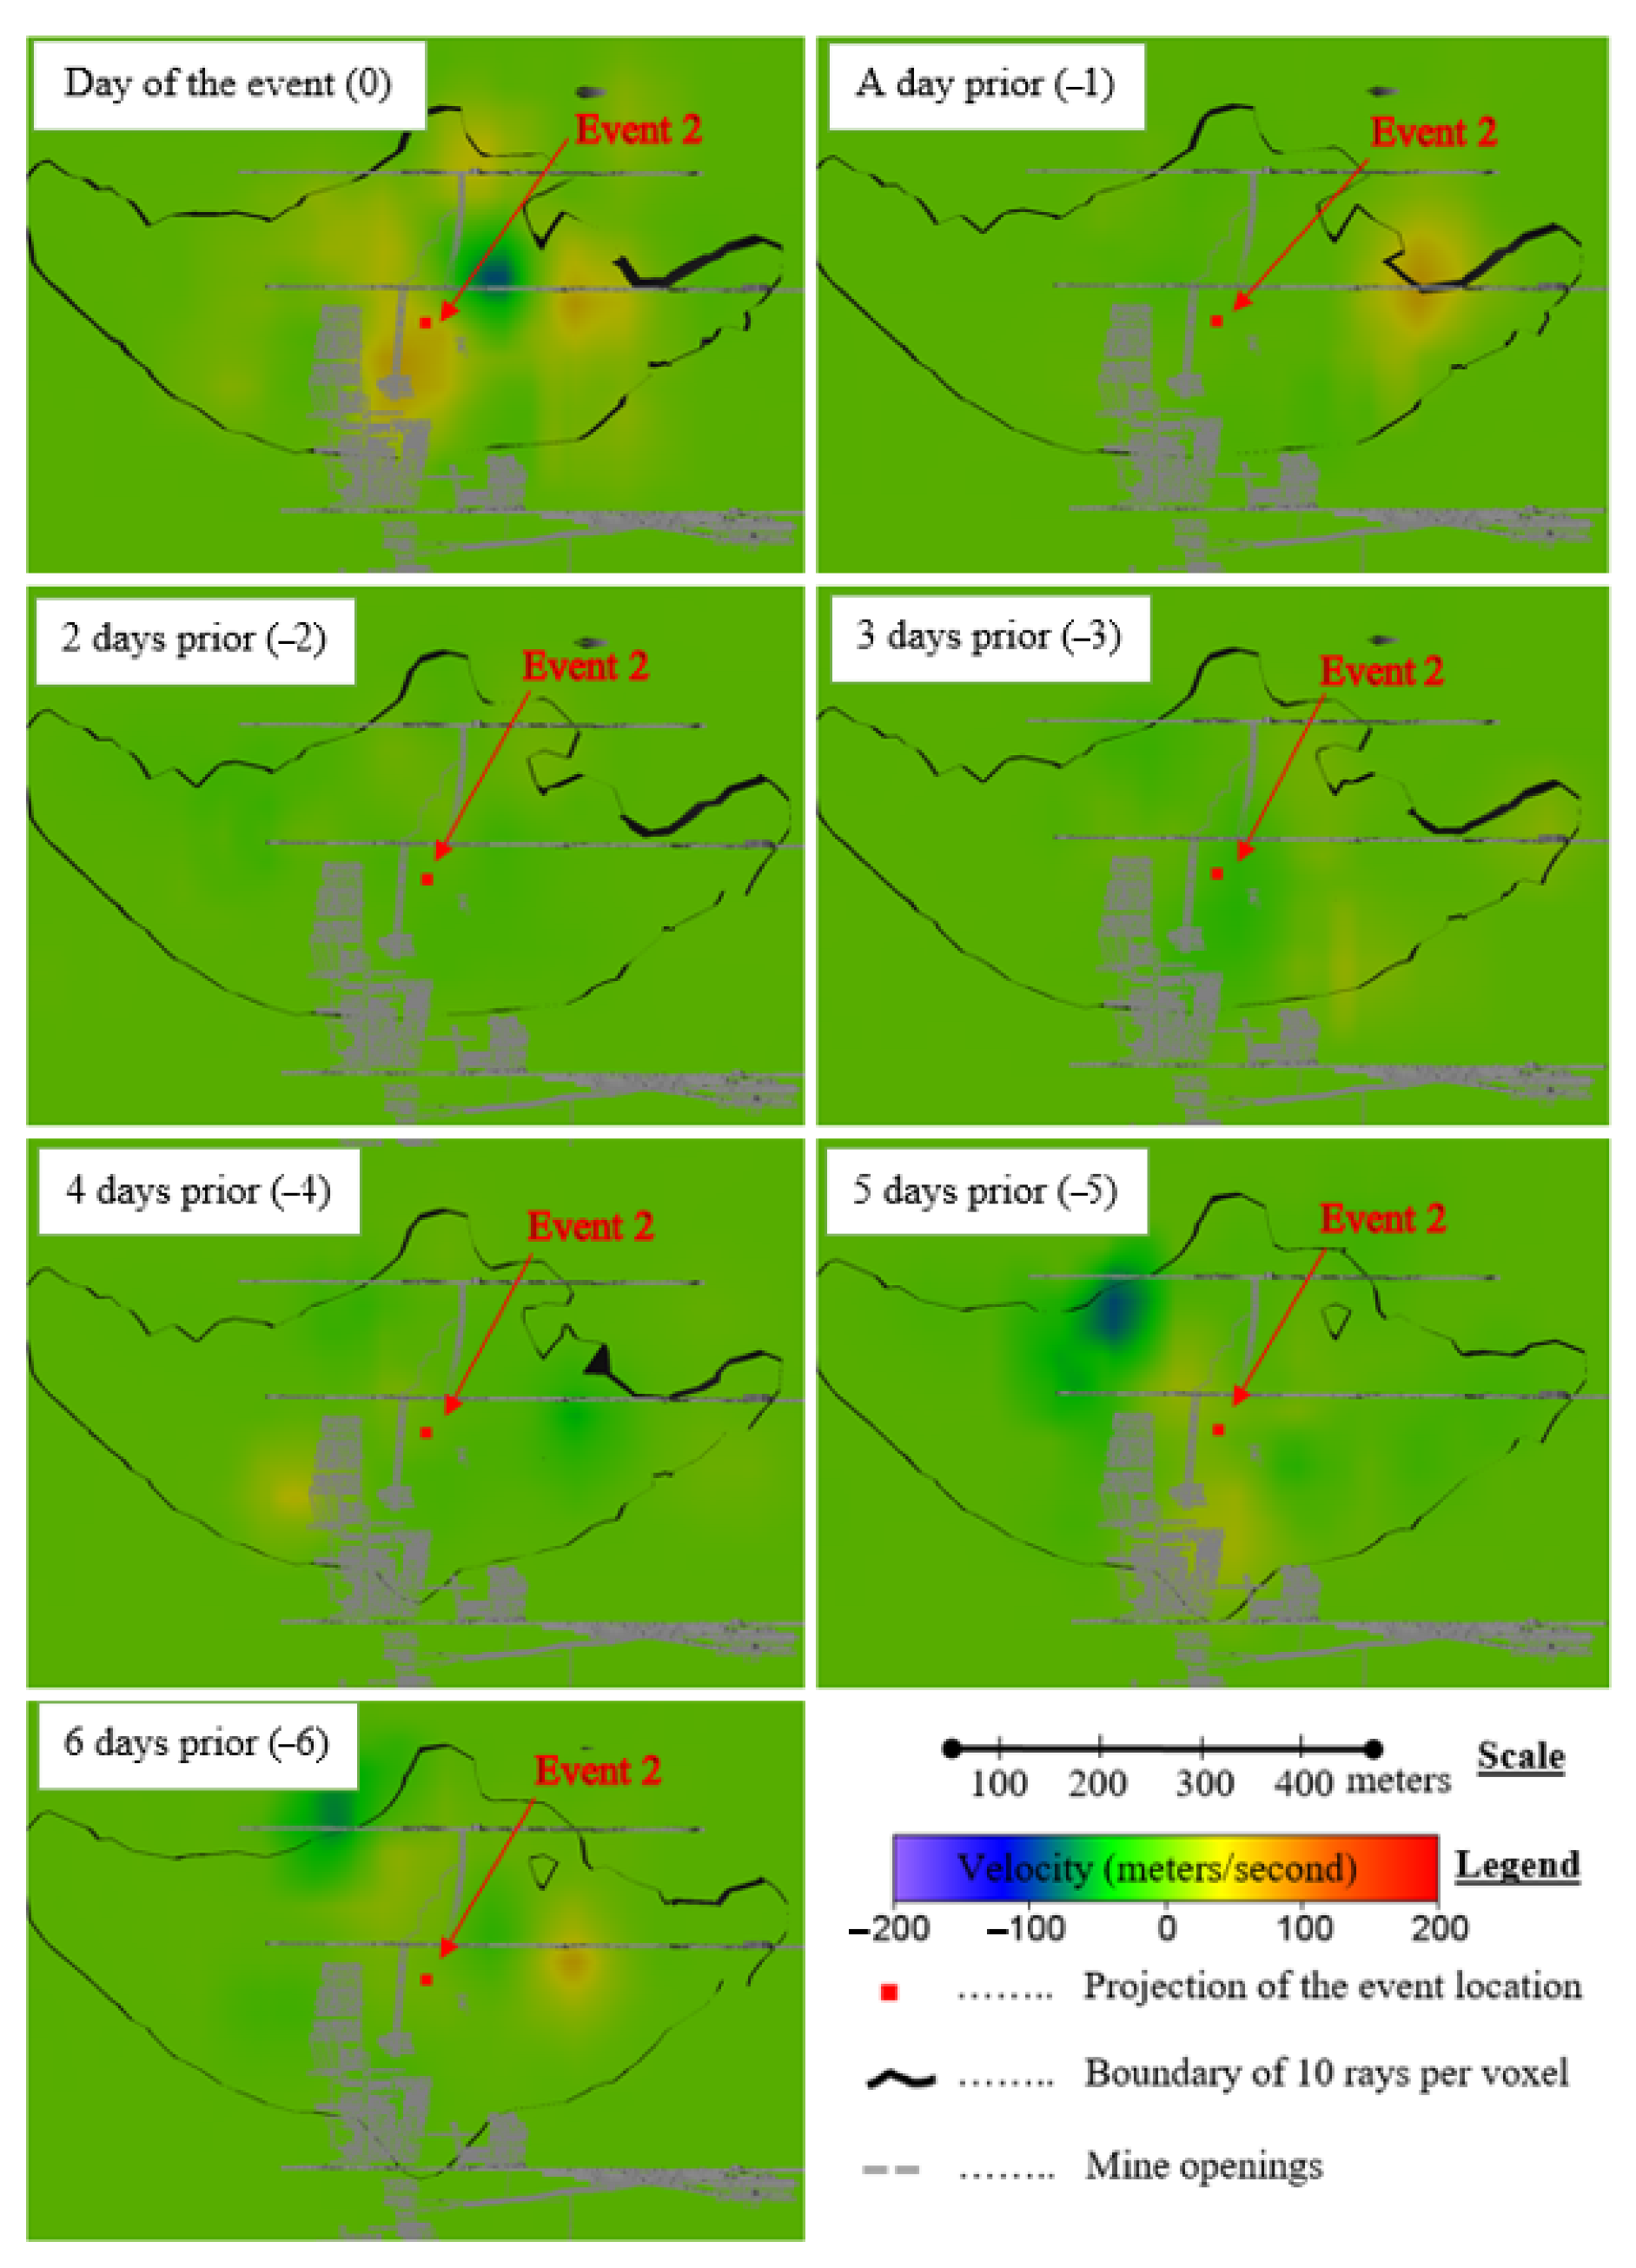
There was no significant change in the seismic velocity within a week of Event 1 in Mining Section 2. The high velocity zone on “Day 0” of this event is further away from the hypocenter of the event and might not be due to the event occurrence. This event has the highest Es/Ep ratio of 24.89 compared to the other four events.
On the other hand, seismic velocity changes on “Day 0” of Event 2 in Mining Section 2 is more than 1% within 200 m of its hypocenter. Essentially no velocity change was seen prior to this event. No blasting was reported at Mining Section 2 by mine site.
The production blasting at the mine was not observed to influence the velocity distribution in a predictable pattern. A change in P-wave velocity distribution due to blasting is not persistent in all three events. For example, in Event 1 in Mining Section 1, a high-velocity zone is observed on the days of the blast at “Day −5” and “Day 0” but there was no noticeable change in seismic velocity in “Day −3” with a blast in the same level. This might be due to a one-day break in blasting at “Day −4” compared to two continuous days of blasting. Blasting did not consistently influence the velocity distribution of the day after or the day of blasting. Nevertheless, all five events happened when there were at least three blasts within the week prior to their occurrence. Moreover, during the weeks in which Events 1 and 3 in Mining Section 1 occurred, some random high-velocity zones were observed in a single day and were not observed the following day. These inconsistent high-velocity zones could be as a result of the blasting in the area, however there was not any persistent trend in their appearance after blasting. An example of this is the high-velocity zone southeast of the hypocenter of the Event 3 in Mining Section 2 at “Day −2”.
In Mining Section 1, where the Es/Ep ratio of the events is less than 5, more general changes in seismic velocity prior to occurrence of the events were observed compared with Mining Section 2, where events have a higher Es/Ep ratio. The fluctuations of the seismic velocity on a smaller scale can be investigated in further studies by analyzing the data in shorter time durations. This agrees with previously published findings where there was no significant increase in seismic velocity prior to major events but the velocity might reduce subtly prior to the event due to dilation [
34,
36].
One explanation for not observing built up induced stress in days prior to the event occurrence may be a concentration of shear stress around existing joints in the rock mass. The experimental and numerical models of direct shear test on rock joints shows that the shear stress increases as displacement progresses along discontinuities [
37,
38,
39], a similar mechanism may occur at the field scale.
As stated initially, excavations in underground mines alter the stress distribution in the rockmass; without a full understanding of this process, especially in deep mines that are prone to induced seismicity, it remains a significant challenge to optimize designs. Seismic velocity tomography should be able to elucidate stress-induced changes within the entire volume of the rockmass, complementing point-location geotechnical measurements and numerical modeling. In the specific scenario presented in this study, one hypothesis could be that stress in the location of a major seismic event would continue to increase until failure occurs, much like a laboratory direct shear test. Another possibility could be that the rockmass behaves more similarly to an unconfined compression test where fractures develop prior to failure, resulting in dilation and a reduction in P-wave velocity. A third scenario would be some combination of these with stress developing at key points, such as asperities or rock bridges, along existing discontinuities prior to failure. The results observed for this set of data show that the induced stress did not appear to continually increase until failure; however, there is a continuing need to develop this technology, along with others, so that the behavior of the rockmass prior to major seismic events can be fully understood.
6. Conclusions and Future Work
The objective of the study was to investigate, on a daily basis, whether there were significant changes to the P-wave velocity within the rockmass prior to major seismic events. For this purpose, the occurrence of five major seismic events in two mining sections was evaluated by passive seismic tomography. No clear velocity change was observed in the daily results prior to five mining-induced seismic events with Mw > 1. The velocity difference was more than 1% within 200 m of the hypocenter on the day of three out five events. This means that seismic events cause a significant change in the stress level of the surrounding rock mass but without substantial change in the seismic velocity in the five days before the event occurs. In three out of five events a gradual change of less than 1% in seismic velocity in the three to five days prior to the events was observed. These subtle changes might be due to dilation during the plastic failure of the rock mass.
The investigation of the blast rate in the three of the events with Es/Ep of less than 5 did not show any persistent trend in seismic velocity changes correlated with blasting. However, all three events occurred with at least three blasts within a week of their occurrence. A high-velocity zone could be induced and destressed after blasting but there is no observable trend in their occurrence.
Minor changes in seismic velocity, which are less than 1%, can be investigated in future studies. The initiation of cracks which propagate and merge in the rock mass might be the cause of these changes in the rock mass. A reasonably predictable trend in seismic velocity changes can be a potential precursory condition for identifying major seismic events prior to their occurrence. This can be crucial for increasing the safety of the mines by taking advantage of seismic tomography. Moreover, mining designs can be optimized if the rock mass performance is monitored by progress in mining. It is recommended for future studies to investigate the subtle changes in seismic velocity in order to identify the possibility of any limit that can be an alarm threshold for operating crews to halt mining and avoid highly stressed zones.
Author Contributions
Conceptualization, S.G.A. and E.W.; methodology, S.G.A.; software, S.G.A. and E.W.; validation, E.W., K.D. and B.W.; formal analysis, E.W. and K.D.; investigation, S.G.A.; resources, E.W., K.D. and B.W.; data curation, S.G.A.; writing—original draft preparation, S.G.A.; writing—review and editing, S.G.A., E.W., B.W. and K.D.; visualization, S.G.A.; supervision, E.W.; project administration, S.G.A.; funding acquisition, E.W. All authors have read and agreed to the published version of the manuscript.
Funding
This research received no external funding.
Data Availability Statement
Some or all data, models, or code used during the study were provided by a third party. Direct requests for these materials may be made to the provider as indicated in the Acknowledgements. Some or all data, models, or code generated or used during the study are proprietary or confidential in nature and may only be provided with restrictions.
Acknowledgments
We thank our colleagues from Mining and Mineral Department of the Virginia Tech who provided convenience of access to licenses of software and adequate data. This project could not have been completed without the marvelous support of the cooperating mining company employees.
Conflicts of Interest
The authors declare no conflict of interest.
References
- He, M.; Ren, F.; Liu, D. Rockburst Mechanism Research and Its Control. Int. J. Min. Sci. Tech. 2018, 28, 829–837. [Google Scholar] [CrossRef]
- Zhao, Z.; Zeng, R. The P and S Wave Velocity Structures of the Crust and Upper Mantle Beneath Tibetan Plateau. Acta Seismol. Sin. 1993, 6, 299–304. [Google Scholar] [CrossRef]
- Thill, R.E. Acoustic Methods for Monitoring Failure in Rock. In Proceedings of the 14th U.S. Symposium on Rock Mechanics (USRMS), University Park, PA, USA, 11–14 June 1972. [Google Scholar]
- He, T.; Zhao, Q.; Ha, J.; Xia, K.; Grasselli, G. Understanding Progressive Rock Failure and Associated Seismicity Using Ultrasonic Tomography and Numerical Simulation. Tunn. Undergr. Space Technol. 2018, 81, 26–34. [Google Scholar] [CrossRef]
- Luxbacher, K.; Westman, E.; Swanson, P.; Karfakis, M. Three-Dimensional Time-Lapse Velocity Tomography of an Underground Longwall Panel. Int. J. Rock Mech. Min. Sci. 2008, 45, 478–485. [Google Scholar] [CrossRef]
- Ghaychi Afrouz, S.; Westman, E.C. Review and Simulation of Passive Seismic Tomography in Block Cave Mining. In Proceedings of the 4th International Symposium on Block and Sublevel Caving, Vancouver, CA, USA, 15–17 October 2018; pp. 223–230. [Google Scholar]
- Barthwal, H.; Van der Baan, M. Passive Seismic Tomography Using Recorded Microseismicity: Application to Mining-Induced Seismicity. Geophysics 2019, 84, B41–B57. [Google Scholar] [CrossRef]
- Westman, E.C.; Heasley, K.A.; Swanson, P.L.; Peterson, S.A. Correlation between Seismic Tomography, Seismic Events and Support Pressure. In Proceedings of the 38th U.S. Symposium on Rock Mechanics (USRMS), Washington, DC, USA, 7–10 July 2001; pp. 319–326. [Google Scholar]
- Ghaychi Afrouz, S.; Westman, E.; Dehn, K.; Weston, B. Time-Dependent Monitoring of Seismic Wave Velocity Variation Associated with Three Major Seismic Events at a Deep, Narrow-Vein Mine. Min. Metall. Explor. 2020, 41, 2524–3470. [Google Scholar] [CrossRef]
- Aki, K.; Richards, P.G. Quantitative Seismology, 2nd ed.; University Science Books: Sausalito, CA, USA, 2002; pp. 20–35. [Google Scholar]
- Terada, M.; Yanagidani, T. Application of Ultrasonic Computer Tomography to Rock Mechanics. Ultrason. Spectrosc. Appl. Mater. Sci. 1986, 205–210. [Google Scholar]
- Westman, E.C. Use of Tomography for Inference of Stress Redistribution in Rock. IEEE Trans. Ind. Appl. 2004, 40, 1413–1417. [Google Scholar] [CrossRef]
- Mendecki, A.J. Seismic Monitoring in Mines, 1st ed.; Chapman and Hall: London, UK, 1996; pp. 220–240. [Google Scholar]
- Ellenberger, J.L.; Heasley, K.A. Coal Mine Seismicity and Bumps: Historical Case Studies and Current Field Activity. In Proceedings of the 19th International Conference Ground Control in Mining, West Virginia University, Morgantown, WV, USA, 8–10 August 2000; pp. 112–120. [Google Scholar]
- Blake, W.; Hedley, D.G.F. Rockbursts: Case Studies from North American Hard-Rock Mines; Society for Mining, Metallurgy, and Exploration: Littleton, CO, USA, 2003; pp. 38–44. [Google Scholar]
- Kamie, R.; Nakata, N.; Lumley, D. Introduction to microseismic source mechanisms. Lead. Edge 2015, 34, 876–880. [Google Scholar] [CrossRef]
- Foulger, G.R.; Wilson, M.P.; Gluyas, J.G.; Julian, B.R.; Davies, R.J. Global Review of Human-Induced Earthquakes. Earth-Sci. Rev. 2018, 178, 438–514. [Google Scholar] [CrossRef]
- Luxbacher, K.D.; Westman, E.C.; Swanson, P.L. Time-Lapse Tomography of a Longwall Panel: A Comparison of Location Schemes. In Proceedings of the 26th International Conference on Ground Control in Mining, Morgantown, WV, USA, 31 July–2 August 2007; pp. 217–225. [Google Scholar]
- Zhang, H.; Sarkar, S.; Toksöz, M.N.; Kuleli, H.S.; Al-kindy, F. Passive Seismic Tomography Using Induced Seismicity at a Petroleum Field in Oman. Geophysics 2009, 74, WCB57–WCB69. [Google Scholar] [CrossRef] [Green Version]
- Rutledge, J.T.; Phillips, W.S. Hydraulic Stimulation of Natural Fractures as Revealed by Induced Microearthquakes, Carthage Cotton Valley Gas Field, East Texas. Geophysics 2003, 68, 441–452. [Google Scholar] [CrossRef]
- Rutledge, J.T.; Phillips, W.S.; Schuessler, B.K. Reservoir Characterization Using Oil-Production-Induced Microseismicity, Clinton County, Kentucky. Tectonophysics 1998, 289, 129–152. [Google Scholar] [CrossRef]
- Maxwell, S.C.; Du, J.; Shemeta, J. Passive Seismic and Surface Monitoring of Geomechanical Deformation Associated with Steam Injection. Lead. Edge 2008, 27, 1176–1184. [Google Scholar] [CrossRef]
- Ghaychi Afrouz, S.; Westman, E.C.; Dehn, K.K.; Weston, B.; Luxbacher, D. A Conceptual Protocol for Integrating Multiple Parameters for Risk Assessment Due to Induced Seismicity in a Deep Mine. American Rock Mechanics Association. In Proceedings of the 54th U.S. Rock Mechanics/Geomechanics Symposium, Golden, CO, USA, 28 June–1 July 2020. [Google Scholar]
- Ma, X.; Westman, E.; Slaker, B.; Thibodeau, D.; Counter, D. The B-Value Evolution of Mining-Induced Seismicity and Mainshock Occurrences at Hard-Rock Mines. Int. J. Rock Mech. Min. Sci. 2018, 104, 64–70. [Google Scholar] [CrossRef]
- Ma, X.; Westman, E.; Malek, F.; Yao, M. Stress Redistribution Monitoring Using Passive Seismic Tomography at a Deep Nickel Mine. Rock Mech. Rock Eng. 2019, 52, 3909–3919. [Google Scholar] [CrossRef]
- Scott, T.E., Jr.; Ma, Q.; Roegiers, J.C.; Reches, Z. Dynamic Stress Mapping Utilizing Ultrasonic Tomography. In Proceedings of the 1st North American Rock Mechanics Symposium, Austin, TX, USA, 1–4 June 1994. [Google Scholar]
- Westman, E.C.; Friedel, M.J.; Williams, E.M.; Jackson, M.J. Seismic Tomography to Image Coal Structure Stress Distribution. In Mechanics and Mitigation of Violent Failure in Coal and Hard-Rock Mines; United States Bureau of Mines: Washington, DC, USA, 1994; pp. 105–117. [Google Scholar]
- Lynch, R.A.; Malovichko, D.A. Seismology and slope stability in open pit mines. In International Symposium on Stability of Rock Slopes in Open Pit Mining and Civil Engineering; SAIMM: Johannesburg, South Africa, 2006; pp. 375–389. [Google Scholar]
- Mendecki, A.J. ‘Persistence of Seismic Rockmass Response to Mining’. In Proceedings of the Sixth International Symposium on Rockburst and Seismicity in Mines Proceedings—RaSiM6, Perth, Australia, 9–11 March 2005; Potvin, Y., Hudyma, M., Eds.; Australian Centre for Geomechanics: Perth, Australia, 2005; pp. 97–105. [Google Scholar] [CrossRef]
- Mauk, J.L.; White, B.G. Stratigraphy of the Proterozoic Revett Formation and Its Control on Ag-Pb-Zn Vein Mineralization in the Coeur d’Alene District, Idaho. Econ. Geol. 2004, 99, 295–312. [Google Scholar] [CrossRef]
- Dehn, K.K.; Butler, T.; Weston, B. Using the Energy Index Method to Evaluate Seismic Hazards in an Underground Narrow-Vein Metal Mine. In Proceedings of the 52nd U.S. Rock Mechanics/Geomechanics Symposium, Seattle, WA, USA, 17–20 June 2018. [Google Scholar]
- Chan, S.S.M. Deformation Behaviour of Revett Quartzite under Uniaxial and Triaxial Loading. In Proceedings of the 6th Canadian Rock Mechanics Symposium, Montreal, QC, Canada, 28–30 May 1970; Mines Branch—Department of Energy, Mines and Resources: Ottawa, CA, USA, 1971. Available online: http://www.carma-rocks.ca/f1les4m3mb3rs-70/CH1.PDF (accessed on 24 April 2020).
- Dehn, K.; Knoll, S. Expansion, Performance, and Improvement of the Rockburst Monitoring System at the Coeur, Galena and Caladay Mines, Wallace, ID. In Proceedings of the 47th U.S. Rock Mechanics/Geomechanics Symposium, San Francisco, CA, USA, 23–26 June 2013. [Google Scholar]
- Trampert, J.; Leveque, J. Simultaneous Iterative Reconstruction Technique’ Physical Interpretation Based on the Generalized Least Squares Solution. J. Geophys. Res. 1990, 95, 553–559. [Google Scholar] [CrossRef]
- Bholowalia, P. EBK-Means: A Clustering Technique Based on Elbow Method and K-Means in WSN. Int. J. Comput. Appl. 2014, 105, 17–24. [Google Scholar]
- Molka, R.J. Tomographic Imaging Associated with a M w 2.6 Fault-Slip Event in a Deep Nickel Mine. Master’s Thesis, Virginia Polytechnic Institute and State University, Blacksburg, VA, USA, 2017. [Google Scholar]
- Park, J.W.; Song, J.J. Numerical simulation of a direct shear test on a rock joint using a bonded-particle model. Int. J. Rock Mech. Min. Sci. 2009, 46, 1315–1328. [Google Scholar] [CrossRef]
- Lin, H.; Cao, P.; Zhou, Y. Numerical simulation for direct shear test of joint in rock mass. Int. J. Image Graph. Signal Processing 2010, 2, 39. [Google Scholar] [CrossRef] [Green Version]
- Shrivastava, A.K.; Rao, K.S. Effect of infill thickness on shear behaviour of jointed rock under CNS conditions. In Proceedings of the International Society for Rock Mechanics and Rock Engineering, ISRM Regional Symposium—EUROCK, Vigo, Spain, 27–29 May 2014; p. 167. [Google Scholar]
Figure 1.
Sensor distribution along the mine openings in two mining sections (top view and side views). Red points are the sensors, and the gray lines are mine openings.
Figure 1.
Sensor distribution along the mine openings in two mining sections (top view and side views). Red points are the sensors, and the gray lines are mine openings.
Figure 2.
Cumulative released energy and moment magnitude of the recorded events in Mine Sections 1 and 2. The days of the occurrence of major seismic events are marked and labeled for each section.
Figure 2.
Cumulative released energy and moment magnitude of the recorded events in Mine Sections 1 and 2. The days of the occurrence of major seismic events are marked and labeled for each section.
Figure 3.
Plan view of the blast locations along with the mine maps (top) and side view of the blast locations in three levels (bottom).
Figure 3.
Plan view of the blast locations along with the mine maps (top) and side view of the blast locations in three levels (bottom).
Figure 4.
Location of hypocenters of the three events in Mining Section 1 relative to the cutting plane, shown as an isometric view (right) and plan view(left).
Figure 4.
Location of hypocenters of the three events in Mining Section 1 relative to the cutting plane, shown as an isometric view (right) and plan view(left).
Figure 5.
Location of hypocenters of the two events in Mining Section 2 relative to the cutting planes, shown as an isometric view (left) and plan view (right).
Figure 5.
Location of hypocenters of the two events in Mining Section 2 relative to the cutting planes, shown as an isometric view (left) and plan view (right).
Figure 6.
The daily velocity differences from six days prior to Event 1 at Mining Section 1. The boundary of confidence with 10 rays per voxel for each day is shown in black and the days with blasting are marked with the location of the blast. The blast locations are within 30 m of the hypocenter.
Figure 6.
The daily velocity differences from six days prior to Event 1 at Mining Section 1. The boundary of confidence with 10 rays per voxel for each day is shown in black and the days with blasting are marked with the location of the blast. The blast locations are within 30 m of the hypocenter.
Figure 7.
The daily velocity differences from six days prior to Event 2 at Mining Section 1. The boundary of confidence with 10 rays per voxel for each day is shown in black and the days with blasting are marked with the location of the blast. The blast locations are within 30 m of the hypocenter.
Figure 7.
The daily velocity differences from six days prior to Event 2 at Mining Section 1. The boundary of confidence with 10 rays per voxel for each day is shown in black and the days with blasting are marked with the location of the blast. The blast locations are within 30 m of the hypocenter.
Figure 8.
The daily velocity differences from six days prior to Event 3 at Mining Section 1. The boundary of confidence with 10 rays per voxel for each day is shown in black and the days with blasting are marked with the location of the blast. The blast locations are within 30 m of the hypocenter.
Figure 8.
The daily velocity differences from six days prior to Event 3 at Mining Section 1. The boundary of confidence with 10 rays per voxel for each day is shown in black and the days with blasting are marked with the location of the blast. The blast locations are within 30 m of the hypocenter.
Figure 9.
The daily velocity differences from six days prior to Event 1 at Mining Section 2. The boundary of confidence with 10 rays per voxel for each day is shown in black and the days with blasting are marked with the location of the blast. The blast locations are within 30 m of the hypocenter. The hypocenter of event was about 250 m from the active mining.
Figure 10.
The daily velocity differences from six days prior to Event 2 at Mining Section 2. The boundary of confidence with 10 rays per voxel for each day is shown in black and the days with blasting are marked with the location of the blast. The blast locations are within 30 m of the hypocenter.
Figure 10.
The daily velocity differences from six days prior to Event 2 at Mining Section 2. The boundary of confidence with 10 rays per voxel for each day is shown in black and the days with blasting are marked with the location of the blast. The blast locations are within 30 m of the hypocenter.
Table 1.
Moment magnitude, coordinates released energy, and ratio of shear wave to compressive wave energy for five events.
Table 1.
Moment magnitude, coordinates released energy, and ratio of shear wave to compressive wave energy for five events.
| Major Seismic Event | Day | Easting (m) | Northing (m) | Elevation (m) | Moment Magnitude | Released Energy (J) | Es/Ep |
|---|
| Mining Section 1 | 1-1 | 65 | 3435 | 2318 | −150 | 1.62 | 2,270,000 | 2.95 |
| 1-2 | 199 | 3429 | 2324 | −214 | 1.81 | 2,970,000 | 3.47 |
| 1-3 | 216 | 3428 | 2340 | −176 | 1.75 | 1,870,000 | 4.86 |
| Mining Section 2 | 2-1 | 33 | 2561 | 3631 | −574 | 1.48 | 3,200,000 | 24.89 |
| 2-2 | 248 | 2729 | 3564 | −649 | 1.76 | 2,440,000 | 7.43 |
Table 2.
Number of blasts per day within a week of event occurrence in Mining Section 1.
Table 2.
Number of blasts per day within a week of event occurrence in Mining Section 1.
| Number of Blasts Prior to | Days Prior to the Major Event |
|---|
| −6 | −5 | −4 | −3 | −2 | −1 | 0 |
|---|
| Event 1-1 | 1 | 1 | 0 | 1 | 0 | 0 | 1 |
| Event 1-2 | 0 | 1 | 1 | 0 | 1 | 1 | 0 |
| Event 1-3 | 0 | 2 | 1 | 2 | 0 | 1 | 2 |
| Publisher’s Note: MDPI stays neutral with regard to jurisdictional claims in published maps and institutional affiliations. |
© 2022 by the authors. Licensee MDPI, Basel, Switzerland. This article is an open access article distributed under the terms and conditions of the Creative Commons Attribution (CC BY) license (https://creativecommons.org/licenses/by/4.0/).


