Article

The Mechanical Response of a Silty Sand Stabilized with Colloidal Silica

Laboratory of Soil Mechanics, Foundations and Geotechnical Earthquake Engineering, Department of Civil Engineering, Aristotle University of Thessaloniki, 54124 Thessaloniki, Greece
*
Author to whom correspondence should be addressed.
Geotechnics 2021, 1(2), 243-259; https://doi.org/10.3390/geotechnics1020013
Submission received: 16 July 2021 / Revised: 3 September 2021 / Accepted: 18 September 2021 / Published: 28 September 2021

Abstract

:
This paper presents a laboratory investigation into the mechanical response of a silty sand, with a fines content of 10%, stabilized with colloidal silica (CS). To this end, a series of unconfined compression tests as well as monotonic and cyclic triaxial tests was performed on a silty sand, comprising a mixture of a clean sand and a silty sand, stabilized with two concentrations of CS. The effect of various parameters on the behaviour of the stabilized silty sand was studied, such as CS concentration, soil density, and the presence of fines. The test results were compared with the corresponding of the untreated silty sand as well as the parent clean sand. It is shown that stabilization, even at the lowest CS = 6% concentration studied, significantly improves the undrained shear strength as well as the liquefaction resistance of the stabilized silty sand. Both the monotonic and cyclic response of the stabilized soil are only slightly affected by density. Furthermore, cyclic straining up to at least 5% of double-amplitude axial strain does not influence the undrained shear strength of the stabilized silty sand.

1. Introduction

Passive stabilization is a non-disruptive soil improvement technique for the mitigation of liquefaction potential of sands under existing developed structures [1]. The concept of this technique comprises slow injection of a stabilizing material at the upgradient side of a developed site by means of natural or augmented groundwater flow [2]. The stabilizing material has initially low viscosity, and therefore, injection is performed effortlessly and, unlike grouting processes, under low pressure [3]. After delivery at the target location, the stabilizer viscosity increases rapidly at a controlled time. The presence of the stabilizer within the subsoil alters the mechanical response of the soil skeleton—pore fluid system—and results in increased deformation resistance [1] and shear stiffness [4,5]. Passive stabilization is considered non-destructive and causes minimum disturbance at the normal operations of the developed site under treatment [1,6], contrary to other soil improvement techniques, such as vibratory methods, underpinning, and grouting. Among the various stabilizers employed for passive stabilization, such as sodium silicate [7], laponite suspensions [8], and bio-materials [9], colloidal silica has received increasing interest in the past years for the reasons described below.
Colloidal silica, CS, is an aqueous suspension of silica nano-particles produced from saturated solutions of silicic acid, H4SiO4 [10]. It is considered environmentally benign since it is non-toxic and biologically and chemically inert [11] and also displays higher durability compared to other potential stabilizers, such as sodium silicate [12]. For practical geotechnical applications, the commercially available CS suspension, usually at CS concentrations by weight in water of 30% or more, is diluted to obtain a desired smaller concentration of CS, which depends on the offered balance between improved soil behaviour and cost. Experimental investigations showed that passive stabilization with CS concentrations of up to 10% [1] is cost-competitive compared to other liquefaction mitigation techniques, such as underpinning and grouting.
The initial viscosity of a CS solution with concentration up to 10% is only slightly higher than that of water, thus enabling low-pressure infiltration within the sub-soil [13]. Any CS solution can transform into a rigid gel, holding a viscosity of >100 cP after a pre-determined gelling time, which may range from a few minutes to more than a year [14]. Gelling time of a given CS solution at a specific concentration and temperature can be effectively controlled by adjusting the ionic strength and the pH of the solution [2,15]. Following gelation, the structure of the CS gel comprises a 3-D continuous network of molecular silica chains with strong interparticle interactions and an enormous number and complexity of interconnections and micropores enclosing continuous water [16].
Within the subsoil, the gelled CS structure fills any accessible pore space and thus blocks or delays water flow [14]. As such, injection of CS in soil was first attempted by the petroleum industry [17] and thereafter for environmental protection of the ground water quality [14,18,19,20]. Recently, it has been also used as a low-pH grout within nuclear waste repositories in crystalline rock [21], in tunnelling, and the underground construction industry [22]. The rheological and chemical properties of CS have attracted the interest of many researchers in the past 30 years [14,18], who confirmed low hydraulic conductivity of CS stabilized soils as well as long-controllable and reproducible gel times of CS.
The mechanical response of stabilized sands has been extensively investigated in the past years by means of monotonic [4,23] and cyclic testing [6,24]. The majority of these investigations was mainly concerned with the stabilization of clean sands [25]. Yet, most liquefaction cases in situ involve sands with at least a small amount of fines [26]. To date, only very few investigations on CS stabilization were concerned with sands containing fines, each of which focused on different aspects of their mechanical response. In particular, [15] investigated the behaviour of CS-stabilized Trevino sandy loam, with a fines content fc = % < 75 μm of 48%, by means of unconfined compression and permeability testing. Ref. [27] performed cyclic simple shear testing on a CS-stabilized silty sand (fc = 11.5%) from Lazaro-Cardenas Port in Mexico. [28] investigated the feasibility of CS stabilization to permeate sands with various amounts of fines by means of physical modelling and showed that fc up to 20% is considered appropriate for passive stabilization.
Despite the increasing research interest in CS stabilization, the data available to date for the mechanical response of soils stabilized with CS are still scarce and, in some cases, inconclusive. This is mainly attributed to the range of studied CS solutions [2]; the CS concentrations used, varying mainly from 1% to 20% [29,30]; and the differences in curing time employed for stabilized sands [31], i.e., the time elapsed from CS gelation time to soil testing.
Moreover, two different procedures have been followed in laboratory testing regarding back-saturation of CS-stabilized soils before monotonic or cyclic loading. In particular, a few researchers [23,27,32] performed triaxial testing on back-saturated stabilized specimens, as in the case of untreated specimens. However, according to other researchers [2,28,31,33], the highly compressible nature of CS as compared to water [6,34] demonstrates that back-saturation of CS-stabilized specimens after curing and prior to testing damages the gelled network and creates fissures and fractures, where unobstructed water flow can occur. Ref. [24] showed that the use of elevated back-pressure in stabilized, loose specimens alters their response during loading to a dilative one, which is attributed to the damaged CS bonds and the formation of clusters of solidified material within the stabilized specimens. Furthermore, back-saturation is not representative of the process followed during the field application of passive stabilization, where CS is permeated through the soil, replacing pore water at very low-pressure differentials at a depth of a few meters [35].
The aim of this paper is the investigation of how the presence of fines affects the monotonic and cyclic response of a CS-stabilized sand. The work presented adds to the work by [24] on a CS-stabilized clean sand. To this extent, unconfined compression tests as well as monotonic and cyclic triaxial tests were performed on a stabilized silty sand at loose- to medium-dense state, aiming at understanding the mechanism by which parameters, such as the CS concentration, confining pressure, and density, affect its mechanical response. In order to gain a better insight on the effect of CS stabilization, the test results on the CS-stabilized silty sand are compared with the corresponding of the untreated silty sand as well as the stabilized parent clean sand.

2. Tested Materials

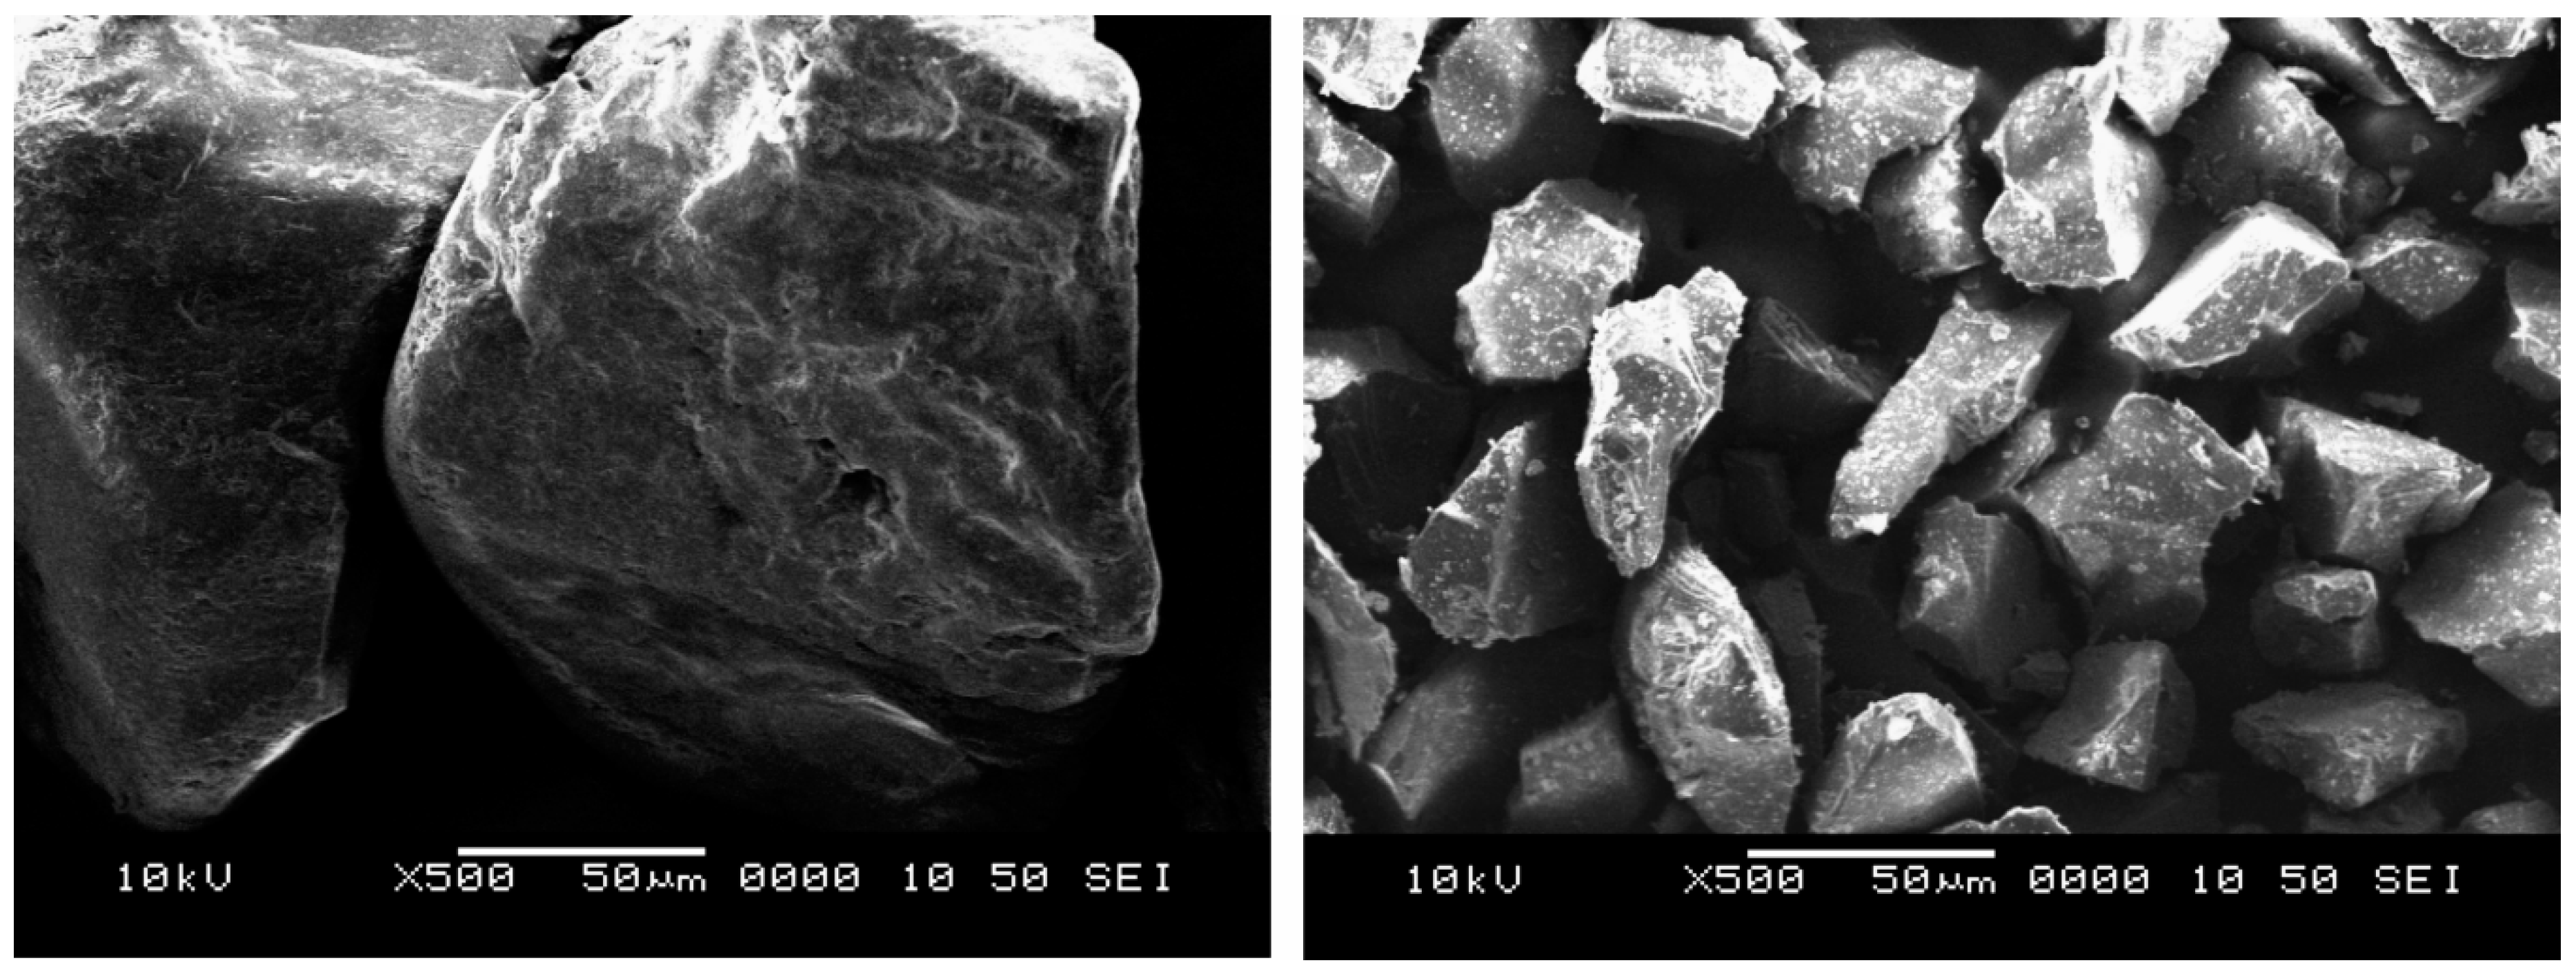
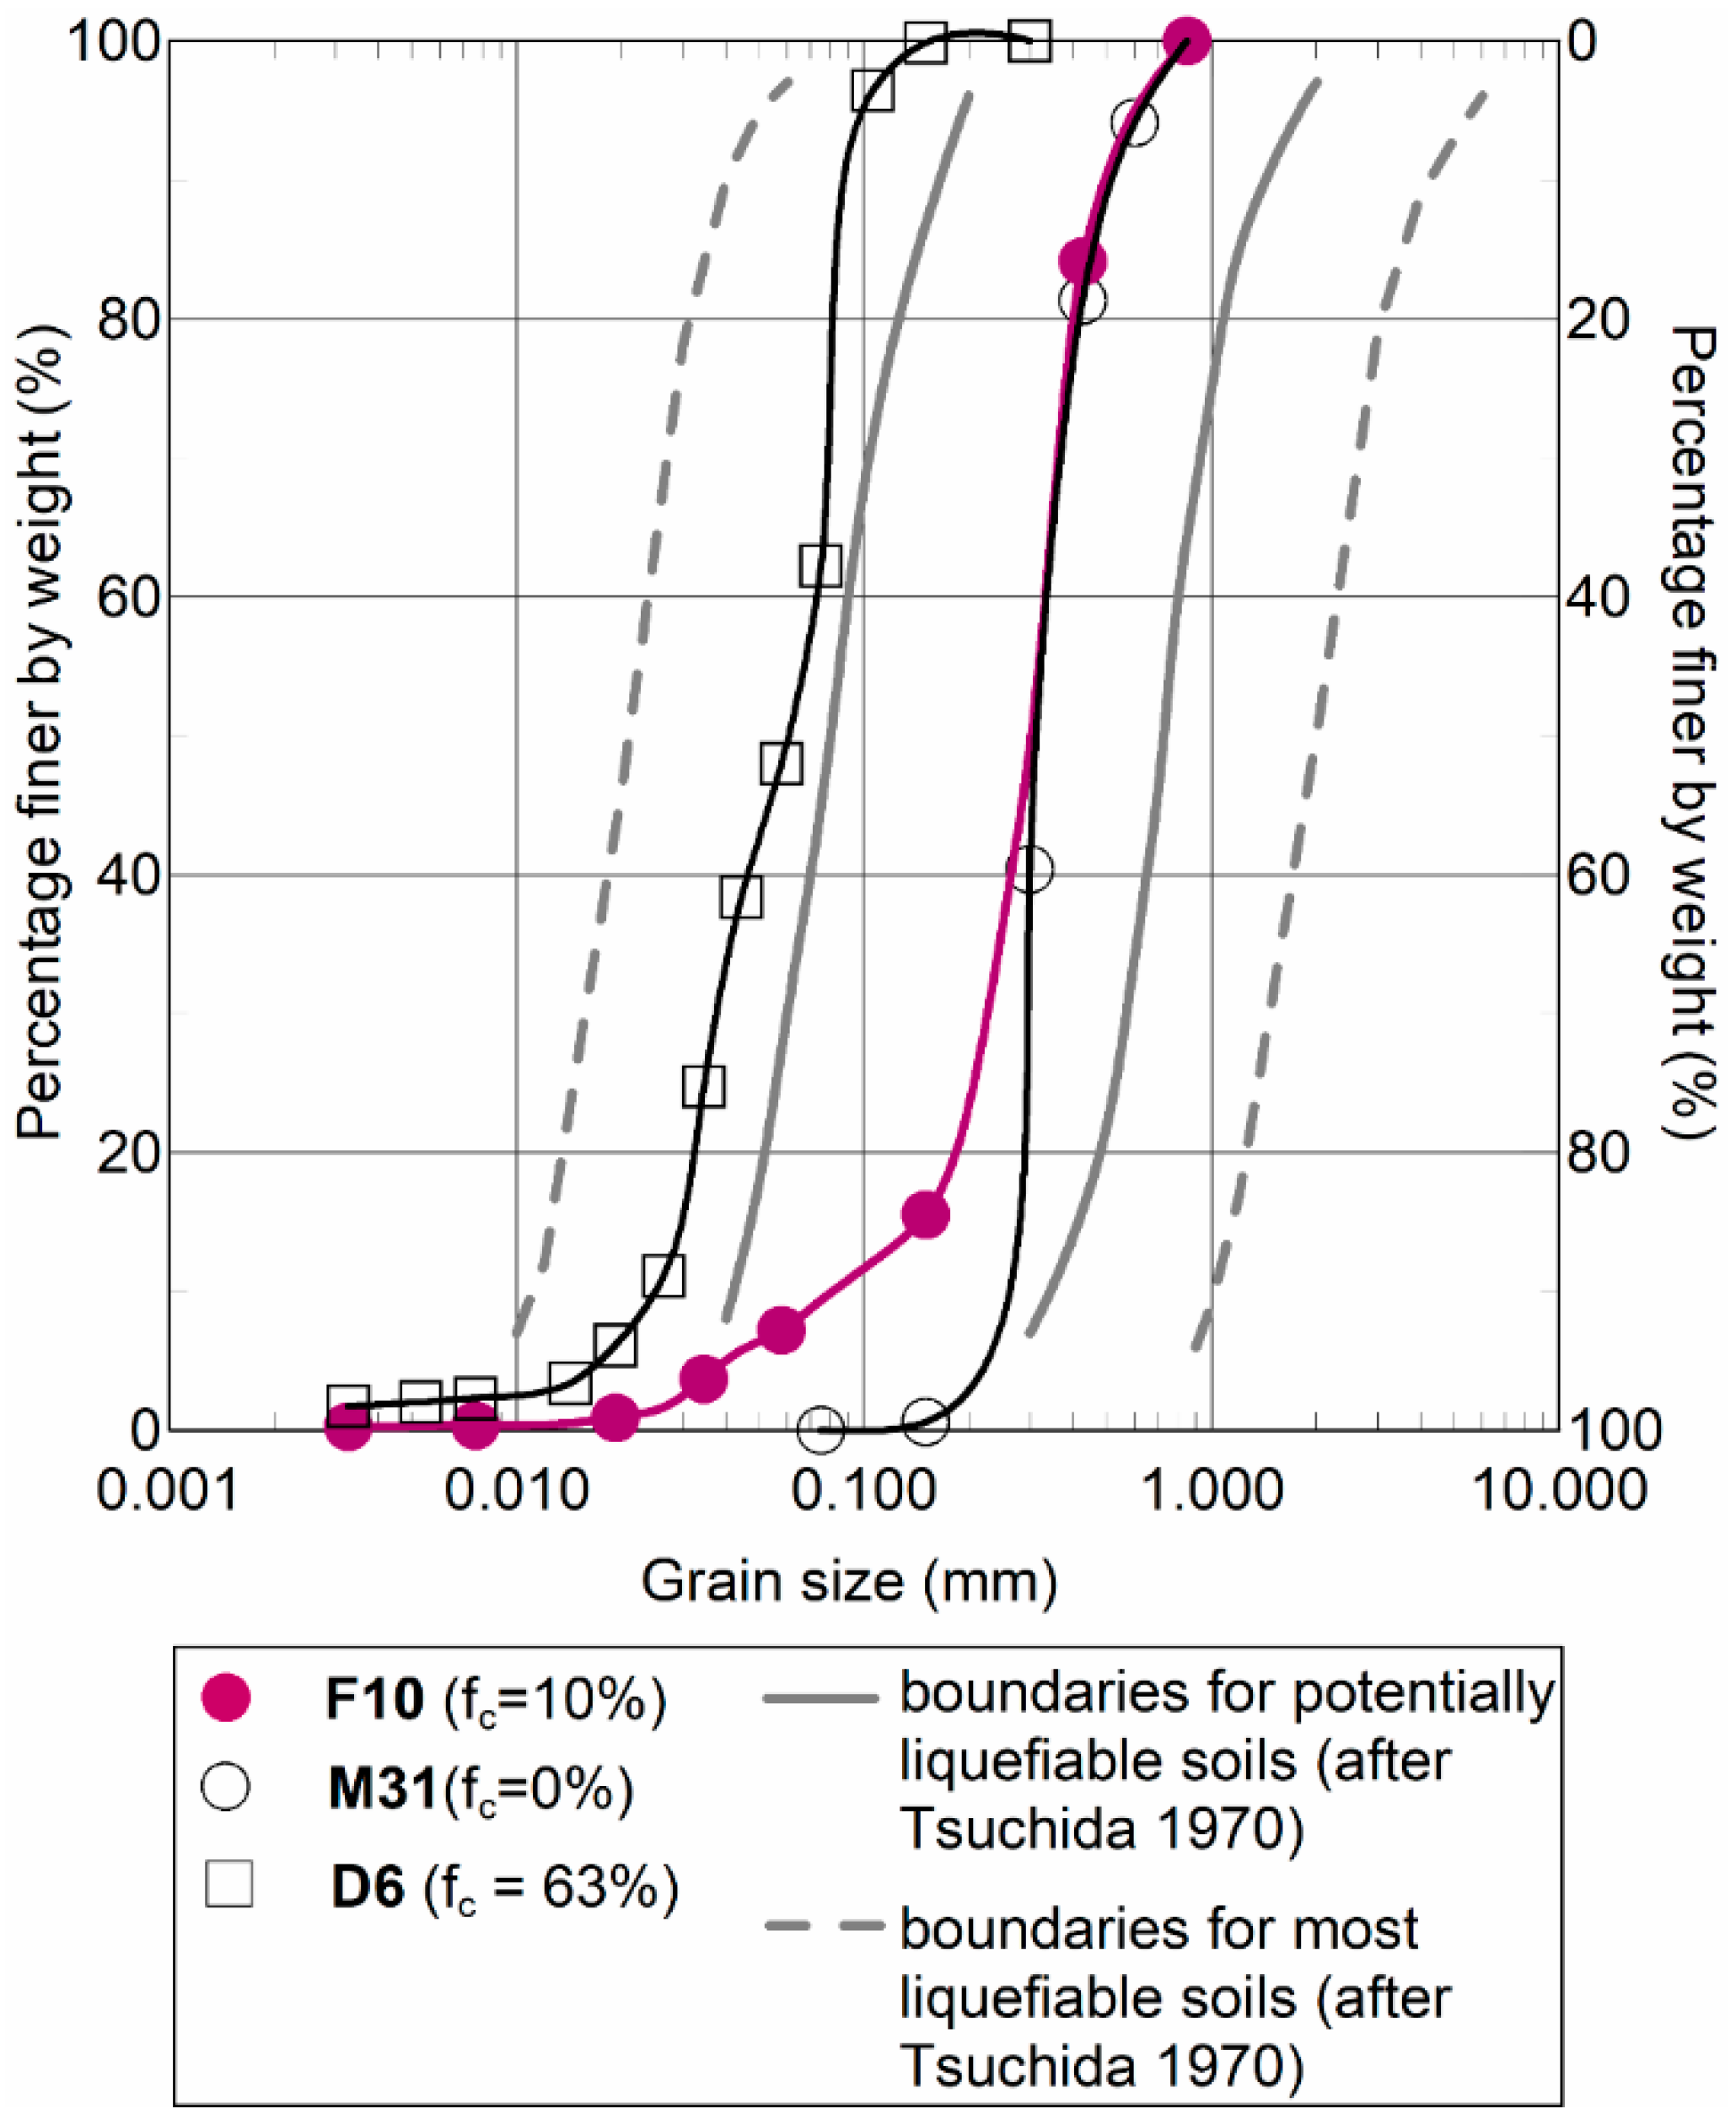
2.1. Soil Properties

The soil used in this study is a silty sand, referred here as SF10, with a fines content of fc = 10%. It comprises a mixture of 85% of quartz clean sand, M31, and 15% of quartz, sandy silt, and D6, with fc = 63% [24]. The D6 is characterized as non-plastic, inert, and pH neutral [36]. Microscopically, the sand particles of M31 display grains of variable roundness and sphericity and of relatively uniform frosted texture, whereas the D6 particles are highly polished and angular (Figure 1).
The physical properties determined for the studied silty sand, SF10, as well as its components, M31 and D6, are presented in Table 1. The permeability, k, reported in Table 1, was measured for both the silty sand, SF10, and the clean sand, M31, at a medium-dense to dense state (Dr = 41.8–73.3%), by means of constant head permeability testing, according to [37]. Figure 2 shows the gradation curves for SF10 and its components, M31 and D6.

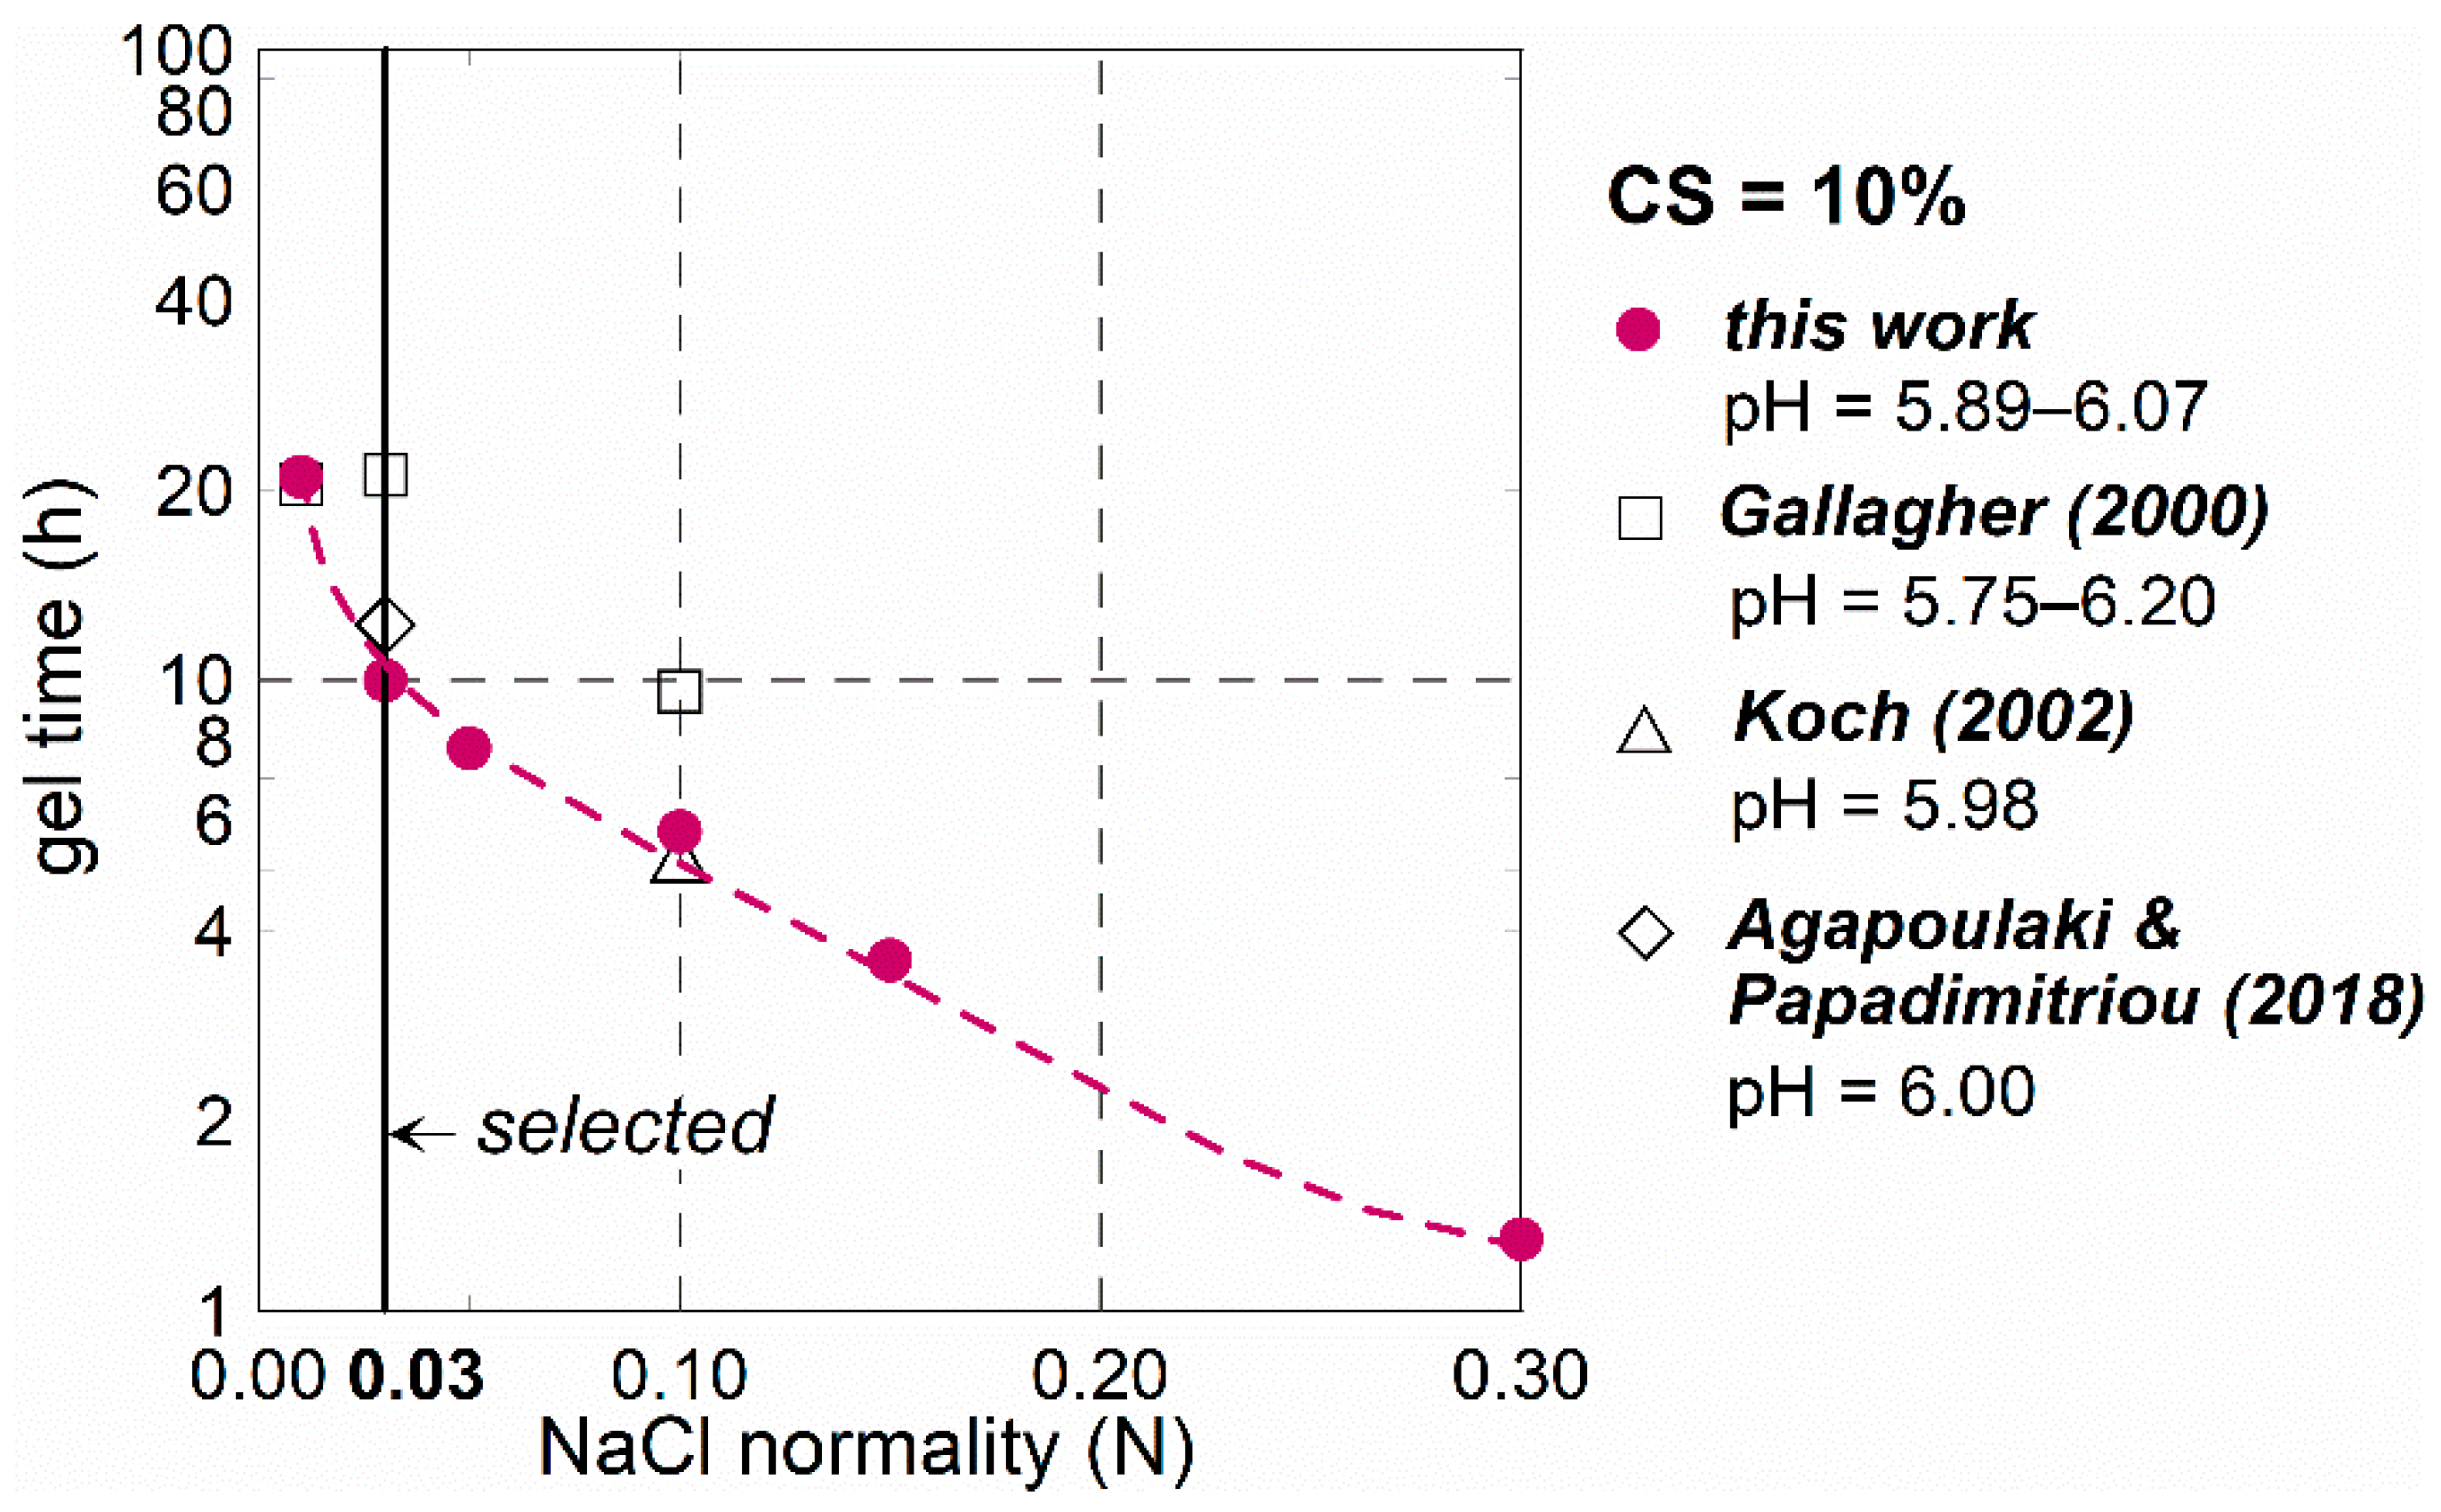
2.2. CS Solution Properties

DuPont Ludox SM-30 colloidal silica was selected as the stabilizing agent of soil specimens. The solution is supplied at 30% by weight silica concentration, holding a viscosity of 5.5 cP (20 °C), a pH of 10, and an average particle size of 7 nm.
Dilution of the as-supplied solution was performed by the addition of distilled water in order to obtain concentrations of 6% and 10% CS, which are considered cost competitive in comparison with other methods of chemical grouting [2,29].
The rheological properties of the selected CS solutions were investigated by conducting dynamic viscosity measurements by means of a rotating Brookfield viscometer (LVDV-II+PX model). For a given CS concentration at a given temperature, gelation time is controlled by either adjusting pH, salinity, or both. In this work, it was decided to control gel time of the tested solutions by their salinity and, in particular, their NaCl concentration. For this reason, CS = 6% and 10% solutions at a pH of 6.0 were prepared by the addition of only a few drops of 6 N HCl in a temperature-controlled laboratory room (at 20 °C). This pH value was chosen because it yields minimum gelation time for a given CS solution according to the literature [18]. Pure NaCI was used as a salt, often encountered in groundwater, especially at sites near the sea. The normality of NaCl was studied within a range of 0.01 to 0.30 N. In order to avoid disturbance of the solutions, viscosity measurements were performed directly inside 600 mL glass beakers at various time intervals. Torque values during testing remained higher than 10% of the equipment scale, as suggested by the user’s manual. This was achieved by utilizing initially an ultra-low viscosity adapter (ULA) for measuring low viscosity values, which was afterwards replaced by spindle number 3 from the LV series for the measurement of higher viscosities up to CS gelation. The rotational spindle speed (rounds per minute, rpm) in all tests was set at 30.
According to the viscosity measurement results, initially the viscosity values, η, of all studied solutions were as low as 1.2 cP. With time, viscosity increased slowly up to a threshold value η = 3.5 cP, after which η increased rapidly up to values higher than 100 cP [38]. Since there is not a precise definition for gel time [16], for the purposes of this work, it was defined as the elapsed time for which the tested solution viscosity is equal to η = 3.5 cP. Beyond that value, during preparation of CS-stabilized soil specimens, it was observed that CS flow through the soil practically ceases due to the following rapid increase of viscosity and hence the eventual transformation of the solution into a rigid gel [39], which was evident only shortly afterwards (in all cases after less than one hour).
To validate the approach employed herein for the determination of gel time, gel times for CS = 10% were compared with the corresponding values from literature on the same CS type (SM-Ludox). As shown in Figure 3, the results from this study are very similar to corresponding results from [2,3,40]. Figure 3 also shows that for CS = 10%, a slight increase of NaCl concentration results in a significantly reduced gel time, from 20 to less than 2 h.
For the selected CS concentrations of 6% and 10% with pH = 6, the NaCl normality of the solutions was adjusted, respectively, to 0.18 N and 0.03 N. Such concentrations were found to correspond to gel times of 11 and 10 h, respectively, which were considered adequate for the completion of CS permeation through the soil.

3. Experimental Procedure

As stated previously, the testing program comprised unconfined compression strength tests as well as undrained monotonic and cyclic triaxial tests, performed using a closed-loop automatic cyclic triaxial apparatus (MTS Systems Corporation, Eden Prairie, MN, USA) [41].

3.1. Specimen Preparation

Soil specimens, both CS-stabilized and untreated, were formed in cylindrical moulds (height/diameter ≈ 100 mm/50 mm) according to the undercompaction method proposed by [42], as described by [24], at density states ranging from loose to medium dense.
Stabilization of specimens with CS, which were used either for triaxial or unconfined compression testing, was performed according to the following procedure: after their formation, specimens were saturated by percolation initially of carbon dioxide (CO2) and then de-aired water, from bottom to top. Likewise, the CS solution was afterwards injected into the specimens from bottom to top, under a small pressure differential of 5–10 kPa, until it filled the soil voids. The procedure was assumed complete when a solution volume equal to four times the soil specimen volume was extracted from the top of the specimen. The viscosity of the CS solution remained low (η << 3.5 cP) throughout the permeation process, which, in all cases, lasted less than an hour. After CS injection, each specimen was sealed from both ends inside the mould and was left to harden for 24 h. Following this, specimens were taken out and placed inside a constant temperature (20 ± 1 °C) and humidity chamber for another 24 h. Thus, the total curing period employed for all stabilized specimens, starting from the injection of the CS solution until testing of specimens, was equal to 2 days, which is five times the gelation time, approximately. No shrinkage was observed throughout the curing process of stabilized specimens at both CS concentrations. It is noted that the presence of 10% fines in the studied silty sand did not obstruct the CS injection process as compared to treatment of the same sand without fines (M31).

3.2. Testing

In the case of untreated specimens, after their formation, saturation was achieved by percolation initially of CO2 and following of de-aired water and afterwards by increasing the cell and back-pressure consecutively under a small effective stress of 10 kPa (B ≥ 0.95), up to a back pressure ub of 300 kPa. Following saturation, untreated specimens were isotropically consolidated under an effective isotropic stress p′0 of 100 kPa. A period of time equal to double the consolidation time was allowed before either monotonic or cyclic loading.
CS-stabilized specimens were not back-saturated for the reasons described previously [2,24]. Hence, the mean total, p0, and effective, p′0, stresses for the CS-stabilized specimens were considered herein practically identical.
The unconfined compressive strength tests on stabilized specimens, formed as described above, were performed according to [43], at a constant strain rate of 0.5%/min. The unconfined compressive strength tests served as index tests in order to further assess the improvement imposed by CS stabilization.
In the monotonic triaxial tests, both stabilized and untreated specimens were subjected to undrained compression at a constant strain rate of 0.1%/min. The monotonic tests data reported in Table 2 for stabilized silty sand specimens are void ratio; e and relative density; Dr prior to loading; and the undrained shear strength, su = qu/2, at the point of maximum q, su-max, and ultimate q, su-ult, as well as the corresponding εα. In a similar manner, the monotonic tests data for untreated silty sand specimens reported in Table 3 are e and Dr prior to loading and deviatoric and mean effective stress at the Critical state, qcs and p′cs, as well as at the Phase Transformation state (state corresponding at p′min), qpt, p′pt, together with the corresponding εα.
In the cyclic triaxial tests, a sinusoidally varying axial stress (±σd) was applied at a frequency of f = 0.1 Hz under undrained conditions. The occurrence of εDA = 5% was customarily used as a reference point to define the state of cyclic softening or liquefaction of sands [44]. Thus, in order to specify the onset of liquefaction, the number of loading cycles, N, required to reach εDA = 5%, Nl, was determined by running a series of tests with different values of cyclic stress ratio, CSR. In view of the typical number of significant load cycles (10 to 20 for an earthquake of a 7.5 magnitude) of actual earthquakes, in this work, the onset of cyclic softening and thus the cyclic resistance ratio, CRR15, was considered as the CSR required to produce εDA = 5% in 15 loading cycles.
Furthermore, to examine the possibility of particle-bonding breakage during cyclic loading of the stabilized specimens, undrained monotonic compression tests were also performed after cyclic loading of specimens to at least εDA = 5%.
The cyclic tests data reported in Table 4 and Table 5, respectively, for CS-stabilized and untreated silty sand specimens are e, Dr, CSR, and the number of cycles required to reach εDA = 1%, 2.5%, and 5%, N1%, N2.5%, and Nl, respectively. In the case of stabilized specimens, su-max attained during monotonic loading after cyclic softening is also reported in Table 4.
In order to examine the effect of the presence of fines on the response of the studied soil, both monotonic and cyclic triaxial tests results on silty sand specimens (SF10, fc = 10%) were compared with the corresponding results on clean sand specimens (M31, fc = 0%). Details on the M31 tests data are found in [24].

4. Test Results and Discussion

4.1. Unconfined Compression Tests

Figure 4 and Figure 5 show results from the unconfined compression tests on the stabilized silty sand as well as on the stabilized parent clean sand for comparison.
The CS-stabilized silty sand at a loose- to medium- dense state (Dr ranging from 10.2% to 44.7%) exhibits an unconfined compressive strength, qc, and brittle behaviour, as indicated by the distinct shear surfaces created in the specimens at the end of the tests.
Figure 4 shows that increasing CS concentration results in an increase of both the initial stiffness and qc. For the range of densities studied, qc increases linearly with density, shown in Figure 5. Moreover, the rate of qc increase is greater at the higher CS = 10% concentration.
According to Figure 5, at the lowest CS = 6% concentration, the presence of 10% fines in the stabilized silty sand results in higher qc values as compared to the stabilized parent clean sand. In particular, at Dr = 20%, qc values for the silty sand are approximately 114% higher than the corresponding for the parent sand. However, increasing CS practically diminishes the effect of fines on the unconfined compression of the studied sand. The measured qc values for the stabilized silty sand, ranging approximately from 36 to 105 kPa, are slightly lower than the corresponding results by [15] for CS = 10% Trevino silty (fc = 48%) sand.

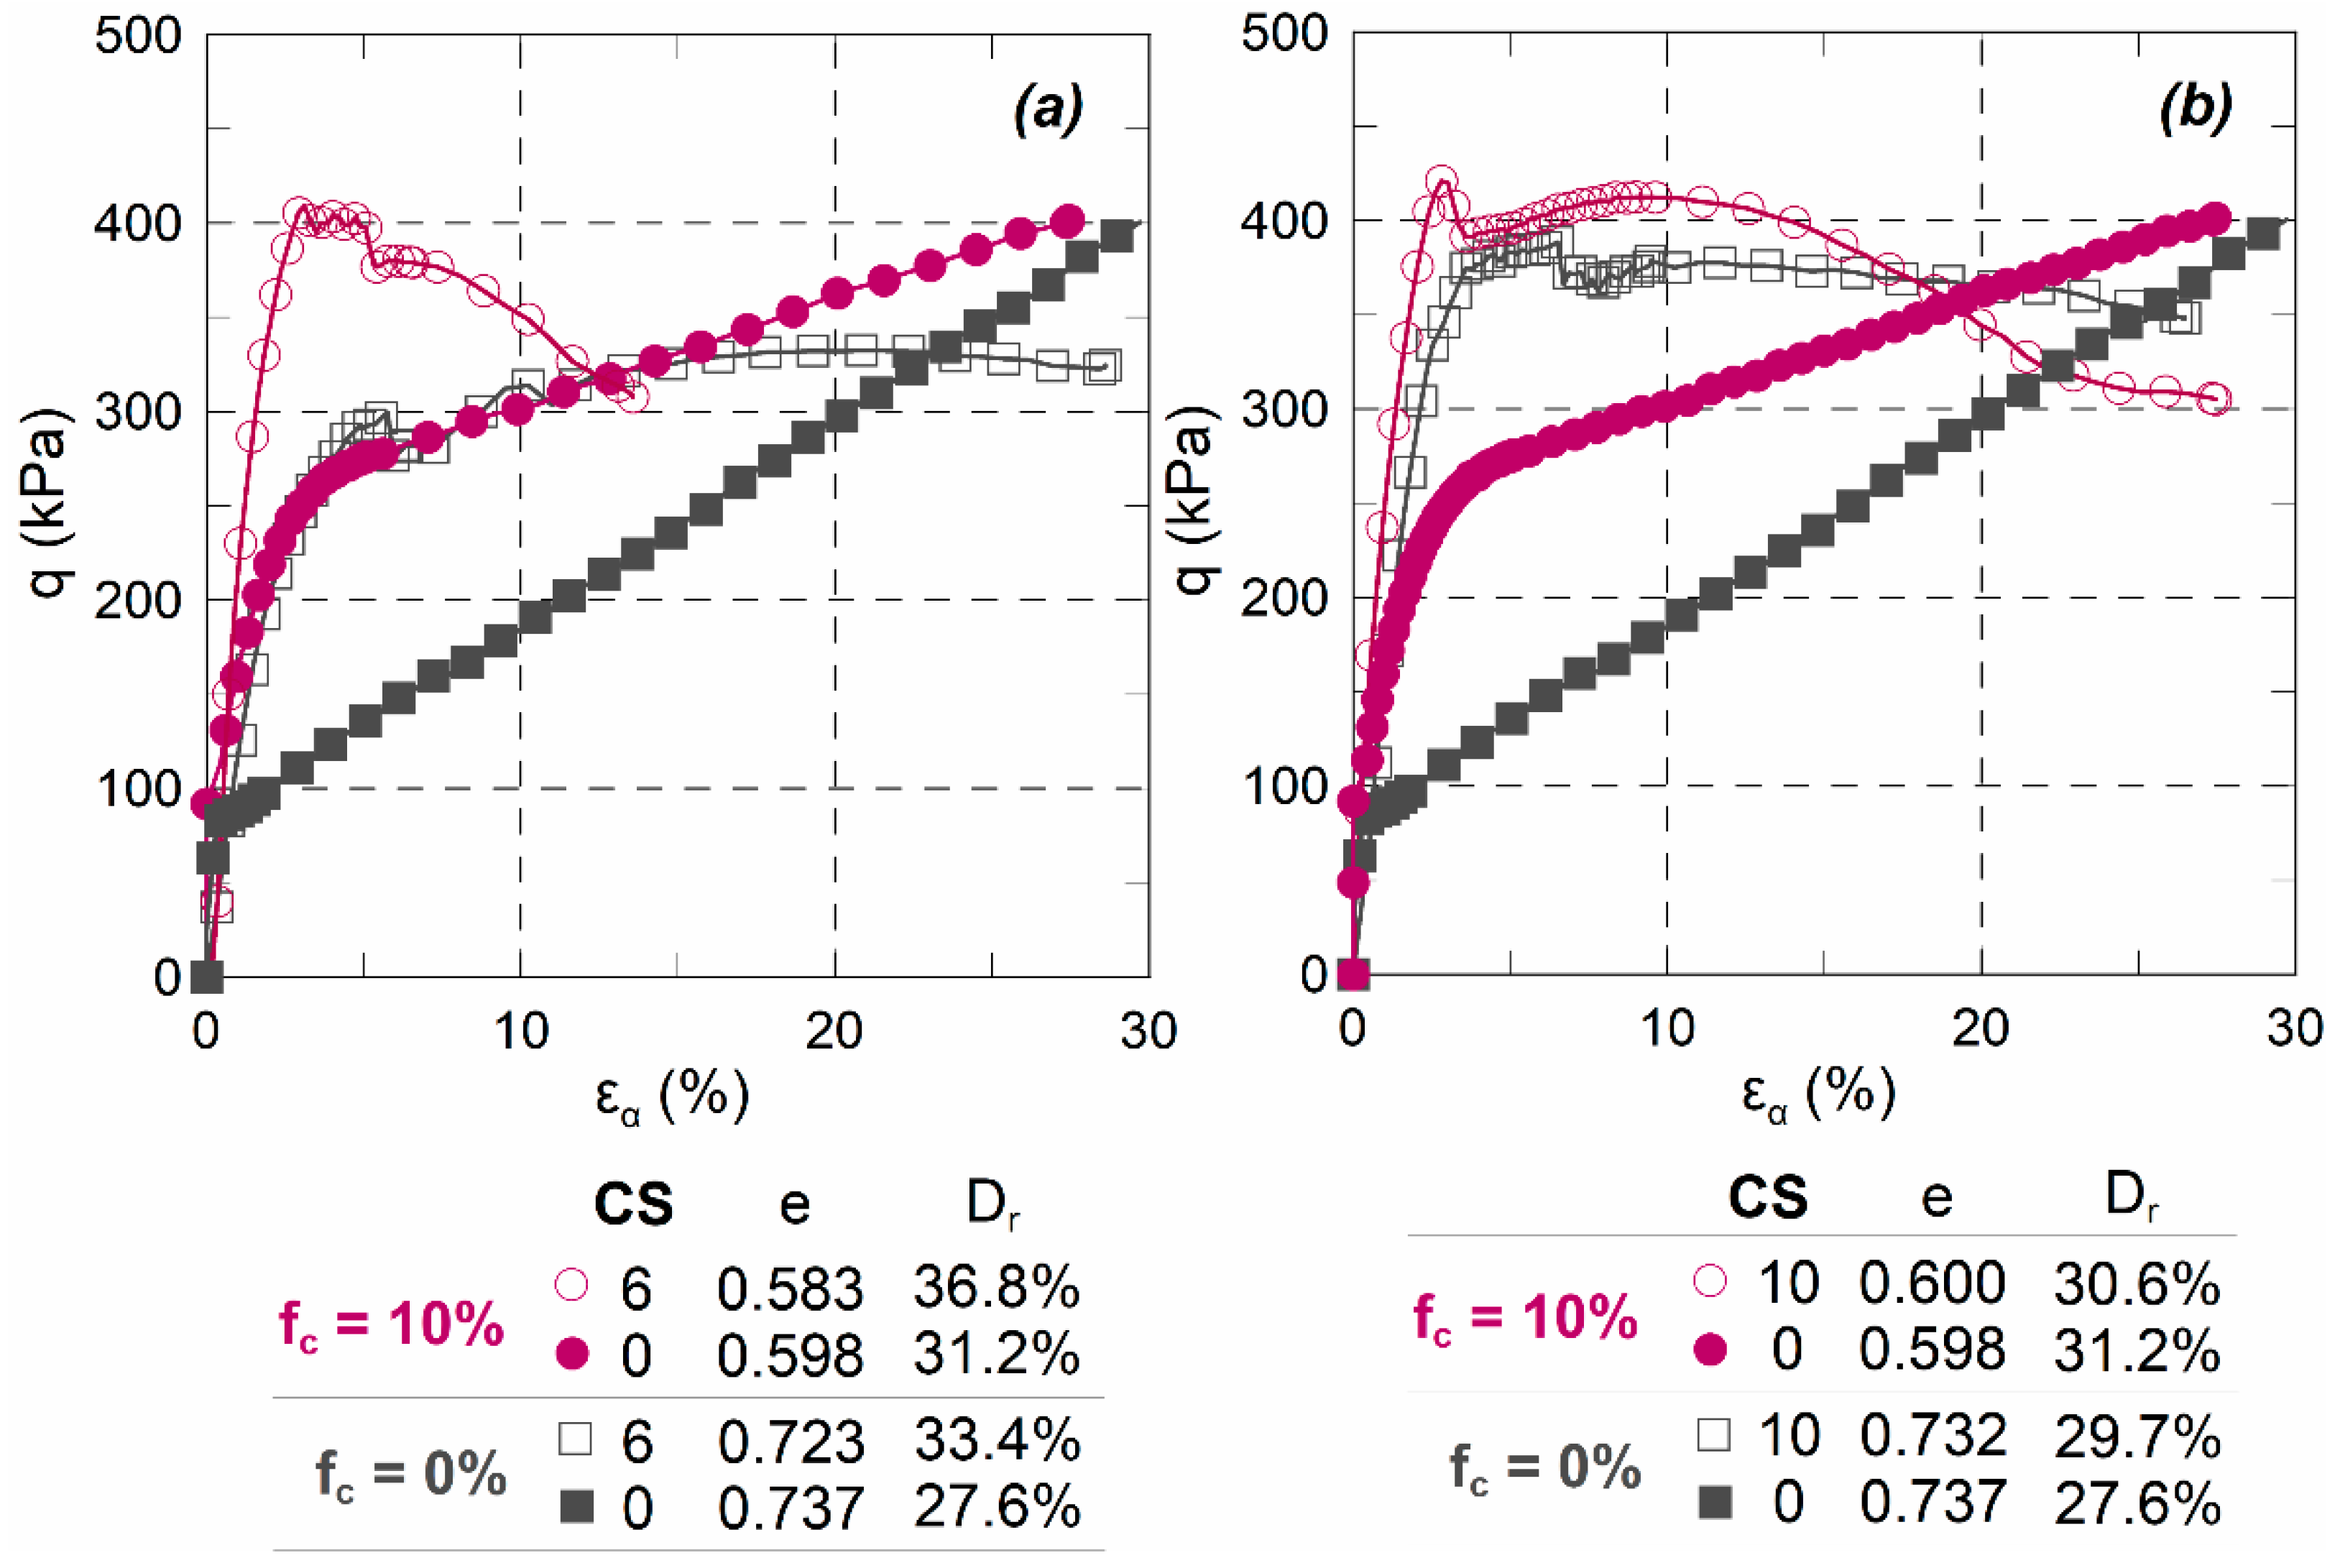
4.2. Monotonic Triaxial Tests

Figure 6 presents typical monotonic triaxial tests results in the q-εα plane for both stabilized and untreated silty sand as well as for the parent clean sand for comparison, at a loose state (Dr = 27.6–36.8%) under p′0 = 100 kPa. Comparison of the stabilized and untreated silty sand response shows distinct differences. CS stabilization results in a significant increase of both the initial stiffness and the strength of the silty sand initially.
In particular, the stabilized silty sand exhibits brittle behaviour, characterized by a significant initial increase of q with εα, up to a maximum value, qmax, mobilized at εα = 3–8%, followed by a decrease of q with further increasing εα. At larger strains of εα = 12% and 18% for CS = 6% and 10% respectively, the strength of the stabilized silty sand drops below that of the untreated silty sand.
In comparison with the stabilized parent clean sand, both the qmax and the initial stiffness of the stabilized silty sand are slightly increased at both CS concentrations. This increase is more pronounced at the lowest studied CS = 6% concentration. Yet, with increasing εα, the stabilized silty sand experiences a more unstable response compared to the parent sand, with significantly reduced ultimate q values as compared to qmax. Therefore, it is indicated that the presence of fines results in a more brittle response of the CS-stabilized soil. Moreover, for the specific densities shown in Figure 6, the above εα values up to which the improvement of the CS stabilization is observed for the silty sand are lower than the corresponding εα values of 23% and 26% at CS = 6% and 10%, respectively, for the clean sand.
Figure 7 summarizes the results from monotonic triaxial tests on both stabilized and untreated silty sand. In particular, Figure 7 shows the effect of soil density on the undrained shear strength, su = q/2, of both untreated and stabilized specimens with CS = 6% and 10% at p′0 = 100 kPa. For the stabilized specimens, the reported su corresponds to qmax, which was mobilized at a range of εα = 3–17%. For the untreated specimens, the undrained shear strength at critical state was mobilized at a range of εα = 10–30%. For this reason, for the untreated specimens, su presents the undrained shear strength corresponding to the Phase Transformation state (point of transition from a contractive to a dilative response, which takes place at a minimum p′), su,PT, which was mobilized at a comparable range of εα = 1–13%. In order to assess the effect of confining pressure on the response of stabilized specimens, the su values derived from unconfined compression tests are also presented.
Although the available data allow comparison only at a loose state, they indicate that there is a distinct difference between the behaviour of the stabilized and the untreated specimens. At a loose state and under the same p′0 = 100 kPa, the su,max of the stabilized specimens is considerably higher than the su,PT of the untreated specimens. In particular, at CS = 10% and at a very loose state (Dr = 9.9%), su,max is 6.7 times the su,PT. While the behaviour of the stabilized silty sand is not significantly influenced by density, it is strongly stress dependent. For the studied range of densities, the increase of confining pressure from 0 kPa to 100 kPa results in five times higher values of su. Increasing CS concentration from 6% to 10% does not influence significantly the su values.
For the stabilized specimens with CS = 6%, it is indicated that the presence of fines may further improve the su values, though slightly. This may be attributed to the increased contacts between soil grains in the silty sand as compared to the parent clean sand. At the highest studied CS = 10% concentration, the su values of both the stabilized silty and the parent clean sand practically coincide, indicating that the effect of soil particle-to-particle friction diminishes with increasing CS concentration, and the response is governed mainly by the gelled CS inside the soil pores.

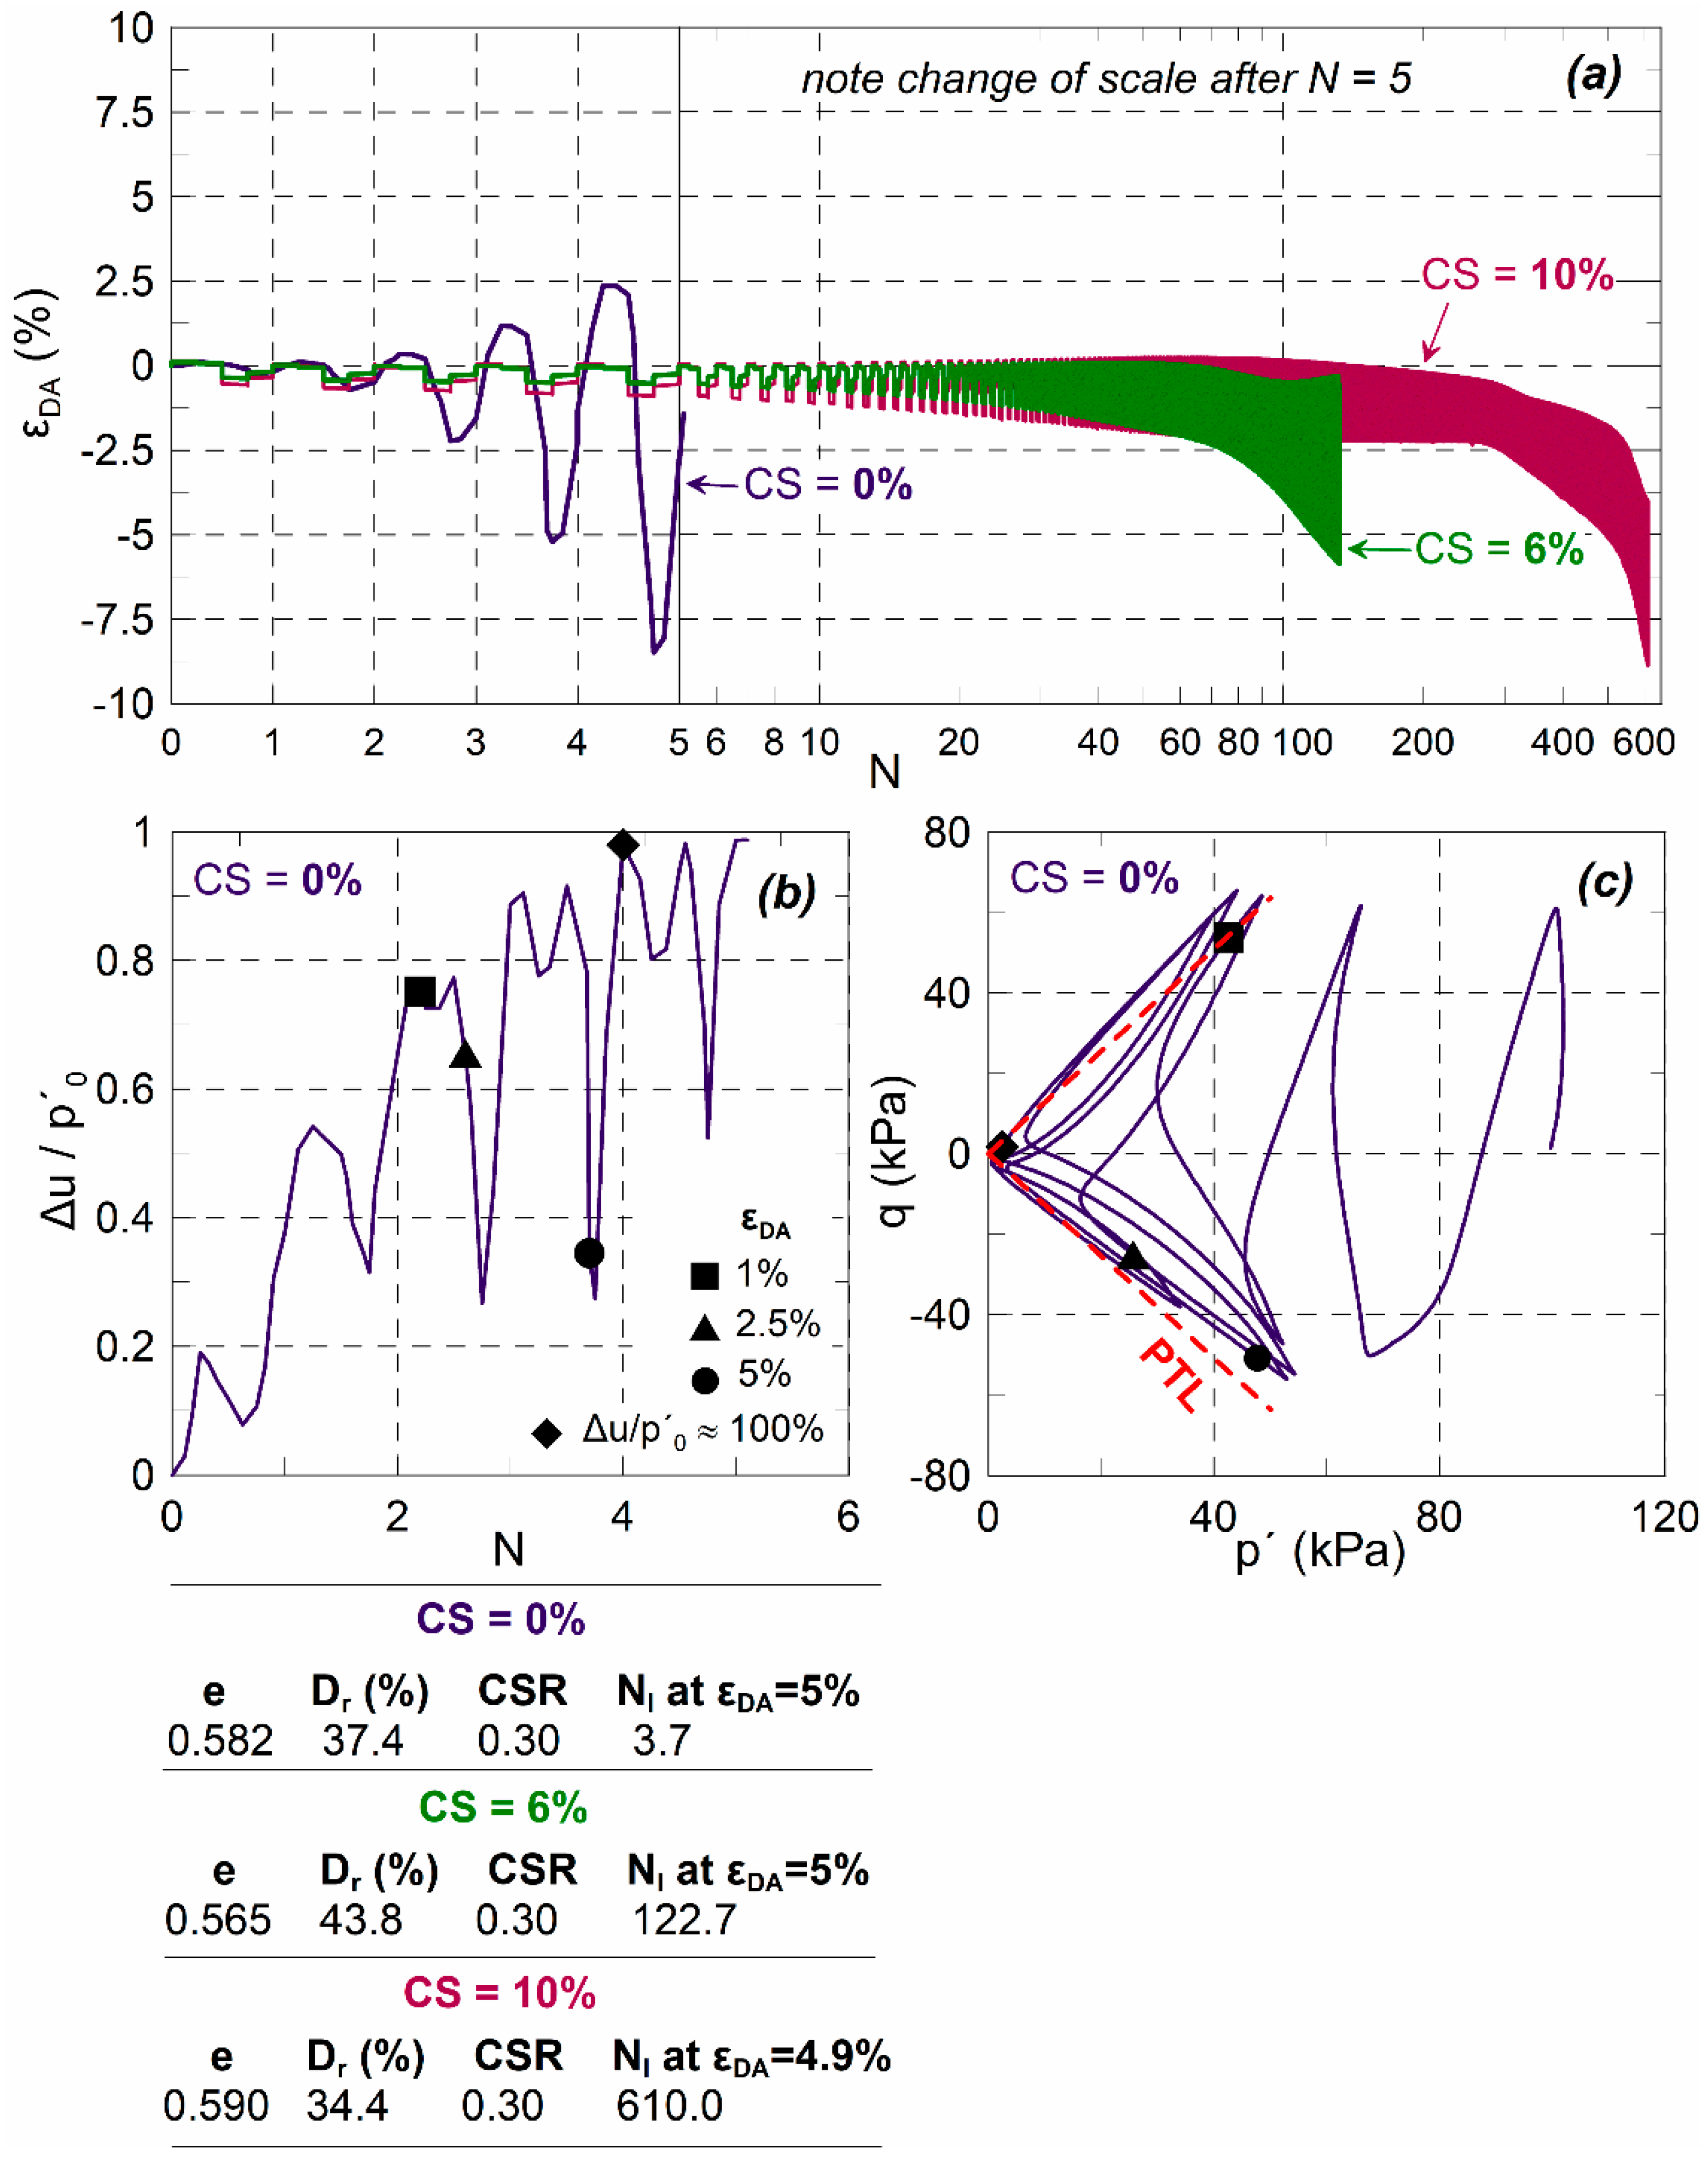
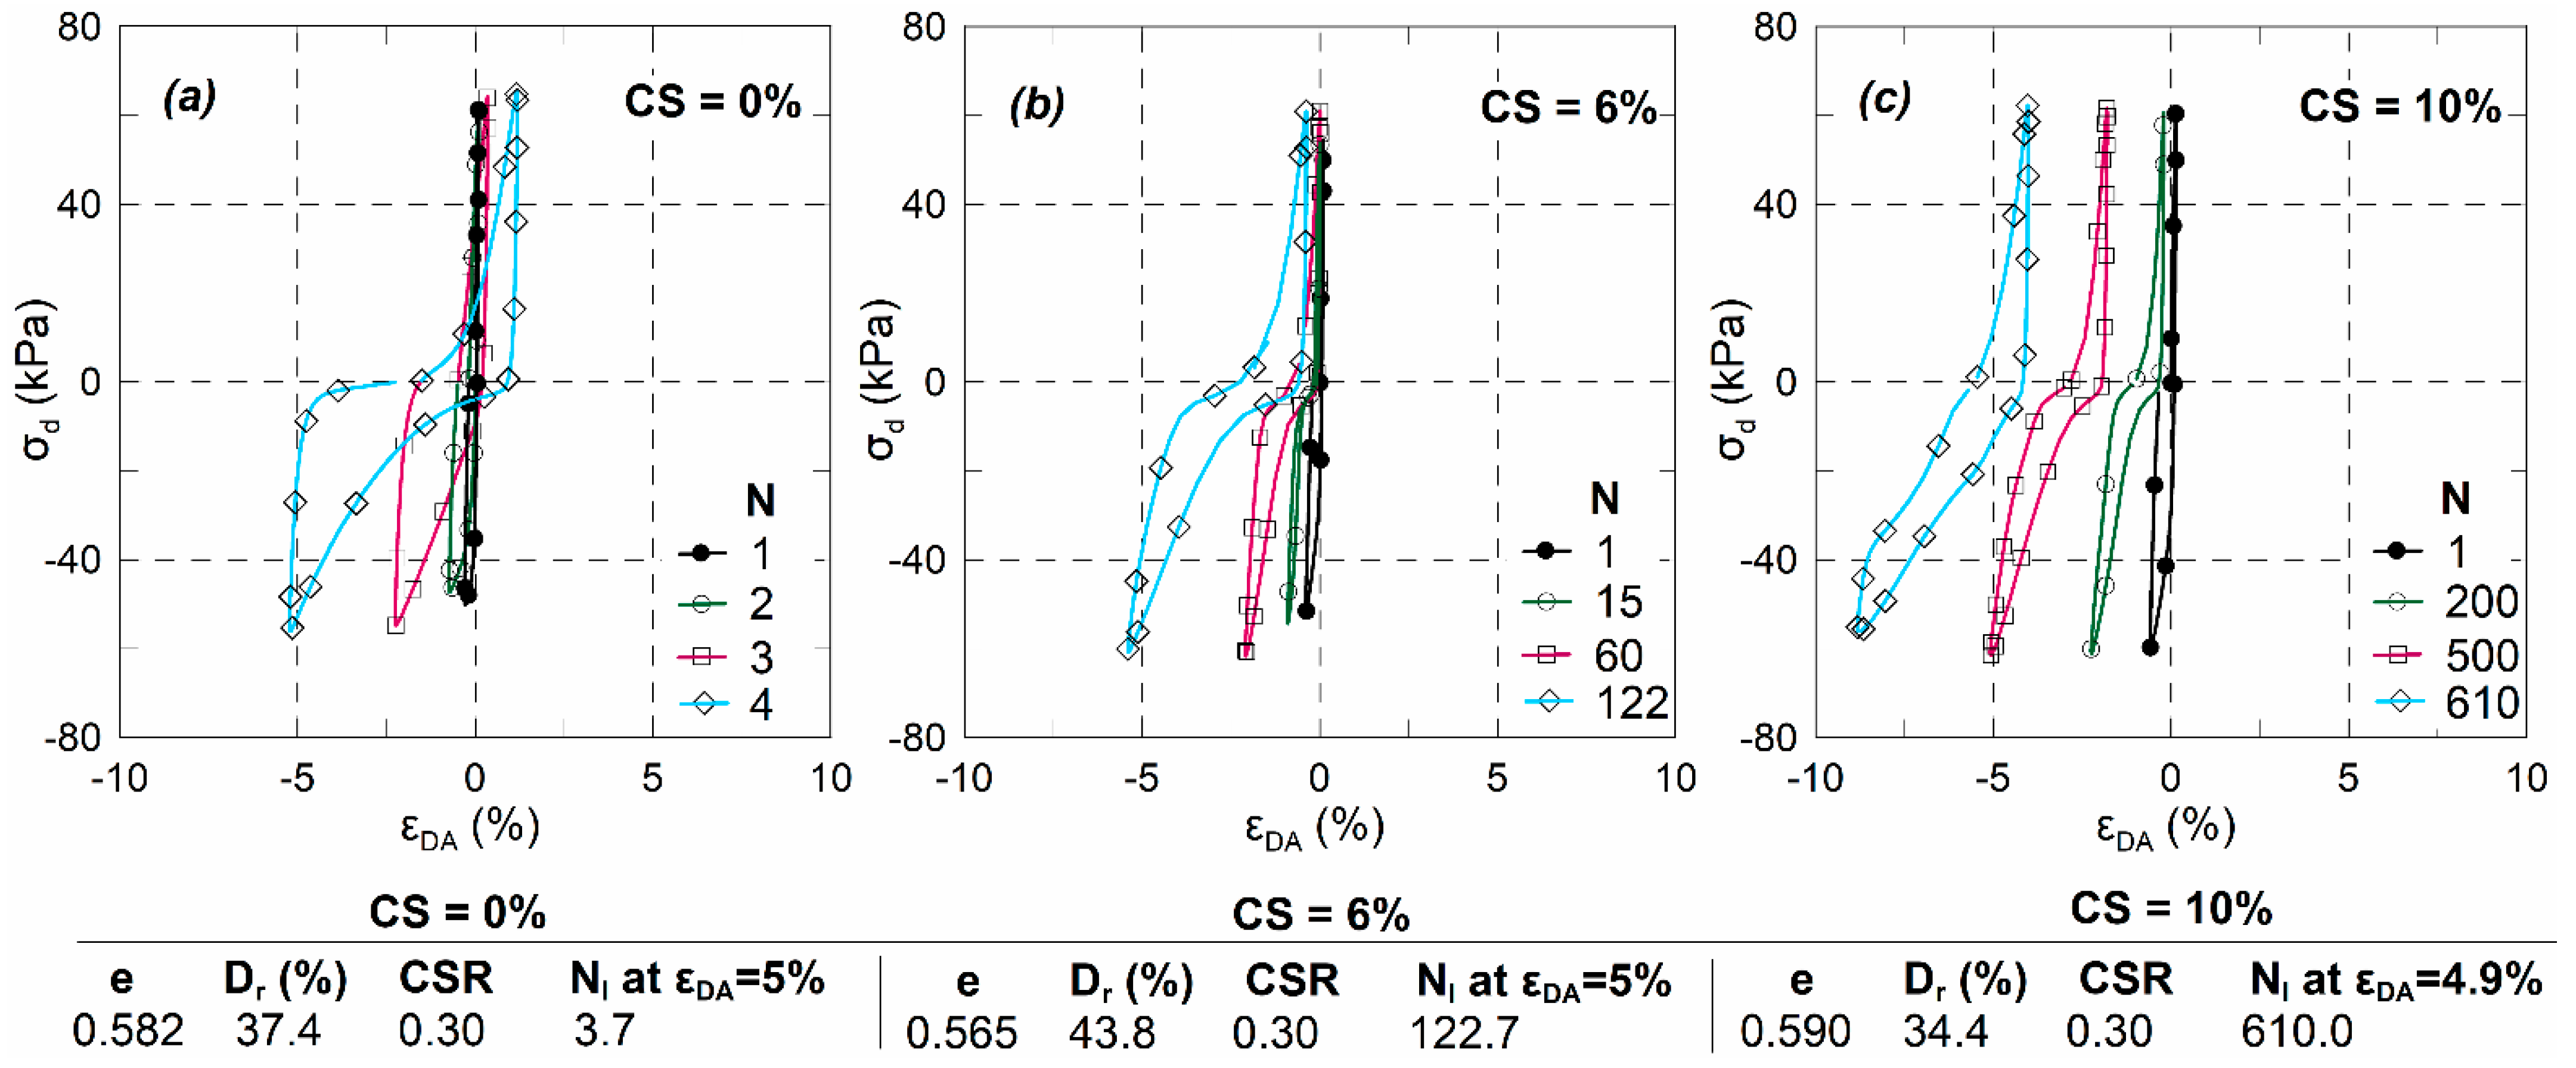
4.3. Cyclic Triaxial Tests

Figure 8 presents results for the cyclic response of loose stabilized and untreated silty sand subjected to the same cyclic stress ratio, CSR = 0.30 under p′0 = 100 kPa.
During cyclic loading, the untreated specimen exhibits a rapid increase of εDA to a value of 5% and reaches liquefaction in only a few cycles, Nl = 3.7. The values of N for εDA = 1, 2.5 and 5% are also very close. Moreover, the occurrence of εDA = 5% practically coincides with the development of Δu/p′0 ≥ 0.95, shown in Figure 8b. As a result, the effective stress path moves to the left, touches initially the Phase Transformation Line (PTL) at εDA = 1 and 2.5%, and then reaches the origin (p′ = 0) at εDA = 5% and Δu/p′0 ≥ 0.95, shown in Figure 8c. Over a short period of time, the specimen suffers significant degradation in its stress-strain response, as indicated by both the decrease of its stiffness (inclination of loops) and the increase of damping (area of loops), Figure 9a.
However, stabilization with even the lowest studied CS = 6% concentration results in a distinctively improved cyclic response of the silty sand. In particular, for the stabilized silty sand with CS = 6%, εDA increases gradually to a value of 5% and reaches liquefaction in a significantly larger number of N as compared to the untreated specimen, Nl = 122.7, shown in Figure 8a. For CS = 10%, liquefaction delays significantly since the stabilized loose specimen experiences a maximum εDA = 4.9% after Nl = 610. Moreover, there is a distinct difference between N at εDA = 1, 2.5, and 5% for both CS = 6% and 10%, as also reported in Table 4. As shown in Figure 9 for the stress-strain response of the stabilized specimens, stiffness degradation is significantly reduced as compared to the untreated silty sand, and this degradation is smaller at the higher CS concentration, CS = 10%. A very similar response was also observed for the stabilized parent clean sand [24].
Ref. [24] attributed the improved behaviour of the stabilized clean sand to the viscosity and compressibility of the CS gel network, which causes the soil to behave in the manner of solid-like, one-phase, visco-elastic material. In fact, the majority of stabilized specimens remained intact after cyclic loading even when εDA = 5% was reached.
Figure 10 presents the variation of CSR with N corresponding to εDA = 1, 2.5, and 5%, for stabilized and untreated silty sand at a loose state (Dr = 17.0–29.7%). Whereas in the case of the untreated specimen, number N practically coincides at all the above εDA levels, CS stabilization results in substantially increased N values with increasing εDA. This difference is more pronounced at the lower studied CSR values. This may indicate that cyclic loading at high CSR values may induce some minor bonding breakage at even εDA = 1% and therefore acceleration of axial strain. Furthermore, it is shown that at a given CSR value, the stabilized silty sand can sustain much larger N up to a given εDA level as compared to the untreated.
Figure 11 shows the liquefaction resistance values, CRR15 at p′0 = 100 kPa and their variation with Dr, for both stabilized and untreated silty sand as well as for the parent clean sand for comparison. CS stabilization of silty sand results in 1.81 times higher CRR15 values than the corresponding for the untreated silty sand. An increase in CS from 6% to 10% results in further improved liquefaction resistance only at Dr < 40%, approximately. At higher densities, the liquefaction resistance for both CS concentrations practically coincides.
Furthermore, for the studied range of densities shown in Figure 11, the effect of density on the liquefaction resistance is significantly reduced or diminished both for the stabilized and the untreated silty sand, whereas in the case of the parent clean sand, either stabilized or untreated, increasing density yields significantly higher CRR15 values.

4.4. Post-Cyclic Monotonic Triaxial Tests

Figure 12 shows the undrained shear strength, su,max, determined for stabilized specimens with both CS = 6% and 10% during monotonic loading, which was performed after their cyclic loading to at least εDA = 5%. The number of preceding loading cycles was N = 4–628, and the preceding accumulated strain was εDA = 5–13%. The above su,max is compared with the corresponding determined for stabilized specimens, which were not loaded cyclically prior to monotonic loading. It is shown that the preceding cyclic loading of the stabilized silty sand at both CS concentrations and at both loose- and medium-dense state induces practically no loss in their shear strength. A similar finding was also presented by [31] for clean sands at Dr = 50% stabilized with CS solutions of 10–25% concentration and cured for 28 days prior to cyclic loading. This observed post-cyclic monotonic response is also unaffected by the presence of 10% fines, as demonstrated by the similar su,max values for both the stabilized silty and parent clean sand. It is therefore indicated that the governing parameter in the monotonic response of the studied stabilized silty sand with 10% fines is neither density or soil grading but the bonding induced by CS inside the soil pores and between soil particles, which is shown to be unaffected by the accumulation of cyclic strains.

5. Discussion and Conclusions

The experimental work presented herein examined the effectiveness of stabilization of a silty sand with colloidal silica. In particular, the following remarks can be drawn from the analysis of the tests results:
(a)
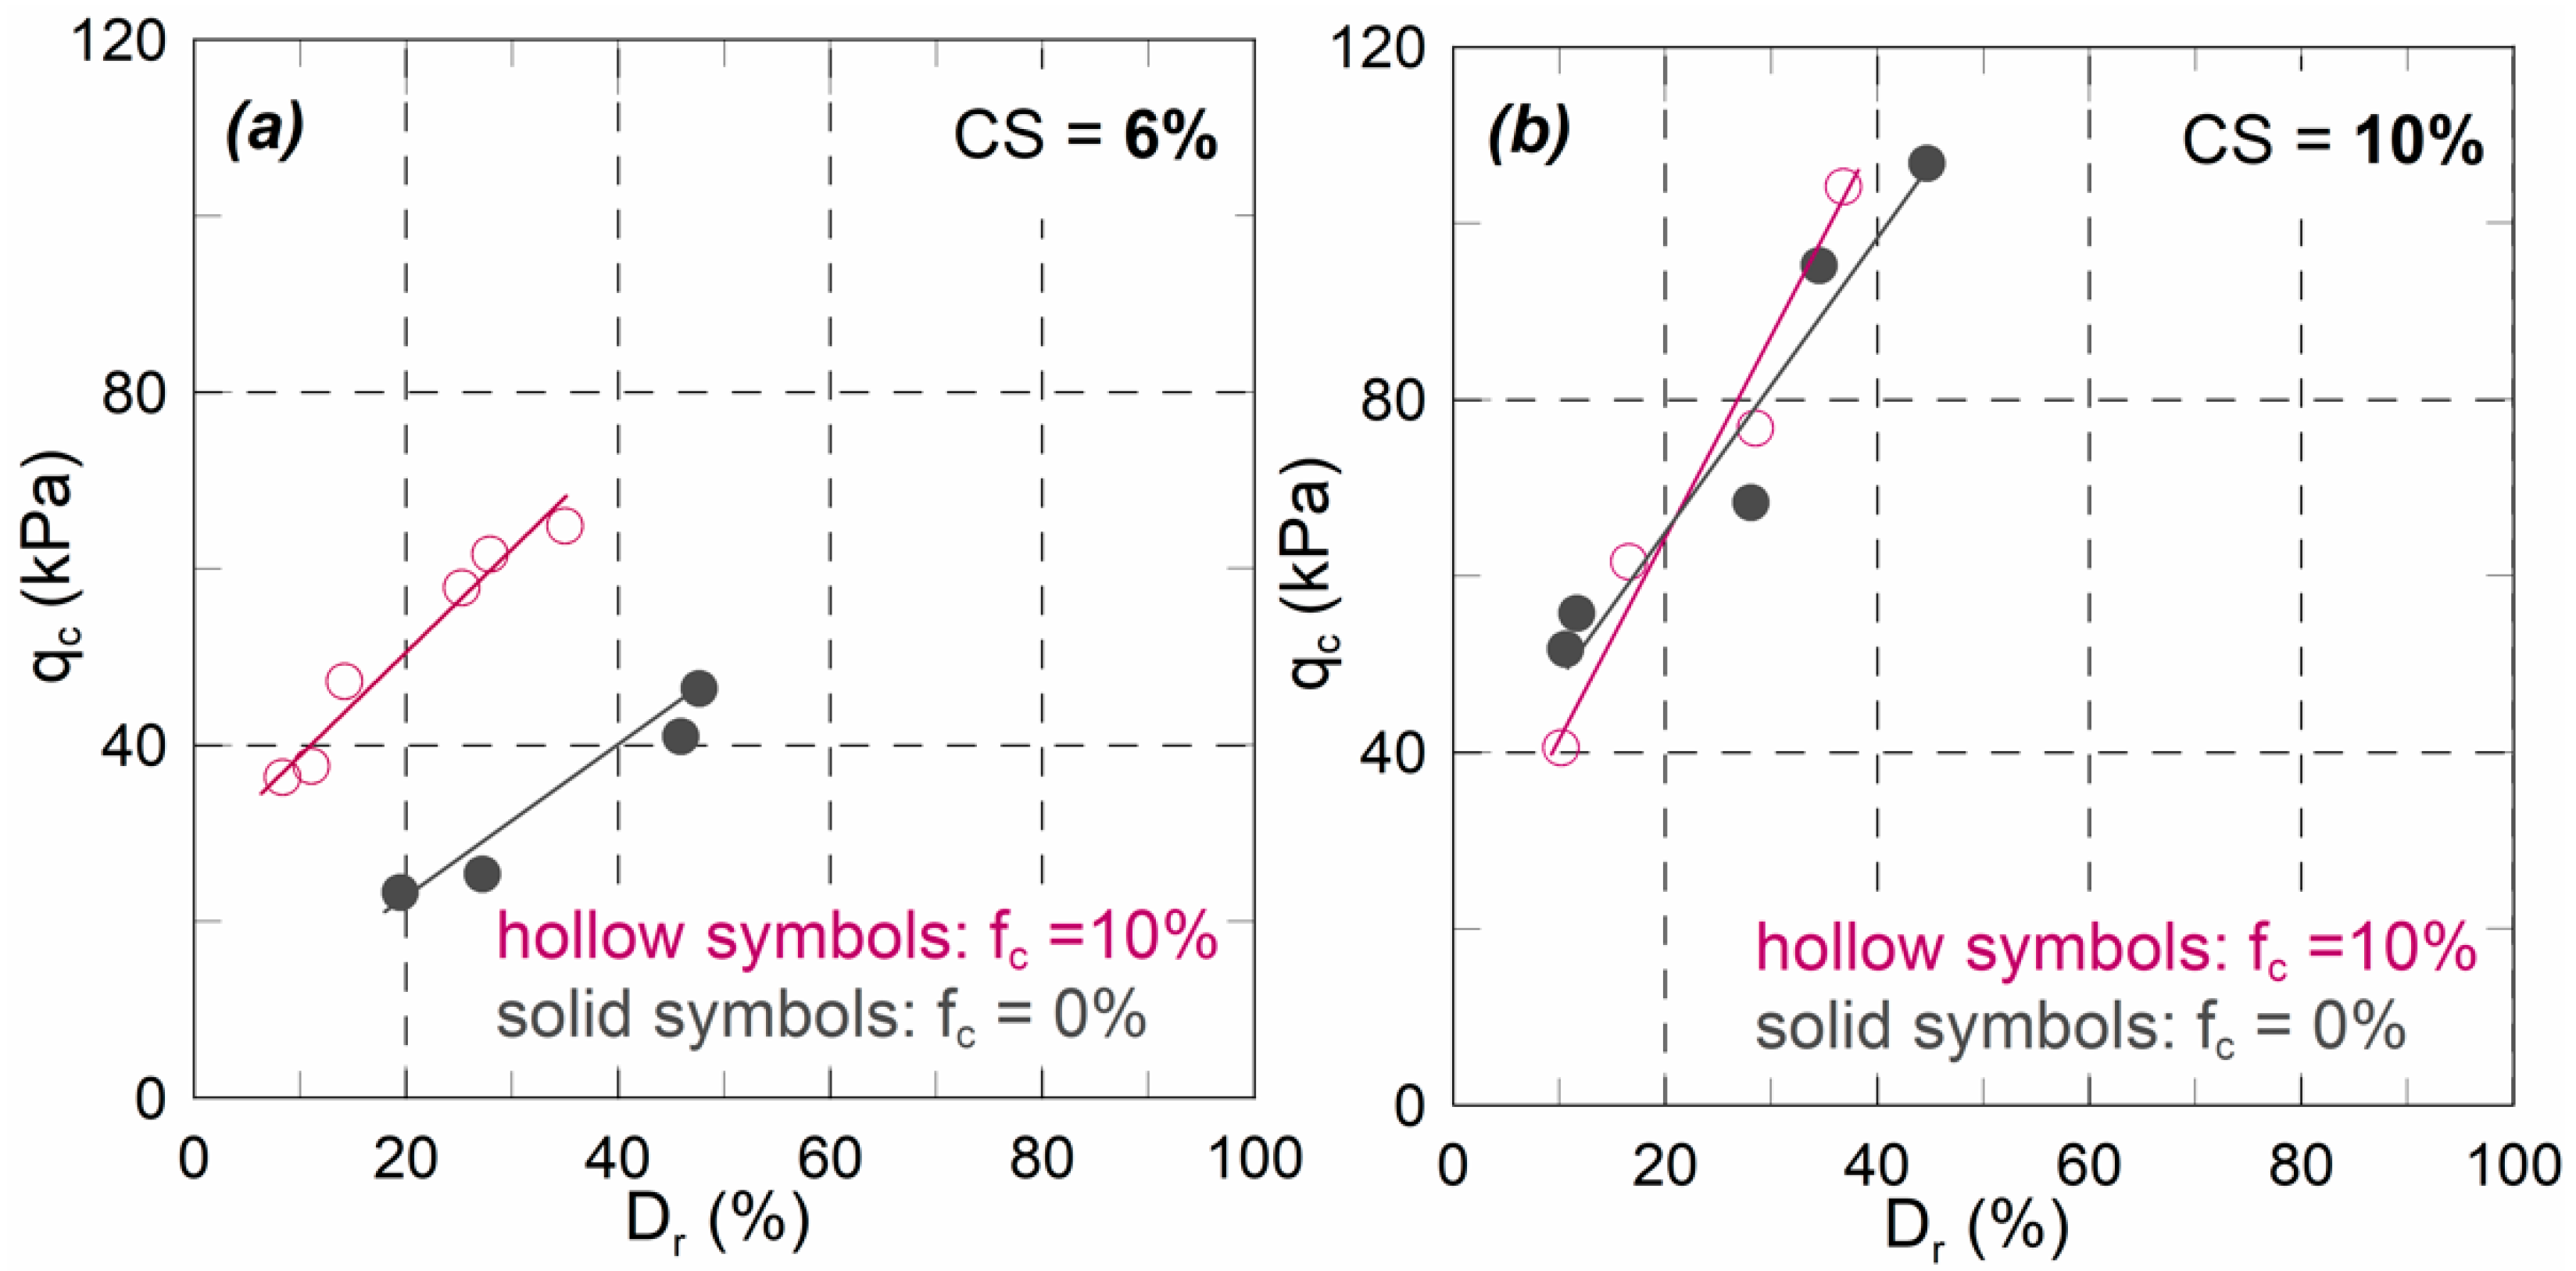
CS stabilized silty sand exhibits an unconfined compressive strength, which depends on both CS concentration and density;
(b)
Under undrained monotonic loading, the CS-stabilized silty sand exhibits brittle behaviour and increased maximum strength as compared to the strain-hardening behaviour of the untreated silty sand. Furthermore, for the studied range of densities, the su of the stabilized specimens is significantly higher, up to 6.7 times the corresponding su of the untreated silty sand, under the same p′0;
(c)
The undrained shear strength, su, of the stabilized silty sand is not considerably influenced by soil density variations, but it is significantly increased with increasing p′0;
(d)
CS stabilization of silty sand results in significantly increased liquefaction resistance as compared to the corresponding of the untreated silty sand. An increase in CS from 6% to 10% results in further improved CRR15 values only at Dr < 40%. At higher densities, the liquefaction resistance for both CS concentrations practically coincides;
(e)
CS-stabilized specimens exhibit increased deformation resistance to cyclic loading as compared to the untreated, which experience much larger εDA in fewer cycles; and
(f)
Post-cycling undrained monotonic shear strength of stabilized specimens is not affected by the accumulated strains (at least εDA = 5%) during the preceding cyclic loading, indicating that no deterioration of soil improvement occurs during cyclic loading.
In conclusion, colloidal silica stabilization of a loose to moderately dense silty sand with 10% fines improves significantly both its monotonic and cyclic response and thus reduces substantially its liquefaction potential. However, increasing CS concentration from 6% to 10% does not significantly improve either the monotonic or the cyclic response of the stabilized soil. Thus, stabilization with the lowest tested CS = 6% concentration may be considered effective in terms of both cost and performance.

Author Contributions

Investigation, A.V.; Methodology, A.V. and T.T.; Validation, A.V. and T.T.; Writing—original draft, A.V.; Writing—review & editing, A.V. and T.T. Both authors have read and agreed to the published version of the manuscript.

Funding

This research was partially funded by the European Union (European Social Fund—ESF) and Greek national funds through the Operational Program “Education and Lifelong Learning” of the National Strategic Reference Framework (NSRF)—Research Funding Program: THALES. Investing in knowledge society through the European Social Fund.

Conflicts of Interest

The authors declare no conflict of interest.

References

  1. Gallagher, P.M.; Mitchell, J.K. Influence of colloidal silica grout on liquefaction potential and cyclic undrained behavior of loose sand. Soil Dyn. Earthq. Eng. 2002, 22, 1017–1026. [Google Scholar] [CrossRef]
  2. Gallagher, P.M. Passive Site Remediation for Mitigation of Liquefaction Risk. Ph.D. Dissertation, Virginia Polytechnic Institute and State University, Blacksburg, VA, USA, 2000. [Google Scholar]
  3. Agapoulaki, G.; Papadimitriou, A.G. Rheological properties of colloidal silica grout for passive stabilization against liquefaction. J. Mater. Civ. Eng. 2018, 30, 04018251. [Google Scholar] [CrossRef]
  4. Wong, C.; Pedrotti, M.; El Mountassir, G.; Lunn, R.J. A study on the mechanical interaction between soil and colloidal silica gel for ground improvement. Eng. Geol. 2018, 243, 84–100. [Google Scholar] [CrossRef] [Green Version]
  5. Batilas, A.; Pantazopoulos, I.; Athanasopoulos, G. Effects of colloidal silica grouting on the dynamic properties of sandy soils. In Proceedings of the 16th European Conference Earthquake Engineering, Thessaloniki, Greece, 18–21 June 2018. [Google Scholar]
  6. Ciardi, G.; Bardotti, R.; Vannucchi, G.; Madiai, C. Effects of high-diluted colloidal silica grouting on the behaviour of a liquefiable sand. Geotech. Res. ICE 2020, 7, 193–208. [Google Scholar] [CrossRef]
  7. Ata, A.; Vipulanandan, C. Factors affecting mechanical and creep properties of silicate-grouted sands. J. Geot. Geoenviron. Eng. 1999, 125, 868–876. [Google Scholar] [CrossRef]
  8. Ochoa-Cornejo, F.; Bobet, A.; Johnston, C.; Santagata, M.; Sinfield, J.V. Dynamic properties of a sand-nanoclay composite. Géotechnique 2020, 70, 210–225. [Google Scholar] [CrossRef]
  9. Terzis, D.; Laloui, L. A decade of progress and turning points in the understanding of bio-improved soils: A review. Geomech. Energy Environ. 2019, 19, 100116. [Google Scholar] [CrossRef]
  10. Iler, R.K. The Chemistry of Silica: Solubility, Polymerization, Colloid and Surface Properties and Biochemistry; John Wiley & Sons: New York, NY, USA, 1979. [Google Scholar]
  11. Huang, Y.; Wang, L. Laboratory investigation of liquefaction mitigation in silty sand using nanoparticles. Eng. Geol. 2016, 204, 23–32. [Google Scholar] [CrossRef]
  12. Whang, J.M. Chemical-based barrier materials. In Assessment of Barrier Containment Technologies for Environmental Remediation Applications; Rumer, R.R., Mitchell, J.K., Eds.; National Technical Information Service: Springfield, VA, USA, 1995; Section 9. [Google Scholar]
  13. Gallagher, P.M.; Lin, Y. Colloidal silica transport through liquefiable porous media. J. Geotech. Geoenv. Eng. 2009, 135, 1702–1712. [Google Scholar] [CrossRef]
  14. Persoff, P.; Moridis, J.; Apps, J.A.; Pruess, K. Evaluation tests for colloidal silica for use in grouting applications. Geotech. Test. J. 1998, 21, 264–269. [Google Scholar] [CrossRef] [Green Version]
  15. Persoff, P.; Apps, J.; Moridis, J.; Whang, J.M. Effect of dilution and contaminants on sand grouted with colloidal silica. J. Geotech. Geoenviron. Eng. 1999, 125, 16545. [Google Scholar] [CrossRef] [Green Version]
  16. Hench, L.L.; West, J.K. The sol-gel process. Chem. Rev. J. 1990, 90, 33–72. [Google Scholar] [CrossRef]
  17. Jurinak, J.J.; Summers, L.E. Oilfield applications of colloidal silica gel. J. SPE Prod. Eng. 1991, 6, 406–412. [Google Scholar] [CrossRef]
  18. Noll, M.R.; Bartlett, C.; Dochat, T.M. In situ permeability reduction and chemical fixation using colloidal silica. In Proceedings of the 6th National Outdoor Conference Aquifer Restoration, Las Vegas, NV, USA, 11–13 May 1992. [Google Scholar]
  19. Yonekura, R.; Kaga, M. Current chemical grout engineering in Japan. In Grouting, Soil Improvement and Geosynthetics; Borden, R.H., Holtz, R.O., Juran, I., Eds.; American Society of Civil Engineers: New York, NY, USA, 1992; GSP 30; pp. 725–736. [Google Scholar]
  20. Bolisetti, T.; Reitsma, S.; Balachandar, R. Experimental Investigations of Colloidal Silica Grouting in Porous Media. J. Geotech. Geoenviron. Eng. 2009, 135, 697–700. [Google Scholar] [CrossRef]
  21. Butrón, C.; Axelsson, M.; Gustafson, G. Silica sol for rock grouting: Laboratory testing of strength, fracture behaviour and hydraulic conductivity. Tunn. Undergr. Space Technol. 2009, 24, 603–607. [Google Scholar] [CrossRef]
  22. Butrón, C.; Gustafson, G.; Fransson, Å.; Funehag, J. Drip sealing of tunnels in hard rock: A new concept for the design and evaluation of permeation grouting. Tunn. Undergr. Space Technol. 2010, 25, 114–121. [Google Scholar] [CrossRef]
  23. Georgiannou, V.N.; Pavlopoulou, E.M.; Bikos, Z. Mechanical behaviour of sand stabilised with colloidal silica. Proc. Inst. Civil. Eng. Geotech. Res. ICE 2017, 4, 1–11. [Google Scholar] [CrossRef] [Green Version]
  24. Vranna, A.; Tika, T.; Papadimitriou, A. Laboratory investigation into the monotonic and cyclic behaviour of a clean sand stabilised with colloidal silica. Géotechnique 2020, 1–14. [Google Scholar] [CrossRef]
  25. Spagnoli, G. A review of soil improvement with nonconventional grouts. Int. J. Geotech. Eng. 2020, 15, 273–287. [Google Scholar] [CrossRef]
  26. Jefferies, M.; Been, K. Soil Liquefaction-A Critical State Approach; Taylor and Francis: London, UK, 2006. [Google Scholar]
  27. Díaz-Rodríguez, J.A.; Izarraras, A.V.M.; Bandini, P.; Lopez-Molina, J.A. Cyclic strength of a natural liquefiable sand stabilized with colloidal silica grout. Can. Geot. J. 2008, 45, 1345–1355. [Google Scholar] [CrossRef]
  28. Moradi, G.; Seyedi, S. Evaluation of uniform delivery of colloidal nano-Silica stabilizer to liquefiable silty sands. Int. J. Nano Dimens. 2015, 6, 501–508, (Special Issue for NCNC, December 2014, Iran). [Google Scholar] [CrossRef]
  29. Bao, X.; Jin, Z.; Cui, H.; Chen, X.; Xie, X. Soil liquefaction mitigation in geotechnical engineering: An overview of recently developed methods. Soil Dyn. Earthq. Eng. 2019, 120, 273–291. [Google Scholar] [CrossRef]
  30. Zhao, M.; Liu, G.; Zhang, C.; Guo, W.; Luo, Q. State-of-the-art of colloidal silica-based soil liquefaction mitigation: An emerging technique for ground improvement. Appl. Sci. 2020, 10, 15. [Google Scholar] [CrossRef] [Green Version]
  31. Mollamahmutoglu, M.; Yilmaz, Y. Pre- and post-cyclic loading strength of silica grouted sand. J. Geot. Eng. 2010, 163, 343–348. [Google Scholar] [CrossRef]
  32. Triantafyllos, P.; Georgiannou, V.; Pavlopoulou, E.-M.; Dafalias, Y. Strength and dilatancy of sand before and after stabilization with colloidal-silica gel. Géotechnique 2021, 1–15. [Google Scholar] [CrossRef]
  33. Spencer, L.M.; Rix, G.J.; Gallagher, P. Colloidal silica gel and sand mixture dynamic properties. In Geotechnical Earthquake Engineering and Soil Dynamics IV(GSP 181); American Society of Civil Engineers: Sacramento, CA, USA, 2008. [Google Scholar] [CrossRef]
  34. Towhata, Y. Developments of soil improvement technologies for mitigation of liquefaction risk. In Earthquake Geotechnical Engineering; Pitilakis, K.D., Ed.; Springer: Dordrecht, The Netherlands, 2007; pp. 355–383. [Google Scholar]
  35. Gallagher, P.M.; Finsterle, S. Physical and numerical model of colloidal silica injection for passive site stabilization. Vadose Zone J. 2004, 3, 917–925. [Google Scholar] [CrossRef]
  36. Silverbond. Dedusted Crystalline Silica Flour Technical Data, CAS-Nr.: 14808-60-7. 2013. Available online: http://www.sibelco.be (accessed on 16 July 2021).
  37. British Standards Institution. Determination of permeability by the constant-head method. In Methods of Test for Soils for Civil Engineering Purposes; British Standards Institution: London, UK, 1990; Volume 1377, Part 5; pp. 11–15. [Google Scholar]
  38. Vranna, A.; Tika, T. Laboratory improvement of liquefiable sand by colloidal silica and weak cementation. Ground Improv. 2019. [Google Scholar] [CrossRef]
  39. Sydansk, A.D. A newly developed chromium (III) technology. SPE Reserv. Engng 1990, 5, 346–352. [Google Scholar] [CrossRef]
  40. Koch, A.J. Model testing of passive site stabilization. Master’s Dissertation, Civil Engineering Department, Drexel University, Philadelphia, PA, USA, 2002. [Google Scholar]
  41. Vranna, A.D. Laboratory Investigation into the Behaviour of Improved Liquefiable Soils under Monotonic and Cyclic Loading. Ph.D. Dissertation, Aristotle University of Thessaloniki, Thessaloniki, Greece, 2016. (In Greek). [Google Scholar]
  42. Ladd, R.S. Preparing test specimens using undercompaction. Geot. Test. J. 1978, 1, 16–23. [Google Scholar]
  43. British Standards Institution. Test 12, Shear strength tests. In Methods of Test for Soils for Civil Engineering Purposes; British Standards Institution: London, UK, 1990; Volume 1377, Part 7; pp. 1–48. [Google Scholar]
  44. Ishihara, K. Liquefaction and flow failure during earthquakes. Géotechnique 1993, 43, 351–415. [Google Scholar] [CrossRef]
Figure 1. SEM view of M31 (left) and D6 (right) soil particles (zoom ×500).
Geotechnics 01 00013 g001
Figure 2. Grain-size distribution of the tested silty sand, SF10, and its components, M31 and D6.
Geotechnics 01 00013 g002
Figure 3. Variation of gel time with NaCl concentration for solutions with CS = 10% at pH ≈ 6.0 and comparison with the corresponding results from literature.
Geotechnics 01 00013 g003
Figure 4. Typical unconfined compression tests results for stabilized silty sand with (a) CS = 6% and (b) CS = 10%. Comparison with corresponding results for the parent clean sand.
Geotechnics 01 00013 g004
Figure 5. Variation of qc with relative density, Dr, for stabilized silty sand with (a) CS = 6% and (b) CS = 10%. Comparison with corresponding results for the parent clean sand.
Geotechnics 01 00013 g005
Figure 6. Typical triaxial monotonic tests results for stabilized and untreated silty sand with (a) CS = 6% and (b) CS = 10% at p′0 = 100 kPa. Comparison with corresponding results for the parent clean sand.
Geotechnics 01 00013 g006
Figure 7. Variation of the undrained peak shear strength, su, with Dr, for stabilized and untreated silty sand with (a) CS = 6% and (b) CS = 10% at p′0 = 100 kPa. Comparison with corresponding results for the parent clean sand.
Geotechnics 01 00013 g007
Figure 8. (a) Evolution of εDA with N for untreated silty sand and stabilized silty sand with CS = 6 and 10% at Dr = 34.4–37.4% and CSR = 0.30 under p′0 = 100 kPa. (b) Evolution of Δu/p′0, with N and (c) variation of q, with p′, for the untreated silty sand of Figure 8a.
Geotechnics 01 00013 g008
Figure 9. Stress-strain response, σd–εDA, at various cycles up to εDA = 5%, for (a) untreated silty sand, (b) stabilized silty sand with CS = 6%, and (c) stabilized silty sand with CS = 10%, at CSR = 0.30 and Dr = 34.4–43.8%.
Geotechnics 01 00013 g009
Figure 10. Variation of cyclic stress ratio, CSR, with number of cycles, N, required to reach εDA = 1, 2.5, and 5% for (a) untreated silty sand, (b) stabilized silty sand with CS = 6%, and (c) CS = 10%, at a loose state (Dr = 17.0–29.7%).
Geotechnics 01 00013 g010
Figure 11. Variation of cyclic resistance ratio, CRR15 with Dr, for stabilized and untreated silty sand with (a) CS = 6% and (b) CS = 10%. Comparison with corresponding results for the parent clean sand.
Geotechnics 01 00013 g011
Figure 12. Variation of the undrained shear strength, su,max, with Dr, for stabilized silty sand with (a) CS = 6% and (b) CS = 10%, after monotonic loading and after monotonic loading that followed cyclic softening. Comparison with corresponding results for the parent clean sand.
Geotechnics 01 00013 g012
Table 1. Physical properties of tested silty sand (SF10) and its components (M31, D6).
Soilfc (%)eminemaxγdmin (kΝ/m3)γdmax (kΝ/m3)GsCud50 (mm)PIk (m/s)
SF10100.4140.68215.4718.402.6534.130.3001.33∙10−4
M3100.5580.80514.4316.712.6551.500.3105.16∙10−4
D663----2.6392.730.060-
Table 2. Summary of undrained monotonic triaxial tests on CS-stabilized silty sand.
TestCS (%)eDr (%)su-max (kPa)su-ult (kPa)εα (%) at su-maxεα (%) at su-ult
MT-S6-160.63816.3165.7153.14.26.4
MT-S6-260.63417.8177.7167.45.910.8
MT-S6-360.58336.8204.6189.93.16.1
MT-S10-1100.6559.9151.4151.47.77.7
MT-S10-2100.60030.6210.5206.23.89.0
MT-S10-3100.55149.1231.0230.55.06.0
p′0 =100 kPa for all tests. e, void ratio prior to shearing; Dr, relative density prior to shearing; su-max, qu-max/2: maximum undrained shear strength; su-ult, qu-ult/2: ultimate undrained shear strength; εα at su-max, axial deformation corresponding to su-max; εα at su-ult, axial deformation corresponding to su-ult.
Table 3. Summary of undrained monotonic triaxial tests on untreated silty sand.
TesteDr (%)qcs (kPa)p′cs (kPa)qpt (kPa)p′pt (kPa)εα (%) at qpt
MT-10.53056.61291.2992.4---
MT-20.59632.1763.6584.5---
MT-30.59731.9422.4332.8---
MT-40.59831.2394.5305.0---
MT-50.61026.7161.6124.4---
MT-60.63019.2112.389.475.958.37
MT-70.64015.669.254.154.242.110.3
MT-80.64314.556.440.350.134.213.1
MT-90.6598.634.927.235.627.49.0
p′0 =100 kPa for all tests. e, void ratio prior to shearing; Dr, relative density prior to shearing; qcs, p′cs, deviatoric and mean effective stress at the critical state; qpt, p′pt, deviatoric and mean effective stress at the phase transformation state; εα at qpt, axial deformation corresponding to qpt.
Table 4. Summary of cyclic triaxial tests on CS-stabilized silty sand.
TestCS (%)eDr (%)CSRN1%N2.5%Nlsu-max (kPa)
CT-S6-160.63617.20.400.70.83.8165.1
CT-S6-260.62421.80.320.87.818.3195.9
CT-S6-360.61624.60.271.714.846.7-
CT-S6-460.57241.20.430.715.851.9164.8
CT-S6-560.56543.80.3018.680.7122.7224.7
CT-S6-660.56244.60.2510.854.3132.5202.3
CT-S6-760.53754.00.620.61.61.8233.6
CT-S6-860.51363.10.600.60.70.8272.1
CT-S10-1100.63617.00.600.60.71.7219.2
CT-S10-2100.62023.00.310.77.349.8193.8
CT-S10-3100.61724.20.430.71.89.8140.2
CT-S10-4100.59034.40.306.7384.6640.0177.5
CT-S10-5100.58237.10.360.61.110.0142.0
CT-S10-6100.58237.40.339.8105.3222.3-
p′0 =100 kPa for all tests. e, void ratio prior to shearing; Dr, relative density prior to shearing; N1%, N2.5%, Nl, number of cycles required to reach εDA = 1%, 2.5%, and 5% respectively; su-max, maximum undrained shear strength.
Table 5. Summary of cyclic triaxial tests on untreated silty sand.
TesteDr (%)CSRN1%N2.5%Nl
CT-10.65012.10.1411.212.2-
CT-20.65410.50.321.72.22.6
CT-30.61425.30.2114.214.715.1
CT-40.61325.80.302.22.73.1
CT-50.60229.70.246.77.88.8
CT-60.60030.50.218.79.310.1
CT-70.58237.20.15120.6122.6124.2
CT-80.58237.40.302.22.63.7
CT-90.56742.90.380.81.52.1
CT-100.50765.30.335.87.79.7
p′0 =100 kPa for all tests. e, void ratio prior to shearing; Dr, relative density prior to shearing; N1%, N2.5%, Nl, number of cycles required to reach εDA = 1%, 2.5%, and 5% respectively.
Publisher’s Note: MDPI stays neutral with regard to jurisdictional claims in published maps and institutional affiliations.

