


Abstract
Coastal settlements in Bangladesh are geographically flood-prone areas. This physical nature erodes the size and shape of those settlement boundaries over time. Such changes leave communities vulnerable in terms of securing a living place and livelihoods. However, the research arena rarely addresses the long-term changing aspects of settlement and the local governance responses to vulnerability. To examine this situation, this study explored settlement transformation patterns and governance challenges, using the case study of Chattogram Division in Bangladesh from 2005 to 2025. It applied a mixed-methods approach. The analysis, using the technique of Multi-temporal Landsat imagery with Random Forest classification, revealed complex settlement trajectories. It showed built-up areas expanded significantly between 2005 and 2015 but shrank by 2025, reflecting both hazard exposure and displacement pressures. Union-level analysis identified 62 coastal unions with high to very high settlement change. Conducting field surveys in selected Juidandi and Kalamarchhara unions through focus group discussions with communities and interviews with local officials highlighted recurring inundation, permanent land loss affecting thousands of households, and persistent disruptions to livelihoods. This study also found moderate emergency responses in selected unions; however, strategic planning for relocation, health, and well-being of communities is insufficient. Continuous resource constraints and poor coordination with communities and line organizations made local implementation less effective, which blurs the effectiveness of disaster risk reduction policies. These findings underscore the necessity of union-level governance capacity building, integrating community-based adaptation with formal interventions, and developing spatially differentiated relocation strategies to enhance the resilience of climate-vulnerable coastal settlements.
1. Introduction
Coastal zones around the globe are undergoing significant changes due to natural hazards, climate variability, and human-induced stressors [1,2]. These regions, inhabited by nearly 40 percent of the global population living within 100 km of the coastline, face increasing threats from flooding, erosion, storm surges, and rising sea levels [3,4,5]. Bangladesh, situated in South Asia, is prone to flooding and cyclonic storms geographically, which threaten coastal settlements. The coastal settlement region of Bangladesh, consisting of 19 districts, is home to over 35 million people. Many communities in these settlements occupy low-lying coastal areas for shelter and livelihoods, lacking adequate protective measures, which increases their vulnerability to flooding and other natural disasters [3,6,7]. This coastal risk delineates an emergent need to understand the spatial dynamics of settlement change and evaluate the effectiveness of existing policies for sustainable coastal management aligned with disaster risk reduction, especially in light of growing impacts of climate change [1,5,7].
Recent research identifies coastal Bangladesh as a critical hotspot where floods and tidal surges continually shape settlements along the Bay of Bengal, leading to rapid socio-economic changes that necessitate an effective governance system [8,9]. Some research on geospatial assessments reveals persistent built-up growth into high-risk coastal margins, while physical drivers, including storm surges, erosion, sea-level rise, and salinity intrusion, continue to intensify community exposure [8,10]. Another study examining remote-sensing-based time-series and land-use/land-cover analyses for Chattogram and the adjacent coastal areas highlights measurable land-cover transitions over recent decades. This underscores the effectiveness of multi-temporal Landsat and Sentinel methods in detecting changes in settlement and the expansion of inundation areas [11]. Parallel literature on adaptation and governance emphasizes that national frameworks such as the Bangladesh Climate Change Strategy and Action Plan [12], National Adaptation Program of Action [13], and sectoral disaster plans [14] provide an enabling policy architecture but often fall short at the local scale due to institutional fragmentation, limited fiscal and technical capacity, and gaps in policy translation to practice [14,15]. Existing community-level research from Bangladeshi coastal districts highlights that integrating community-based adaptation, through focus group discussions, key informant interviews, and local and indigenous knowledge into resilience strategies, is crucial for ensuring the uptake and equity of interventions [9,16,17]. This body of research supports integrated strategies that map settlement dynamics using rigorous multi-temporal remote sensing and identify areas requiring strengthened local governance mechanisms, policy provisions, and resource allocation at sub-district and union levels to improve adaptive capacity and decrease exposure [18,19,20].
Despite acknowledgment of coastal vulnerability in national development agendas, a significant knowledge gap persists regarding the actual extent of settlement shifts and the efficiency of local policy implementation [5,9,14,17,21]. While numerous studies have documented flood impacts and community vulnerabilities in Bangladesh, long-term experiential observations of settlement pattern changes specifically triggered by coastal flooding remain sparse. Most current studies concentrate on immediate disaster impacts or large-scale coastal zone management concerns, leaving a critical gap in understanding the spatial and temporal patterns of settlement change in flood-risk zones [22,23,24]. Additionally, some research discusses substantial progress in formulating comprehensive disaster management policies, such as Standing Orders on Disasters, Bangladesh Delta Plan 2100, and coastal zone management programs, but rarely addresses the challenges of implementing those policies at the local level [25,26,27,28]. Current studies on the role of local government bodies in implementing coastal protection measures and supporting at-risk settlements have received insufficient attention [22,23,24]. Union Parishads and Upazila administrations serve as critical mediators between national policy frameworks and community-level practice, yet their capacities, practices, and challenges in safeguarding coastal settlements are under-documented [17,18,23]. This situation emphasizes the importance of studying how local organizations implement policies, allocate resources, coordinate with stakeholders, and engage communities in flood risk governance to strengthen governance structures [2,14,17,22]. Furthermore, an observed investigation is necessary to inform evidence-based policy improvements in areas such as priority-setting for settlement protection, performance of existing protective infrastructure, and integration of formal policy interventions with traditional coping mechanisms [14,15].
Recent advancements in geographic information systems and remote sensing offer a robust framework for analyzing long-term changes in coastal settlements. Satellite imagery enables systematic mapping of land cover and land use change over extended time periods, offering objective evidence of settlement expansion, contraction, or relocation in response to environmental stress [8,9,11,22]. By combining spatial analysis with in situ assessments derived from surveys, interviews, and focus groups, researchers can construct a comprehensive picture of settlement dynamics and their underlying drivers [3,10,23]. This multi-method approach enables triangulation of findings from diverse data sources, enhancing the validity and reliability of research outcomes [14,15]. Such integrated analysis can identify specific locations undergoing concentrated settlement transformations and reveal trends that can guide targeted policy interventions.
This research addresses these critical knowledge deficits by examining settlement change and policy effectiveness in coastal flood-risk areas of Chattogram division over a twenty-year timespan from 2005 to 2025. It employs a mixed-methods approach combining remote sensing analysis of land use and land cover change with detailed field-based observation of local government practices and policy implementation. The research consists of three interconnected components: First, it quantifies changes in settlement patterns to provide empirical evidence of spatial changes. Second, it reviews national and local policies to identify gaps and provisions related to the protection of coastal settlements. Third, it evaluates the practical implementation of these policies by local government units in protecting vulnerable communities.
This study aims to demonstrate how long-term coastal flooding reshapes settlement patterns and exposes gaps in local governance implementation. Specifically, it seeks to (i) quantify spatial settlement dynamics over two decades, (ii) assess the effectiveness of policy translation at the union level, and (iii) identify governance constraints that undermine climate resilience in coastal Bangladesh.
This study holds particular significance as Bangladesh advances toward achieving the Sustainable Development Goals, especially those about climate action (SDG 13), sustainable cities and communities (SDG 11), and reducing inequality (SDG 10) [29,30]. By examining settlement dynamics, policy frameworks, and local government practices, this study offers practical recommendations to improve coastal resilience, effectively connecting policy formulation with local implementation, contributing to the growing body of literature on disaster risk reduction, climate adaptation, and deltaic coastal zone management. Additionally, the research addresses the pressing need for scientifically informed planning in the face of intensifying climate change impacts by providing empirical insights to guide adaptive management approaches for researchers, practitioners, and policymakers.
2. Materials and Methods
2.1. Study Area
The study area encompasses the coastal regions of Chattogram Division, located on the southeastern coast of Bangladesh. Chattogram Division consists of 11 districts, with the coastal zone extending between 20°44′32″ N and 22°50′38″ N latitude and 91°27′43″ E and 92°21′09″ E longitude [31]. This investigation specifically focuses on a 10 km inland buffer zone from the coastline of Chattogram Division [32], covering a total area of 3040.26 km2 and encompassing 31 coastal upazilas distributed across four districts: Noakhali, Feni, Chattogram, and Cox’s Bazar (Figure 1).
Figure 1.
Where the Story Unfolds: (a), (b): Key Maps, (c) Location Map of the Study Area.
The coastal zone, characterized by a 377 km long coastline, exhibits extreme vulnerability to coastal flooding due to its open exposure to the Bay of Bengal, low-lying topography, and complex deltaic geomorphology [9,22]. The region experiences a tropical monsoon climate with pronounced seasonal variations, receiving heavy rainfall during the monsoon season (June to October) that frequently triggers riverine flooding [33]. The area demonstrates the highest water level rise trend of 7.8 mm per year among Bangladesh’s coastal regions, a rate projected to intensify further due to climate change and accelerated sea-level rise [34,35]. The confluence of tidal dynamics, storm surges from cyclonic events, and riverine flooding creates a multi-hazard environment that repeatedly impacts coastal settlements [35].
The selection of Chattogram Division as the study area is justified by several critical factors: First, the region has undergone significant land-use transformation and settlement patterns over the past two decades, making it suitable for temporal analysis. Second, the area’s high population density and dependence on coastal resources exemplify the socio-economic vulnerability characteristic of deltaic coastal zones. Third, the division encompasses diverse coastal morphologies (from estuarine systems to exposed sandy coastlines), allowing for a comprehensive assessment of settlement dynamics across varied physical settings. Fourth, the presence of established local government structures at union and upazila levels provides opportunities for in-depth evaluation of policy implementation practices [8,9,11,17,22]. These characteristics collectively position Chattogram Division as a representative case study for understanding coastal settlement dynamics and governance challenges in climate-vulnerable deltaic regions.
2.2. Research Framework
This study adopts an integrated mixed-methods approach that combines quantitative geospatial analysis with qualitative field-based investigation to comprehensively assess coastal settlement dynamics and policy effectiveness. The research framework consists of three interconnected methodological components: (1) multi-temporal remote sensing analysis to quantify land use and land cover changes over 20 years (2005–2025); (2) spatial analysis to identify settlement change patterns and delineate vulnerability zones at the union administrative level; and (3) qualitative assessment through focus group discussions and semi-structured interviews to evaluate community perceptions, indigenous practices, and local government implementation of coastal protection policies (Figure 2).
Figure 2.
Methodological framework.
This triangulated approach enables cross-validation of findings from multiple data sources, enhancing the robustness and validity of research conclusions while providing both macro-scale spatial patterns and micro-scale contextual insights.
2.3. Remote Sensing Data Acquisition and Preprocessing
2.3.1. Satellite Data Selection
This study utilized multi-temporal Landsat datasets acquired during the dry season (January to February) to ensure optimal image quality and minimize cloud cover interference (Table 1). The selection of dry season imagery is significant for accurate land cover classification, as vegetation phenology is more stable and water bodies are clearly demarcated during this period [22].
Table 1.
Satellite imagery specifications and acquisition details.
Although dry season precipitation varies slightly across years, January–February imagery was selected to minimize inter-seasonal variability. Annual rainfall records indicate that precipitation during these months remains consistently low across the study years, reducing the likelihood of moisture-related spectral distortion. Residual differences were further mitigated through the use of surface reflectance products and index-based classification.
Landsat datasets have been broadly employed in Earth Observation applications, including land use and land cover change detection, due to their moderate spatial resolution (30 m), consistent temporal coverage, and free accessibility [36]. The study incorporated three temporal snapshots: Landsat-5 Thematic Mapper (TM) data for 2005, Landsat-8 Operational Land Imager (OLI) data for 2015, and Landsat-8 OLI data for 2025. These datasets provide a consistent 30 m spatial resolution across the entire study period, facilitating robust multi-temporal comparisons (Table 1). All satellite imagery was obtained from the United States Geological Survey (USGS) Earth Explorer platform (accessed on 17 February 2026: https://earthexplorer.usgs.gov/), which provides freely accessible, analysis-ready Surface Reflectance (SR) products.
2.3.2. Image Preprocessing
Comprehensive preprocessing procedures were applied to ensure data quality and comparability across the temporal series. The preprocessing workflow consisted of several sequential steps. First, atmospheric correction was performed using the Surface Reflectance products provided by USGS, which apply the Landsat Ecosystem Disturbance Adaptive Processing System (LEDAPS) algorithm for Landsat-5 TM imagery and the Land Surface Reflectance Code (LaSRC) algorithm for Landsat-8 OLI imagery. These algorithms correct for atmospheric scattering and absorption effects, converting top-of-atmosphere reflectance to surface reflectance values [37,38].
Second, cloud masking was implemented to exclude cloud-contaminated pixels from the analysis. Given the study area’s tropical monsoon climate and persistent cloud cover, a cloud masking threshold of 10% was established. Images with cloud cover exceeding this threshold were excluded from consideration. A 10% cloud cover threshold was selected based on prior coastal LULC studies in monsoon regions [9,39], which balances data availability with classification accuracy. Sensitivity tests showed that higher thresholds introduced significant noise in settlement classification.
The Quality Assessment (QA) bands provided with Landsat Surface Reflectance products were utilized to identify and mask clouds and their shadows. Third, multiple Landsat scenes were required to achieve complete coverage of the study area due to its spatial extent. Individual scenes for each year were mosaicked using seamless mosaicking techniques that minimize visible boundaries between adjacent tiles. The mosaicking process employed feathering algorithms to create smooth transitions between overlapping image areas [37,38].
Fourth, all mosaicked images were geometrically corrected and co-registered to ensure precise spatial alignment across the temporal series [37,38]. This step is critical for accurate change detection analysis, as misalignment can introduce false change artifacts. The images were projected to the Universal Transverse Mercator (UTM) coordinate system, Zone 46N, using the World Geodetic System 1984 (WGS84) datum. Finally, the mosaicked and georeferenced images were clipped to the precise boundary of the 10 km coastal buffer zone to create the final analysis-ready datasets for land cover classification [40].
Surface reflectance products from USGS were used, which apply sensor-specific atmospheric correction algorithms (LEDAPS for Landsat-5, LaSRC for Landsat-8 [41,42]. Additionally, spectral bandpass adjustments were applied to ensure consistency between Landsat-5 TM and Landsat-8 OLI bands, following USGS recommendations [43].
2.4. Land Use and Land Cover Classification
2.4.1. Classification Scheme
A four-class land use and land cover classification scheme was developed to characterize the dominant landscape features in the coastal zone: (1) Waterbody—rivers, channels, estuaries, ponds, and permanent water surfaces [44]; (2) Vegetation—agricultural lands, forests, mangroves, and vegetated areas including crops and natural vegetation [44]; (3) Built-up Area—residential settlements, urban areas, roads, and other impervious surfaces representing human habitation [45]; and (4) Barren Land—exposed soil, fallow land, sandy beaches, mudflats, and areas devoid of vegetation or structures [46]. This classification scheme was designed to capture the primary land cover transitions relevant to coastal settlement dynamics and flood vulnerability assessment while maintaining sufficient simplicity to ensure high classification accuracy across the 20-year study period.
2.4.2. Training Sample Collection
Training samples for supervised classification were collected through a combination of visual interpretation, high-resolution imagery from Google Earth, and field verification. For historical images (2005 and 2025), training samples were collected through careful visual interpretation of high-resolution historical imagery available in Google Earth Pro 7.3, supplemented by temporal analysis to ensure consistency [11,40,46]. A minimum of 250 training polygons per class per year were digitized and distributed across the entire study area to capture spatial variability in spectral signatures. Training samples were carefully selected to represent homogeneous, pure examples of each land cover class, avoiding mixed pixels at class boundaries. The training dataset for each year was randomly divided into two subsets: 70% for classifier training and 30% for independent accuracy assessment, following standard machine learning validation protocols [46]
2.4.3. Random Forest Classification Algorithm
The Random Forest (RF) classifier, a robust ensemble machine learning algorithm, was employed for supervised land cover classification. RF has demonstrated superior performance in remote sensing applications due to its ability to handle high-dimensional data, resistance to overfitting, and capacity to model complex non-linear relationships between spectral features and land cover classes [47]. The algorithm operates by constructing multiple decision trees during training, with each tree built using a random subset of training samples (bootstrap sampling) and a random subset of predictor variables at each node split [43]. The final classification is determined by majority voting across all decision trees, enhancing prediction stability and accuracy [47].
The RF classifier employs the Gini Index as the attribute selection metric for determining optimal splits at each decision tree node. The Gini Index measures the impurity of a dataset with respect to class labels (Equation (1)), guiding the algorithm to create decision boundaries that maximize class separation [47,48,49]. For a given training set T, the Gini Index for selecting an attribute to classify instances into classes Ci is expressed mathematically as:
where f (Ci, T) represents the frequency of instances belonging to class Ci in the training set T, and |T| denotes the total number of instances. Lower Gini Index values indicate greater class purity, guiding the construction of decision trees that effectively discriminate between land cover classes [47,48,49].
The RF classification was implemented in the Google Earth Engine (GEE) platform, which provides cloud-based geospatial processing capabilities ideal for large-area, multi-temporal analysis. Key RF hyperparameters were optimized through iterative experimentation: the number of decision trees was set to 100 (providing a balance between computational efficiency and classification stability), the number of variables per split was set to the square root of the total number of input features, and the minimum leaf population was set to 1. The number of trees in the Random Forest classifier was set to 100 based on preliminary sensitivity testing and guidance from previous remote sensing studies. A pilot experiment was conducted using tree numbers ranging from 50 to 300, which indicated that overall classification accuracy stabilized beyond 100 trees, with marginal improvement (<0.5%) observed thereafter. Similar studies applying Random Forest for land use and land cover classification in coastal and deltaic environments have also reported optimal performance within the range of 100–200 trees [47,48,49]. Therefore, 100 trees were selected to ensure a balance between classification stability and computational efficiency. Input features for classification included all available spectral bands from the respective Landsat sensors, along with derived spectral indices including the Normalized Difference Vegetation Index (NDVI), Normalized Difference Water Index (NDWI), and Normalized Difference Built-up Index (NDBI), which enhance judgment between vegetation, water, and built-up areas, respectively [47,48,49,50].
2.4.4. Accuracy Assessment
Rigorous accuracy assessment was conducted to evaluate the reliability and quality of the land cover classifications. The assessment employed the independent validation dataset (30% of training samples withheld during classifier training) to generate error matrices (confusion matrices) for each classification year [51,52]. Multiple accuracy metrics were calculated from these error matrices to provide a comprehensive evaluation of classification performance.
Overall Accuracy (OA) represents the proportion of correctly classified pixels across all land cover classes (Equation (2)) [53].
where N is the total number of validation samples, r is the number of land cover classes, and nii represents the number of correctly classified samples for class i (diagonal elements of the confusion matrix).
Producer’s Accuracy (PA) measures omission error by calculating the proportion of reference samples of a given class that are correctly classified (Equation (3)) [53].
where ni,col represents the column total for class i in the confusion matrix (total reference samples for that class).
User’s Accuracy (UA) measures commission error by calculating the proportion of pixels classified as a given class that actually belong to that class (Equation (4)) [53].
where ni,row represents the row total for class i (total pixels classified as that class).
Kappa Coefficient provides a measure of agreement between classified and reference data that accounts for chance agreement (Equation (5)) [54].
where N is the total number of observations, r is the number of rows (classes) in the confusion matrix, xii represents diagonal elements, and xi+ and x+i are the marginal totals of row i and column i, respectively [44,53].
These multiple accuracy metrics provide complementary perspectives on classification quality: overall accuracy indicates general performance, producers’ and users’ accuracies reveal class-specific strengths and weaknesses, and the kappa coefficient accounts for agreement beyond random chance. Classification results were considered acceptable if overall accuracy exceeded 85% and the kappa coefficient exceeded 0.80, thresholds commonly employed in land cover mapping studies [54].
2.5. Change Detection Analysis
Multi-temporal change detection analysis was performed to quantify land-use and land-cover transitions over the study period. The analysis examined changes across three temporal intervals: 2005–2015, 2015–2025, and the full 2005–2025 period. Change detection was performed using post-classification comparison, in which independently classified land cover maps from different years are compared on a pixel-by-pixel basis to identify areas that have changed. This approach is advantageous because it provides explicit “from-to” change information, revealing which specific land cover transitions have occurred (such as vegetation to built-up area, barren land to waterbody).
Change detection matrices were generated for each temporal interval, cross-tabulating land cover classes between the initial and final time periods. From these matrices, the areal extent and percentage of each land cover transition were calculated. Particular attention was given to identifying expansion or contraction of built-up areas (settlements) in relation to flood-prone zones, as this represents the core focus of the research.
2.6. Spatial Analysis of Settlement Vulnerability
2.6.1. Union-Level Settlement Change Quantification
To facilitate policy-relevant analysis and targeted intervention planning, settlement change patterns were aggregated and analyzed at the union administrative level. Unions represent the smallest rural administrative unit in Bangladesh, typically comprising several villages with populations ranging from 10,000 to 30,000 residents [55]. This spatial scale is particularly relevant for local governance assessment, as Union Parishads (elected local councils) constitute the primary interface between government policies and coastal communities [55].
The study area encompasses 193 coastal unions (complete or partial) within the 10 km coastal buffer zone. For each union, the total area of built-up land cover was extracted for the years 2005 and 2025 using zonal statistics operations in a geographic information system [9]. The magnitude of settlement change for each union was calculated as the absolute difference in built-up area between 2005 and 2025, representing net expansion or contraction of settlements over the two-decade period. These settlement change values were then normalized by the total land area of each union to account for differences in union size, producing a standardized settlement change metric (percentage change in built-up area).
2.6.2. Vulnerability Zone Classification
A vulnerability classification scheme was developed to categorize unions based on the severity of settlement change experienced over the study period (Table 2). Unions were classified into five vulnerability zones using the natural breaks (Jenks) classification algorithm [4], which identifies class boundaries that minimize within-class variance and maximize between-class differences:
Table 2.
Vulnerability classification scheme.
This classification provides a spatial framework for prioritizing interventions and allocating resources to the most critically affected areas. Vulnerability zone maps were generated using geospatial assessment, visualizing the spatial distribution of settlement change severity across the coastal zone. These maps serve as decision-support tools for local government officials and policy planners, highlighting specific unions requiring urgent attention for coastal protection and settlement management initiatives.
2.7. Sampling Study Union for Field Observation
Based on the union-level vulnerability assessment, two coastal unions were strategically selected for intensive qualitative field investigation: Juidandi Union (Anowara Upazila, Southwest portion of the Chattogram District) and Kalamarchhara Union (Maheshkhali Upazila, Northwest portion of the Cox’s Bazar District) (Table 3). The selection of these case study sites was guided by multiple criteria designed to ensure they represent the most severely affected coastal communities and provide rich insights into settlement dynamics and governance challenges.
Table 3.
Characteristics of selected study unions.
The primary selection criterion was settlement change severity: both unions were classified in the “Very High” vulnerability categories based on the spatial analysis, indicating they experienced substantial settlement transformations between 2005 and 2025. This ensures the study focuses on areas where understanding settlement dynamics and policy effectiveness is most critical. Secondary selection criteria, which has been revealed from the field reconnaissance survey were: (1) flood exposure history: both unions have documented histories of repeated coastal flooding events, making them ideal for investigating flood-settlement interactions; (2) diverse hazard profiles: the two unions experience different combinations of riverine flooding, tidal inundation, and storm surge impacts, allowing for comparative analysis; (3) accessibility: both sites were accessible for field research during the study period, ensuring feasibility of data collection; (4) presence of local government structures: both unions have functioning Union Parishads and are within upazilas with active disaster management committees, enabling evaluation of local governance practices; and (5) population characteristics: the unions represent different population densities (Juidandi: 13,322 residents; Kalamarchhara: 62,000 residents) and livelihood patterns, providing diverse community perspectives [56].
In addition to the severity of impact, Juidandi and Kalamarchhara were selected for high vulnerability and diverse governance contexts to capture the range of coastal settlement dynamics. Juidandi is rural with traditional Union Parishad structures, while Kalamarchhara is peri-urban with a stronger NGO presence. These two unions differ in administrative capacity, population density, and development pressure, allowing examination of local governance responses under similar hazard exposure across different settlement types.
A comprehensive preliminary investigation was conducted before field data collection, including a review of government reports, disaster records, and media documentation of flood events in these unions. This contextual research informed the development of data collection instruments and facilitated the rapid establishment of rapport with local stakeholders during fieldwork. The selection of two unions rather than a single site enables identification of both common patterns and context-specific factors influencing settlement dynamics and governance effectiveness across different coastal settings.
2.8. Qualitative Data Collection
2.8.1. Participant Selection and Sampling Strategy
Qualitative data were collected from three stakeholder groups representing distinct roles in coastal flood governance: community residents not affiliated with organized response groups, members of Flood Action Groups (FAGs), and local government officials from Union Parishads. This multi-stakeholder design enabled integration of lived community experiences with institutional perspectives on flood preparedness, response, and governance.
Participants were selected using purposive and snowball sampling [57]. Local government officials were approached through formal communication and coordinated via Upazila Disaster Management Committees. Community residents and FAG members were initially identified through Union Parishad offices, followed by referral-based recruitment. Inclusion criteria included residence or official posting in the study unions, direct experience with coastal flooding during the past decade, professional involvement in disaster management or planning (for officials), at least two years of active FAG participation, and voluntary participation without financial incentives.
Data collection continued until thematic saturation was reached. FGDs were conducted with 14 residents from each union, and six key informant interviews were completed, including four FAG members (two per union) and two Union Parishad officials (one per union). The study prioritized depth of insight over sample size to facilitate a detailed examination of community perceptions, coping strategies, and governance practices.
Demographic information was recorded but not analyzed, as the study emphasized experiential and contextual insights rather than demographic representation. Ethical protocols were strictly followed: participants were fully informed about the study, provided verbal consent, approved audio recording, and were assured confidentiality through anonymization and secure data storage.
Thematic saturation was achieved after two rounds of FGDs in each union and completion of all six key informant interviews. No substantively new codes or themes emerged beyond this point, indicating adequate coverage of participant perspectives.
2.8.2. Data Collection Instruments and Procedures
The study employed two complementary qualitative methods: focus group discussions (FGDs) with community residents and semi-structured key informant interviews (KIIs) with Flood Action Group (FAG) members and local government officials. FGDs are well suited for eliciting shared experiences, community norms, and collective interpretations of flood impacts, as group interaction facilitates discussion and reveals consensus and divergence [58]. Semi-structured interviews were used for FAG members and officials to enable in-depth exploration of organizational and institutional practices, which may be constrained in group settings, while allowing flexible probing of key issues [58].
FGDs were conducted exclusively with residents to promote open discussion in the absence of hierarchical influences. Each session lasted 45–60 min and followed an open-ended discussion guide developed from the research objectives and literature. Topics included flood experiences and impacts, observed settlement and environmental changes, existing protection measures and their effectiveness, traditional coping and adaptive strategies, interactions with local government and FAGs, and priorities for future interventions (Table 4).
Table 4.
Thematic domains of qualitative data collection instruments.
KIIs followed a flexible protocol tailored to participants’ roles. Interviews with FAG members addressed organizational structure, activities, perceptions of vulnerability, coordination with government agencies, resource constraints, response capacity, and preparedness challenges. Interviews with local government officials focused on institutional mandates, implementation of disaster policies, resource allocation, inter-agency coordination, community engagement, infrastructure protection, data and monitoring systems, and barriers to policy implementation (Table 4).
All FGDs and KIIs were conducted in Bengali by a culturally knowledgeable research team. Fieldwork took place in Juidandi Union in October 2025 and Kalamarchhara Union in November 2025, after the monsoon season, to ensure accessibility and accurate recall. Sessions were held in convenient community locations. With consent, all sessions were audio-recorded, supplemented by detailed field notes, and followed by team debriefings to refine data collection and ensure procedural consistency.
2.8.3. Data Management and Transcription
All audio recordings were transcribed verbatim in Bangla by trained research assistants, as transcription is a critical step in converting oral narratives into analyzable textual data while preserving meaning and nuance [59]. Primary researchers verified each transcript against the original recordings to ensure accuracy and completeness, and integrated field notes capturing non-verbal cues, interaction dynamics, and contextual observations.
Transcripts were subsequently translated into English by bilingual researchers with subject-matter expertise. Translation prioritized conceptual equivalence rather than literal wording to retain cultural meanings and technical accuracy. Back-translation was conducted for a subset of transcripts to ensure quality control. All data were anonymized using participant codes (Resident-1-Juidandi; Official-2-Kalamarchhara), and the final anonymized corpus constituted the dataset for thematic analysis.
2.9. Thematic Analysis of Qualitative Data
Thematic analysis was adopted as the systematic analytical approach (Figure 3) for examining data from FGDs and KIIs.
Figure 3.
Thematic analysis process flowchart.
This method enables identification and interpretation of recurring patterns while maintaining analytical flexibility and rigor, making it suitable for applied, policy-relevant research [59].
2.9.1. Analytical Framework and Coding Procedures
To avoid premature theoretical bias, first-cycle coding employed open, descriptive labels grounded in participants’ language, followed by alignment with relevant literature. The analysis followed a six-phase process (Figure 3). First, repeated reading of transcripts enabled familiarization and preliminary insights. Second, initial codes representing the smallest meaningful data units were generated inductively through systematic extraction of keywords and text segments (Figure 4), informed by research objectives [59].
Figure 4.
Coding and theme formation process.
Third, related codes were organized into candidate themes capturing broader patterns (Figure 4). Fourth, themes were reviewed and refined to ensure coherence, internal homogeneity, and distinction across themes [59]. Fifth, finalized themes were clearly defined and named, with sub-themes developed where necessary to reflect complex patterns (e.g., environmental exposure, vulnerability, displacement). Finally, the report was produced by integrating analytical interpretations with representative anonymized quotations to substantiate each theme.
2.9.2. Analytical Rigor
Analytical rigor was ensured through investigator triangulation, involving multiple researchers in coding and theme development with iterative discussion to resolve discrepancies [59]. Data triangulation compared findings across stakeholder groups and study sites, while member checking validated interpretations with selected participants. An audit trail documented coding decisions, theme refinement, and reflexive notes, enhancing transparency and trustworthiness and reducing researcher bias [60].
2.10. Integration of Quantitative and Qualitative Findings
The final analytical stage involved systematic integration of quantitative geospatial findings with qualitative thematic insights to generate a comprehensive understanding of coastal settlement dynamics and policy effectiveness. The geospatial analysis provides macro-scale evidence of the spatial extent, temporal trends, and geographic distribution of settlement changes across the entire coastal zone, answering “what” and “where” questions. The qualitative analysis provides micro-scale insights into the processes, mechanisms, and lived experiences underlying these spatial patterns, answering “how” and “why” questions.
Integration occurred at multiple levels. First, the union-level vulnerability mapping informed the selection of qualitative field sites, ensuring that the in-depth investigation focused on the most critically affected areas. Second, qualitative findings provided explanatory context for quantitative patterns; for example, the observed contraction of built-up areas in certain locations (from spatial analysis) could be explained through community narratives of land loss, displacement, and abandonment of flood-prone settlements (from thematic analysis). Third, local government officials’ descriptions of resource constraints, coordination challenges, and policy implementation gaps (qualitative themes) were contextualized against the spatial evidence of expanding settlements in high-risk zones (quantitative finding), revealing the tangible consequences of governance deficits. Fourth, community-identified priorities and traditional coping mechanisms (qualitative data) were mapped against the spatial vulnerability zones to identify where specific interventions would be most appropriate and culturally acceptable.
The integration of spatial settlement change patterns with stakeholder narratives enables identification of mechanistic drivers behind governance deficits, including resource bottlenecks, coordination failures, and mismatches between policy design and local risk realities [61,62]. This approach links observed settlement outcomes directly to institutional practices rather than treating governance shortcomings as abstract conditions.
This mixed-methods integration allows for the creation of evidence-based, spatially explicit, and contextually relevant recommendations to enhance coastal resilience; recommendations grounded in both empirical spatial data and stakeholder realities. The combined strengths of quantitative and qualitative approaches offset each method’s individual limitations, resulting in findings that are more valid, detailed, and practically applicable than either approach could produce alone [63,64].
The analytical integration follows a sequential explanatory pathway, where spatial analysis identifies priority zones, qualitative inquiry explains underlying processes, and combined interpretation informs policy-relevant conclusions.
3. Results
3.1. Multi-Temporal Land Use and Land Cover Dynamics
The analysis of land use and land cover (LULC) change from 2005 to 2025 reveals dynamic settlement patterns in the coastal areas of Chattogram Division. Based on Random Forest classification of Landsat imagery, four primary land classes were extracted and analyzed: built-up area, barren land, vegetation, and waterbody (Figure 5).
Figure 5.
Land Use and Land Cover Maps for (a) 2005, (b) 2015, and (c) 2025: Temporal evolution of four land cover classes.
The initial LULC pattern in 2005 was dominated by built-up or settlement area, covering 1225.56 km2 (40.31%) of the total study area, followed by barren land (32.97%, 1002.45 km2), vegetation (13.87%, 421.58 km2), and waterbody (12.85%, 390.68 km2) (Table 5). This dominance of built-up area reflects the historical settlement concentration in coastal zones driven by livelihood opportunities from fisheries, agriculture, and port-related activities. Between 2005 and 2015, the study area experienced substantial settlement expansion. Built-up area increased significantly to 1737.27 km2 (57.14%), representing a net gain of 511.72 km2 (16.83%) over the decade (Table 5, Figure 6). This corresponds to an annual expansion rate of 51.17 km2, indicating rapid urbanization and settlement growth during this period. Such expansion patterns are consistent with broader trends observed in coastal Bangladesh, where population growth, rural-urban migration, and economic development drive land conversion to settlement uses [65,66]. The increase in built-up area occurred predominantly at the expense of barren land, which declined by 604.30 km2 (19.88%) during the same period, suggesting that settlement expansion utilized previously undeveloped or agricultural fallow lands (Figure 6).
Table 5.
Areal extent and distribution of four land cover classes across three temporal years: 2005, 2015, and 2025.
Figure 6.
Net changes in land cover classes across three temporal intervals from 2005 to 2025.
Additionally, the 2015–2025 period showed a different pattern, where built-up area decreased to 1443.33 km2 (47.47%), representing a reduction of 293.95 km2 (9.67%) and an annual decreasing rate of 29.39 km2 (Table 5). This reduction in settlement area is particularly significant in the context of coastal vulnerability and may reflect several processes: erosion-induced land loss, deliberate relocation from high-risk zones, abandonment of flood-damaged structures, or misclassification of damaged or partially destroyed settlements [67]. Over the entire 20-year study period (2005–2025), built-up area showed a net increase of 217.77 km2 (7.16%), indicating overall settlement growth despite the contraction observed in the second decade (Table 5, Figure 6). This net expansion masks the complex temporal dynamics and spatial redistribution of settlements within the study area.
The analysis also reveals significant changes in other LULC classes (Table 5, Figure 6). Waterbody coverage increased from 390.68 km2 (12.85%) in 2005 to 519.77 km2 (17.10%) in 2015, a gain of 129.09 km2 (4.25%), but subsequently declined sharply to 226.63 km2 (7.45%) in 2025, resulting in a net loss of 164.05 km2 (5.40%) over the 20-year period. The initial increase often reflects enhanced water retention due to embankment construction or seasonal variations, while the subsequent decline could indicate land reclamation, sedimentation, or drainage for development purposes [68,69]. Vegetation area initially decreased from 421.58 km2 (13.87%) in 2005 to 385.08 km2 (12.67%) in 2015, losing 36.51 km2 (1.20%).
However, vegetation cover rebounded substantially to 564.67 km2 (18.57%) in 2025, gaining 179.59 km2 (5.91%) in the second decade and achieving a net increase of 143.08 km2 (4.71%) over the entire study period. Barren land exhibited the most visible decline, decreasing from 1002.45 km2 (32.97%) in 2005 to 398.15 km2 (13.10%) in 2015, indicating a loss of 604.30 km2 (19.88%). Although barren land partially recovered to 805.64 km2 (26.50%) in 2025, the net area changes over 20 years remained a significant decline of 196.81 km2 (6.47%).
3.2. Union-Level Settlement Vulnerability Classification
To facilitate policy-relevant spatial targeting, settlement change magnitude was analyzed at the union administrative level (the smallest governance unit in Bangladesh). Each of the 193 coastal unions was classified into five vulnerability categories (very low to very high) based on the extent of built-up area change between 2005 and 2025 (Figure 7a). The classification employed natural breaks (Jenks) optimization, which identifies class boundaries that minimize within-class variance while maximizing between-class differences [70].
Figure 7.
Spatial distribution of 193 coastal unions classified by (a) Settlement Change and Vulnerability Zones (a), with detailed views of case study unions: (b) Juidandi and (c) Kalamarchhara.
The results reveal considerable spatial variability: 29 unions (15.03%) fall into the very significant change category, 36 unions (18.65%) in the high category, 34 unions (17.62%) in the moderate category, and 94 unions (48.70%) in the low to very low category (Figure 7a). The 28 unions fall into the very high category, experiencing the most prominent settlement transitions (ST 7). These are characterized by either substantial expansion into previously undeveloped areas or significant settlement loss due to factors such as erosion, flooding, and displacement [71,72]. The 37 unions fall into high change category and similarly experienced notable settlement dynamics, warranting policy attention. Together, 65 unions (33.68% of the total) experiencing high to very high settlement change represent priority zones for detailed investigation and targeted interventions. Lastly, the remaining 128 unions showed moderate to very low change, suggesting relative stability in settlement patterns (Figure 7a).
Based on this vulnerability assessment and field reconnaissance confirming flood exposure history, Juidandi Union (Anowara Upazila) and Kalamarchhara Union (Maheshkhali Upazila) were selected for intensive qualitative investigation (Figure 7b,c). Both unions fall within the very high settlement change category identified through spatial analysis, indicating notable vulnerability to coastal flooding. The selection was further validated through review of secondary literature, including reports, newspaper articles, and local documentation, which confirmed recurring flood events and significant community impacts in both locations [73,74,75,76,77]. This evidence-based selection ensures that field research captures ground-level realities in areas experiencing acute settlement vulnerability [78]. Although situated in different districts with distinct geographic and administrative contexts, these unions were not selected for comparative analysis. Rather, the study examines the overall condition of community perceptions, indigenous coping practices, and local governance effectiveness across both locations to generate comprehensive insights into coastal settlement dynamics and policy implementation challenges in Chattogram Division.
3.3. Community Perceptions and Indigenous Practices
Based on focus group discussions with residents and interviews with community flood action members, the results showed that coastal communities have different perceptions and responses to flooding risks and settlement change. This study identified six broad themes that communities were concerned about: (1) environmental exposure and impact scale, (2) physical and economic vulnerability, (3) displacement and land instability, (4) community structure and social capital, (5) protection and response capacity, and (6) resilience and adaptation capacity. These community perspectives reveal valuable indigenous knowledge and adaptive practices (ST 8) as discussed in the following sub-sections. These insights complement technical assessments and inform context-appropriate coastal management strategies.
3.3.1. Environmental Exposure and Impact Scale
This theme represents community perceptions of environmental exposures and disturbances caused by the proximity, frequency, and magnitude of coastal flooding (Figure 8). Understanding how communities perceive flood risks is critical for designing effective adaptation strategies, as risk perceptions fundamentally shape local decision-making and adaptive behaviors, regardless of their alignment with empirical measurements [79,80]. Residents from both study sites demonstrated no psychological distancing from flood risks, repeatedly emphasizing recurrence and intensification of events. One respondent stated, “We have been living here for a long time, facing floods every year,” while others noted, “Almost every year floods come, big ones every 2–3 years, and in the last 20 years, big floods came many times.” This normalization of flood exposure reflects a chronic vulnerability characteristic of low-lying coastal settlements [81]. Community members demonstrated detailed local knowledge of their geographic vulnerability. Residents explained, “It is a low-lying coastal area beside the Sangu River, and life here depends on the weather,” and “This area is surrounded by the Sangu River from three sides, the land is low, and the soil is soft, water easily overflows from the river.” Such an indigenous understanding of topographic and hydrological factors represents valuable spatial knowledge that complements technical assessments [71]. Respondents expressed clear perceptions of increasing flood severity in recent years compared to historical patterns. While typical events produce water levels of 2–3 feet, the flood in 2024 reached 4–4.5 feet in some locations, with chest-level inundation reported in certain areas, affecting residential structures and submerging agricultural fields essential to local livelihoods. Community members also observed changes in flood duration patterns, noting that while water typically recedes within 1–2 days, recent events have resulted in prolonged inundation lasting 3–4 days, extending exposure periods and amplifying damage to homes and crops. Community members reported marked increases in rainfall frequency and duration over the past two decades, observing a transition from concentrated monsoon precipitation to more frequent, multi-day rainfall events throughout the year. They also noted intensification of tidal dynamics, with stronger tides now capable of inundating low-lying areas even without rainfall. These observations reflect empirically documented climate variability trends and demonstrate active community monitoring of environmental changes that affect their vulnerability.
Figure 8.
Thematic framework of community perceptions on coastal flooding and settlement change.
3.3.2. Physical and Economic Vulnerability
This theme encompasses residents’ understanding of vulnerability stemming from both the built environment and local livelihoods (Figure 8). Physical and economic vulnerabilities are interconnected dimensions that compound disaster impacts, as structural fragility and livelihood insecurity mutually reinforce cycles of poverty and exposure in coastal communities [82,83].
Residents recognized the fragility of their physical environment through repeated observations of structural damage. They noted that “some houses made of tin and bamboo got damaged” and “many houses went underwater.” The vulnerability extends beyond individual structures to include critical infrastructure, with residents reporting repeated damage to roads, schools, and houses, as well as recent embankment failures. One resident emphasized the chronic nature of infrastructure failure: “The Government’s new embankment was constructed 2–3 years ago, but it is being damaged frequently.” This perception reflects community understanding of the fundamental fragility of settlements and infrastructure in these coastal areas. Land loss emerged as a critical concern, with permanent environmental changes threatening settlement stability. Residents reported permanent land loss due to erosion and submergence, with an estimated ten thousand families having lost their lands entirely. This irreversible land loss represents not only immediate displacement but also long-term erosion of community asset bases [84].
Economic vulnerability was articulated through the lens of livelihood disruption and financial stress (Figure 8). Traditional agriculture, the primary local livelihood, is increasingly perceived as unsustainable. Residents reported widespread agricultural impacts, including inundation of paddy fields, damage to fish ponds, and income loss lasting several weeks, alongside long-term changes in crop patterns that have forced occupational shifts from farming to non-agricultural work such as day labor and shopkeeping. This transition reflects limited livelihood options and results in income instability through low-paying, insecure employment [85]. Residents emphasized the cumulative economic burden because of frequent flooding: “Our income has fallen. Many of us spent more money on repairing houses than we earn in a season.” This long-term financial stress, including crop losses, work scarcity, and incremental repair costs, creates a cycle that diminishes household resilience after each flood event. Residents perceive these economic stresses not as temporary setbacks but as cumulative burdens that erode adaptive capacity over time, pushing households deeper into vulnerability and debt (Figure 8). This mobility pattern demonstrates that flooding can cause both short-distance and longer-distance displacement [81].
3.3.3. Displacement and Land Instability
This theme explores community perceptions of how coastal flooding drives settlement change through land loss, unregulated resettlement, repeated displacement, and institutional gaps in land support (Figure 8). Displacement and land instability represent critical dimensions of coastal vulnerability, as permanent land loss fundamentally undermines household security and community stability [84,86].
Land loss was perceived not merely as physical disappearance but as loss of security and identity. Residents described experiencing both gradual and sudden land loss that forced relocation. One resident shared a personal experience: “My family got relocated due to the flooding of August 2024.” These individual experiences reflect broader patterns, as “In south and east sides, several neighborhoods disappeared and were severely affected in the last 20 years, settlements and roads have gone underwater multiple times.” The scale of displacement is substantial. Residents reported that families who lost their land relocated within the area, primarily moving from coastal areas to inland or hillside, while others migrated to different villages entirely [81].
Resettlement processes were characterized as largely unregulated and self-managed. Residents explained, “There is no proper system of land allocation. Mostly, people bought land and relocated themselves; political influences occur in the case of providing government houses.” Some “bought small land on higher grounds by themselves. Only a few families got government aid,”, while others noted that “people either bought land and shifted, or the government allocated land for them and constructed houses for some families.” However, they also expressed inequities in allocation: “Sometimes people use power and get the houses provided by the government, even though others who also lost their houses do not get this support.” This indicates that housing support distribution is perceived as lacking transparency and objective criteria, with well-connected individuals accessing benefits while equally or more vulnerable families remain unsupported. Consequently, the majority of displaced households are forced to pursue self-managed resettlement, reflecting adaptive responses necessitated by the absence of systematic, equitable support mechanisms [85].
The inadequacy of institutional support emerged as a critical concern. Residents emphasized that formal assistance reaches only a limited few, leaving most displaced households to manage independently. This institutional gap in land support directly influences livelihood insecurity, creating a perception among residents of managing displacement crises entirely on their own each time coastal hazards strike. The absence of systematic, equitable support mechanisms compounds vulnerability and undermines long-term recovery prospects [82].
3.3.4. Community Structure and Social Capital
This theme examines how community structure and social capital influence local adaptation capacity through mutual trust and aid, organized gendered roles, and collective recovery from disasters (Figure 8). Social capital is widely recognized as a critical determinant of community resilience in disasters, which means the networks, norms, and trust that facilitate coordination and cooperation [72,87]. Residents view trust and reliance among community members as essential survival factors in flood situations. Social and physical reliance manifests through early warnings, safe evacuation, and resource sharing during emergencies. Residents perceive a significant distance between themselves and local government representatives, creating a trust deficit that can undermine preparedness and recovery effectiveness. However, FAG members occupy an intermediary position, recognized by communities for their emergency response capacity and willingness to provide immediate assistance during flood events.
Collective recovery practices demonstrate the strength of community social capital, as residents engage in mutual aid activities including rebuilding damaged homes, sharing resources with affected families, and coordinating post-flood cleanup efforts. These collaborative responses extend beyond material support to provide psychological stability and emotional resilience, reinforcing social cohesion during crisis periods. Residents also acknowledged gendered dimensions of collective action, recognizing that women play critical roles in caregiving, household management, and community support networks during disasters, though these responsibilities intensify under emergency conditions (Figure 8). The combined community efforts in evacuation, shelter management, resource pooling, and post-disaster reconstruction represent vital adaptive assets that, when strengthened through inclusive governance and adequate institutional support, significantly enhance overall community resilience [79].
3.3.5. Protection and Response Capacity
This theme represents how communities perceive the performance of local protection measures, their own coping mechanisms, and institutional actions, indicating awareness, preparedness, and resource availability (Figure 8). Response capacity is critical because it empowers community members and creates opportunities for proactive disaster management [61,72]. Residents expressed significant concern regarding embankment inadequacy. They reported, “A new embankment was built 2–3 years ago, but it is not strong enough and is being damaged frequently in multiple portions, and the current embankment is not high enough, causing flood water to enter the village easily. Also, it is not strong enough to combat tides and cyclones, hence it is damaged frequently.” These repeated failures reinforce perceptions that structural protection is fundamentally weak, leading to widespread dissatisfaction with government response.
In the absence of reliable structural protection, residents have adopted indigenous coping strategies, though they acknowledge these as temporary and insufficient. In the absence of reliable structural protection, residents have adopted various indigenous coping strategies, including tree planting near houses and sandbag use for soil stabilization. These indigenous protection strategies reflect community initiatives to enhance physical resilience, even when environmental constraints limit their effectiveness [81]. Institutional actions were perceived as reactive rather than preventive. The Union Parishad provided immediate help and shelter during floods, while NGO assistance typically arrives post-flood in the form of relief, followed by awareness programs and training for longer-term capacity building. Early warning mechanisms exist through public announcements, but residents from Kalamarchhara union described local government bodies that lack adequate capacity and equipment for effective awareness raising and preparedness activities.
3.3.6. Resilience and Adaptation Capacity
This theme emphasizes community understanding of long-term adaptation to coastal flooding through nature-based, social, and governance-based strategies, where adaptive capacity reflects both available resources and willingness to participate in institutional processes [72,82]. Residents demonstrated sophisticated awareness of hybrid protection approaches, advocating for strong embankments combined with tree plantation suited to local soil conditions, reflecting understanding of ecosystem-based adaptation principles [71,88]. Despite economic constraints, community members expressed willingness to contribute labor and emphasized the value of their accumulated local knowledge in planning and construction processes, stating: “We have been living here for a long time, and we know the strengths and weaknesses of this area. So, if the government works involve us in planning and constructing, it will be better.” Beyond physical protection, residents articulated multi-sectoral resilience needs, including post-flood health services, equitable housing support for displaced families, and livelihood security through financial grants or alternative employment, given repeated crop losses and income disruption. Residents proposed integrated governance approaches that would combine embankment maintenance, youth training, tree plantation, and community-based monitoring while creating employment opportunities, demonstrating a comprehensive understanding of coordinated interventions. However, significant barriers still exist, such as the externalization of responsibility and mistrust of authorities due to past experiences of inadequate support. Additionally, the willingness to relocate often depends on compensation and the provision of safe alternative land. This situation highlights the tension between forced displacement and the desire for agency in decision-making. While communities possess valuable local knowledge and express willingness to participate, realizing adaptive capacity requires bridging the trust gap and ensuring inclusive, participatory governance mechanisms that integrate local expertise into formal planning processes [84].
Across both study unions, community perceptions revealed a consistent narrative of intensifying environmental exposure, compounding economic vulnerability, and inadequate institutional support. While residents demonstrated sophisticated local knowledge and strong social capital, their adaptive capacity is constrained by resource limitations, institutional gaps, and limited agency in decision-making processes.
3.4. Assessment of Local Government and Institutional Practices
The results identified local government practices from the institutional perspective, based on interviews with Union Parishad officials and FAG coordinators (ST 9). The analysis reveals both acknowledged constraints and significant gaps between policy mandates and ground-level implementation capacity.
3.4.1. Inter-Agency Coordination
The interviews with local government officials and Flood Action Group members revealed a multi-layered governance system characterized by hierarchical dependencies, where the Union Parishad plays a frontline role in flood response and settlement protection, while the Flood Action Group facilitates coordination between the Union Parishad and local residents. Effective disaster management in coastal Bangladesh requires coordination across multiple governance levels, from union parishads at the grassroots to upazila offices and national programs like the Cyclone Preparedness Programme (CPP) [89].
Inter-agency coordination determines the speed and effectiveness of emergency response, resource mobilization, and recovery efforts. The Union Parishad plays a frontline role with responsibilities including early warning dissemination, evacuation and rescue, and emergency relief distribution, operating within a hierarchical system that requires coordination with higher authorities and partner organizations. Officials described the existing coordination as “moderately effective, but the response is sometimes delayed,” particularly when requiring support from higher levels. While operational frameworks exist as “we have our union disaster management plan, which we follow along with the CPP guidelines”, showing integration across governance levels remains incomplete. One official noted that “coordination between agencies can be improved to have more effective flood management and increase support to the people who lost houses and lands,” indicating recognized gaps in communication and joint planning. Collaboration with NGOs provides supplementary capacity for training, awareness raising, and material support, yet structural delays and communication gaps continue to undermine emergency management effectiveness [84]. Flood Action Group members, who serve as intermediaries between the Union Parishad, NGOs, and residents, emphasized their critical bridging role in facilitating information flow and resource mobilization during flood events, though they also noted challenges in maintaining consistent coordination mechanisms and ensuring timely response activation across all stakeholder groups (Figure 9).
Figure 9.
Thematic framework of local government practices.
3.4.2. Resource and Funding Constraints
Financial and technical resource limitations fundamentally constrain local government capacity to transition from reactive disaster response to proactive risk reduction. Infrastructure maintenance and protective measures require sustained investment, yet union parishads operate without dedicated budgets for disaster risk management activities [81]. Officials identified funding gaps as the primary constraint: “the biggest gaps we face are lack of adequate and timely funds for housing repair and also for embankment protection support.” This scarcity forces prioritization of emergency repairs over preventive maintenance, as they emphasized “only the emergency repairs are done by the union parishad if the funds are available, there is no fixed budget provided to the UP for the maintenance.” The scope of local government action is severely restricted, with officials noting their capacity is limited to providing emergency food and shelter rather than addressing long-term recovery needs such as house reconstruction. Beyond financial constraints, technical capacity limitations include the absence of digital monitoring tools and dependence on manual, community-based information systems. Officials articulated clear needs for enhanced autonomy and resources: “We need enough financial aid so that Union Parishad can provide direct support to flood-affected people instead of waiting for higher approval” and emphasized the need for more focus on long-term resilience rather than only short-term relief. Flood Action Group members similarly reported significant resource constraints, including insufficient equipment for early warning dissemination and a lack of technical support necessary for effective flood preparedness and response operations (Figure 9). These resource constraints fundamentally limit the ability of local government to implement comprehensive, sustained risk reduction strategies [81,86].
3.4.3. Governance Gaps
Governance gaps manifest across policy implementation, land management, housing support, and strategic planning, revealing systemic weaknesses that undermine effective disaster risk reduction (Figure 9). Infrastructure vulnerabilities persist in critical areas, as officials noted that “erosion and flood damage make it hard to keep roads and schools functional. Many health centers and tube wells go underwater.” Land management systems lack comprehensiveness at the union level, as official records do not capture all land loss, with documentation limited primarily to houses affected and completely damaged through field verification and upward reporting to upazila and land offices. Housing support faces both demand and capacity challenges, with limited program coverage: “Around 40–45 families are given housing support by the government in the ongoing housing project” while “in case of relocation housing and livelihood support is really challenging as the funding is limited.” Political influence further compromises equitable resource distribution, with housing support allocation susceptible to patronage networks and favoritism that prioritize political considerations over vulnerability assessments. Strategic planning for coastal zones remains underdeveloped, as no separate written plans exist specifically for coastal areas, with planning instead relying on union-level committees that operate under upazila and CPP guidelines. Weak enforcement mechanisms further diminish policy effectiveness even where frameworks nominally exist. Compounding these technical gaps, members of Flood Action Group also identified institutional constraints including “lack of funds, lack of technical staff, over-dependency on higher authority, political interferences sometimes change in leadership delay ongoing programs or alter priorities.” These multidimensional governance gaps indicate that even where policy frameworks exist, implementation effectiveness is severely compromised by institutional, financial, and political economy factors [82,90].
3.4.4. Community Engagement
Community participation in disaster risk reduction enhances both the effectiveness and legitimacy of interventions by integrating local knowledge and building ownership of protective measures [72]. Local government practices include training, awareness campaigns, and seasonal preparedness meetings conducted before cyclone season to encourage shelter use through direct engagement with community representatives. Officials also reported promoting community-led adaptation practices such as tree plantation, raising homestead yards, and constructing new houses on higher grounds, demonstrating some integration of participatory approaches within the existing governance framework. Emergency response mobilizes community networks, with Union Parishad members and village elders organizing shelter movements and evacuation processes.
Gender-sensitive approaches are implemented according to the members of FAG: “We always give priority to elderly, disabled, and women-headed households during evacuation and place them in their designated halls inside the shelters,” with separate facilities ensuring safety and privacy for women. However, structural limitations constrain genuine participation. Decision-making authority remains concentrated at higher levels, with community involvement largely consultative rather than collaborative in planning processes. Officials and FAG members both acknowledged that while communities are involved in certain activities, such as planning or relief distribution, strategic decisions remain coordinated by upazila offices with limited bottom-up input, reflecting a top-down governance structure that constrains meaningful community participation in decision-making processes (Figure 9). This gap between participation rhetoric and practice limits the integration of valuable local knowledge into formal risk reduction planning [79].
3.4.5. Data and Monitoring
Systematic data collection and monitoring are essential for evidence-based disaster risk management, enabling identification of vulnerable populations, tracking of settlement changes, and evaluation of intervention effectiveness [71]. However, monitoring systems at the union level remain largely informal and capacity-constrained, relying on manual processes rather than digitized tools. Officials explained reliance on traditional communication methods, manual field surveys, and community reporting compiled in Union Parishad registers. Performance measurement focuses on basic quantitative indicators, including the number of affected families supported, speed of household return, number of relocated households, and improved infrastructure condition, reflecting an output-oriented rather than outcome-focused approach. A critical gap exists in spatial monitoring capacity, as officials acknowledged: “We do not have digital tools or maps, but we monitor changes through local committee members.” Members of FAG identify challenges in tracking dynamic settlement patterns due to limitations. Access to services for relocated families is difficult because new settlements are often scattered and not officially recorded (Figure 9). The absence of systematic, digitized monitoring systems limits evidence-based planning and policy evaluation, creating a critical gap in local governance capacity that undermines both immediate response effectiveness and long-term risk reduction planning. Current monitoring relies on manual surveys; future systems could incorporate high-frequency radar or IoT-based water level sensors for real-time data, as used in advanced flood monitoring networks.
3.5. Stakeholder-Identified Vulnerability Reduction Measures
Table 6 shows vulnerability reduction measures identified across all stakeholder groups (residents, FAG members, and local government officials), ranked by frequency of mention during focus group discussions and key informant interviews. The frequency represents the total number of emphases across all data collection sessions, with measures mentioned multiple times by individual participants or groups counted accordingly.
Table 6.
Priority ranking of vulnerability reduction measures identified by all stakeholder groups.
The measures are categorized into four priority levels based on stakeholder emphasis: Critical (15+ mentions), High (10–14 mentions), Medium (6–9 mentions), and Low (≤5 mentions). Embankment protection and repair emerged as the most critical intervention with 19 mentions, reflecting its perceived centrality in defending against coastal flooding and preventing further settlement erosion. Permanent housing or relocation (11 mentions) and early warning equipment needs (10 mentions) were identified as high-priority measures, addressing both long-term settlement safety in flood-prone coastal areas and emergency response needs. Medium-priority interventions included nature-based measures such as tree plantation & soil binding (8 mentions) and relief distribution & shelter management (7 mentions), while local structural measures such as plinth and yard elevation received lower emphasis, suggesting they are viewed as supplementary rather than primary solutions by stakeholders in addressing coastal vulnerability.
The prioritization patterns reveal significant consensus across stakeholder groups regarding infrastructure protection, with embankment repair universally emphasized as the most critical intervention. The high priority assigned to permanent housing and relocation reflects growing recognition that adaptive retreat may be necessary in highly exposed coastal zones, though officials noted implementation challenges, including land acquisition costs, resettlement logistics, and political sensitivities. Notably absent from stakeholder priorities were measures related to land-use planning, building codes, or long-term spatial development strategies, suggesting a predominantly reactive rather than anticipatory approach to coastal settlement management.
3.6. Policy Effectiveness Assessment
Reducing coastal flood-induced settlement vulnerability requires comprehensive policy frameworks translated into effective ground-level implementation. Bangladesh has established multiple national and regional disaster management policies aimed at protecting coastal communities and managing displacement. This study assesses the effectiveness of key policy instruments based on local government officials’ and FAG members’ awareness, understanding, and implementation experiences, supplemented by analyzing seven major policy documents: National Water Policy (1999) [91], National Water Management Plan (2001) [92], National Disaster Management Policy (2015) [27], Bangladesh Delta Plan 2100 [26], SAARC Framework for Action [93], Standing Orders on Disaster (2019) [28], and Disaster Management Act (2012) [94].
3.6.1. Policy Awareness and Familiarity at Local Level
The seven national and local policy documents were evaluated across five core dimensions: (i) structural protection measures (embankments, shelters); (ii) community participation and inclusion; (iii) relocation and resettlement provisions; (iv) institutional coordination and implementation mechanisms; and (v) monitoring, evaluation, and feedback systems. These dimensions were selected to reflect both physical risk reduction and governance effectiveness at the local level.
Interviews with local government officials and FAG members revealed significant variations in policy awareness across different instruments. Officials demonstrated high familiarity with operational documents directly relevant to emergency response, particularly the Standing Orders on Disaster (2019) [28] and the Cyclone Preparedness Programme (CPP) [28] guidelines. Officials actively reference these instruments during flood events, integrating them into daily operational procedures.
However, awareness decreased substantially for strategic planning documents and higher-level policy frameworks. When asked about the Bangladesh Delta Plan 2100 [26], one official acknowledged, “We have heard about it, but we don’t have detailed knowledge of what provisions it contains for our area.” Similarly, neither the National Water Policy (1999) [91] nor the National Water Management Plan (2001) [92] was mentioned spontaneously by any respondents. When specifically prompted, officials indicated that these were “technical documents managed by the Water Development Board, not used at our level.”
Flood Action Group members demonstrated familiarity with disaster preparedness protocols and emergency response procedures taught through training programs, but showed limited awareness of the broader policy architecture governing coastal settlement management and displacement. FAG members’ training emphasizes operational skills over policy understanding, creating gaps in awareness of settlement management frameworks.
Policy awareness at the union level is operationally focused but strategically limited. Local actors are familiar with immediate disaster response protocols but lack understanding of comprehensive planning frameworks, creating a disconnect between strategic national visions (BDP 2100) and local implementation capacity [26].
3.6.2. Implementation Effectiveness
Structural Protection Measures
Multiple policies mandate coastal protection infrastructure, including embankments, polders, cyclone shelters, and drainage systems. The National Water Management Plan (2001) [92] identifies coastal embankment maintenance as a principal priority, while the Standing Orders on Disaster (2019) [28] instruct local officials to “keep a separate budget” for polder repairs and authorize emergency embankment maintenance.
Field assessments revealed substantial implementation gaps despite clear policy mandates. Field assessments confirmed substantial infrastructure performance gaps, with both residents and officials reporting repeated embankment failures and infrastructure damage that undermine the intended protective functions mandated by policy.
The root cause of implementation failure stems from the disconnect between policy directives and resource allocation mechanisms. The disconnect between prescribed maintenance responsibilities and actual budget allocation creates a reactive rather than preventive infrastructure management approach at the union level. The Standing Orders’ instruction to maintain separate budgets for infrastructure repairs remains largely unimplemented at the union level due to dependency on higher authorities for fund disbursement.
Structural protection policies are well-articulated but poorly implemented. The gap between policy mandates and actual infrastructure performance reflects systemic resource constraints, weak enforcement mechanisms, and the absence of dedicated budget lines at the local level where maintenance responsibilities nominally reside.
Early Warning and Emergency Response
The National Disaster Management Policy (2015) and Standing Orders on Disaster (2019) establish comprehensive early warning systems incorporating cyclone preparedness programs, warning dissemination protocols, and coordinated evacuation procedures [27,28]. These operational policies demonstrate relatively higher implementation effectiveness compared to strategic planning instruments.
Stakeholders confirmed functional warning dissemination systems in both study unions operating through established channels, though with noted variations in reach and timeliness. However, implementation challenges persist even within this relatively functional policy domain. These challenges include equipment shortages and coordination delays that compromise warning coverage, particularly for dispersed settlements requiring rapid mobilization. The effectiveness of emergency response depends heavily on volunteer capacity and individual commitment rather than institutionalized systems with adequate resources.
Assessment findings revealed that emergency response policies demonstrate moderate implementation effectiveness, with functional warning dissemination and evacuation coordination during major events. However, effectiveness depends on volunteerism and informal networks rather than adequately resourced institutional systems, creating vulnerability during simultaneous multi-location disasters or volunteer unavailability [81,84].
Settlement Management and Displacement
Critical gaps emerge in policies addressing coastal settlement planning, relocation, and displacement management, particularly in areas crucial for managing flood-induced changes in settlements. Analysis reveals that none of the seven examined policies establishes comprehensive frameworks for planned relocation, resettlement rights, land tenure security for displaced populations, or regulations preventing new settlements in identified high-risk coastal zones.
The Bangladesh Delta Plan 2100 acknowledges that creating a “flood-free Bangladesh for all” is neither feasible nor desirable, yet provides no concrete mechanisms for managing the resulting displacement and settlement redistribution [26]. The National Disaster Management Policy (2015) treats displacement as a temporary emergency requiring relief rather than permanent demographic transformation requiring spatial planning interventions [27].
Field evidence confirms ad hoc housing allocation and unregulated self-managed resettlement processes, with limited program coverage and political influences compromising equitable distribution, which directly reflects the absence of systematic policy frameworks for displacement management. The reliance on disaster response guidelines rather than proactive settlement planning frameworks leaves coastal zones without strategic spatial management tools.
Assessment shows that policies exhibit fundamental gaps in addressing settlement dynamics and displacement. The absence of planned relocation frameworks, land-use regulations for high-risk zones, and systematic resettlement support mechanisms leaves displaced populations to manage through informal, inequitable processes vulnerable to political patronage and market forces that reinforce rather than reduce vulnerability.
Community Participation and Local Empowerment
Multiple policies emphasize participatory approaches and community engagement. The SAARC Framework stresses “empowering at-risk populations, particularly women and the disadvantaged,” while the Disaster Management Act (2012) mandates Local Disaster Management Committees to develop context-specific local plans [93,94]. The Bangladesh Delta Plan 2100 adopts a “leaving no one behind” principle [26].
Implementation reality reveals participation remains largely consultative rather than collaborative. Officials confirmed community involvement primarily in operational activities rather than strategic planning, reflecting the consultative rather than collaborative nature of participation despite policy mandates for empowerment. Further, residents’ expressed desire for meaningful inclusion in planning processes highlights the gap between policy rhetoric and implementation practice. This gap limits the integration of valuable local knowledge into formal planning processes. The assessment reveals that participatory provisions in policies remain weakly implemented. Community engagement practices prioritize information dissemination and relief distribution over collaborative planning and decision-making, representing missed opportunities to leverage local knowledge and foster ownership of protective interventions.
3.6.3. Cross-Cutting Implementation Barriers
Analysis across all policy domains reveals four systemic barriers constraining effectiveness:
- Financial Resource Constraints: Officials identified the absence of dedicated disaster risk reduction budgets at the union level as a critical barrier, forcing them to rely on ad hoc allocations that require higher authority approval. This dependency introduces operational delays and constrains their autonomy in responding to coastal flooding challenges effectively.
- Institutional Fragmentation: Responsibilities for coastal management are distributed across multiple agencies (Water Development Board, local government, Department of Agricultural Extension, Forest Department) without effective coordination mechanisms [28]. Officials identified inter-agency coordination gaps as barriers to effective flood management, while the Bangladesh Delta Plan 2100 acknowledges the absence of water management bodies representing beneficiary stakeholders [26].
- Technical Capacity Gaps: Local government units lack technical expertise and digital tools for spatial planning and monitoring. Local officials reported that their dependence on manual monitoring systems, in the absence of digital tools or spatial data, constrains their capacity to conduct evidence-based planning and evaluate policy performance effectively.
Enforcement Weaknesses: Even where policy provisions exist on paper, weak enforcement mechanisms and accountability systems limit compliance. Political economy factors, including patronage networks, compromise equitable resource allocation and policy compliance, particularly in the distribution of housing support.
3.6.4. Comparative Policy Effectiveness
Table 7 synthesizes the effectiveness assessment across policy domains, based on triangulation of stakeholder interviews, implementation observations, and policy content analysis. Assessment reveals an inverse relationship between policy operational specificity and implementation effectiveness. Policies with clear procedural protocols for immediate disaster response (early warning, evacuation) demonstrate moderate effectiveness despite resource constraints. Conversely, policies requiring strategic planning, inter-agency coordination, and sustained investment (settlement management, structural protection maintenance) show very low effectiveness despite comprehensive formal frameworks. This pattern suggests that implementation barriers stem not from policy design deficiencies but from systemic governance constraints, including inadequate fiscal devolution, weak local technical capacity, institutional fragmentation, and the absence of accountability mechanisms linking policy mandates to ground-level outcomes.
Table 7.
Comparative assessment of policy implementation effectiveness.
Current policies provide an enabling framework for disaster risk reduction but fail to control coastal settlement dynamics and vulnerability effectively. The combination of fundamental policy gaps (particularly in settlement planning and displacement management), resource constraints, institutional fragmentation, and weak enforcement mechanisms results in reactive, ad hoc responses rather than proactive, systematic risk reduction. Union-level governance structures possess neither the financial resources, technical capacity, nor decision-making authority necessary to translate national policy visions into effective local action, creating a critical implementation gap that perpetuates community vulnerability despite extensive policy architecture.
4. Discussion
4.1. Settlement Dynamics and Environmental Change
Contrary to traditional urbanization models, the observed settlement patterns show a non-linear trajectory. Built-up areas expanded by 16.83% during 2005–2015 but contracted by 9.67% during 2015–2025, yielding a modest net increase of 7.16% over twenty years. This reversal marks a critical threshold where environmental pressures began overwhelming development forces. Similar patterns have been documented in other deltaic systems experiencing accelerated land loss [67,68], though few studies have quantified the temporal transition from expansion to contraction at this administrative scale.
The expansion phase primarily consumed barren land (604.30 km2 loss), indicating settlement growth into marginal coastal areas despite known flood exposure. This pattern reflects economic imperatives overriding hazard considerations, consistent with livelihood-driven migration theories [81,85]. The subsequent contraction phase, validated by community accounts of permanent land loss and neighborhood disappearance, demonstrates that repeated flooding exceeds recovery capacity and triggers irreversible settlement abandonment. This finding extends recent work on climate-induced displacement [17,84] by providing spatial evidence of the displacement process itself.
Comparable settlement dynamics have been reported in other deltaic regions, such as the Mekong Delta in Vietnam, where flood-induced erosion and salinity intrusion have driven both settlement expansion into risky zones and subsequent displacement [95]. Similar patterns of governance constraints, particularly limited local implementation capacity despite robust national policies, have also been observed in the Nile Delta and Mississippi Delta contexts [96]. These parallels suggest that the settlement- governance interactions identified in Chattogram reflect broader challenges common to climate-vulnerable deltas globally.
4.2. Spatial Heterogeneity in Vulnerability
The union-level analysis reveals that vulnerability is geographically concentrated rather than uniformly distributed. One-third of unions (62 of 193) experienced high to very high settlement changes, while two-thirds remained relatively stable. This heterogeneity reflects localized factors including geomorphology, protective infrastructure quality, and erosion proximity [8,22]. Such spatial concentration enables targeted resource allocation, a critical advantage given fiscal constraints facing coastal management programs.
However, field investigations found no corresponding differentiation in policy implementation. High-vulnerability unions reported identical resource limitations and coordination challenges as stable areas, indicating that governance systems fail to translate risk information into scaled responses. This disconnect between identified vulnerability and institutional response represents a fundamental failure in adaptive governance [18,79]. The vulnerability classification developed here provides a spatial framework that could guide prioritized interventions if coupled with appropriate resource allocation mechanisms.
4.3. Community Adaptation and Institutional Gaps
Community perceptions reveal sophisticated environmental knowledge but limited capacity to translate awareness into effective protection. Residents accurately described topographic vulnerability and changing hazard patterns, consistent with studies demonstrating the value of local ecological knowledge [71,72]. Communities’ observations of increasing flood intensity and duration correspond with observed climate trends [63,64], validating experiential knowledge as a valuable complement to instrumental records.
The normalization of annual flooding, while enhancing psychological coping, can reduce pressure for structural solutions and perpetuate dangerous exposure levels [79,80]. More critically, the scale of displacement documented through community accounts (approximately ten thousand families) far exceeds official records, revealing a hidden migration crisis. This displacement occurs primarily through informal market mechanisms where households self-finance relocation, depleting assets, and often moving to equally vulnerable locations [84,86]. The few families receiving government housing faced politically influenced allocation rather than needs-based distribution, undermining equity principles central to adaptation justice [82].
The disconnect between community needs and institutional responses is stark. Residents prioritized embankment strengthening, yet recently constructed infrastructure continues failing repeatedly. This suggests fundamental problems in design standards, construction quality, or maintenance. The emphasis on structural protection by both communities and officials, despite chronic infrastructure failures, indicates path dependency limiting consideration of alternative strategies, including nature-based solutions or planned retreat [88].
4.4. Governance Challenges and Implementation Deficits
The assessment of local government practices reveals critical gaps between national policy frameworks and ground-level implementation capacity. While Bangladesh has established comprehensive disaster management policies, these frameworks remain weakly operationalized at the union and upazila levels, where they must interface with vulnerable communities.
Four systemic barriers constrain effective implementation. First, financial resource constraints fundamentally limit local government capacity. Union Parishads operate without dedicated disaster risk reduction budgets, relying instead on ad hoc allocations requiring higher authority approval. Officials consistently identified funding gaps as their primary constraint, noting they can provide only emergency relief rather than addressing long-term recovery or preventive measures. This financial dependency creates implementation delays, reduces local autonomy, and forces prioritization of immediate repairs over strategic risk reduction.
Second, institutional fragmentation across multiple agencies (Water Development Board, local government, Department of Agricultural Extension, Forest Department) creates coordination challenges. Responsibilities for different aspects of coastal management are distributed without effective integration mechanisms, leading to duplicative efforts, communication gaps, and missed opportunities for synergistic interventions.
Third, technical capacity gaps severely limit evidence-based planning and monitoring. Union-level governance relies on manual data collection, community reporting, and informal monitoring rather than digital tools, spatial data systems, or systematic performance indicators. This capacity deficit prevents accurate tracking of settlement changes, vulnerability trends, and intervention effectiveness.
Fourth, enforcement weaknesses and political economy factors undermine equitable resource distribution. Housing support allocation processes are susceptible to political patronage, with officials acknowledging that “political influences occur in the case of providing government houses.” This compromises the targeting efficiency of limited resources and perpetuates vulnerability among households lacking political connections.
These implementation barriers are not unique to Chattogram Division but reflect broader governance challenges across Bangladesh’s coastal zone. Addressing them requires not merely additional policy formulation but fundamental reforms in fiscal decentralization, institutional coordination mechanisms, technical capacity building, and accountability systems. Financial reforms necessitate dedicated disaster risk reduction budgets at the Union Parishad level with enhanced decision-making autonomy, enabling transition from reactive relief provision to proactive resilience building. Institutional integration requires formal coordination mechanisms linking the Water Development Board, local government, and sectoral departments to reduce fragmentation and enable synergistic interventions. Technical capacity enhancement through digital monitoring tools, spatial data infrastructure, and systematic training programs emerged as essential for enabling evidence-based planning, currently constrained by manual, informal systems. Finally, governance improvements require the establishment of transparent, objective criteria for resource allocation to address patronage-based distribution patterns and ensure equitable targeting.
4.5. Methodological Contributions and Limitations
The integration of multi-temporal remote sensing with field-based investigation demonstrates advantages over single-method approaches. Spatial analysis quantifies the extent and geography of change while qualitative data explains underlying processes and constraints. This triangulation enhances validity and enables the development of spatially explicit, contextually appropriate recommendations [61,62]. The union-level vulnerability framework offers a replicable tool for prioritization across large coastal zones, addressing a methodological gap in translating regional assessments to actionable local interventions.
The findings align with the Bangladesh Delta Plan 2100 in prioritizing flood protection, settlement safety, and climate-resilient development at the coastal frontier. However, this study identifies key implementation gaps, particularly at the union level, where limited fiscal autonomy, weak coordination mechanisms, and insufficient community engagement constrain the realization of Delta Plan objectives. While the Plan emphasizes integrated and adaptive management, local implementation remains predominantly reactive and project-driven rather than anticipatory and spatially differentiated.
Several limitations warrant consideration. The 30 m Landsat resolution may miss small-scale changes or misclassify settlement types. Higher-resolution imagery could improve accuracy, but increases processing demands and may not be consistently available historically. Future research could integrate higher-resolution datasets such as Sentinel-2 (10 m) or commercial imagery to capture small-scale settlement changes, incremental infrastructure damage (e.g., embankment breaches, road degradation), and intra-settlement relocation processes that are not fully detectable using 30 m Landsat data. The absence of transitional land cover classes (such as partially damaged settlements) may lead to conservative estimates of expansion or contraction. Flood-damaged structures may be temporarily misclassified as barren land, potentially exaggerating settlement loss during extreme event periods.
The two case study unions, though strategically selected, limit generalizability. The 20-year timeframe captures medium-term dynamics but cannot assess longer historical trajectories or project future scenarios under different climate pathways. Future work should employ extended time series, hydrodynamic modeling of specific flood mechanisms, and comparative multi-country analysis to strengthen the understanding of coastal settlement dynamics under climate change [5,19].
5. Conclusions
This study demonstrates that coastal settlements in Chattogram Division are already undergoing significant transformation due to recurrent flooding, permanent land loss, and weak institutional capacity. By integrating remote sensing analysis (2005–2025) with community- and institution-level field evidence, the research identifies a widening gap between formal policy commitments and their practical implementation at the local level.
The spatial analysis reveals a clear turning point in settlement dynamics. Built-up areas expanded rapidly between 2005 and 2015 (16.83%) but declined sharply during 2015–2025 (9.67%), resulting in only modest net growth (7.16%) over two decades. This reversal indicates that environmental stressors such as flooding and erosion are now outweighing development forces. Vulnerability is spatially concentrated: 65 of 193 unions (33.68%) experienced high to very high settlement change, underscoring the need for geographically targeted adaptation strategies rather than uniform policy responses.
Qualitative findings further show that coastal communities possess detailed experiential knowledge of environmental change but lack the resources and institutional support needed for effective protection. Approximately 10,000 families have experienced permanent land loss, with displacement managed largely through informal, self-financed coping mechanisms that erode household assets and reinforce long-term vulnerability. Local government officials confirmed persistent implementation barriers, including limited budgets, fragmented institutional mandates, inadequate technical capacity, and politically driven resource allocation.
Policy performance varies by implementation complexity. While emergency response mechanisms function moderately well, strategic policies related to settlement planning, infrastructure maintenance, relocation, and land-use regulation consistently fail in practice. Critical policy gaps remain in planned relocation frameworks, resettlement rights, compensation mechanisms, and enforcement of development restrictions in high-risk zones.
Based on these findings, three priority actions are identified: (i) strengthening union-level governance through dedicated disaster risk reduction financing, enhanced technical capacity, and greater decision-making authority; (ii) establishing equitable and legally grounded planned relocation frameworks that address displacement, compensation, and livelihood transitions; and (iii) adopting spatially differentiated adaptation strategies guided by settlement vulnerability classifications, ranging from enhanced protection to assisted adaptive retreat.
Overall, the study confirms that climate change impacts on coastal settlements in Bangladesh are no longer future risks but present realities reshaping settlement patterns and livelihoods. Effective adaptation, therefore, depends not only on policy formulation but on governance reforms that enable local implementation. Without such reforms, environmental hazards will continue to drive unplanned displacement and deepen vulnerability. By providing spatial evidence alongside stakeholder perspectives, this study contributes actionable insights for strengthening coastal resilience in climate-vulnerable deltaic regions.
Supplementary Materials
The following are available online at https://www.mdpi.com/article/10.3390/geographies6010025/s1, Table S1: Accuracy Assessment Confusion Matrix of classified image 2005; Table S2: Producer’s, User’s, and Overall accuracy of classified image 2005; Table S3: Accuracy Assessment Confusion Matrix of classified image 2015; Table S4: Producer’s, User’s, and Overall accuracy of classified image 2015; Table S5: Accuracy Assessment Confusion Matrix of classified image 2025; Table S6: Producer’s, User’s, and Overall accuracy of classified image 2025; Table S7: Union-wise settlement area change and vulnerability zones; Table S8: Qualitative thematic analysis of residents’ perspectives (Focus Group Discussions) in selected coastal areas; Table S9: Qualitative thematic analysis of key informant perspectives (Flood Action Group Members and Local Government Officials) in selected coastal areas.
Author Contributions
Conceptualization, F.G.R.L. and S.S.; Methodology, S.S. and F.G.R.L.; Field investigation, R.R.R. and S.S.; Data preparation, S.S. and R.R.R.; Formal analysis, S.S. and R.R.R.; Original draft preparation, S.S. and R.R.R.; Review and editing, S.S. and F.G.R.L.; Visualization, S.S.; Supervision, F.G.R.L. and S.S. All authors have read and agreed to the published version of the manuscript.
Funding
This research was financially supported by the Directorate of Research and Extension (DRE), Chittagong University of Engineering & Technology (CUET), Bangladesh (Grant number: CUET/DRE/2024-2025/URP/014).
Institutional Review Board Statement
The research involved non-invasive social science methods, including field surveys, focus group discussions (FGDs), and key informant interviews (KIIs). According to the academic research practices of Chittagong University of Engineering & Technology (CUET), formal Institutional Review Board (IRB) or ethical review approval is not required for such non-experimental studies that do not involve medical procedures, experiments on humans or animals, or the collection of personal or sensitive data. Accordingly, IRB approval was not required for this study.
Informed Consent Statement
Informed consent was obtained from all subjects involved in the study.
Data Availability Statement
The original data presented in the study are openly available at Table 1 and the Supplementary Materials.
Acknowledgments
All authors are grateful for the logistical support from the Department of Urban and Regional Planning, Chittagong University of Engineering and Technology (CUET). Their appreciation extends to different authorities for their kind support in providing the relevant spatial data. Special thanks go to all of the survey respondents for providing their valuable insights and information.
Conflicts of Interest
The funding body had no role in the design of the study, data collection, analysis, interpretation of results, or writing of the manuscript. The authors declare no conflicts of interest.
Abbreviations
The following abbreviations are used in this manuscript:
| BDP | Bangladesh Delta Plan |
| BWDB | Bangladesh Water Development Board |
| CPP | Cyclone Preparedness Programme |
| FAG | Flood Action Group |
| FGD | Focus Group Discussion |
| GEE | Google Earth Engine |
| GPS | Global Positioning System |
| KII | Key Informant Interview |
| LaSRC | Land Surface Reflectance Code |
| LEDAPS | Landsat Ecosystem Disturbance Adaptive Processing System |
| LULC | Land Use and Land Cover |
| NDBI | Normalized Difference Built-up Index |
| NDMP | National Disaster Management Policy |
| NDVI | Normalized Difference Vegetation Index |
| NDWI | Normalized Difference Water Index |
| NGO | Non-Governmental Organization |
| NWMP | National Water Management Plan |
| NWP | National Water Policy |
| OA | Overall Accuracy |
| OLI | Operational Land Imager |
| PA | Producer’s Accuracy |
| QA | Quality Assessment |
| RF | Random Forest |
| SAARC | South Asian Association for Regional Cooperation |
| SDG | Sustainable Development Goal |
| SR | Surface Reflectance |
| TM | Thematic Mapper |
| UA | User’s Accuracy |
| UP | Union Parishad |
| USGS | United States Geological Survey |
| UTM | Universal Transverse Mercator |
| WGS84 | World Geodetic System 1984 |
References
- Rukhsana; Hasnine, M. Delineation of Multi Hazards Vulnerable Zone Using the Geospatial Approach: A Micro-Region Level Study in Indian Coastal Sundarban. Reg. Stud. Mar. Sci. 2024, 71, 103402. [Google Scholar] [CrossRef] [Scilit]
- Satta, A.; Snoussi, M.; Puddu, M.; Flayou, L.; Hout, R. An Index-Based Method to Assess Risks of Climate-Related Hazards in Coastal Zones: The Case of Tetouan. Estuar. Coast. Shelf Sci. 2016, 175, 93–105. [Google Scholar] [CrossRef] [Scilit]
- Jones, B.D.; Collings, B.; Dickson, M.E.; Ford, M.; Hikuroa, D.; Bickler, S.H.; Ryan, E. Regional Implementation of Coastal Erosion Hazard Zones for Archaeological Applications. J. Cult. Herit. 2024, 67, 430–442. [Google Scholar] [CrossRef] [Scilit]
- Sarker, S.; Adnan, M.S.G. Evaluating Multi-Hazard Risk Associated with Tropical Cyclones Using the Fuzzy Analytic Hierarchy Process Model. Nat. Hazards Res. 2024, 4, 97–109. [Google Scholar] [CrossRef] [Scilit]
- Xu, H.; Hou, X.; Zhang, B.; Bray, M.; Pan, S.; Huang, H. Exploring the Intersection between Coastal Flood Hazards and Socioeconomic Exposure: Evidence from China’s Coastal Zone. J. Environ. Manag. 2025, 393, 127072. [Google Scholar] [CrossRef] [Scilit]
- Lizarazo, S.C.; Sagiya, T.; Mora-Páez, H. Viscoelastic Earthquake Cycle Model for the Caribbean Subduction Zone in Northwestern Colombia: Implications of Coastal Subsidence for Seismic/Tsunami Hazards. J. S. Am. Earth Sci. 2024, 141, 104931. [Google Scholar] [CrossRef] [Scilit]
- Nikoo, M.R.; Yousefi, H.; Al-Wardy, M.; Al-Rawas, G.; Nazari, R.; Al Hanai, A.; Al-Zeidi, K. Risk-Based Assessment of Climate Change–Induced Hazards in Arid, Data-Scarce Coastal Zones. Ocean Coast. Manag. 2026, 272, 108024. [Google Scholar] [CrossRef] [Scilit]
- Hasan, I.; Rakib, M.H.; Roy, D.K.; Ovi, M.H.; Hasan, F.; Majumder, S.I. Geospatial Flood Susceptibility Modelling Using Analytical Hierarchy Process: A Case Study in the South-Central Coastal Region of Bangladesh. Geosyst. Geoenviron. 2026, 5, 100457. [Google Scholar] [CrossRef] [Scilit]
- Sarker, S.; Jahan, I.; Wang, X.; Azad, A.; Sarker, S.; Jahan, I.; Wang, X.; Azad, A. Geospatial Approach to Assess Flash Flood Vulnerability in a Coastal District of Bangladesh: Integrating the Multifaceted Dimension of Vulnerabilities. ISPRS Int. J. Geo-Inf. 2025, 14, 194. [Google Scholar] [CrossRef] [Scilit]
- Faruk, O.; Hasan, I.; Dey, J.; Ovi, M.H.; Katha, Z.T.; Goni, O. Nature-Based Solutions to Combat Flooding in Coastal Region of Bangladesh Using Spatial Multi-Criteria Analysis and Remote Sensing Techniques. Nat.-Based Solut. 2025, 8, 100279. [Google Scholar] [CrossRef] [Scilit]
- Fayshal, M.A. Geospatial Assessment of Land Use Dynamics and Vegetation Forecasting in Rajshahi District, Bangladesh. Next Res. 2025, 2, 101071. [Google Scholar] [CrossRef] [Scilit]
- Government of the People’s Republic of Bangladesh. Bangladesh Climate Change Strategy and Action Plan; Ministry of Environment and Forests: Dhaka, Bangladesh, 2009.
- Government of the People’s Republic of Bangladesh. National Adaptation Programme of Action (NAPA); Ministry of Environment and Forests: Dhaka, Bangladesh, 2005. Available online: https://unfccc.int/resource/docs/napa/ban01.pdf (accessed on 17 February 2026).
- Zaman, T.A.B.; Haque, T.; Gupta, H.S.; Sameer, M.; Nofal, O. Computational Review of Disaster Resilience Research in Bangladesh. Prog. Disaster Sci. 2025, 28, 100486. [Google Scholar] [CrossRef] [Scilit]
- Chowdhury, P.; Islam, T.; Tasmia, I.J.; Chowdhury, N.-U.-R. Power Sector Transformation in Bangladesh: Paving the Pathways towards Sustainable Development. Energy Strat. Rev. 2025, 61, 101829. [Google Scholar] [CrossRef] [Scilit]
- Chisty, M.A.; Muhtasim, M.; Biva, F.J.; Dola, S.E.A.; Khan, N.A. Sendai Framework for Disaster Risk Reduction (SFDRR) and Disaster Management Policies in Bangladesh: How Far We Have Come to Make Communities Resilient? Int. J. Disaster Risk Reduct. 2022, 76, 103039. [Google Scholar] [CrossRef] [Scilit]
- Islam, M.B.; Sultana, T.; Rana, I.A.; Waseem, H.B.; Murray-Tuite, P.; Tingsanchali, T.; Mahfuz, M. Assessing the Vulnerability of Selected Coastal Informal Settlements to Floods in the Old Brahmaputra River Floodplain, Bangladesh. Urban. Clim. 2024, 56, 102078. [Google Scholar] [CrossRef] [Scilit]
- Adnan, M.S.G.; Haque, A.; Hall, J.W. Have Coastal Embankments Reduced Flooding in Bangladesh? Sci. Total Environ. 2019, 682, 405–416. [Google Scholar] [CrossRef] [Scilit]
- Hasan, H.; Ahmed, A.; Nafee, K.M.; Hossen, A. Use of Machine Learning Algorithms to Assess Flood Susceptibility in the Coastal Area of Bangladesh. Ocean Coast. Manag. 2023, 236, 106503. [Google Scholar] [CrossRef] [Scilit]
- Deb, M.; Ferreira, C.M. Potential Impacts of the Sunderban Mangrove Degradation on Future Coastal Flooding in Bangladesh. J. Hydro-Environ. Res. 2017, 17, 30–46. [Google Scholar] [CrossRef] [Scilit]
- Adnan, M.S.G.; Abdullah, A.Y.M.; Dewan, A.; Hall, J.W. The Effects of Changing Land Use and Flood Hazard on Poverty in Coastal Bangladesh. Land. Use Policy 2020, 99, 104868. [Google Scholar] [CrossRef] [Scilit]
- Chowdhury, N.S.; Murshed, S.; Touhiduzzaman, S.; Basak, U.; Islam, A. A Holistic Geospatial Framework for Assessing Disaster Resilience in Coastal Bangladesh. Nat. Hazards Res. 2025, S2666592125000939. [Google Scholar] [CrossRef] [Scilit]
- Haider, M.Z.; Biswas, S.; Chowdhury, S. Household-Level Disaster Management Initiatives in the South-West Coastal Region of Bangladesh. Int. J. Disaster Resil. Built Environ. 2025, 16, 589–603. [Google Scholar] [CrossRef] [Scilit]
- Islam, M.S.; Zhang, Y. The Potential of Strategic Environmental Assessment to Reduce Disaster Risks through Climate Change Adaptation in the Coastal Zone of Bangladesh. Int. J. Clim. Change Strateg. Manag. 2018, 11, 137–153. [Google Scholar] [CrossRef] [Scilit]
- Bangladesh Water Development Board (BWDB). Flood Forecasting and Warning System of Bangladesh; Government of Bangladesh: Dhaka, Bangladesh, 1972.
- General Economics Division, P.C. Bangladesh Delta Plan 2100; Government of Bangladesh: Dhaka, Bangladesh, 2018.
- Ministry of Disaster Management and Relief. National Disaster Management Policy (NDMP); Government of Bangladesh: Dhaka, Bangladesh, 2015.
- Ministry of Disaster Management and Relief. Standing Orders on Disaster; Government of Bangladesh: Dhaka, Bangladesh, 2019.
- Huan, Y.; Ji, L.; Su, Y.; Kong, F.; Lan, Y.; Feng, Z.; Wang, S.; Liang, T.; Wang, M.; Mo, P.; et al. Global Governance Priorities Derived from SDG Spatiotemporal Dynamics and Causal Interactions. Gondwana Res. 2025, 151, 242–253. [Google Scholar] [CrossRef] [Scilit]
- Huan, Y.; Li, X.; Li, P.; Li, X.; Lan, Y.; Ji, L.; Lei, Y.; Su, Y.; Wang, M.; Tao, S.; et al. Capturing Spatio-Temporal Variations in SDG Interactions and Prioritizations. Appl. Geogr. 2026, 186, 103830. [Google Scholar] [CrossRef] [Scilit]
- Miah, J.; Hossain, K.T.; Hossain, M.A.; Najia, S.I. Assessing Coastal Vulnerability of Chittagong District, Bangladesh Using Geospatial Techniques. J. Coast. Conserv. 2020, 24, 66. [Google Scholar] [CrossRef] [Scilit]
- Bian, W.; Fang, J.; Du, S.; Hu, T. Evidence of Increasing Coastal Flood Risk along Mainland China from 1985 to 2050: Perspectives on Climate Change and Urban Expansion. Ocean Coast. Manag. 2025, 270, 107918. [Google Scholar] [CrossRef] [Scilit]
- Nujhat, M.; Amin, M.K.; Hasan, G.M.J. Coastal Vulnerability Assessment of the Western Coastal Zone of Bangladesh Using a Coupled Surge-Wave-Hydrodynamic Model. Ocean Coast. Manag. 2025, 267, 107720. [Google Scholar] [CrossRef] [Scilit]
- Feist, S.E.; Hoque, M.A.; Islam, A.; Dewan, A.; Fowler, M. Sea-Level Rise Drives Changes in Salinisation Patterns in Low-Lying Bangladesh. Ecol. Indic. 2025, 176, 113543. [Google Scholar] [CrossRef] [Scilit]
- Ullah, S. Sea-Level Rise and Sustainable Shore Protection Strategies in the Low-Lying Delta: A Case Study of Bangladesh. Reg. Stud. Mar. Sci. 2024, 71, 103424. [Google Scholar] [CrossRef] [Scilit]
- Centorame, L.; Ilari, A.; Del Gatto, A.; Foppa Pedretti, E. A Systematic Review on Precision Agriculture Applied to Sunflowers, the Role of Hyperspectral Imaging. Comput. Electron. Agric. 2024, 222, 109097. [Google Scholar] [CrossRef] [Scilit]
- Abdelmalik, K.W. Landsat 8: Utilizing Sensitive Response Bands Concept for Image Processing and Mapping of Basalts. Egypt. J. Remote Sens. Space Sci. 2020, 23, 263–274. [Google Scholar] [CrossRef] [Scilit]
- Asming, M.A.A.; Ibrahim, A.M.; Abir, I.M. Processing and Classification of Landsat and Sentinel Images for Oil Palm Plantation Detection. Remote Sens. Appl. Soc. Environ. 2022, 26, 100747. [Google Scholar] [CrossRef] [Scilit]
- Sarker, S.; Jahan, I. Strengthening Flash Flood Resilience in Coastal Bangladesh through Vulnerability Drivers and Policy Reform. Discov. Hazards 2026, 2, 4. [Google Scholar] [CrossRef] [Scilit]
- Campos, J.C.; Liz, A.V.; Patkó, L.; Abdulkarem, A.; Van Essen, L.; El-Bana, M.; Al-Ansari, A.; Al-Attas, O.; Brito, J.C. An Optimised Land-Use Land-Cover Classification Approach for General Application in Deserts and Arid Regions. Sci. Remote Sens. 2025, 12, 100334. [Google Scholar] [CrossRef] [Scilit]
- Schmidt, G.; Jenkerson, C.B.; Masek, J.; Vermote, E.; Gao, F. Landsat Ecosystem Disturbance Adaptive Processing System (LEDAPS) Algorithm Description; US Geological Survey: Reston, VA, USA, 2013.
- Vermote, E.; Justice, C.; Claverie, M.; Franch, B. Preliminary Analysis of the Performance of the Landsat 8/OLI Land Surface Reflectance Product. Remote Sens. Environ. 2016, 185, 46–56. [Google Scholar]
- Roy, D.P.; Kovalskyy, V.; Zhang, H.; Vermote, E.F.; Yan, L.; Kumar, S.; Egorov, A. Characterization of Landsat-7 to Landsat-8 Reflective Wavelength and Normalized Difference Vegetation Index Continuity. Remote Sens. Environ. 2016, 185, 57–70. [Google Scholar] [CrossRef] [Scilit] [PubMed]
- Sojib, R.H.; Hossain, M.; Khan, A.-A.; Baten, A.; Khan, B.; Tanzia, F.K.S.; Hasan, M. Land Use Land Cover Transformation and Seasonal Variations in Land Surface Temperature with Environmental Implications in Gazipur Sadar Upazila, Bangladesh. Urban. Clim. 2025, 64, 102662. [Google Scholar] [CrossRef] [Scilit]
- Hoque, S.A.; Nelson, J.; Tajwar, M.; Uddin, A.; Hasan, F. Multi-Scale Assessment of Land Use and Land Cover Dynamics on Groundwater Quality in the South-Central Coastal Region of Bangladesh. Clean. Water 2025, 4, 100152. [Google Scholar] [CrossRef] [Scilit]
- Sultana, M.; Hasnat, G.T.; Jashimuddin, M.; Khan, U.; Khan, M.N. Land Use and Land Cover Classification and Change Detection of Kaptai National Park of Bangladesh Using Multitemporal Remotely Sensed Imagery. In Vegetation Dynamics and Crop Stress; Elsevier: Amsterdam, The Netherlands, 2024; pp. 113–129. [Google Scholar]
- Kasiselvanathan, M.; Sridevi, P. Supervised Land Cover Classification of the Indian Sundarbans Mangrove Forest Using Random Forest and Landsat Imagery. J. Atmos. Sol.-Terr. Phys. 2025, 277, 106663. [Google Scholar] [CrossRef] [Scilit]
- Bhat, M.; Keskar, R.B. Self-Supervised Random Forests for Robust Voice Activity Detection with Limited Labeled Data. Appl. Acoust. 2025, 234, 110636. [Google Scholar] [CrossRef] [Scilit]
- Pantic, I.V.; Paunovic Pantic, J.; Valjarevic, S.; Corridon, P.R.; Topalovic, N. Artificial Intelligence—Based Approaches Based on Random Forest Algorithm for Signal Analysis: Potential Applications in Detection of Chemico—Biological Interactions. Chem.-Biol. Interact. 2025, 418, 111624. [Google Scholar] [CrossRef] [Scilit]
- Islam, K.; Sarker, S.; Morsad, G.; Khan, M.F.; Chowdhury, A.; Islam, S.L.U. Spatial–Temporal Changes of Shoreline and Vegetation: Impacts on Mangrove Cover along the Sundarbans Area, Bangladesh. J. Coast. Conserv. 2024, 28, 10. [Google Scholar] [CrossRef] [Scilit]
- Arsiso, B.K. Urban Land Cover Transformations and Thermal Dynamics through Integrated LULC, UHI, and Ecological Vulnerability Assessment Using Remote Sensing Indices in the City of Addis Ababa, Ethiopia. Sustain. Cities Soc. 2025, 135, 107017. [Google Scholar] [CrossRef] [Scilit]
- Zhang, K.; Fiwa, L.; Kurata, M.; Okazawa, H.; Luweya, K.A.B.; Mandal, M.S.H.; Sakai, T. Precise LULC Classification of Rural Area Combining Elevational and Reflectance Characteristics Using UAV. Sci. Afr. 2024, 26, e02431. [Google Scholar] [CrossRef] [Scilit]
- Xue, J.; Zhang, X.; Chen, S.; Hu, B.; Wang, N.; Shi, Z. Quantifying the Agreement and Accuracy Characteristics of Four Satellite-Based LULC Products for Cropland Classification in China. J. Integr. Agric. 2024, 23, 283–297. [Google Scholar] [CrossRef] [Scilit]
- Tejasree, G.; Agilandeeswari, L. Land Use/Land Cover (LULC) Classification Using Deep-LSTM for Hyperspectral Images. Egypt. J. Remote Sens. Space Sci. 2024, 27, 52–68. [Google Scholar] [CrossRef] [Scilit]
- Chumky, T.; Basu, M.; Onitsuka, K.; Parvin, G.A.; Hoshino, S. Disaster-Induced Migration Types and Patterns, Drivers, and Impact: A Union-Level Study in Bangladesh. World Dev. Sustain. 2022, 1, 100013. [Google Scholar] [CrossRef] [Scilit]
- Government of Bangladesh National Report on Population and Housing Census 2022. 2022. Available online: https://ghdx.healthdata.org/record/bangladesh-population-and-housing-census-2022 (accessed on 17 February 2026).
- da Silva, I.M.; Nogueira, T.Q.d.S.; Couto, D.N.; Lima, P.C.T.M.; Bonfim, N.S.C.; Sousa, I.G.V.d.; Telles, A.C.T.; Hecht, F.; Alkmim, N.R.; Penna, G.C.; et al. Feasibility of a Snowball Sampling Survey to Study Active Surveillance for Thyroid Microcarcinoma Treatment among Endocrinologists and Surgeons of Brazil. Braz. J. Otorhinolaryngol. 2022, 88, S163–S169. [Google Scholar] [CrossRef] [Scilit] [PubMed]
- Nogueira, R.; Pinho, J.O.; Plácido, A.I.; Coelho, A.C.; Oliveira, P.A.; Figueiras, A.; Roque, F.; Herdeiro, M.T. Exploring the Knowledge, Attitudes, and Practices of Livestock Veterinarians on Antibiotic Prescription and Use: Insights from Focus Group Discussions. Animal 2025, 19, 101648. [Google Scholar] [CrossRef] [Scilit]
- Olawade, D.B.; Omeni, D.; Gore, M.N.; Hadi, M. Enhancing Qualitative Research through Virtual Focus Groups and Artificial Intelligence: A Review. Int. J. Med. Inform. 2025, 203, 106004. [Google Scholar] [CrossRef] [Scilit]
- Mullick, M.R.A.; Nur, R.M.; Alam, M.J.; Islam, K.A. Observed Trends in Temperature and Rainfall in Bangladesh Using Pre-Whitening Approach. Glob. Planet. Change 2019, 172, 104–113. [Google Scholar] [CrossRef] [Scilit]
- Pawlik, M.; Kitagawa, K.; Shiroshita, H.; Jayaratne, R.; Nomoto, S.; Okumura, Y.; Kono, K. Proposing Thematic Mapping for Integrated Risk Communication: A Study of British & Japanese Perspectives in Flood-Prone Communities. Int. J. Disaster Risk Reduct. 2024, 107, 104472. [Google Scholar] [CrossRef] [Scilit]
- Thomalla, F.; Downing, T.; Spanger-Siegfried, E.; Han, G.; Rockström, J. Reducing Hazard Vulnerability: Towards a Common Approach between Disaster Risk Reduction and Climate Adaptation. Disasters 2006, 30, 39–48. [Google Scholar] [CrossRef] [Scilit]
- Alam, E.; Dominey-Howes, D. A New Catalogue of Tropical Cyclones of the Northern Bay of Bengal and the Distribution and Effects of Selected Landfalling Events in Bangladesh. Int. J. Climatol. 2015, 35, 801–835. [Google Scholar] [CrossRef] [Scilit]
- Rahman, S.; Rahman, M.A. Climate Extremes and Challenges to Infrastructure Development in Coastal Cities in Bangladesh. Weather. Clim. Extremes 2015, 7, 96–108. [Google Scholar] [CrossRef] [Scilit]
- Hasan, S.; Shi, W.; Zhu, X.; Abbas, S.; Khan, H.U.A. Future Simulation of Land Use Changes in Rapidly Urbanizing South China Based on Land Change Modeler and Remote Sensing Data. Sustainability 2020, 12, 4350. [Google Scholar] [CrossRef] [Scilit]
- Hassan, M.M.; Southworth, J. Analyzing Land Cover Change and Urban Growth Trajectories of the Mega-Urban Region of Dhaka Using Remotely Sensed Data and an Ensemble Classifier. Sustainability 2017, 10, 10. [Google Scholar] [CrossRef] [Scilit]
- Ghosh, M.K.; Kumar, L.; Roy, C. Monitoring the Coastline Change of Hatiya Island in Bangladesh Using Remote Sensing Techniques. ISPRS J. Photogramm. Remote Sens. 2015, 101, 137–144. [Google Scholar] [CrossRef] [Scilit]
- Auerbach, L.; Goodbred, S., Jr.; Mondal, D.; Wilson, C.; Ahmed, K.R.; Roy, K.; Steckler, M.; Small, C.; Gilligan, J.; Ackerly, B. Flood Risk of Natural and Embanked Landscapes on the Ganges–Brahmaputra Tidal Delta Plain. Nat. Clim. Change 2015, 5, 153–157. [Google Scholar] [CrossRef] [Scilit]
- Brammer, H. Bangladesh’s Dynamic Coastal Regions and Sea-Level Rise. Clim. Risk Manag. 2014, 1, 51–62. [Google Scholar] [CrossRef] [Scilit]
- Gui, R.; Song, W.; Lv, J.; Lu, Y.; Liu, H.; Feng, T.; Linghu, S. Digital Elevation Model-Driven River Channel Boundary Monitoring Using the Natural Breaks (Jenks) Method. Remote Sens. 2025, 17, 1092. [Google Scholar] [CrossRef] [Scilit]
- Abedin, M.A.; Collins, A.E.; Habiba, U.; Shaw, R. Climate Change, Water Scarcity, and Health Adaptation in Southwestern Coastal Bangladesh. Int. J. Disaster Risk Sci. 2019, 10, 28–42. [Google Scholar] [CrossRef] [Scilit]
- Shaw, R.; Mallick, F.; Islam, A. Climate Change Adaptation Actions in Bangladesh; Springer: Berlin/Heidelberg, Germany, 2013. [Google Scholar]
- Floods Hit Chandpur, Narail, Cox’s Bazar. The Financial Express. 2024. Available online: https://today.thefinancialexpress.com.bd/country/floods-hit-chandpur-narail-coxs-bazar-1724775732 (accessed on 17 February 2026).
- Waterlogging in Two Upazilas of Chattogram, Sandwip Cut Off. BDDigest. 2025. Available online: https://en.bddigest.com/waterlogging-in-two-upazilas-of-chattogram-sandwip-cut-off/ (accessed on 17 February 2026).
- Deep Depression in Bay of Bengal: Sandwip Isolated, Fear of Tidal Surge on the Coast. More News BD. 2025. Available online: https://morenewsbd.com/en/weather/3311/deep-depression-in-bay-of-bengal-sandwip-isolated-fear-of-tidal-surge-on-the-coast- (accessed on 17 February 2026).
- Zaman, A.M.U.; Kalam, M.A. Depression in Bay Triggers Coastal Flooding, Killing Three. Daily Sun. 2025. Available online: https://www.daily-sun.com/5/807529 (accessed on 17 February 2026).
- Center for Environmental and Geographic Information Services. Development of Hazard Zoning Maps Using CRA Process; Government of Bangladesh: Dhaka, Bangladesh, 2008.
- Paul, S.K.; Routray, J.K. Household Response to Cyclone and Induced Surge in Coastal Bangladesh: Coping Strategies and Explanatory Variables. Nat. Hazards 2011, 57, 477–499. [Google Scholar] [CrossRef] [Scilit]
- Grothmann, T.; Reusswig, F. People at Risk of Flooding: Why Some Residents Take Precautionary Action While Others Do Not. Nat. Hazards 2006, 38, 101–120. [Google Scholar] [CrossRef] [Scilit]
- Wachinger, G.; Renn, O.; Begg, C.; Kuhlicke, C. The Risk Perception Paradox—Implications for Governance and Communication of Natural Hazards. Risk Anal. 2013, 33, 1049–1065. [Google Scholar] [CrossRef] [Scilit]
- Paul, S.K.; Routray, J.K. Flood Proneness and Coping Strategies: The Experiences of Two Villages in Bangladesh. Disasters 2010, 34, 489–508. [Google Scholar] [CrossRef] [Scilit] [PubMed]
- Adger, W.N. Vulnerability. Glob. Environ. Change 2006, 16, 268–281. [Google Scholar] [CrossRef] [Scilit]
- Blaikie, P.; Cannon, T.; Davis, I.; Wisner, B. At Risk: Natural Hazards, People’s Vulnerability and Disasters; Routledge: Oxfordshire, UK, 2014. [Google Scholar]
- Haque, U.; Hashizume, M.; Kolivras, K.N.; Overgaard, H.J.; Das, B.; Yamamoto, T. Reduced Death Rates from Cyclones in Bangladesh: What More Needs to Be Done? Bull. World Health Organ. 2012, 90, 150–156. [Google Scholar] [CrossRef] [Scilit]
- Islam, M.M.; Sallu, S.; Hubacek, K.; Paavola, J. Limits and Barriers to Adaptation to Climate Variability and Change in Bangladeshi Coastal Fishing Communities. Mar. Policy 2014, 43, 208–216. [Google Scholar] [CrossRef] [Scilit]
- Brouwer, R.; Akter, S.; Brander, L.; Haque, E. Socioeconomic Vulnerability and Adaptation to Environmental Risk: A Case Study of Climate Change and Flooding in Bangladesh. Risk Anal. Int. J. 2007, 27, 313–326. [Google Scholar] [CrossRef] [Scilit] [PubMed]
- Aldrich, D.P.; Meyer, M.A. Social Capital and Community Resilience. Am. Behav. Sci. 2015, 59, 254–269. [Google Scholar] [CrossRef] [Scilit]
- Van Der Meulen, F.; IJff, S.; Van Zetten, R. Nature-based Solutions for Coatal Adaptation Management, Concepts and Scope, an Overview. Nord. J. Bot. 2023, 2023, e03290. [Google Scholar] [CrossRef] [Scilit]
- Habib, A.; Shahidullah, M.; Ahmed, D. The Bangladesh Cyclone Preparedness Program. A Vital Component of the Nation’s Multi-Hazard Early Warning System. In Institutional Partnerships in Multi-Hazard Early Warning Systems: A compilation of Seven National Good Practices and Guiding Principles; Springer: Berlin/Heidelberg, Germany, 2012; pp. 29–62. [Google Scholar]
- Islam, M.M.; Hasan, M.; Mia, M.S.; Al Masud, A.; Islam, A.R.M.T. Early Warning Systems in Climate Risk Management: Roles and Implementations in Eradicating Barriers and Overcoming Challenges. Nat. Hazards Res. 2025, 5, 523–538. [Google Scholar] [CrossRef] [Scilit]
- Ministry of Water Resources. National Water Policy (NWP); Government of Bangladesh: Dhaka, Bangladesh, 1999.
- Ministry of Water Resources. National Water Management Plan; Government of Bangladesh: Dhaka, Bangladesh, 2001.
- South Asian Association for Regional Cooperation. SAARC Comprehensive Framework on Disaster Management; South Asian Association for Regional Cooperation: Kathmandu, Nepal, 2006; Available online: http://www.ifrc.org/docs/IDRL/framework.pdf (accessed on 17 February 2026).
- Government of the People’s Republic of Bangladesh. Disaster Management Act, 2012; Legislative and Parliamentary Affairs Division: Dhaka, Bangladesh, 2012. Available online: https://legislativediv.portal.gov.bd/sites/default/files/files/legislativediv.portal.gov.bd/page/5a6bca14_6a2e_44e4_b155_c8147d1edd65/23.%20Disaster%20Management%20Act%2C%202012.pdf (accessed on 17 February 2026).
- Tran, H.; Nguyen, Q.; Kervyn, M. Household Social Vulnerability to Natural Hazards in the Coastal Tran Van Thoi District, Ca Mau Province, Mekong Delta, Vietnam. J. Coast. Conserv. 2017, 21, 489–503. [Google Scholar] [CrossRef] [Scilit]
- Bucx, T. Comparative Assessment of the Vulnerability and Resilience of 10 Deltas: Synthesis Report; Deltares: Delft-Wageningen, The Netherlands, 2010. [Google Scholar]
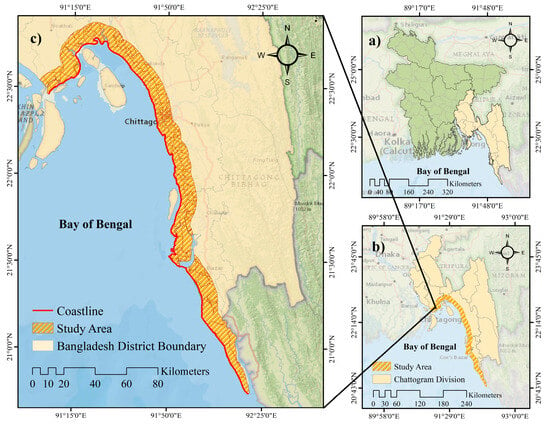
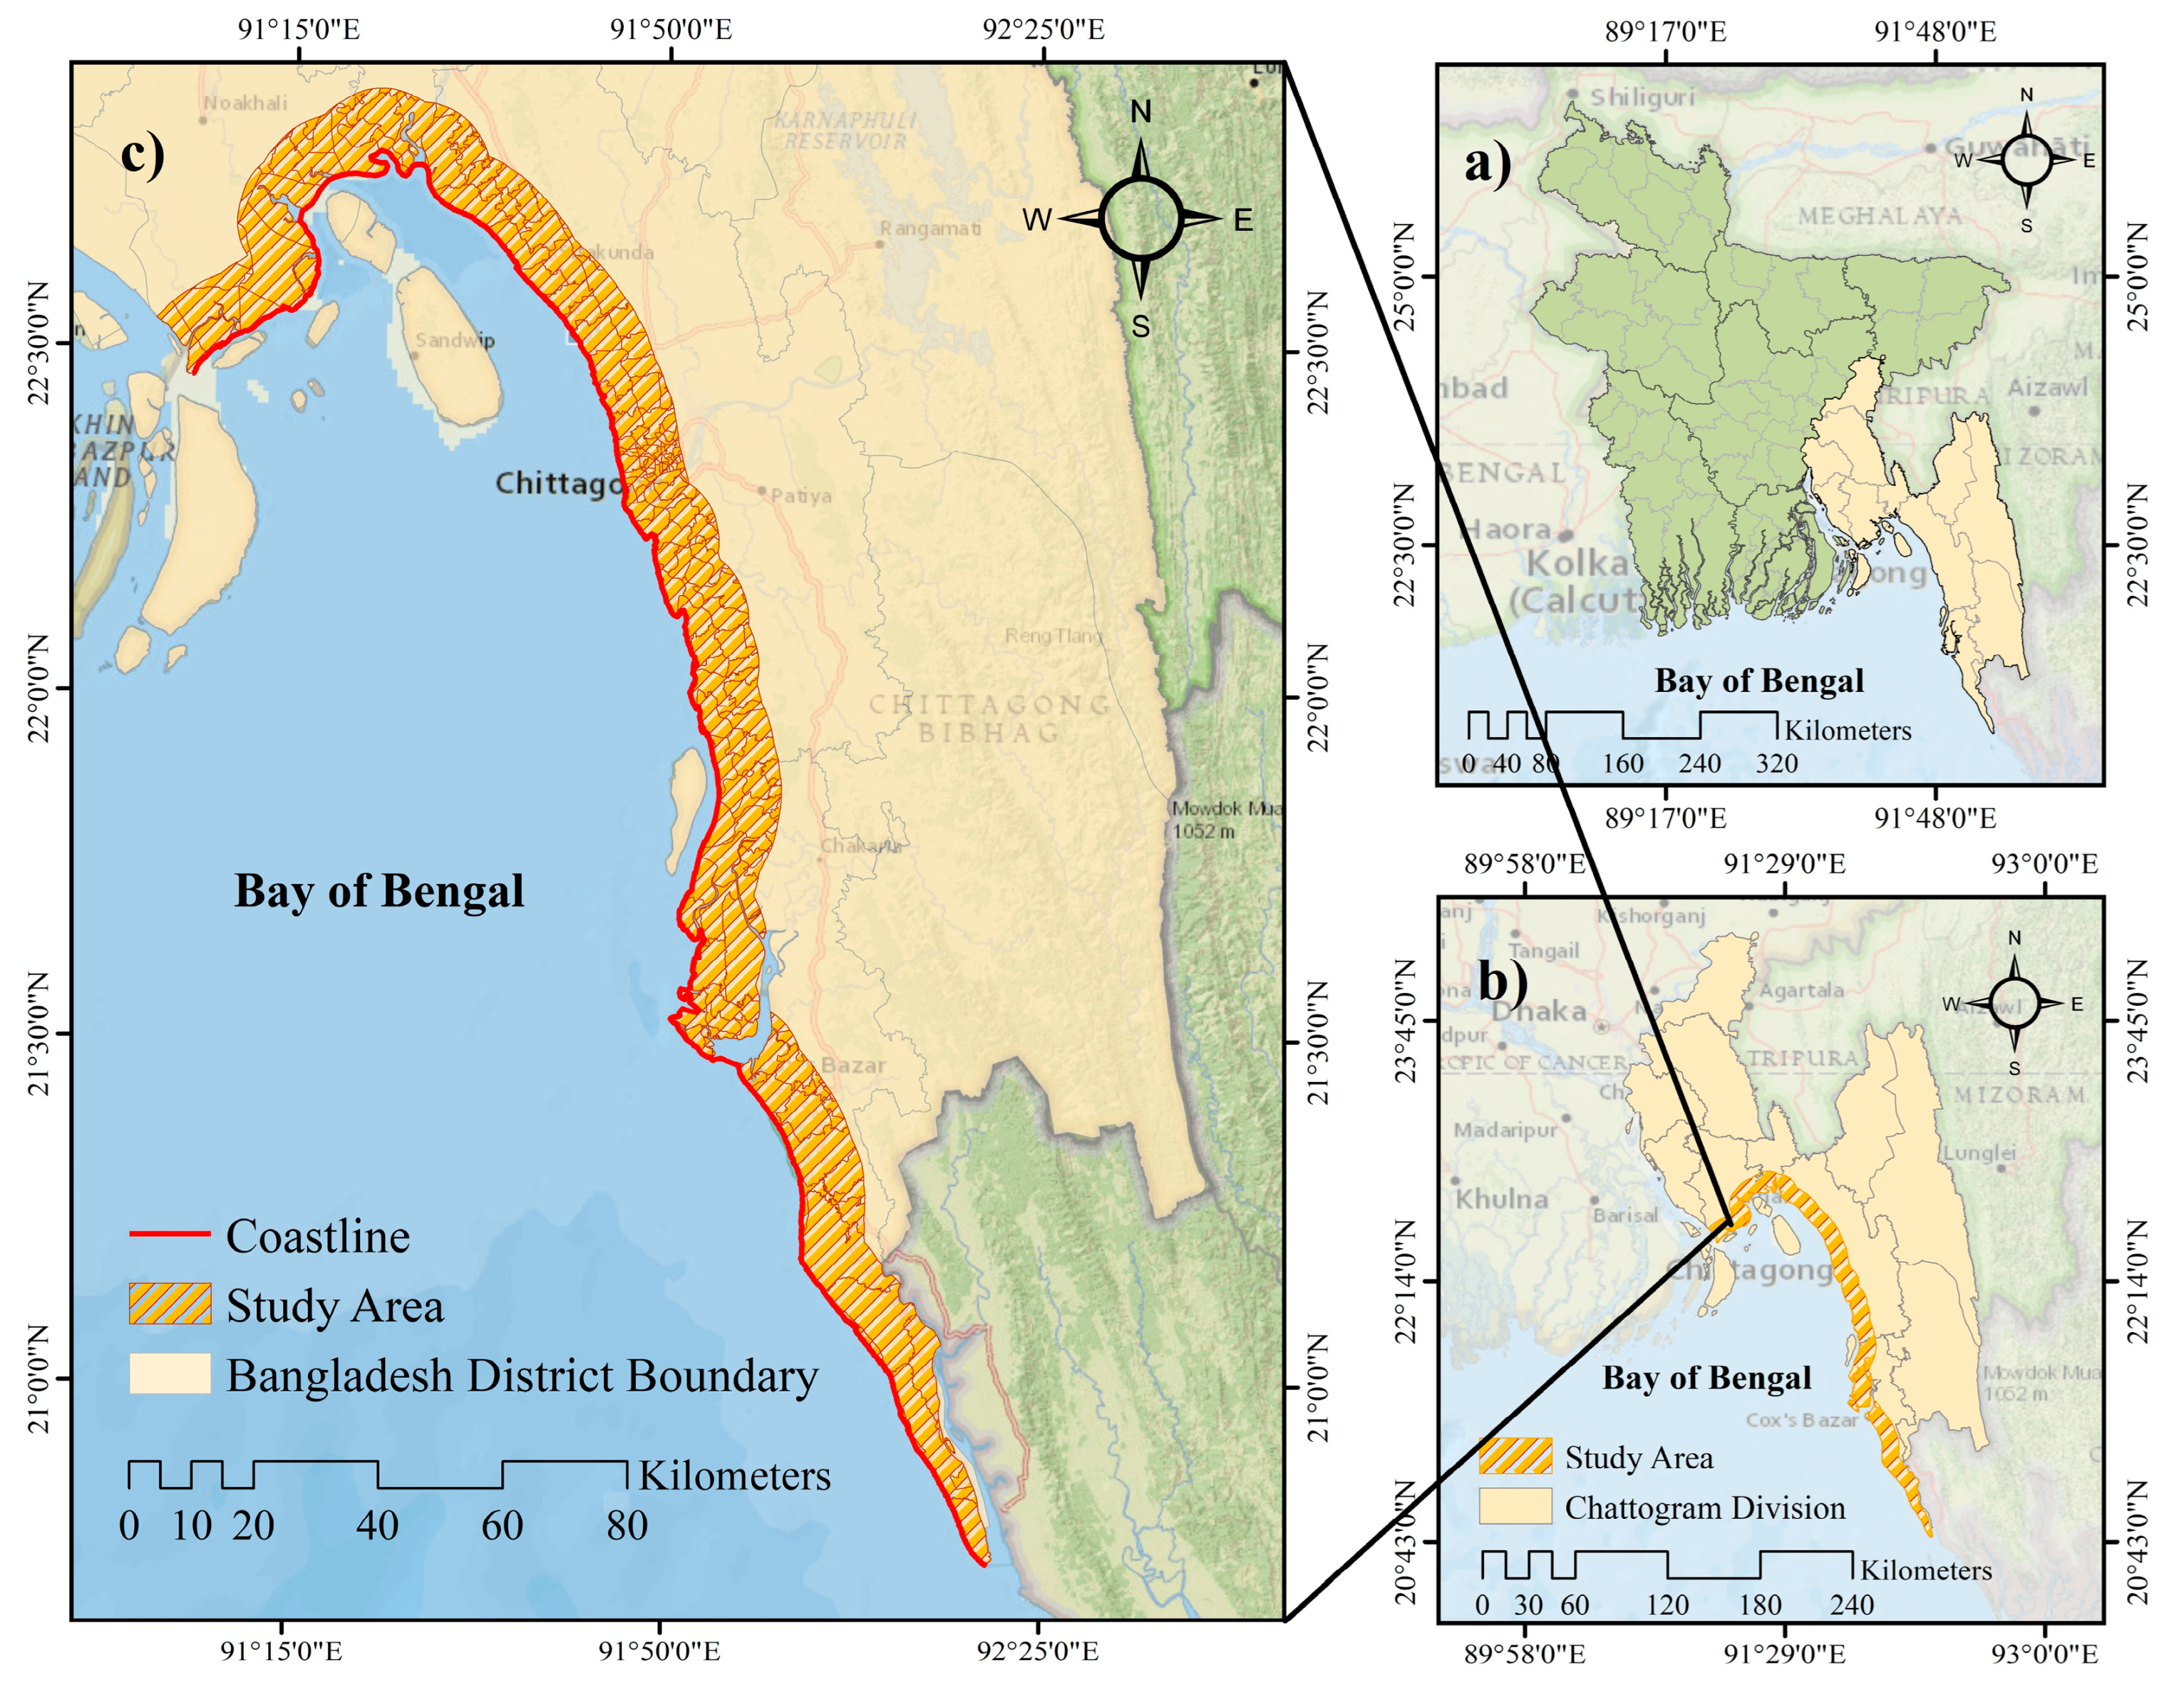
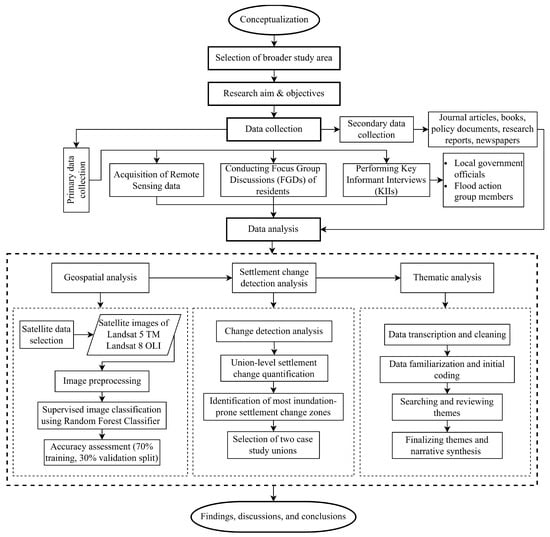
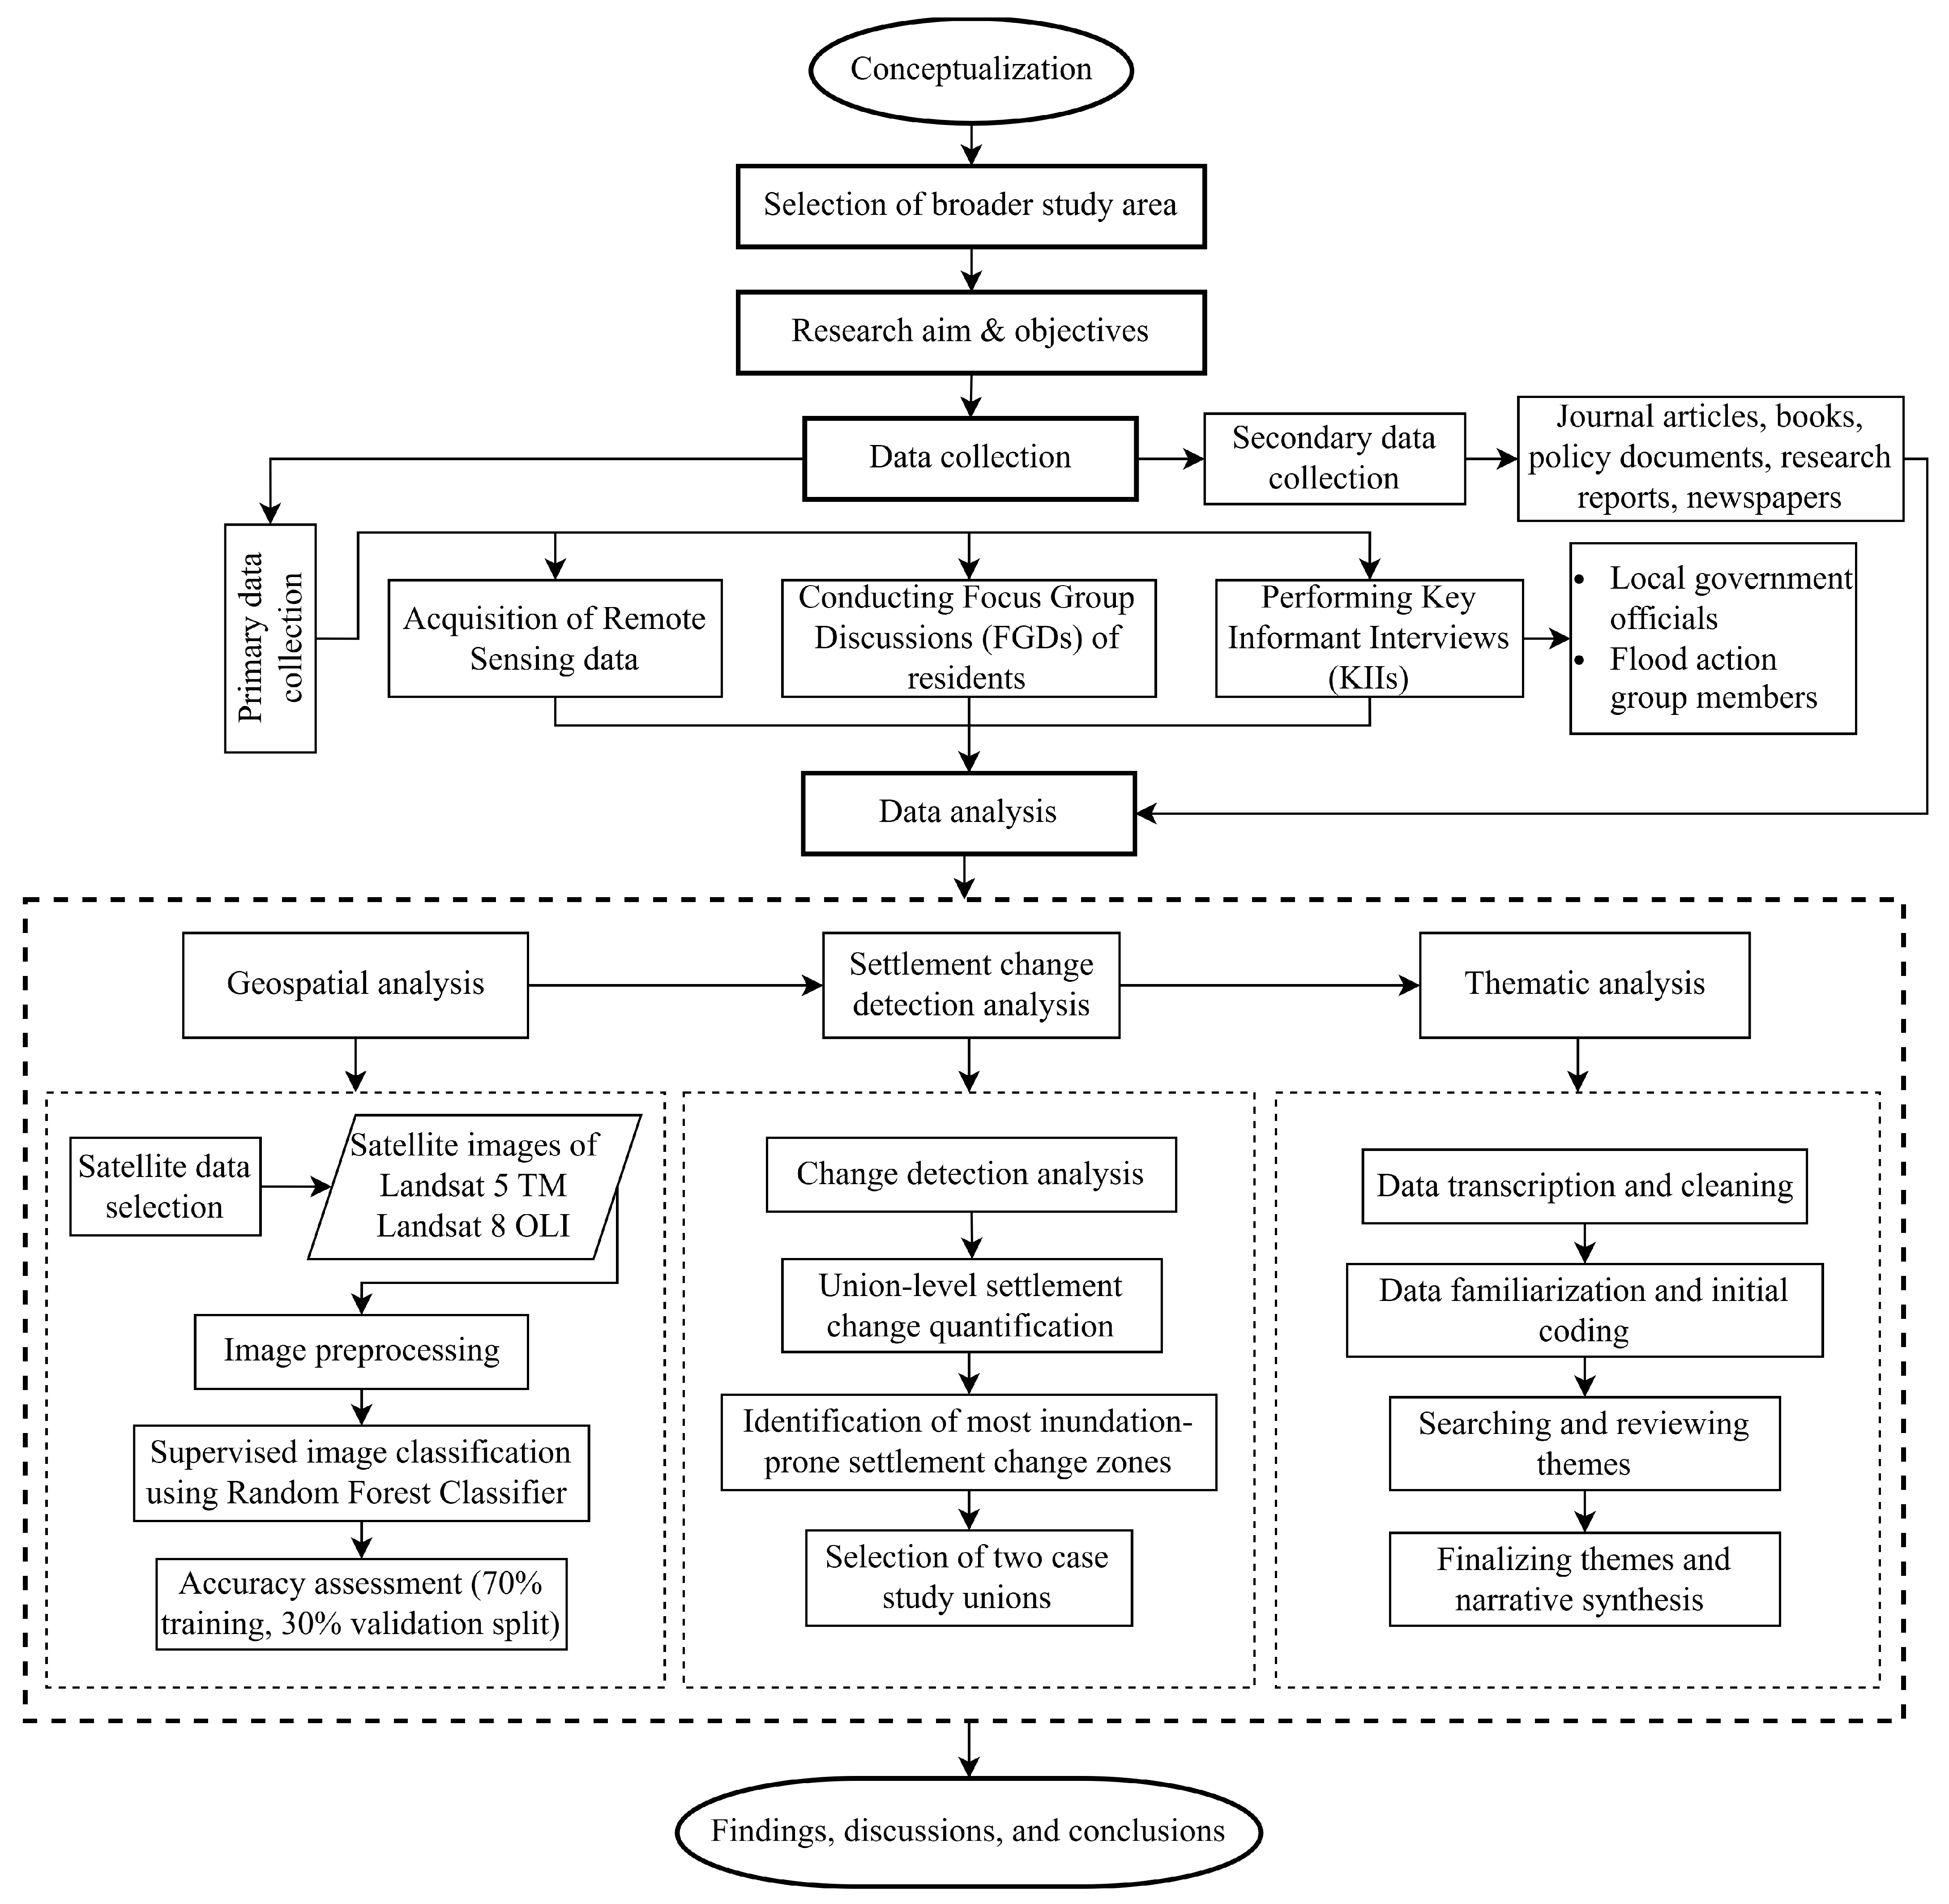


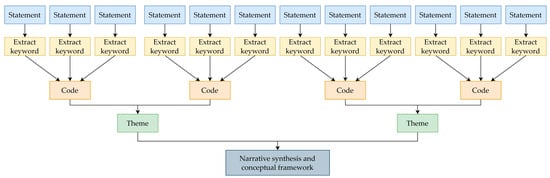
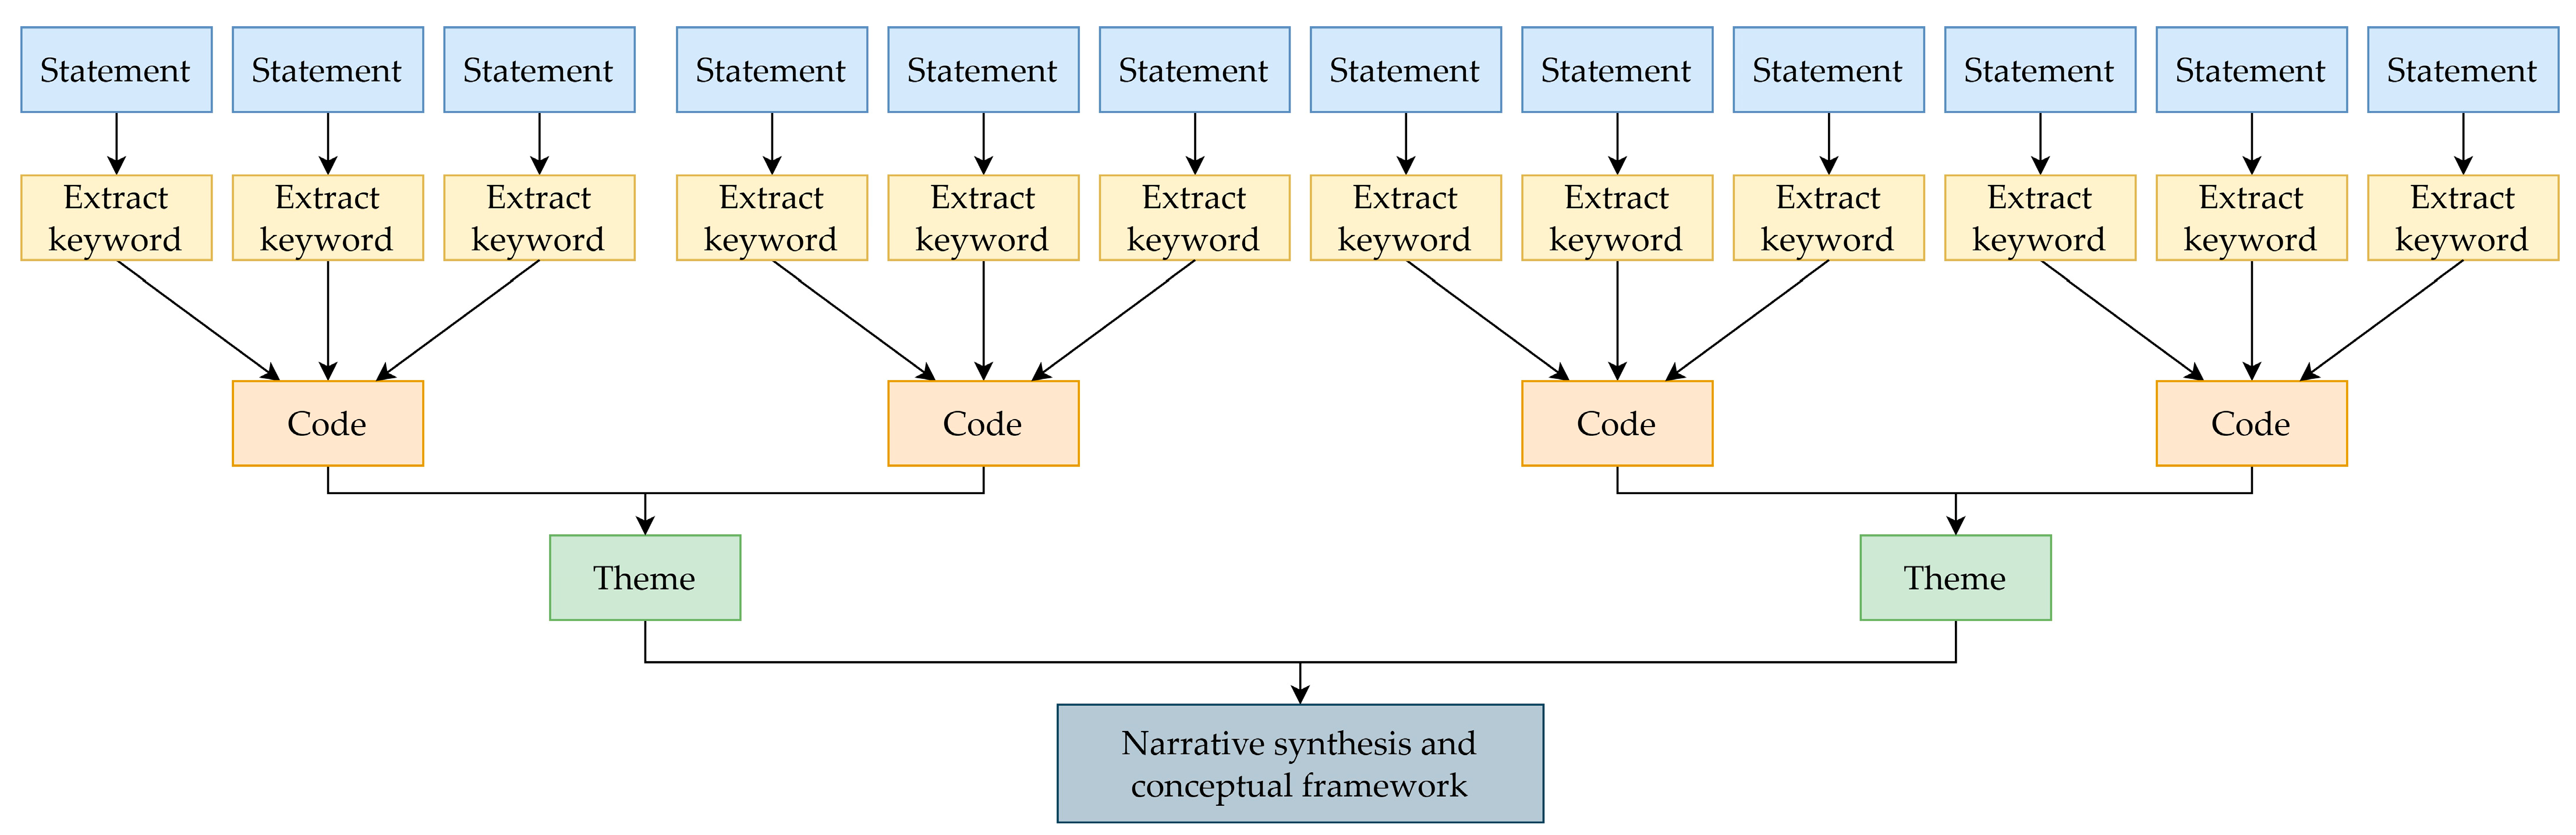
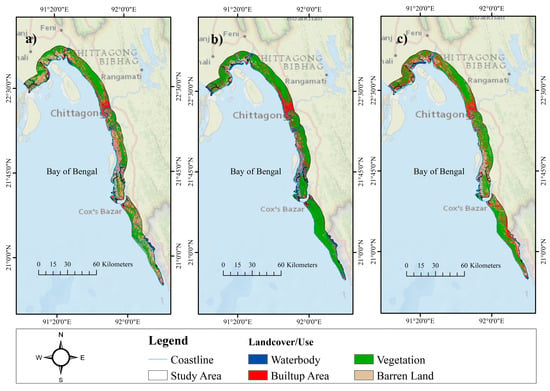
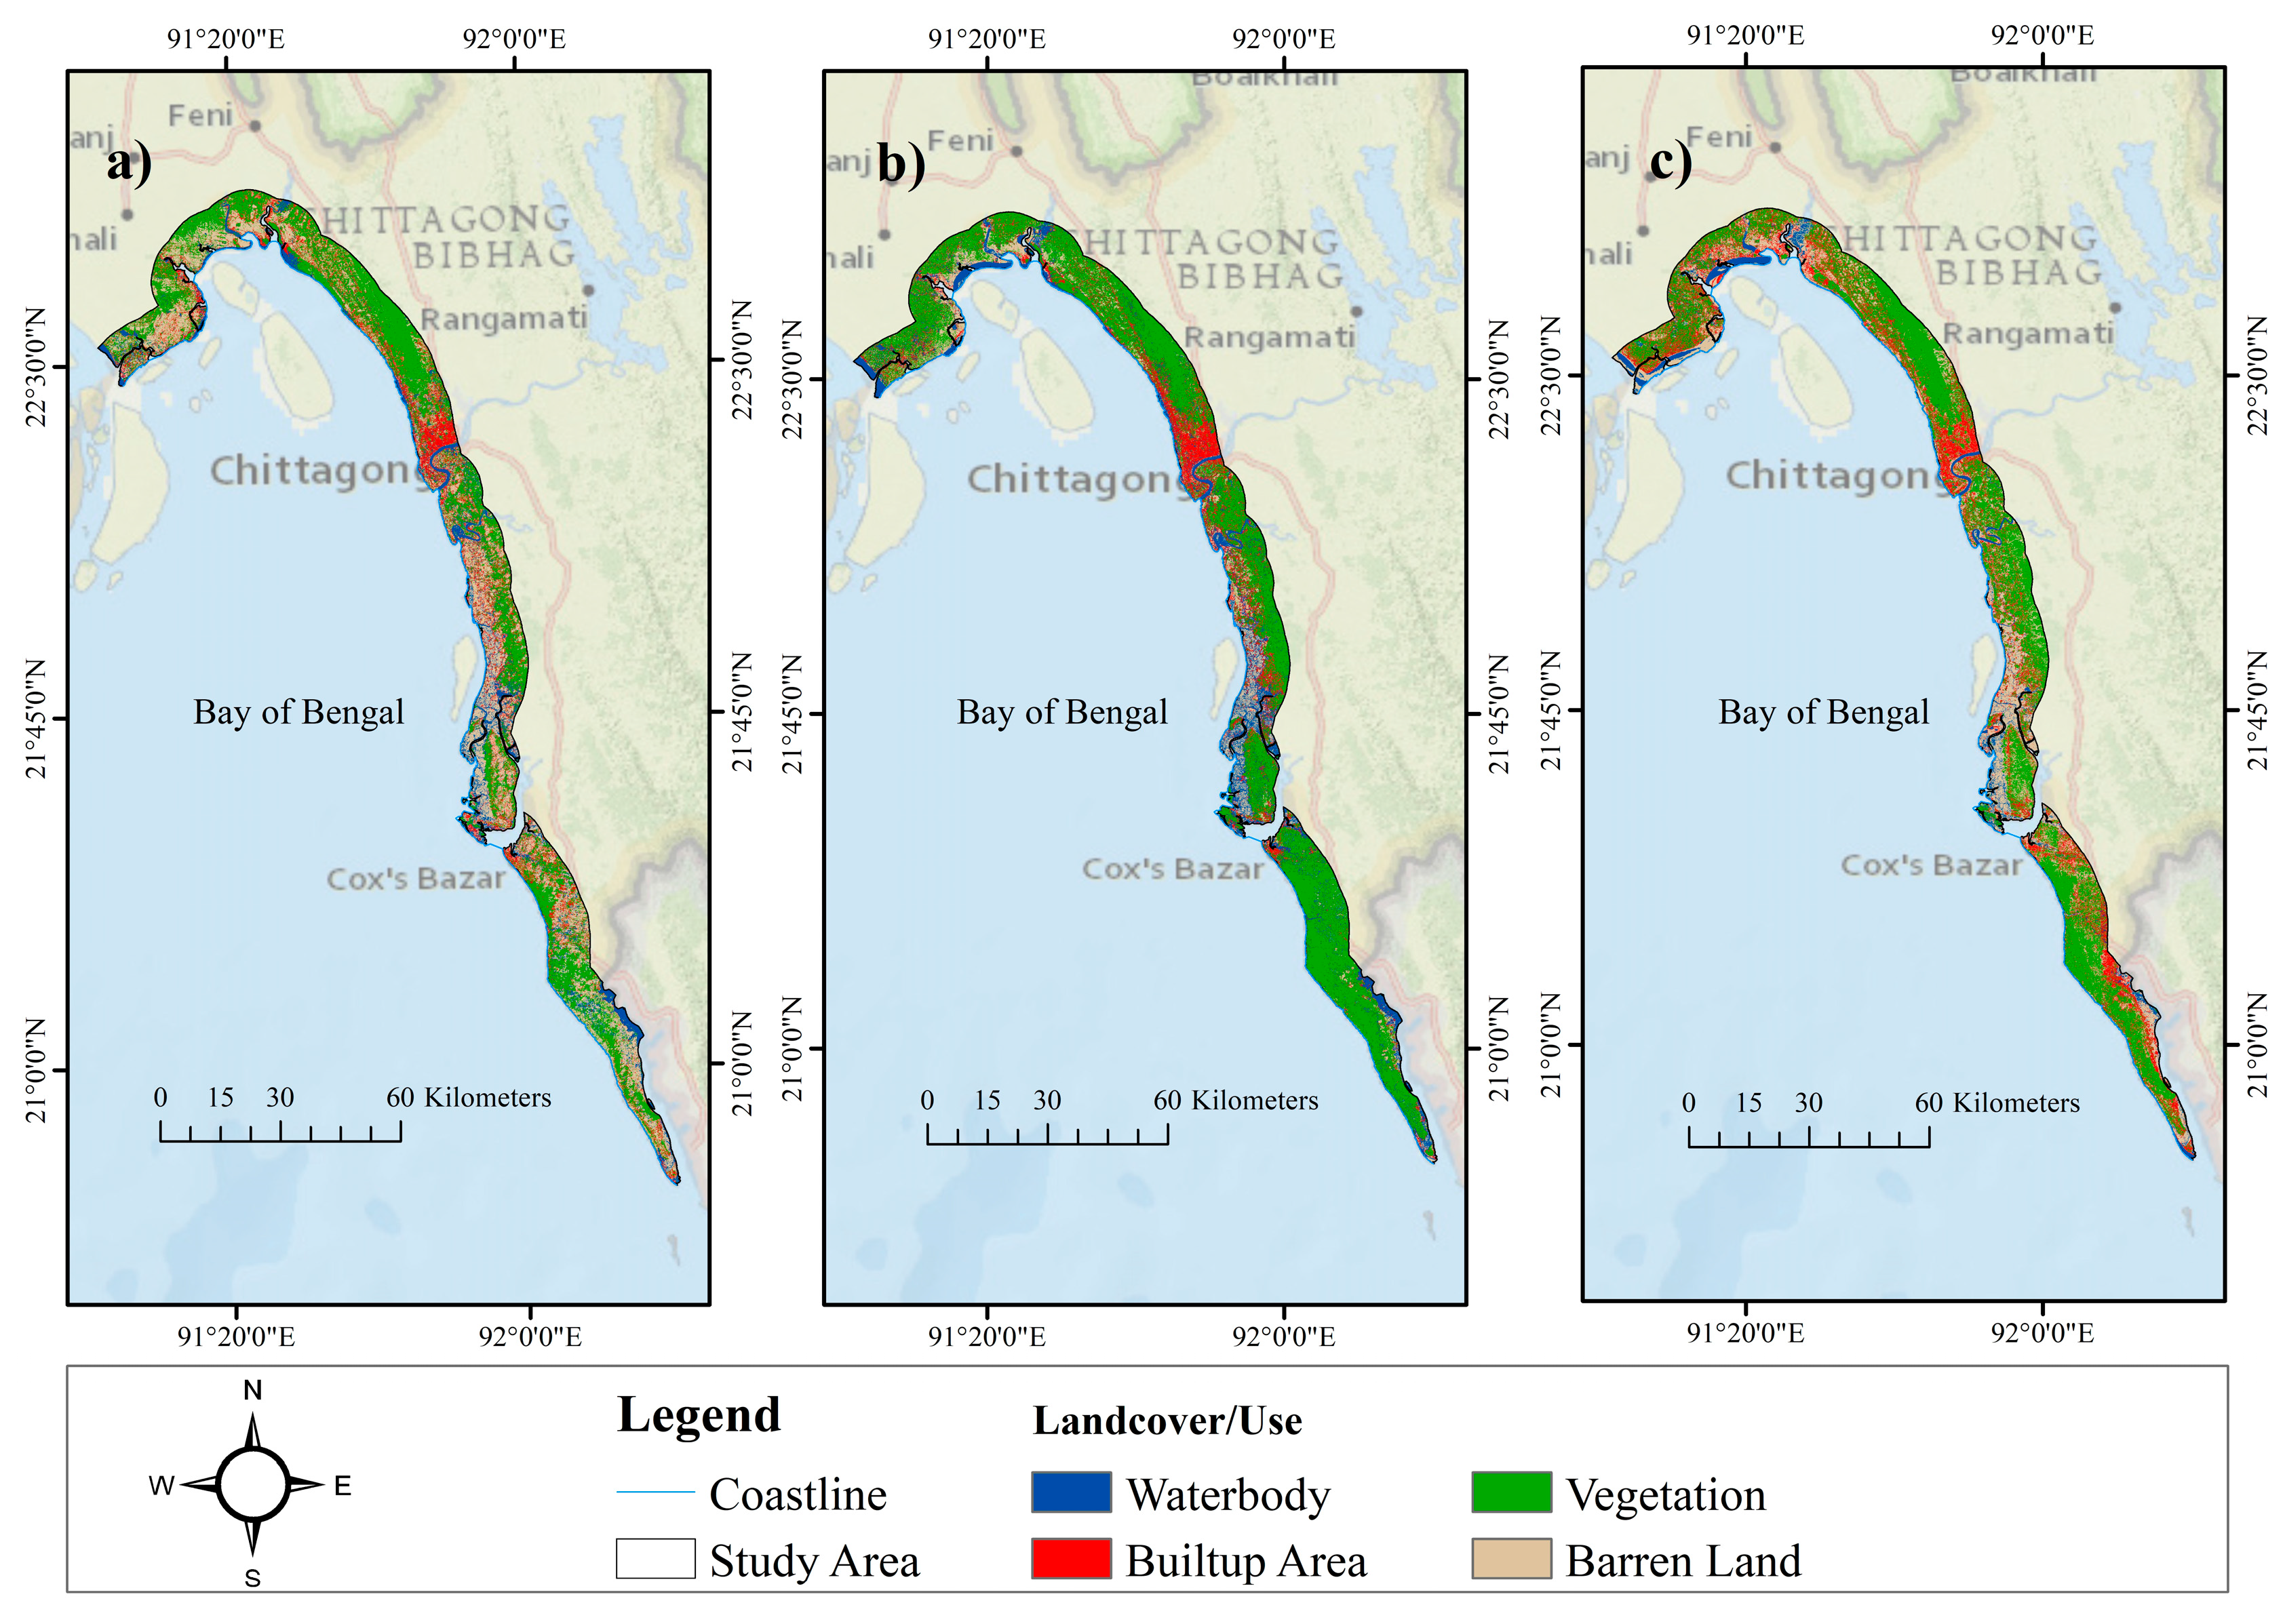
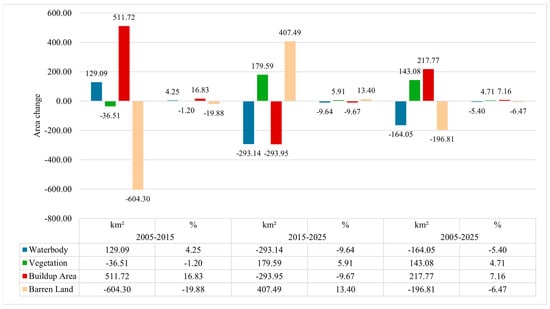
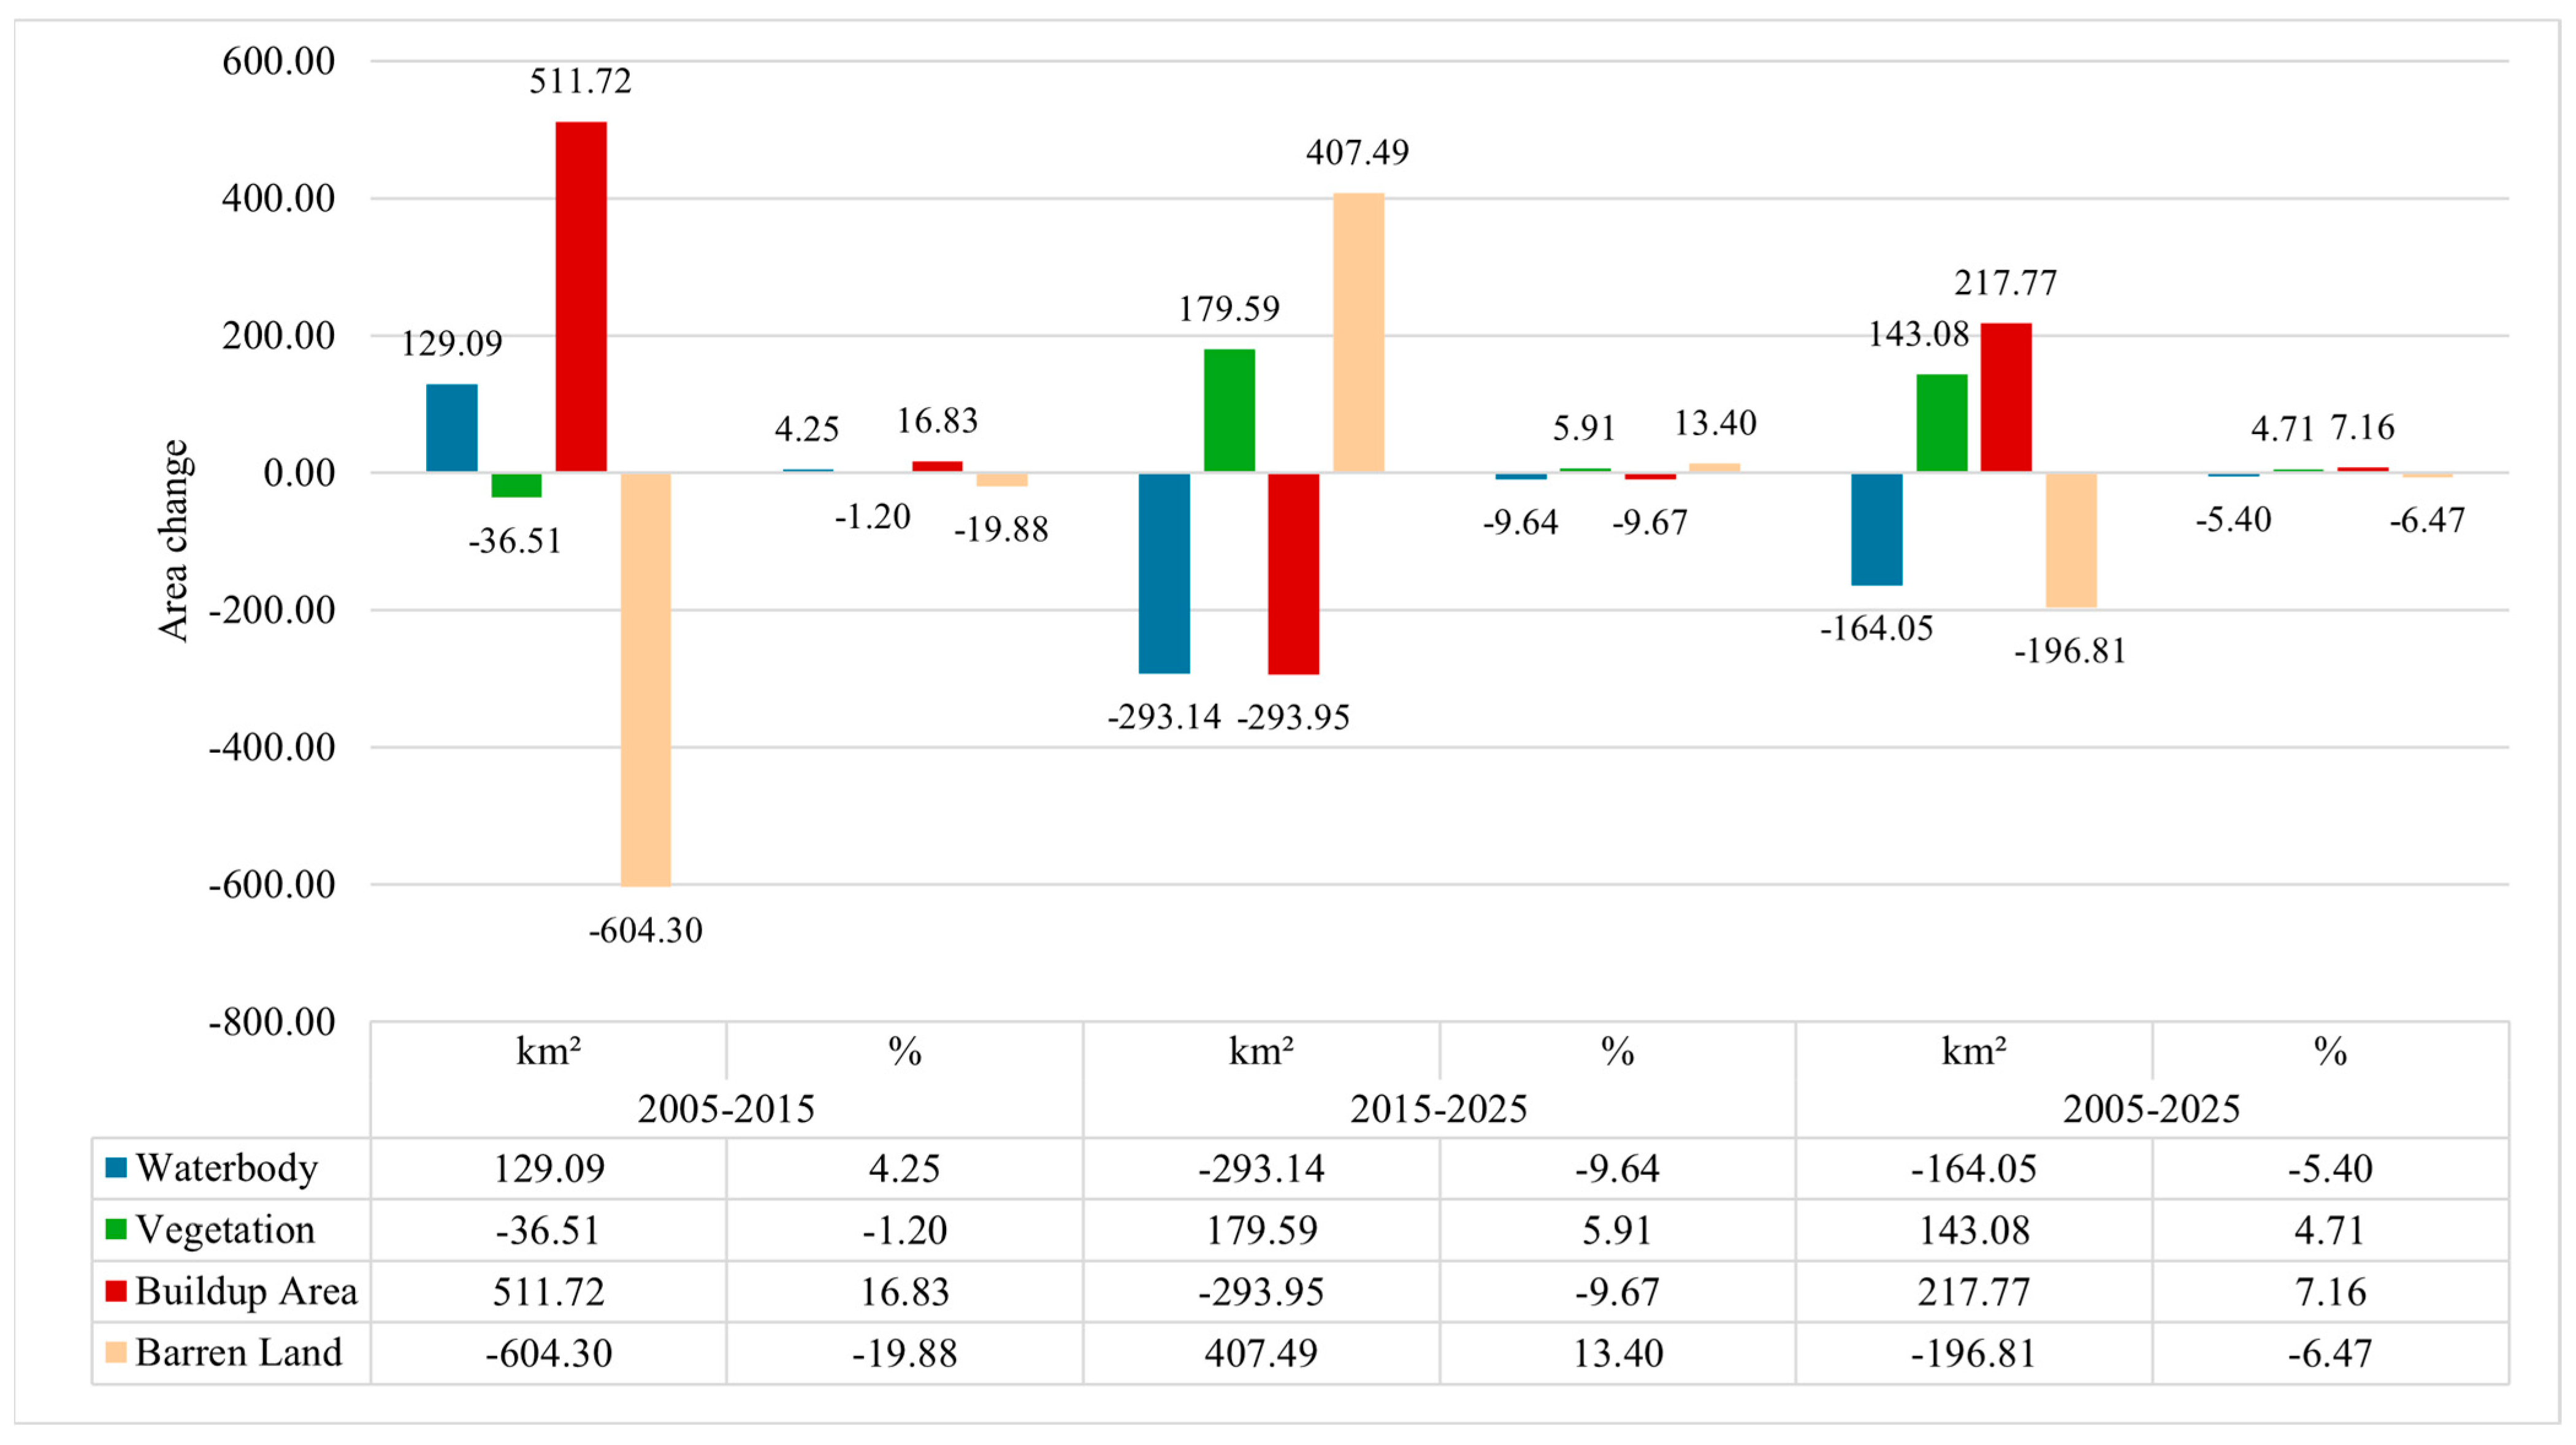
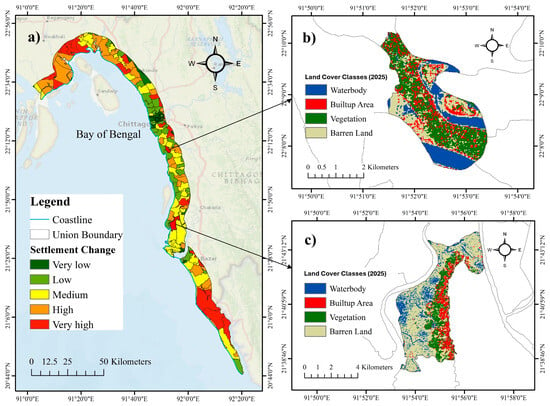
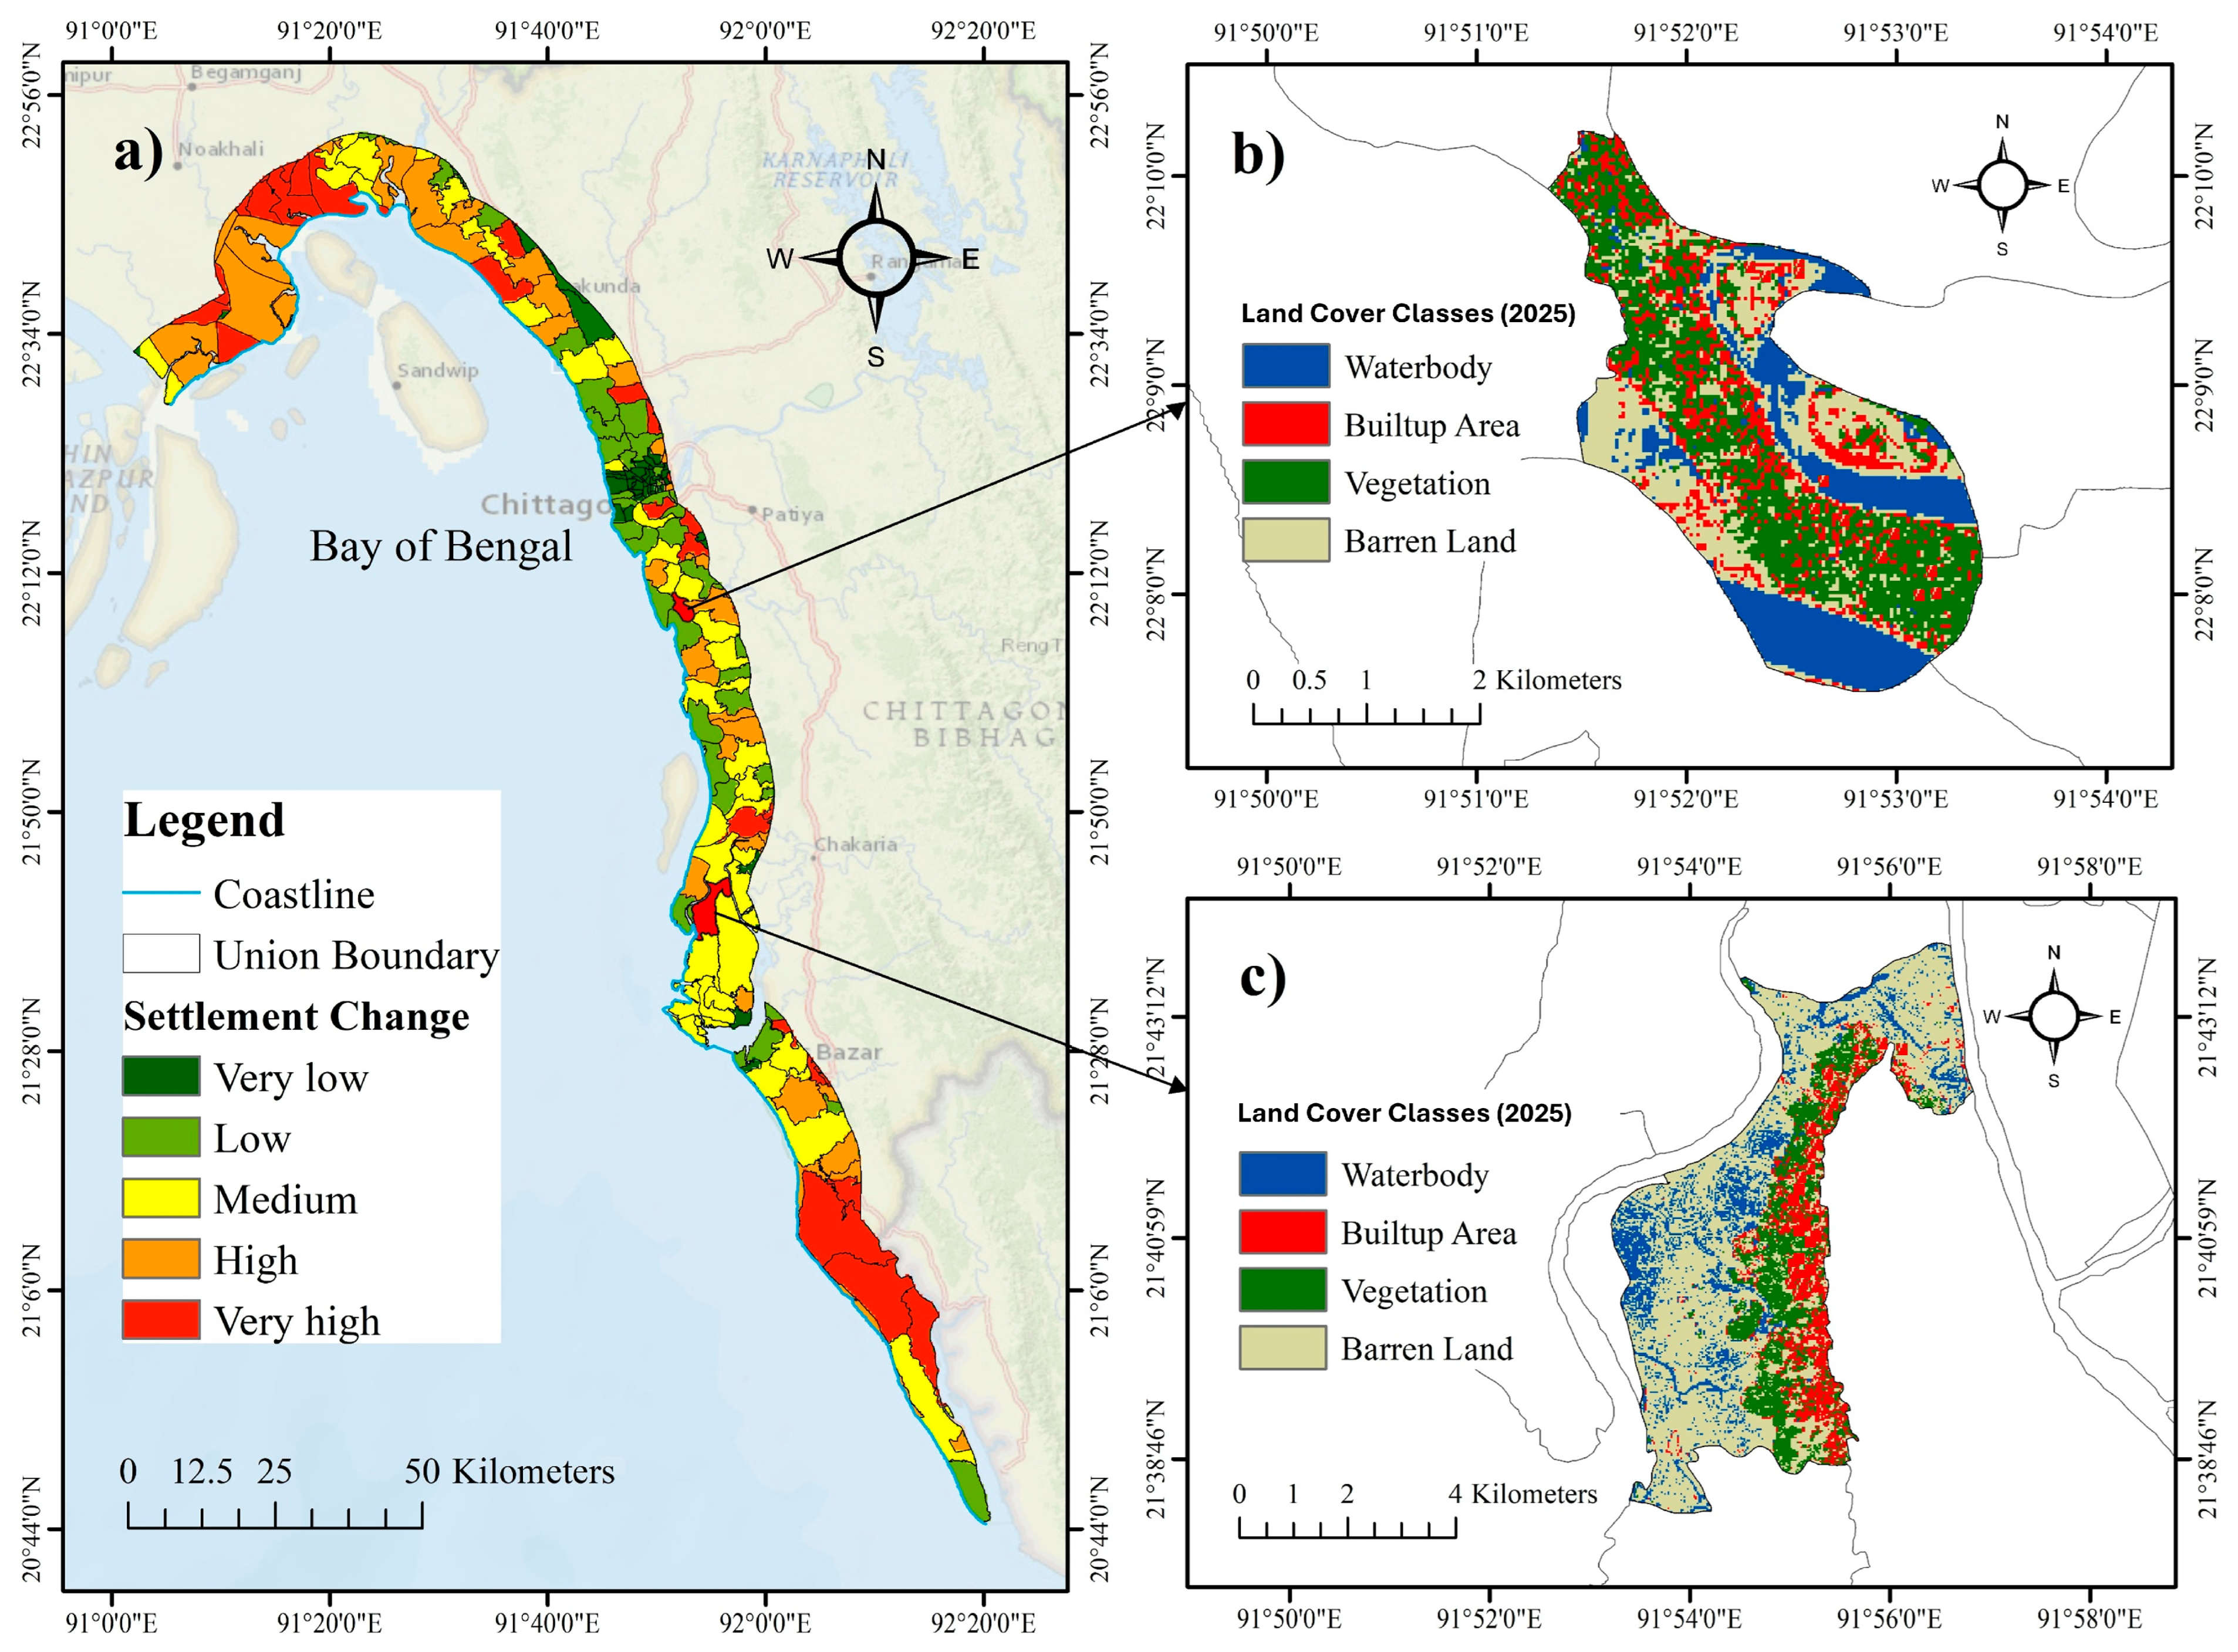
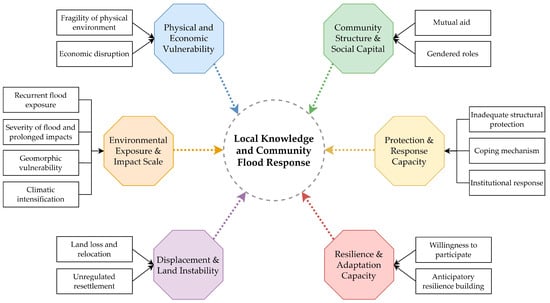
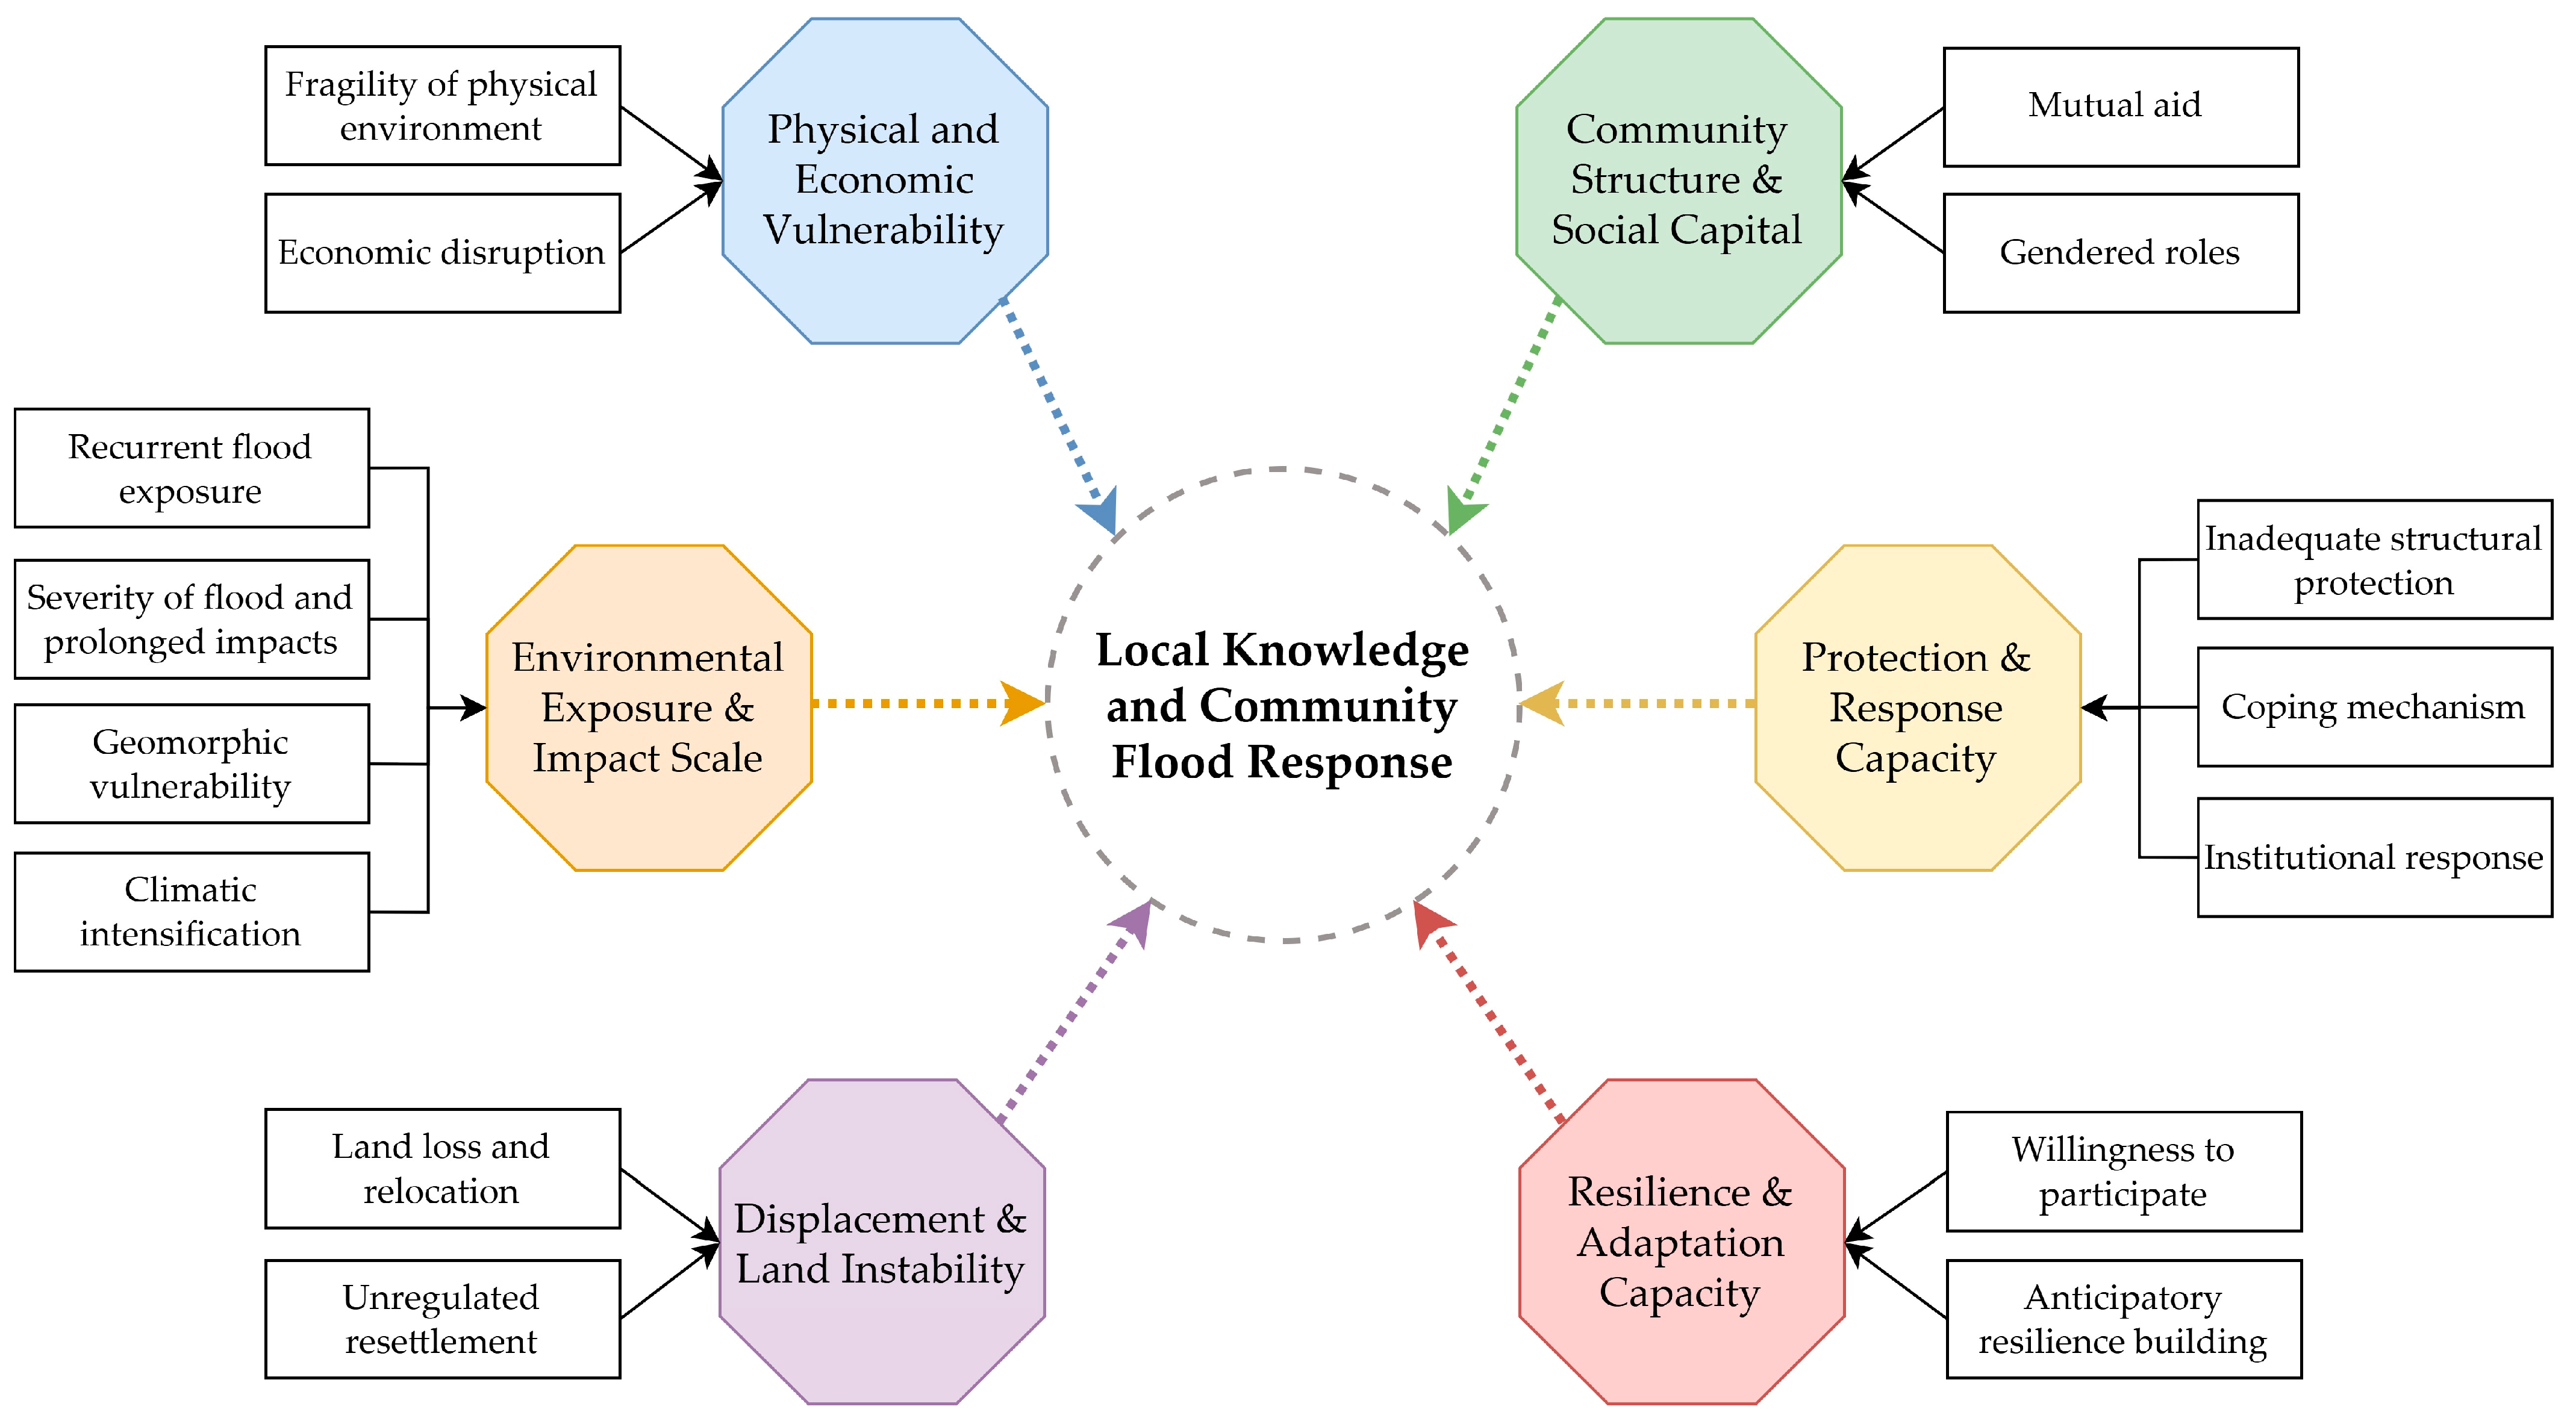
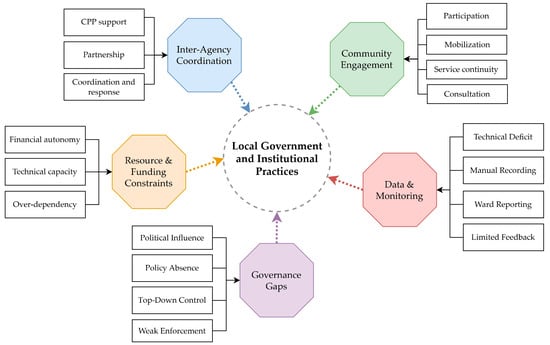
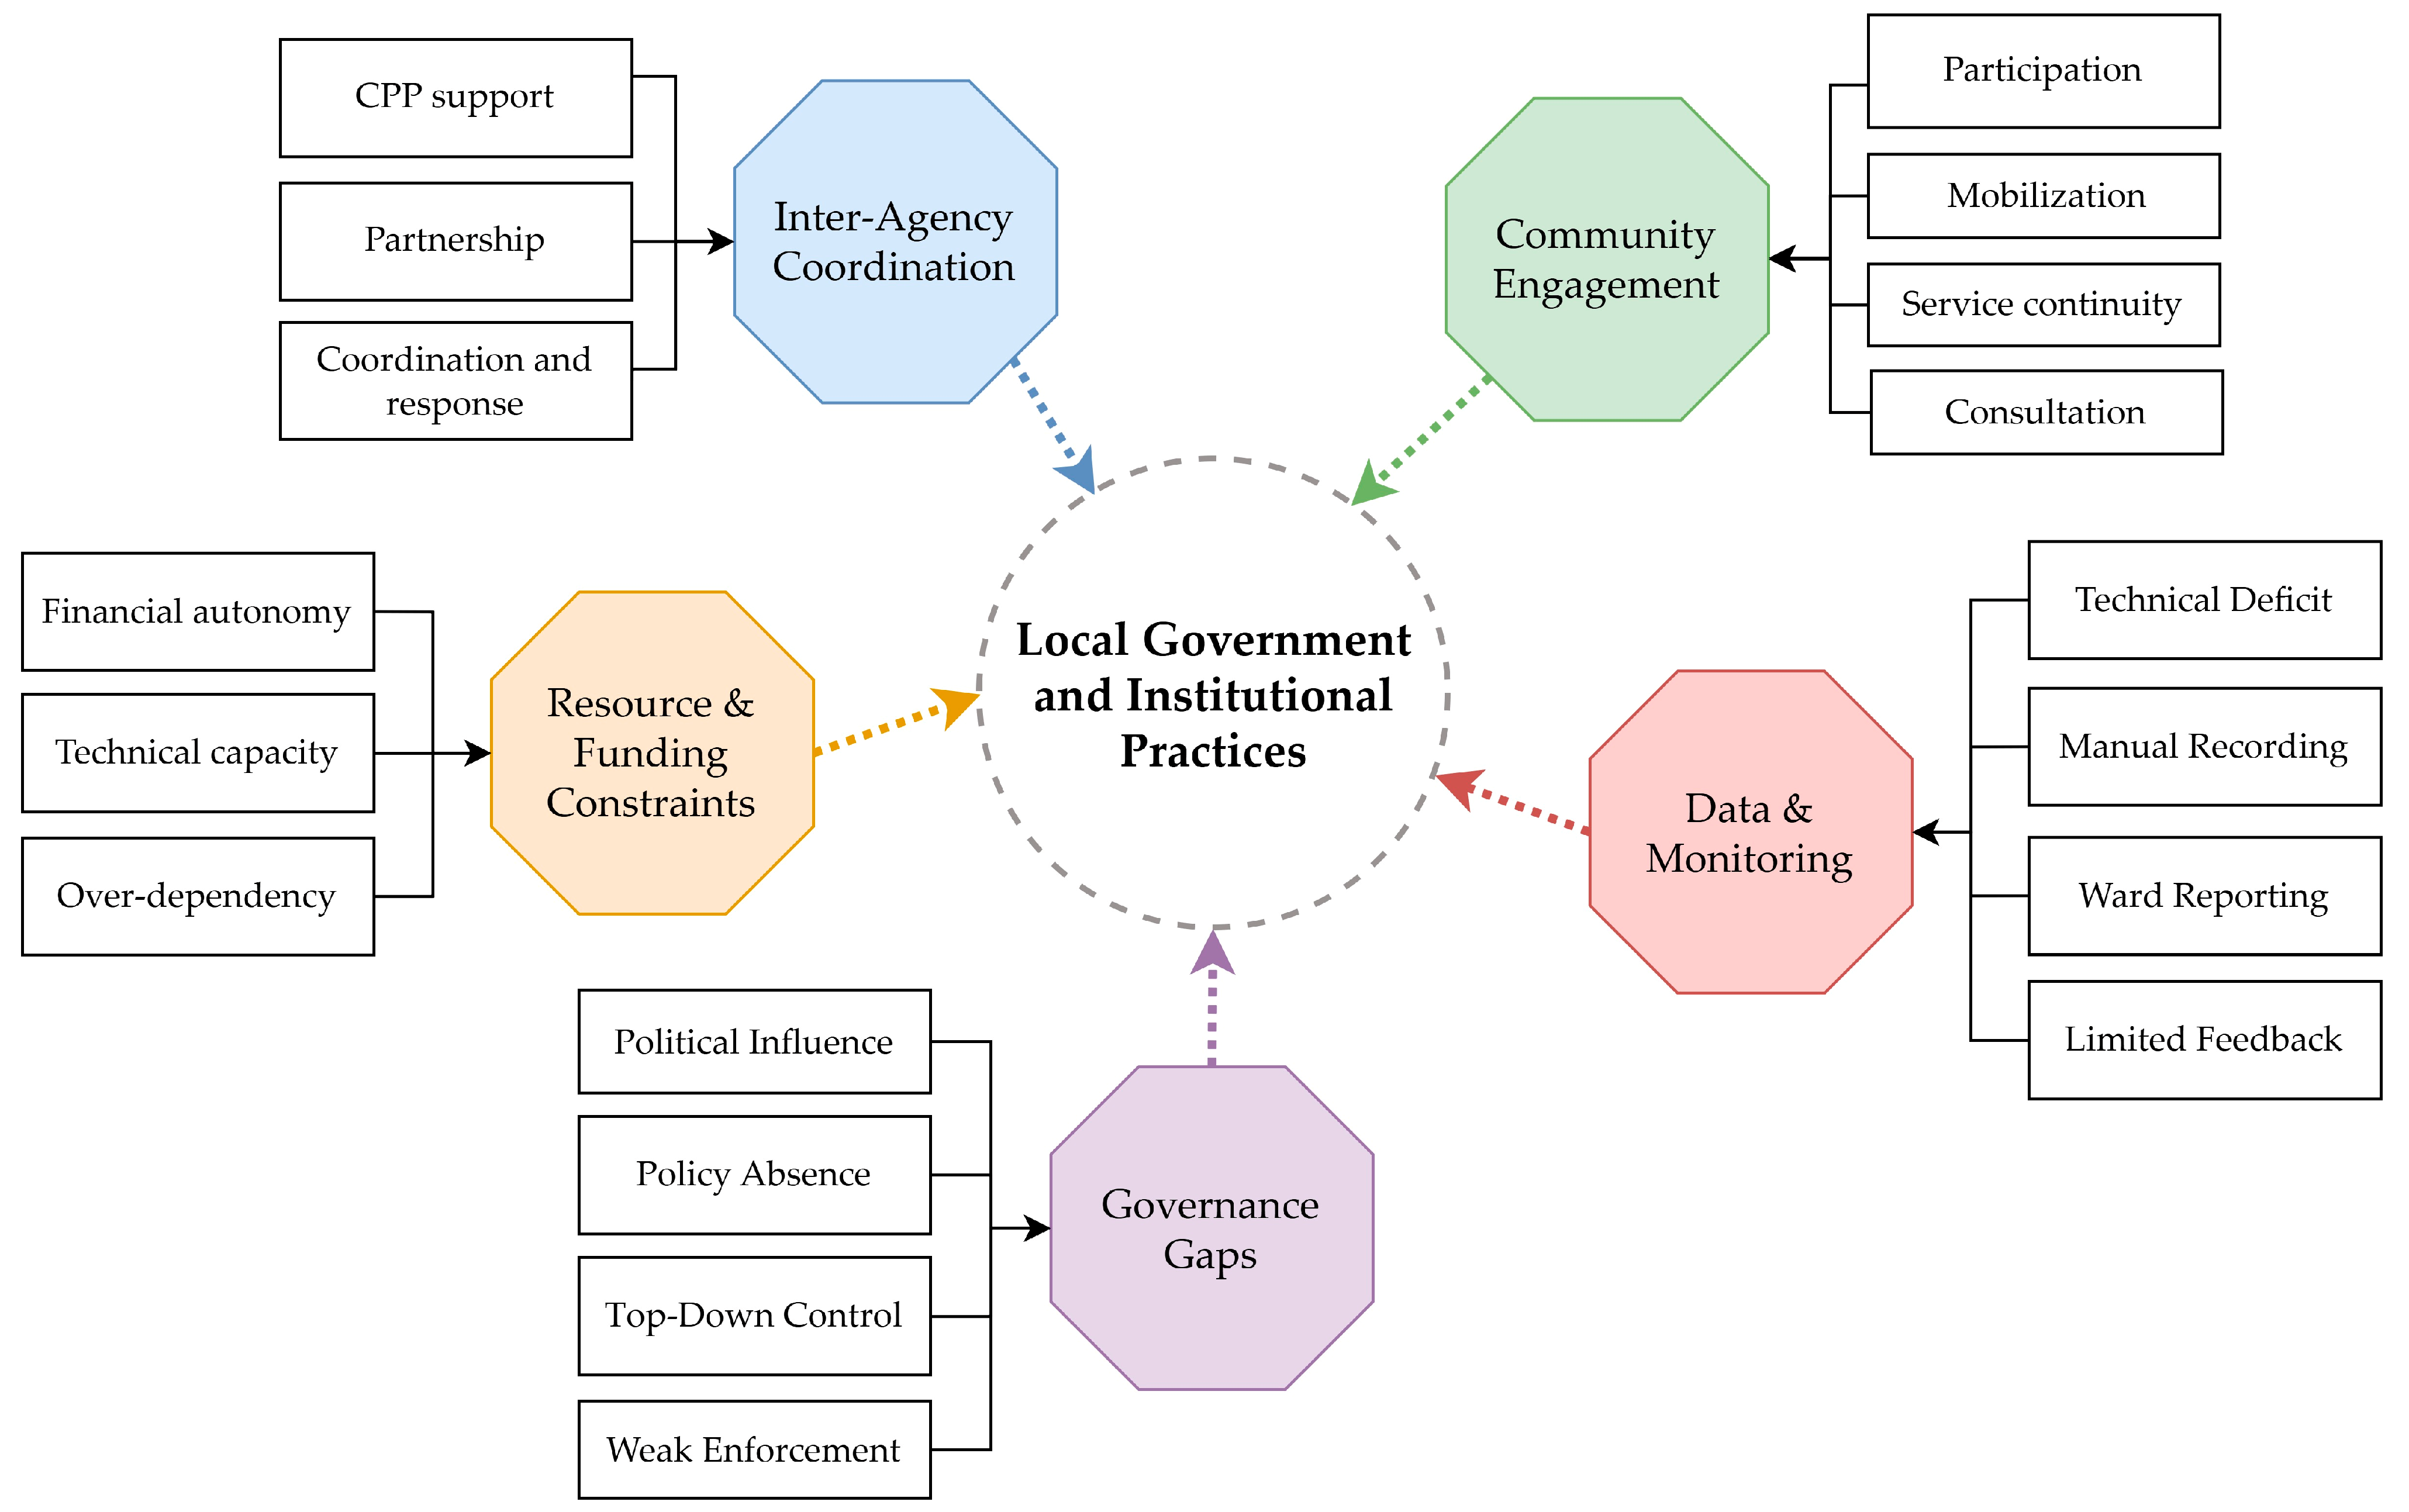

Disclaimer/Publisher’s Note: The statements, opinions and data contained in all publications are solely those of the individual author(s) and contributor(s) and not of MDPI and/or the editor(s). MDPI and/or the editor(s) disclaim responsibility for any injury to people or property resulting from any ideas, methods, instructions or products referred to in the content. |
© 2026 by the authors. Licensee MDPI, Basel, Switzerland. This article is an open access article distributed under the terms and conditions of the Creative Commons Attribution (CC BY) license.