Article

Multi-Criteria Analysis for Optimal Siting of Reservoirs in Crete

by
Konstantinos Kostopoulos
*,
Apollon Bournas
* and
Evangelos Baltas
Department of Water Resources and Environmental Engineering, School of Civil Engineering, National Technical University of Athens, 5 Iroon Polytechniou, 157 80 Athens, Greece
*
Authors to whom correspondence should be addressed.
Geographies 2025, 5(4), 71; https://doi.org/10.3390/geographies5040071
Submission received: 28 September 2025 / Revised: 21 November 2025 / Accepted: 24 November 2025 / Published: 25 November 2025

Abstract

Water scarcity, driven by climate change, spatial and temporal variations in precipitation, and seasonal water demands, is becoming an increasingly pressing issue for Mediterranean islands such as Crete. Strategically placed dams could offer a sustainable solution to these challenges. To identify optimal sites, we employed a multi-criteria decision-making (MCDM) framework, integrating Analytic Hierarchy Process (AHP) and fuzzy AHP methodologies with remote sensing data using Geographical Information Systems (GIS). This process generated two different suitability maps for dam construction across the island of Crete. The following analyses were also performed on the results: (1) validation; (2) sensitivity; and (3) 3D analysis of three highly suitable locations. The findings are promising, showing a widespread distribution of numerous highly suitable locations. Validation revealed satisfactory predictive performance, while the sensitivity analysis indicates stability of the top locations. Subsequent 3D analysis revealed favorable morphological characteristics for two locations but severe limitations for the third. This study can serve as a starting point for further investigation into dam construction as a viable mitigation strategy for Crete’s water crisis.

1. Introduction

Water is a vital resource for life [1,2,3,4,5,6,7,8] and a critical component for all human activities [3,7,9,10] and sustainable development [5,10]. However, water scarcity is a growing global challenge driven by multiple factors [1,11]. Rapid urbanization and population growth have dramatically increased water demand [1,2,12,13], while the overexploitation of groundwater for agriculture in arid and semiarid regions has resulted in severe negative environmental impacts [8]. Furthermore, climate change disrupts the global water cycle, increasing the frequency and severity of extreme weather events, such as floods and droughts, leading to adverse socioeconomic and environmental consequences in affected areas [8,9,12,14,15,16,17]. These pressures collectively elevate sustainable water resource management to one of the most pressing contemporary and future challenges [4,5,15,18].
Dams are engineered structures that span rivers and accumulate or raise water levels by controlling or impeding the flow of water [5,7,19]. They can effectively regulate the spatial and temporal distribution pattern of water resources [7,10,14], serving key purposes such as water supply, irrigation, and flood control [2,3,5,7,9,10,15,19,20,21,22]. Although dam construction entails significant environmental and socioeconomic impacts [3,7,9,10,15,18,19,23], their benefits have traditionally been deemed to outweigh these disadvantages [7], positioning dams as an important tool for addressing global water resource challenges.
Their construction requires intensive preliminary studies and analyses [3,18,19,23], with optimal site selection being a critical aspect for ensuring the long-term success of the project [3,7,8,10,12,16,18,19,21,23,24,25] and for mitigating or preventing the inherent risks of such undertakings [7,8,15,21]. Traditionally, the decision-making process for site selection has relied on conventional techniques, empirical knowledge [1,5] and is often influenced by political interests [1,5,7,15]. The traditional methods include expensive, time-consuming, and labor-intensive ground surveying, occurring over multiple years [26,27]. However, Remote Sensing (RS) and Geographic Information Systems (GISs) have recently emerged as highly suitable approaches for dam site selection [1,2,4,5,8,11,12,13,14,21,24,28,29]. GIS is a robust tool with the ability to process and analyze huge volumes of data from various sources, thus enabling time savings and containment of financial expenses by providing reliable and up-to-date information for water resource management [5,6].
According to the review conducted by Wang et al. [7], dam siting methods can be categorized into three types: GIS/RS-based, MCDM-GIS-based, and machine learning-based. GIS/RS is based on the ability to capture, combine, and analyze data, while machine learning-based dam siting uses machine learning algorithms, or deep learning and artificial intelligence, to calculate the optimal location within existing spatial constraints [7]. Multi-criteria decision-making (MCDM) incorporated within GIS is widely used to address the complexity of dam siting problems [4,5,7,8,12,14,15,18,26,27]. MCDM offers the advantage of weighing the importance of the relationship between multiple factors, therefore enabling evaluation, comparison, and subsequent selection among alternatives in complex problems [2,7,8,10].
Several MCDM techniques are available, with Analytic Hierarchy Process (AHP) being among the most frequently applied methods for determining the relative rank of multiple interrelated factors [3,5,7,8,12,14,15,22,26,27,28]. Introduced by Saaty [29], AHP is an easy-to-use method [30,31] that employs a hierarchical structure to identify the optimal decisions in complex decision-making problems [6,26,30]. However, AHP relies on certain judgements and struggles to handle ambiguity and intangibility [2,14,30]. Fuzzy logic has been proposed to address these shortcomings, owing to its strong compatibility with the subjective evaluation of decision-makers [10,14,19], and has been utilized in the literature to refine the selection process [2,10,14,19,30].
A critical element for the effective implementation of MCDM and geospatial techniques for mapping potential dam sites is the determination of suitable criteria [1,2,7,8,12,15,19]. Researchers have employed a wide variety of criteria that are highly dependent on the purpose of the dam, including elevation, soil, precipitation, water quality, distance from roads, fault tectonics, etc. [7,8,12,16,19]. For instance, the siting of dams for hydropower or flood control primarily relies on topographical and geological criteria, including slope, elevation, and geology. In contrast, siting for water supply dams typically incorporates additional factors, such as water quality and environmental parameters like soil type and soil erosion [7].
Crete has been experiencing water scarcity, the negative impacts of which have elevated this matter to a high priority [32,33,34]. To address this challenge, our study applies an integrated MCDM-GIS framework to generate comprehensive dam site suitability maps for the island. Two MCDM methods were employed, namely AHP and Fuzzy AHP, each applied to eight key criteria. The methods, equations, and criteria were selected based on their prevalence in the reviewed literature and their demonstrated effectiveness in dam site suitability mapping. While the core methodology is well-established, the application to the specific and urgent context of Crete provides significant value. This study aims to establish a crucial baseline to inform and prioritize future site-specific investigations and water resource planning decisions for the island.

2. Study Area

The island of Crete is situated in the southern part of Greece (Figure 1), with an area of 8265 km2, constituting 6.3% of Greece’s total area [32,33]. The island is administratively divided into four prefectures: Lassithi (1810 km2), Heraklion (2626 km2), Rethymno (1487 km2), and Chania (2342 km2) [32]. Crete has an elongated shape, extending approximately 260 km from west to east with a maximum width of 60 km and a coastline of 1046 km [33]. Crete has three main mountain ranges running from west to east: the Lefka Oroi mountains in the west (2453 m), Psiloritis mountain (2456 m) in the center, and Dikti (2148 m) in the east [32,33]. The mountainous and the intermediate zones occupy approximately 77.3% of Crete’s area and extend from the western to the eastern part of the island with some interruptions by valleys and gorges [33].
According to the Hellenic Statistical Service, Crete had a permanent population of 624,408 in 2021, representing 5.96% of the total population of Greece [35]. The island produced 4.85% of Greece’s total Gross National Product (GNP), amounting to 8956 million euros, with a GNP per capita of 14,115 euros, lower than the country’s average of 17,347 euros [36]. The largest contributor to Crete’s economy is tourism, with agriculture being another important contributing sector [33,36].
The mean annual precipitation has been estimated at 967 mm/year, while the total water demand is estimated at approximately 610.94 hm3/year, constituting only 7% of the total precipitation [33]. Nevertheless, temporal and spatial variations in precipitation, terrain characteristics, vegetation distribution, urban water needs, the distribution of water infrastructure (e.g., reservoirs and dams), local economic activity, seasonal water demands, and water transportation constraints lead to water imbalances across the island [33].
A significant discrepancy between water supply and demand arises from the concentration of rainfall during autumn and winter, while demand peaks in the summer [32]. Furthermore, agriculture, by far the island’s largest water consumer, relies almost exclusively on groundwater. This exerts substantial pressure on water resources, with over-pumping leading to significant aquifer depletion [33]. This issue is more prevalent in the southern and eastern regions of Crete, which experience lower precipitation and higher temperatures [33]. As of 2025, water scarcity has become an even more pressing issue due to a pronounced lack of precipitation over the past two years [34].
Sustainable water resource management is highly important but remains challenging due to the complexity of the existing legislative framework, economic instability, and the need for adaptation to climate variability [33]. Tzanakakis et al. [33] suggest that water reuse, brackish water exploitation, desalination, improved agricultural water use efficiency, and rainwater harvesting should be considered in water management plans. While it is uncertain whether rainwater-harvesting infrastructure, such as strategically placed dams for water supply and irrigation, can fully address the problems Crete faces, it can be an important contributing factor within a multi-dimensional water resource management approach.
Dams enable the spatial and temporal redistribution of runoff, a feature that is useful under the island’s specific conditions. As previously mentioned, the total water demand represents only 7% of total precipitation. However, less than 27.50% of the precipitation is stored in the soil or percolates to deeper horizons, with precipitation and evapotranspiration accounting for the rest, while surface runoff makes up 14.5%, making the exploitation of even a small part of it a beneficial approach [33]. Furthermore, 87% of precipitation occurs during autumn and winter, a period also characterized by high-intensity rainfall events, making effective water storage a compelling strategy.

3. Materials and Methods

3.1. Study Framework

Figure 2 shows the study’s framework, divided into six steps. The first step is to define and select the methodology and criteria for dam site selection. To that end, a literature review was conducted that covered: (i) dam site selection, (ii) AHP and fuzzy AHP methodologies.
The second step involved acquiring and processing the necessary data to generate thematic layers for the eight selected criteria. The third step involves the implementation of the MCDM methodologies using the following order: (1) creation of a pairwise comparison matrix based on the criteria rankings for the AHP, (2) transformation of this matrix using a fuzzy scale to produce the fuzzy pairwise comparison matrix required for the Fuzzy AHP, and (3) the reclassification process where the criteria are standardized. In the fourth step, suitability maps are produced for each method used, based on the thematic layers and their corresponding weights. In step five, the outputs of the two methods were compared with each other and with existing dam sites for validation. Additionally, the most suitable sites were identified, and a sensitivity analysis was performed to assess the model’s robustness. Finally, in the sixth and final step, the top selected choices were further assessed through a 3D analysis. All GIS processing and analysis were performed using the ArcGIS Pro v.3.5.2 software.

3.2. Data Site Criteria

The site selection process for dam construction necessitates the evaluation of numerous criteria and sub-criteria, where the appropriate selection of these parameters is vital for ensuring the infrastructure’s long-term reliability and success [8,12,19].
Through a review of the criteria used in the literature, Wang et al. [7] classified them into six broad categories: topographic, geotechnical, hydrological, environmental, socio-economic, and water quality. A more recent review by Dirie et al. [19] adopted a more streamlined, five-category framework that omits the water quality dimension. These works, along with those of Alrawi et al. [13] and Othman et al. [31], provide a detailed analysis of criteria usage throughout the literature. Their findings are synthesized in Table 1, which summarizes the most frequently used criteria in each category.
Elevation and slope are key indicators of topographic features [19]. An area’s elevation determines water accumulation and flow dynamics, making it an important factor in dam site selection, [1,37], while importance of land slope stems from its influence on both the hydrological behavior of a dam and its safety-related concerns. It affects the free movement of water as well as the pattern of sedimentation, which are key factors in determining the operational efficiency and lifespan of a dam [19].
Geological conditions also constitute important factors, as they determine foundation stability and permeability [19]. The site should have impermeable geology and an unyielding foundation to prevent leakage. Additionally, potential dam sites in proximity to fault zones should be avoided due to (i) faults being a major contributing factor to landslides [19], (ii) displacements along active faults potentially causing differential settlement of dam structures [37], and (iii) fault areas being associated with high infiltration [13].
Environmental factors include, among others, soil erosion, land use, proximity to water bodies, and groundwater sources. Out of these, the most commonly used in the literature is land use (LULC) [19]. LULC is a significant determinant of acceptable RWH sites, as the different types play a major role in the amount of rainwater infiltration and surface runoff [13]. Soil erosion is mostly triggered by high population activity, increased construction, and deforestation. Accelerated erosion in a catchment area results in sedimentation in the storage, which lowers the suitability of soil erosion areas for dam sites designed for the water cycle [19].
Although socioeconomic factors do not directly affect the determination of water harvesting sites, neglecting them contradicts the primary objective of such projects [13]. The distance to infrastructure, such as roads and urban areas, is a key metric for estimating construction costs [19]. Additionally, site selection requires balancing proximity to urban areas, ensuring access to labor, and providing a safety buffer. This approach also mitigates the risks associated with major accidents, such as dam failures, by maintaining a safe distance from cities.
Hydrological parameters define the water yield of a catchment area [13,19]. Runoff and precipitation are key criteria for dam siting, as they are central to water resource and flood risk management [19]. Stream order serves as an indirect index of runoff volume, where higher-order streams generally containing more runoff [19].
Considering the findings as shown in Table 1, in this research work, for topographic, geotechnical, environmental and socio-economic categories, we selected the criteria highlighted with bold, i.e., elevation, slope, stream order, land use/land cover (LULC), hydrologic soil groups (HSG), distance to faults, distance to road network, and distance to urban areas. For the hydrological category, there is not a dominant criterion used in past studies, but rather all the criteria shown in Table 1 have been used with similar frequency, i.e., each criterion has been used in approximately 30% of the studies reviewed by Wang et al. [7]. Among these criteria, the stream order was used in this study, as it does not require hard-to-find hydrological data beyond elevation data, along with a catchment area threshold of 4 km2 to exclude channels with an insufficient contributing area.
While previous studies have similarly used stream order [3,7,13,19,28], this study further evaluated its reliability by comparing the primary results with an alternative suitability map. In this alternative, the stream order criterion was replaced with a calculated upslope accumulated rainfall, used as a proxy for dam inflow. Specifically, the annual precipitation was applied as a weighting factor in the flow accumulation algorithm, derived from the DEM using GIS tools. Each cell thus represents the sum of its own and all upstream precipitation, indicating total upstream water contribution. Although the result does not represent actual inflow, as it does not account for losses such as infiltration, evaporation, or storage, it can serve as a proxy for potential inflow. Consequently, cells with higher accumulated rainfall volumes were considered more suitable for dam siting.
It is important to note that rainfall was not used as a separate criterion because, in the case of Crete, its spatial variability is not considered a defining factor. High precipitation occurs in the western part of the island, at Mt. Lefka Ori, where water demand is low due to limited agricultural activity, while in the central and eastern regions, mean rainfall is relatively uniform. Therefore, when using rainfall as a criterion, the top choices are located on the western side, which is not deemed optimal. Dam sites are preferably located close to areas of actual water demand to reduce construction costs. Additionally, it is particularly important to favor multiple small dams, as obtaining permits for large-scale construction is often challenging due to policy constraints.

Data Used

In Figure 3 the thematic layers of the eight selected criteria, i.e., elevation, slope, stream order, land use/land cover (LULC), hydrologic soil groups (HSG), distance to faults, distance to road network, and distance to urban areas are presented.
All necessary geospatial data, which include the Digital Elevation Model (DEM), LULC layer, and vector datasets for faults, settlements, and road networks, were acquired from readily accessible online sources.
Specifically, the elevation data were obtained from the Copernicus Digital Elevation Model (GLO-30) ([38]), provided by the Copernicus Programme of the European Union. The dataset has a spatial resolution of ~30 m (1 arcsecond) and exhibits absolute vertical accuracy ≤ 4 m RMSE and relative vertical accuracy ≤ 2 m RMSE. Horizontal accuracy is ≤6 m (absolute) and ≤3 m (relative).
The Land cover information was obtained from the CORINE Land Cover (CLC) 2018 dataset [39]. CLC 2018 provides pan-European land cover classification at 100 m resolution, with a minimum mapping unit of 25 ha, and is distributed via the Copernicus Land Monitoring Service. The Soil hydrologic characteristics were derived from the Global Hydrologic Soil Groups (HYSOGs250m) dataset [40]. This global dataset assigns each 250 m grid cell to one of the NRCS hydrologic soil groups (A–D) based on soil texture, depth to bedrock, and saturated hydraulic conductivity, thereby supporting curve-number–based runoff modeling.
The road data were acquired from the OpenStreetMap initiative [41], obtained via the Geofabrik website. The thematic layers up to the second order of rural roads (grade 2 track roads), i.e., roads with asphalt or coarse-gravel pavement. Finally, the fault datasets were obtained from the Hellenic Database of active faults (HeDBAF) [42], whereas the annual mean rainfall of the island was calculated from monthly data, available by the National Observatory of Athens (NOA) weather station network [43].

3.3. MCDM

3.3.1. AHP

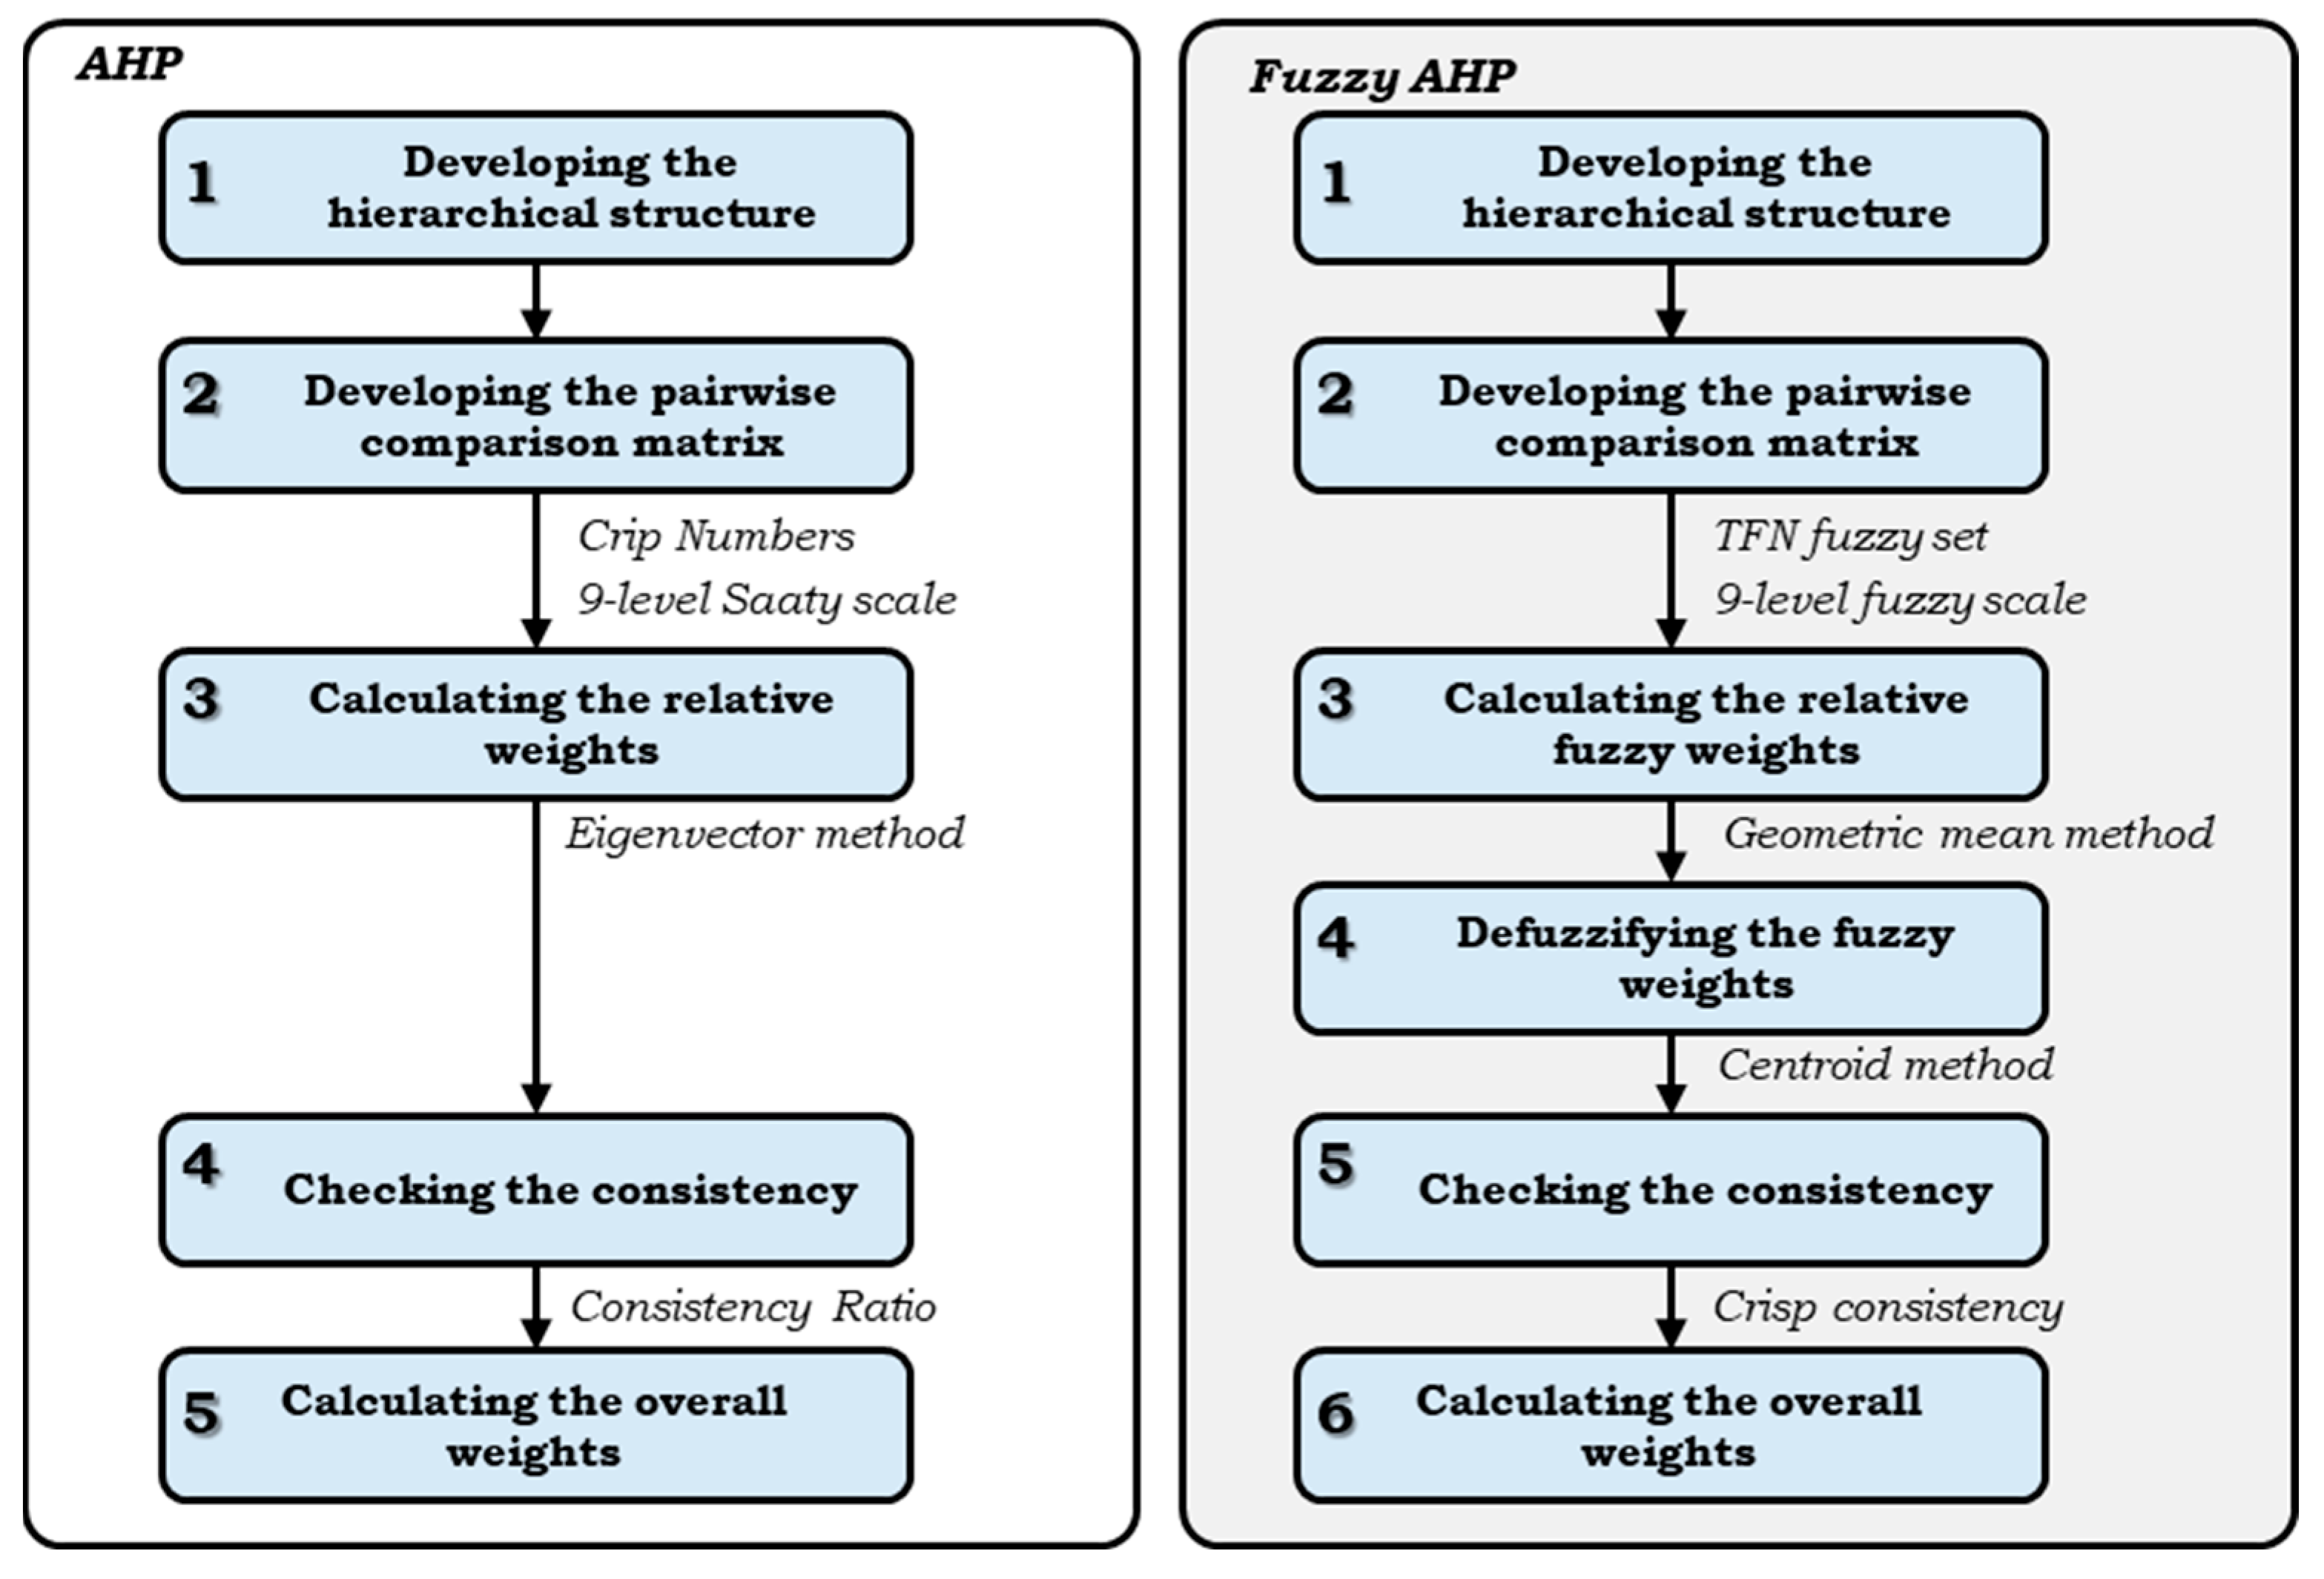
The Analytic Hierarchy Process (AHP) is an MCDM method introduced by Saaty [29]. The AHP methodology consists of five key steps [26] (Figure 4): (1) decomposing the problem into a hierarchical structure, (2) establishing the pairwise comparison matrix, (3) calculating the weights of the criteria, (4) checking the consistency of the comparisons, and (5) obtaining the overall weights.
The mathematical procedures of AHP are well-established in the literature [1,2,3,4,5,6,13,18,20,26,28,29,30,37,44,45] and, as such, are not detailed in this section. Criteria rankings and comparison matrix judgements were based on multiple research works [3,13,20,37], as well as the opinions of the authors. The derived criteria weights and the consistency ratio (CR) of the matrix used in this study are presented in Table 2. A CR value of less than 0.1 is acceptable, indicating consistent judgments [29].

3.3.2. FAHP

While traditional AHP relies on precise (crisp) numerical judgments, this requirement often conflicts with the reality of expert decision-making, which is frequently characterized by imprecision, incomplete information, and uncertainty [2,30]. To address this limitation, fuzzy set theory has been successfully integrated with the AHP methodology, resulting in the Fuzzy AHP approach.
The Fuzzy AHP development largely mirrors the standard AHP [30]. As detailed by Liu et al. [30], the Fuzzy AHP procedure involves six steps, five of which are shared with standard AHP (Figure 4): (1) decomposing the problem into a hierarchical structure, (2) establishing the pairwise comparison matrix, (3) calculating the weights of the criteria, (4) defuzzifying the weights, (5) checking the consistency, and (6) obtaining the overall weights. The fourth step, defuzzification, is unique to the fuzzy extension and is necessary to convert the fuzzy weights into usable crisp values. This introduction of fuzzy numbers makes the calculation process less straightforward due to their associated computational complexity [30].
In this research, Triangular Fuzzy Numbers (TFNs), a type-1 fuzzy set, were employed, a type-1 fuzzy set, along with the commonly used 9-level scale of Figure 5. This fuzzy set was selected due to its widespread application, computational simplicity, and proven efficacy [30]. For the specific scope and objectives of this research, the simple TFN approach was deemed fully adequate, providing a parsimonious yet effective method for handling decision uncertainty.
The fuzzy weights of the criteria were calculated using the geometric mean method, owing to its simple implementation and valid results [30]. To obtain the crisp weights (Table 2), For defuzzification, the two most prevalent methods for type-1 fuzzy sets are the centroid method and the extent analysis method. From these, the centroid method was chosen to derive the final crisp weights (Table 2), as the extent analysis method has been critically questioned for its appropriateness in deriving weights/priorities [30]. Equation (1) [3,30,46,47] was employed in this study, as it takes into consideration both the worst and best results arising from a fuzzy number [30].
x * = l + 2 m + h 4 ,
where x* is the crisp value and l, m, h are the TFN’s smallest (l), largest (h), and most representative middle values (m).
For the consistency check, the crisp consistency method was applied. This approach first defuzzifies the fuzzy matrix and then computes Saaty’s consistency ratio (CR) [30]. The mean method was also used here to compute the crisp matrix.

3.3.3. Reclassification

The development of the dam site suitability map requires the standardization of all criteria by classifying them into a common numerical scale [37]. This process involved ranking the sub-criteria of each thematic layer according to their relative suitability. The specific classification schemes applied to each criterion are detailed in Table 3. A 9-level preference scale was utilized, where a score of 9 represents the highest suitability for dam construction.
Lower slopes were ranked as more suitable compared to steeper slopes. For rainwater harvesting, the Food and Agriculture Organization (FAO) recommends slopes no greater than 5% [19]. Gentle slopes in dam site construction greatly reduce cost [13,20,38], as well as affect the safety of the project [38]. Steep slopes combine landslide hazards with elevated structural loads, while also affecting soil settlement, and water accumulation [38]. Locations where the watershed has a steeper slope since regions with slopes higher than 5% often tend to be more susceptible to erosion [13].
Rank of a river network is an indirect index to the runoff volume and in general, higher-ranked rivers usually contain more runoff [19]. A higher stream order indicates a greater flow of tributaries downstream, increasing the potential for water harvesting [13]. Higher infiltration and lower runoff occur in the small number of stream orders, and vice versa [13].
The soil ranking was based on the four hydrologic soil groups. To ensure minimum loss of water through seepage and prevent erosion soils must be sufficiently impermeable [13]. Soil of the A group was marked unsuitable, while B, C, and D were assigned low, moderate, and high suitability, respectively.
Lower elevations are preferable to higher elevations. Al-Ruzoq et al. [1] claim that a low elevation is suitable for dam site construction because the likelihood of accumulating precipitated water and groundwater is higher at lower elevations.
Due to the risks fault areas pose to dams [13,19,38], all areas within a 1 km fault buffer radius were marked as restricted. Beyond this threshold, suitability scores increased as proximity decreased.
The proposed site’s proximity to existing road infrastructure enhances accessibility while reducing transportation costs during both construction and operational phases [13,19,38]. Therefore, short distances were preferred over longer. Areas in a 1 km buffer radius of urban areas were marked as restricted, while the next class was classified as moderately suitable to account for safety concerns in case of dam failure [13,19,38]. The remaining classes were ranked based on proximity, with lower distances being preferable. Nearby settlements facilitate labor sourcing [19,39], while accessible dam siting enables economic benefits for proximal urban areas [38]
The land cover suitability ranking was designed to prioritize areas with high runoff yield and favorable implementation conditions, specifically:
  • The most suitable areas were open spaces with little or no vegetation, followed by shrub and herbaceous vegetation (moderately suitable), and finally forests (low suitability). This classification, which is well-established in the literature [3,4,13,20], is predicated on the principle that barren or sparsely vegetated land generates higher surface runoff due to lower infiltration, making it ideal for RWH [13].
  • Agricultural areas were assigned moderately high suitability. While infiltration rates in these zones can be higher, the ranking emphasizes the significant economic advantage of reduced water transfer costs to farmland, thereby favoring sites near agricultural demand [5,38].
  • In contrast, artificial surfaces were given the lowest suitability rating, as dam sites should generally avoid zones of intensive human activity [4,38]; consequently, specific features like airports and dump sites were categorically restricted.

3.4. Validation

A preliminary validation of the outputs was conducted using the locations of existing dams in Crete. Thirteen existing dam sites in Crete were identified by integrating LULC data, information from Tzanakakis et al. [33], and visual interpretation of satellite imagery. The model-derived suitability classification (low, moderate, high) for each existing dam location was extracted from both the AHP and Fuzzy AHP suitability maps. The core validation premise is that these empirically chosen sites represent appropriate locations for dam infrastructure and should, consequently, be identified by the models as possessing at least a “moderate” suitability score.
Additionally, the Area Under the Curve (AUC) of the Receiver Operating Characteristics was used to further evaluate the predictive performance of the suitability maps. A buffer of 1 km around the identified existing dam sites was used as known suitable areas for dam siting and compared with the results. The value of the AUC ranges from 0.5 to 1 and AUC close to 1 indicates better prediction performance [13,28].

3.5. Sensitivity Analysis

After model validation, a parameterized region-growing algorithm was employed to identify the most suitable dam sites, reducing the sensitivity of the results to individual pixel values. The robustness of these identified locations was subsequently evaluated through a sensitivity analysis. The findings from this evaluation directly informed the selection of specific sites for the detailed, site-specific 3D assessment. The sensitivity analysis followed the framework used by Minatour [23] and Zyoud et al. [48]. While alternative approaches exist [6,37], in this study we systematically: (1) ranked all eight criteria by weight, (2) evaluated six scenarios (Sens1-6) wherein each scenario the weight of a single criterion was systematically demoted by two positions in the overall ranking, and (3) identified top-eight regions per scenario. The regions identified from these sensitivity scenarios were compared against the top eight regions derived from the Fuzzy AHP suitability map to evaluate the model’s stability and the influence of individual criterion weights on the model’s top alternatives.

3.6. 3D Analysis

A 3D analysis was employed to further evaluate the suitability of the candidate locations by assessing the geometrical characteristics of the potential dam sites. Although the implemented methodology is a well-established and effective tool for the preliminary screening of dam sites, a necessary step given the scale of such projects, it possesses inherent limitations. A significant shortcoming is its inability to accurately represent the specific three-dimensional terrain geometry, which is a critical factor in dam construction. Consequently, this 3D analysis was conducted to evaluate the geometrical feasibility of the top-ranked locations identified by the MCDM process.
For each site, surface-area-to-volume curves were derived using 3D analysis tools. The calculations were performed at 1-m water depth intervals, up to a maximum height defined by a projected dam crest length of 1 km. These intervals and thresholds were selected to generate comprehensive reservoir statistics for every realistic dam size at each location.

4. Results and Discussion

4.1. Suitability Maps

The suitability maps generated using the AHP- and Fuzzy AHP-derived weights are shown in Figure 6, categorized into three classes for enhanced visual interpretation: <5 (low suitability), 5–6.5 (moderate suitability), and >6.5 (high suitability). Both suitability maps show that moderate-suitability locations (scores 5–6.5) comprise over half of potential stream-network sites, with the remainder approximately evenly divided between low- (<5) and high-suitability (>6.5) areas.
As evident in Figure 6 low-suitability zones cluster in three distinct regions: (i) a western area corresponding to the Lefka Oroi mountains; (ii) a central area corresponding to Psiloritis mountain and; (iii) an eastern area corresponding to Dikti mountain. As Crete’s highest mountains, these regions exhibit steep slopes, high altitudes, and minimal road access or settlements. These characteristics received low sub-criteria scores, and since slope and elevation were assigned high weights in the model, they logically resulted in low overall suitability scores.
Excluding the aforementioned areas, the rest of the island exhibits moderate and high suitability scores at approximately 2:1, with no distinct spatial clustering (Figure 6). Most stream-network locations outside the major ranges demonstrate a balance between favorable and limiting factors. This suggests that, outside of extreme topographic zones, dam suitability in Crete depends on combinations of local factors rather than regional characteristics.
For instance, the variance in suitability scores across eastern Crete appears to be influenced by differences in all criteria except for the distance to faults, as the entire region maintains an adequate distance from seismic zones. Overall, the candidate locations exhibit minor variations across six criteria: slope, elevation, stream order, land use, and distance to roads and urban areas. The only significant difference in site characteristics stems from the HSG classification, as the island’s almost bimodal nature results in a significant drop-off from the highly scored D soil to the very poorly scored A soil. This pattern suggests that the differences between sites do not stem from specific critical flaws that negate their advantages, but rather from a combination of factors. Consequently, a site-specific evaluation approach is essential, as it can identify numerous suitable locations depending on specific project requirements.
This spatial distribution carries profound and optimistic implications for water resource management on Crete. Rather than being concentrated in a single administrative region, suitable dam locations are geographically dispersed across all four prefectures, enabling the development of localized solutions to water scarcity. This decentralization can reduce the economic and environmental costs of water transport and help preempt political conflicts over resource allocation, thereby promoting a more resilient and equitable water security framework for the entire island.
A comparison between the suitability map generated using the Fuzzy AHP method and an alternative map employing the upslope accumulated rainfall data instead of stream order revealed minimal deviation, thereby validating the use of this indirect hydrological proxy. Specifically, the mean difference in suitability scores between the two maps was 0.0025, with a standard deviation of 0.24. The correlation coefficient was 0.9745, indicating a very strong positive relationship. Furthermore, the top eight locations from the original analysis were among the top eleven locations in the alternative rainfall-based map, with most exhibiting a rank difference of only ±1. Furthermore, the top four sites were the same in both maps.
Crete is a small island characterized by relatively high mean precipitation, with spatial variation primarily driven by its mountainous terrain and significant elevation changes. Consequently, at the watershed level, areas with the highest total rainfall volume tend to converge toward higher-order stream networks. Given the comparison’s results and stream order’s significantly lower data requirements, its selection over rainfall data might serve as a reliable proxy for evaluating hydrological potential in areas where precipitation measurements are sparse or unreliable. Additionally, this approach bolsters confidence in the derived suitability map, providing decision-makers with assurance that the identified priority sites are not artifacts of a single methodological choice but are robust outcomes of the underlying spatial criteria.
The mean percentage difference per pixel between the two suitability maps was marginally negative at −0.26%, with an absolute maximum difference of just 2.44%. This confirms the visual similarity observed in the maps (Figure 6), indicating that both AHP and Fuzzy AHP methods yielded nearly identical results. The slight negative mean suggests Fuzzy AHP produced minimally higher scores overall. The relatively minor discrepancies between the AHP and Fuzzy AHP outputs can be attributed to the specific methodological choices within the Fuzzy AHP framework. Specifically, the chosen pairwise matrix formulation paired with the geometric mean for weight aggregation predictably resulted in comparable outputs, as noted by Liu et al. [30] and Zyoud et al. [48] highlight that different fuzzy AHP methodologies, such as extent analysis, employ different computational principles and can consequently generate substantially different outcomes. In Figure 7, along with the existing dams, the eight best possible locations are illustrated, along with their corresponding subbasin.

4.2. Validation Results

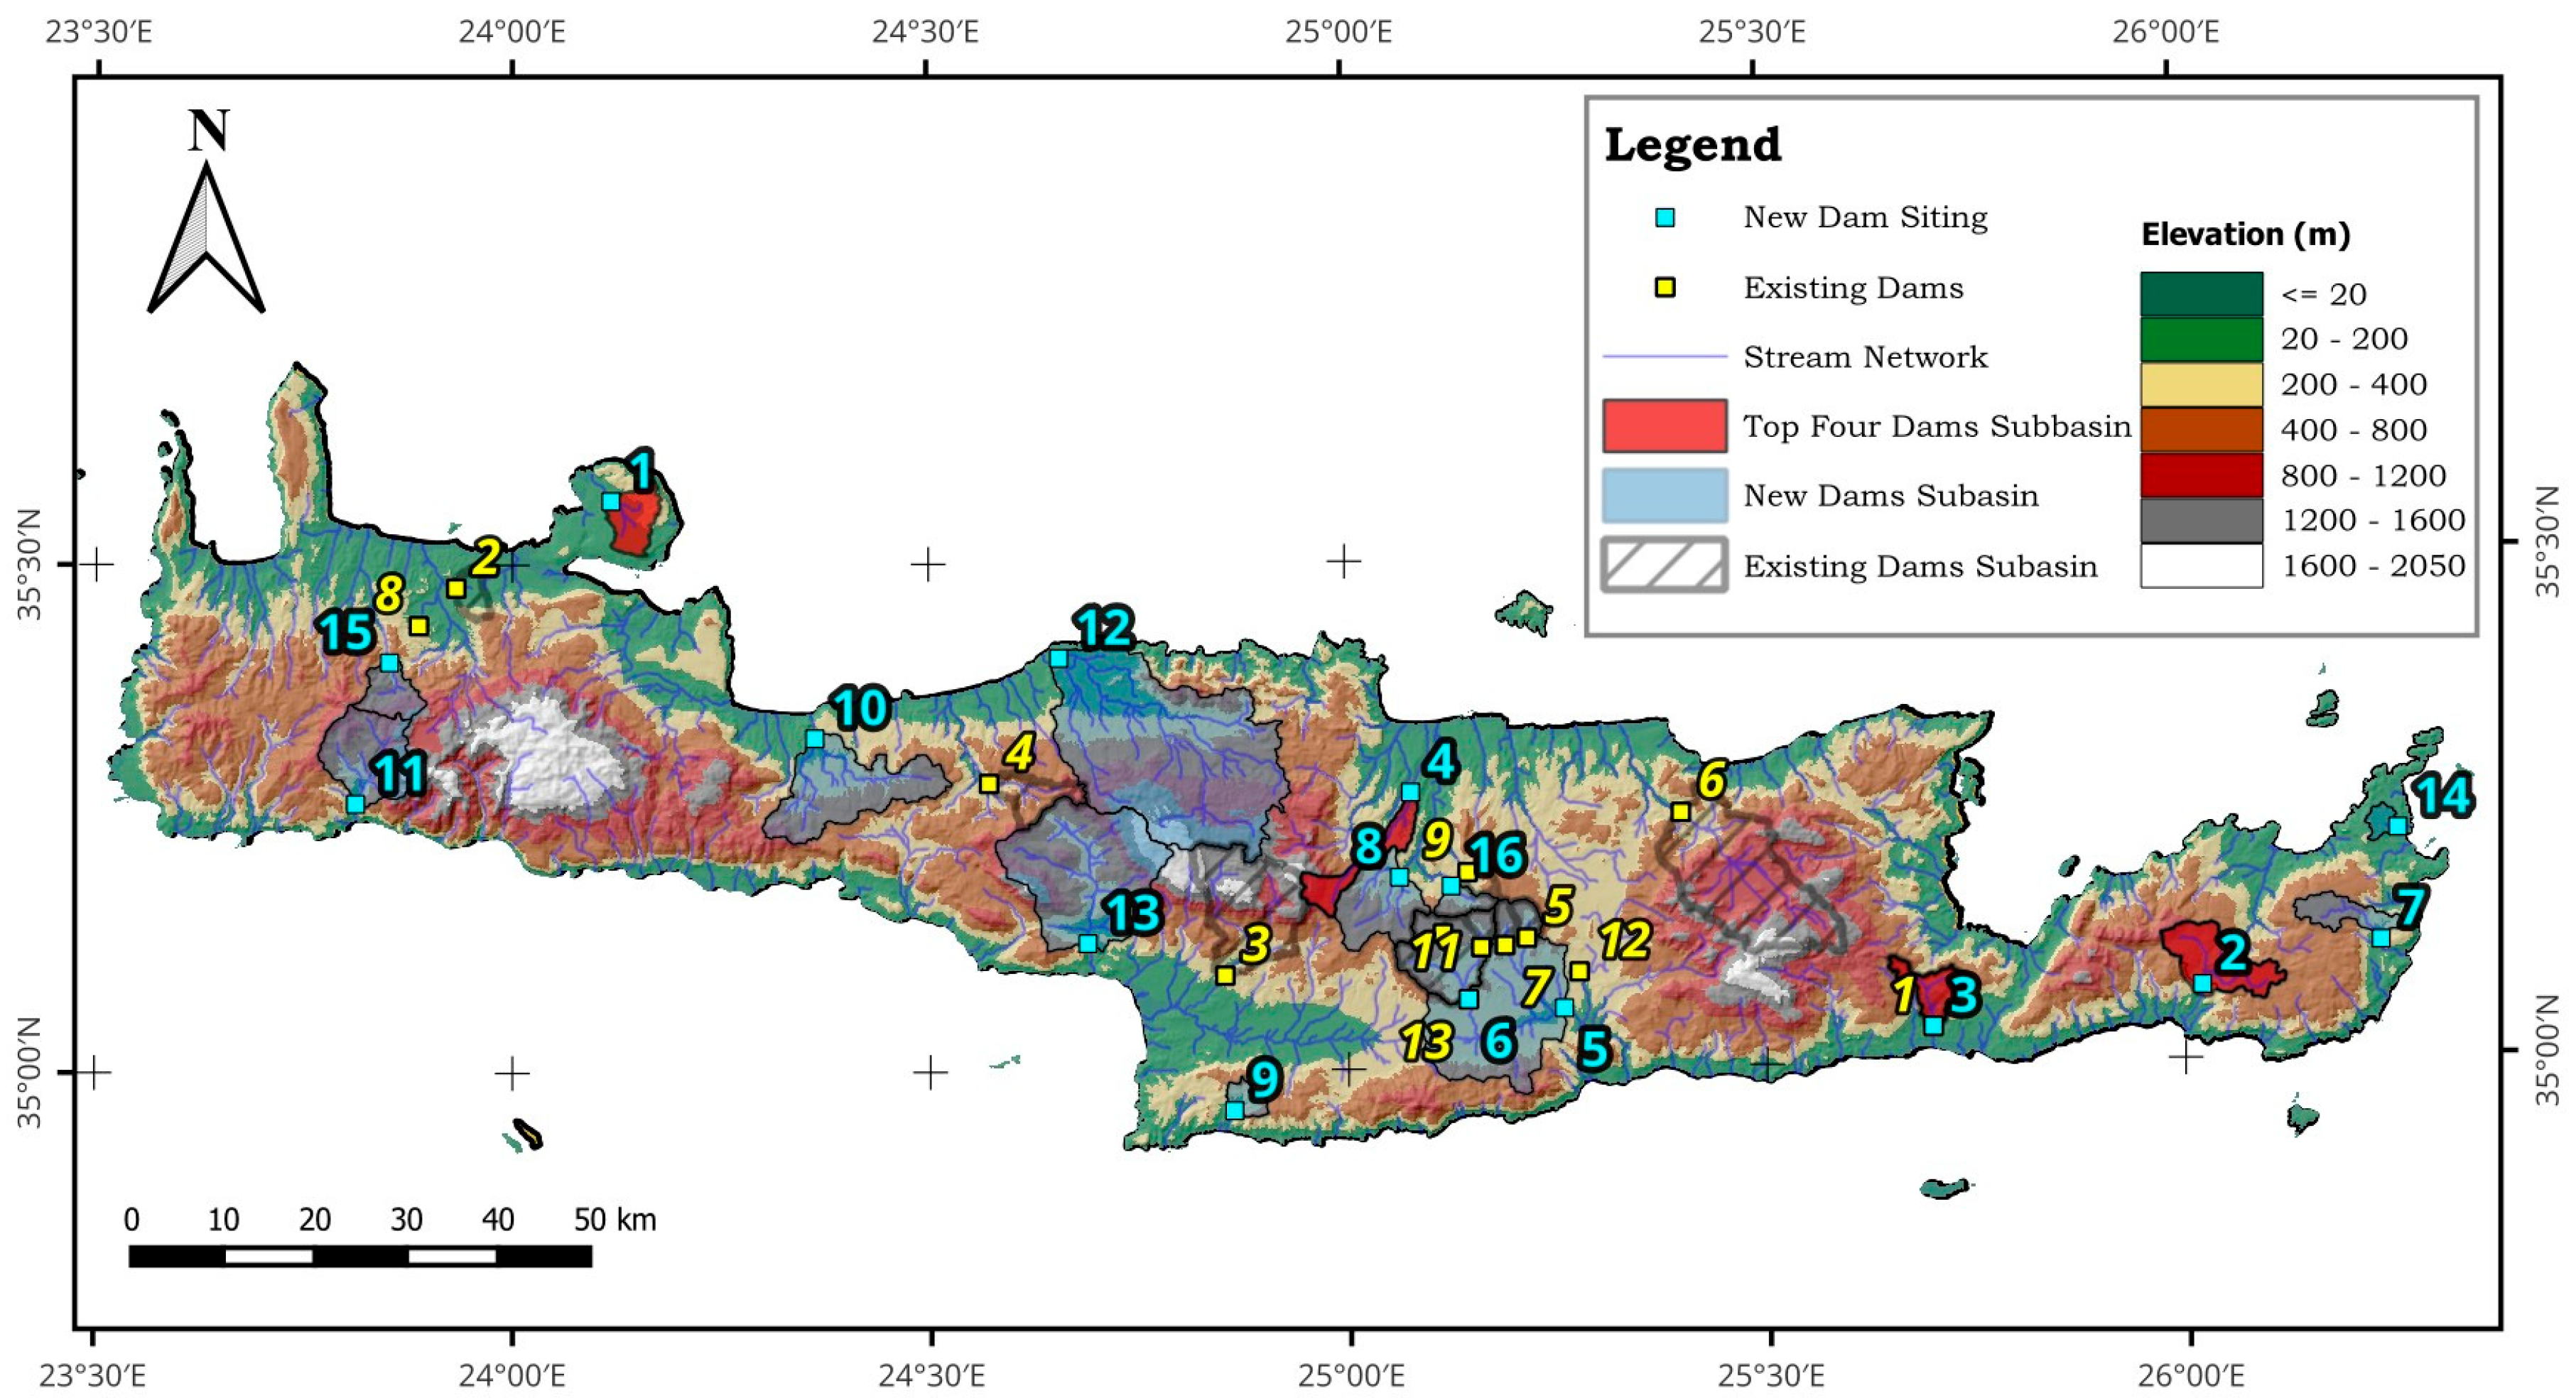
The model successfully classified 9 out 13 of the identified dams, shown in Figure 7, as highly suitable (scores > 6.5) or moderately suitable (scores 5–6.5) (Table 4), with one of these being one of the model’s top-ranked proposed locations. The remaining dams were excluded from the suitable areas because their locations breached defined constraints (proximity to faults, proximity to urban areas).
The results of the ROC analysis revealed an AUC value of 73.6%, indicating a satisfactory predicting capability for the suitability maps. Although the model performs satisfactorily, its high exclusion rate suggests that the constraints may be overly stringent. However, when the restrictions were softened to include all existing dams within suitable areas, all four of which were then classified as moderately or highly suitable, the overall accuracy decreased. The AUC value fell to 67.4% and a significant proportion of top-ranked locations were situated within urban areas.
Adjusting the suitability thresholds could improve the model’s ability to capture legitimate marginal cases that are accepted in practice despite minor constraint violations, thereby enhancing its real-world applicability. However, due to the significant environmental and social impacts of dam projects, such calibration must be applied judiciously on a case-specific basis, based on:
  • Expert judgment
  • Project-specific risk tolerance
  • Geological conditions

4.3. Sensitivity Analysis Results

Given the minimal discrepancies between the AHP and Fuzzy AHP outputs, the sensitivity analysis was performed exclusively on the Fuzzy AHP results. The results indicate strong robustness for the parameters of the top-ranked locations. Specifically:
  • The top four locations were present in all six sensitivity scenarios.
  • Five out of the six scenarios produced only one new location, with the rest being shared with the original map.
The outlier was the third sensitivity scenario (Sens3, Table 5), in which the HSG criterion was assigned a significantly lower weight. This can be attributed to the island’s bimodal soil distribution, where Group B was assigned a preference value of 1/9 and Group D a value of 9/9. This extreme weighting potentially resulted in areas with Group B soils being elevated in suitability.
It should be noted, however, that this stability may partially reflect this study’s high maximum suitability scores (>8 on a 1–9 scale); areas with lower maximum scores could potentially exhibit greater sensitivity to parameter changes. In their sensitivity analysis, [48] note that the options with the highest and lowest scores were less sensitive to changes in criteria weight compared to moderate options.

4.4. Three-Dimensional Analysis of Proposed Sites

The top four proposed dam sites (Figure 7) were identical for both the AHP and Fuzzy AHP methods. Furthermore, these four sites remained within the top eight ranked locations across all sensitivity scenarios, albeit in different positions. These four dams were considered for the 3D analysis. As the third-ranked site coincided with the existing Bramianon Dam, the remaining three were ultimately selected. For these three locations, designated Dam1, Dam2, and Dam4, the surface-volume curves were derived for each dam. The analysis also included the computation of the total catchment area, as well as the cross-sectional profile for each dam up to this maximum height.
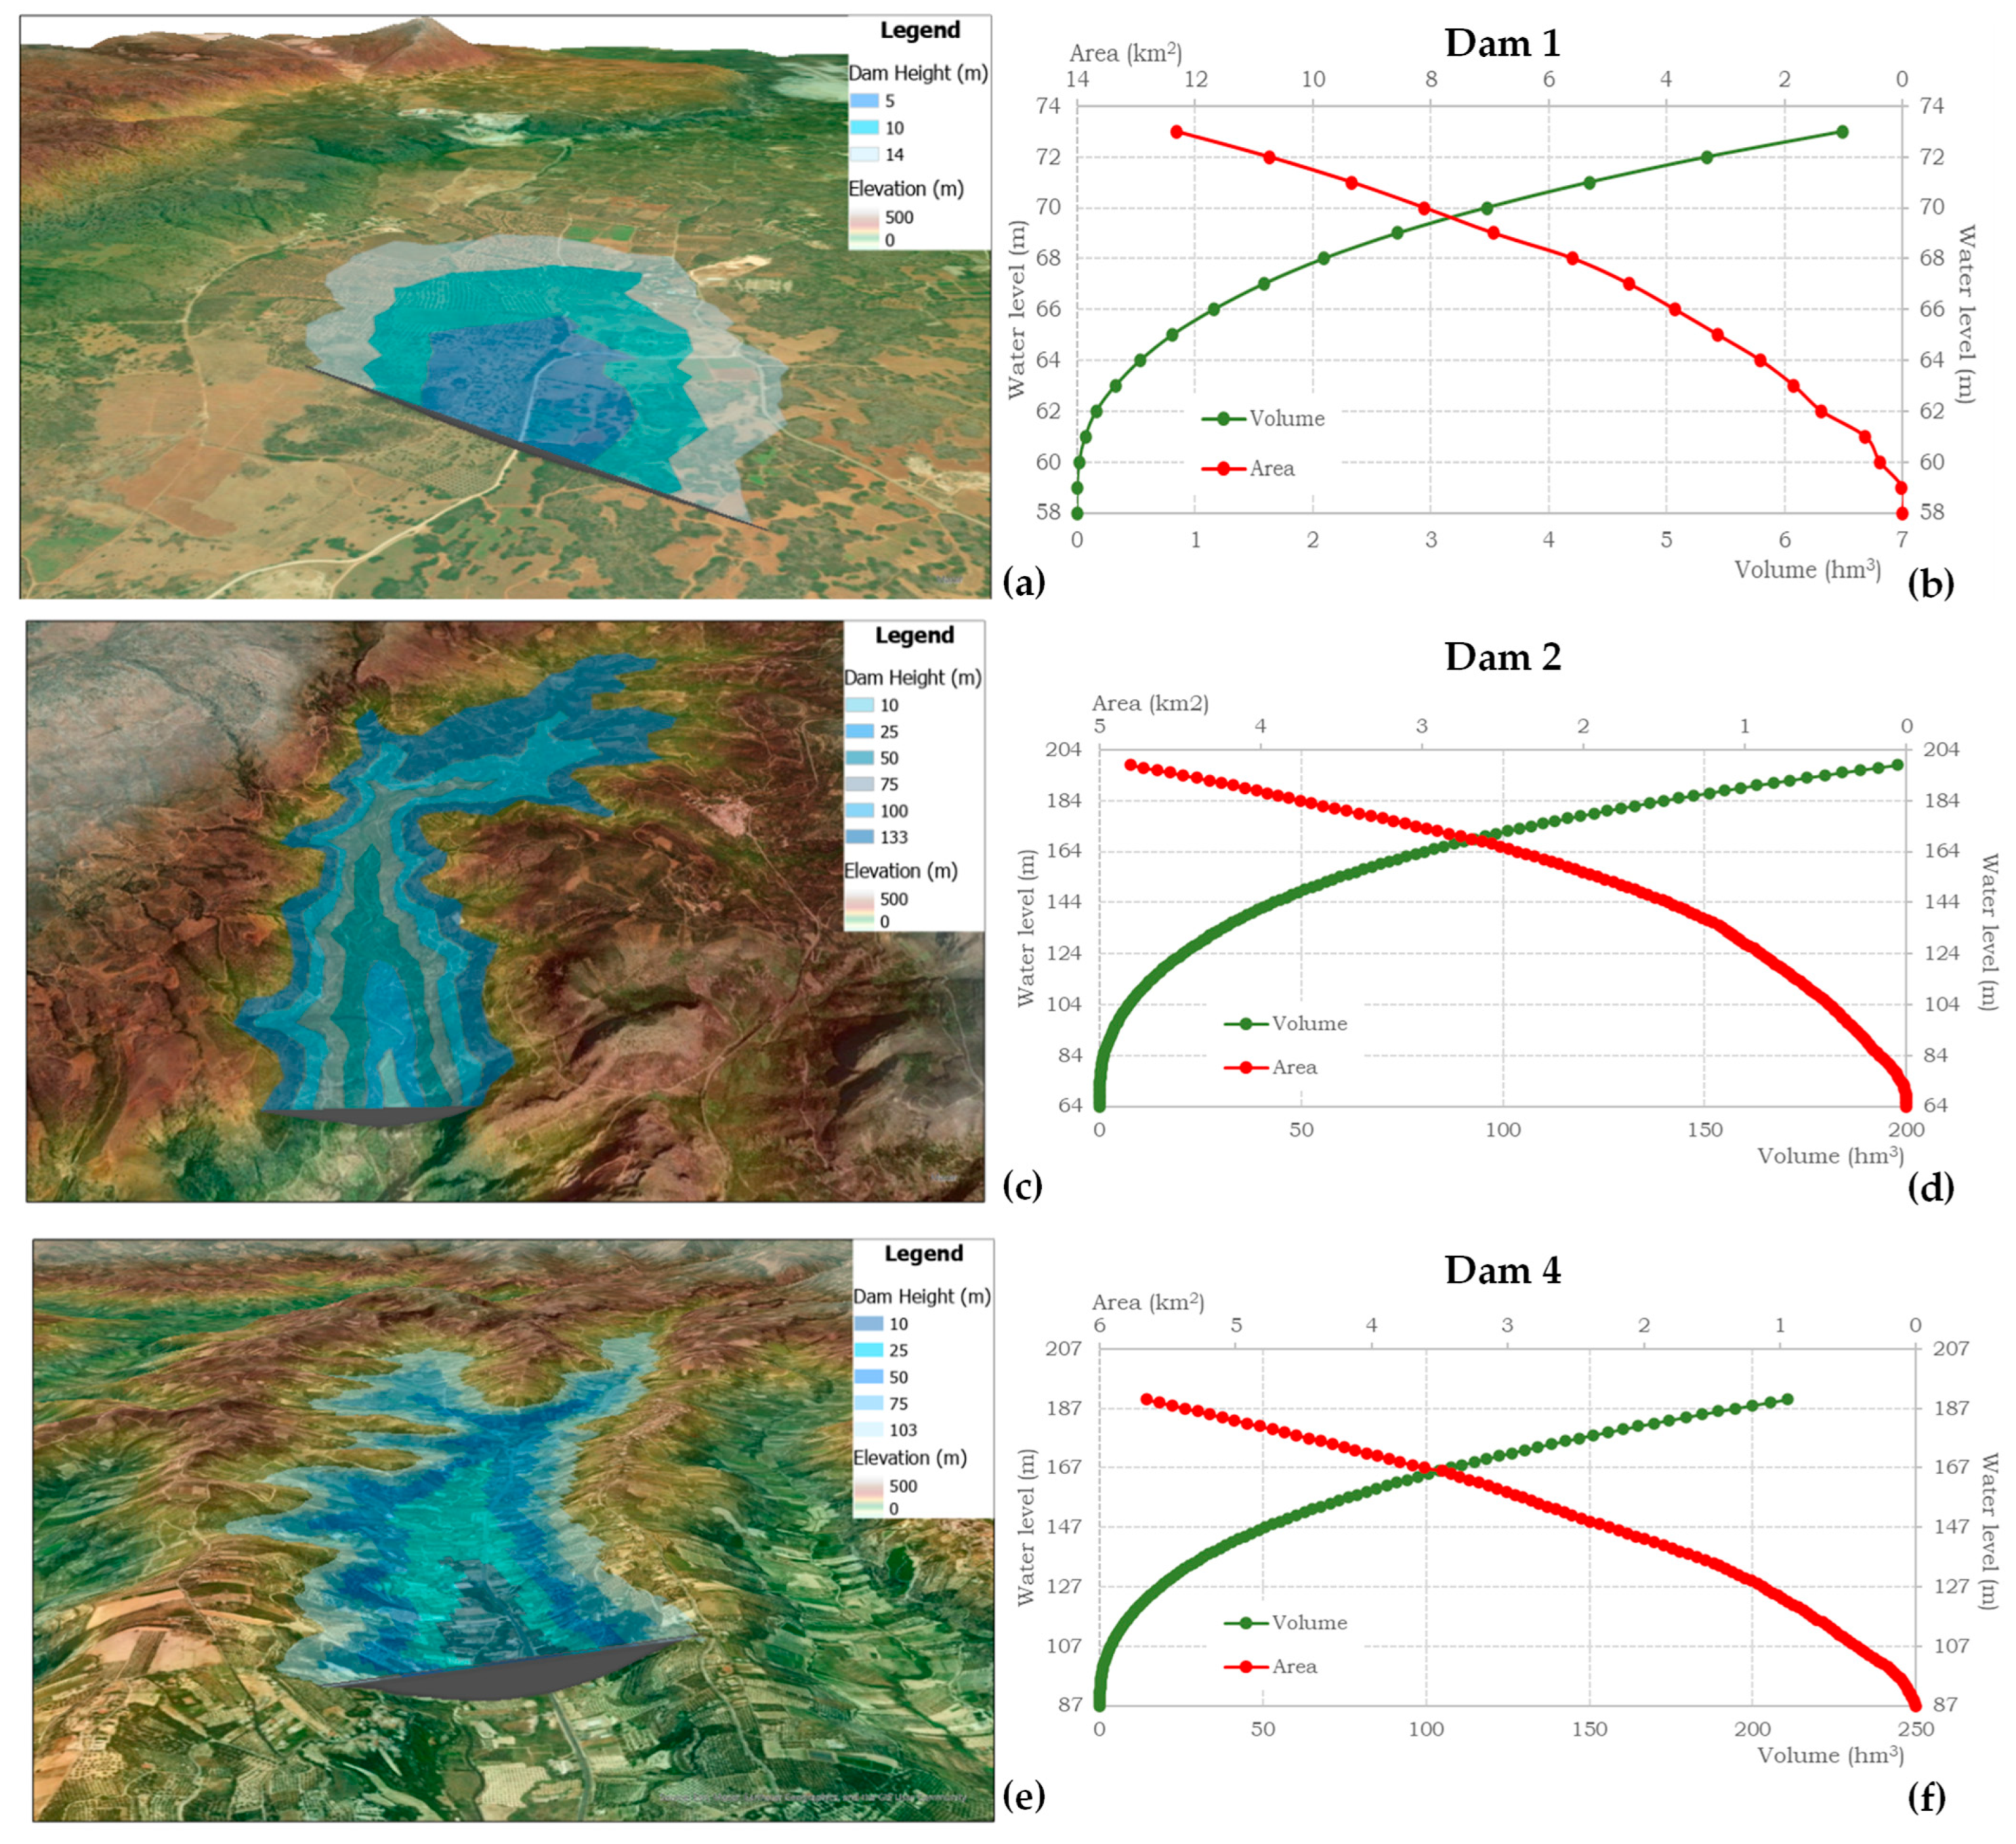
The characteristics of each dam and reservoir for its maximum height are detailed in Table 6. Figure 8 displays the 3D analysis results for three dams, i.e., a 3D visualization of the reservoir surface area in relation to the water level and the surface-volume-water level curves for each dam.
A comparison between the three proposed dam sites (Table 6) reveals that while Dams 2 and 4 offered comparable reservoir storage volumes and surface areas, Dam 1 was characterized by markedly inferior hydraulic properties, including a substantially smaller storage capacity and reservoir surface area, as well as a notably lower dam height, resulting in a shallower water depth. These pronounced differences are attributable to their distinct geomorphologies. Dam 1 is situated on a plain with very gentle elevation changes, an area not fitting for dam construction. This geomorphology limits reservoir depth while requiring an extended crest width, significantly reducing storage efficiency compared to the more suitable V-shaped valley geometries found at the other sites (Figure 8).
Although the model identified Dam 1 as suitable, the 3D analysis exposed significant constraints arising from its suboptimal valley topography. Even though a range of different valley shapes can be accommodated by different dam types [10,13], appropriate valley morphology is a crucial factor in dam site selection, as highlighted by Alrawi et al. [13], Fernández-Enríquez et al. [16], and Bunruamkaew [44]. Some researchers have developed tools to automatically identify potential dam locations based on topography [16,25,49,50], while others using the MCDM-GIS methodology for dam siting have incorporated different valley-assessment methods in their work to address this limitation:
  • The topographic position index (TPI) as a criterion for indicating the presence of a valley [15],
  • preliminary site screening using manual DEM and satellite image analysis [6,45],
  • a semi-automatic approach to identify narrow valleys by intersecting contour lines with stream order [28],
  • screening of identified high-suitability locations [3,13].
However, manual screening is impractical for large areas like Crete, and automated or index-based methods like TPI or the approach by Odiji et al. [28] have seen limited application [7,15,19] and require further validation of their effectiveness before they can be reliably adopted.
To facilitate a direct comparison with Crete’s largest dam, the Aposelemis Dam, the reservoir characteristics of Dams 2 and 4 were extracted at an equivalent dam height. The analysis revealed that Dam 2 has less than two-thirds of both the reservoir surface area and storage volume, along with a marginally shorter crest length, compared to the Aposelemis Dam. In contrast, Dam 4 achieves approximately 1.5 times the reservoir area and storage volume (Table 7). Despite these promising geometric characteristics, the watershed draining into the Aposelemis reservoir is substantially larger than those of the proposed sites. This disparity raises significant concerns about the long-term hydrological yield and sustainability of Dams 2 and 4 if developed at a comparable scale, highlighting a potential limitation of the initial suitability model. The inclusion of direct hydrological indices, such as precipitation or runoff, might result in substantially different suitability assessments.

5. Conclusions

This study generated dam site suitability maps for Crete using two MCDM approaches: AHP and Fuzzy AHP. Methodological decisions followed established practices from the literature. The results revealed numerous highly suitable locations distributed throughout the island, with validation and sensitivity analyses demonstrating satisfactory model robustness. The construction of strategically placed dams for irrigation and water supply represents a promising strategy to address three critical challenges Crete faces: the overexploitation of groundwater resources, the seasonal rise in water demand driven by tourism, and the adverse effects of climate change on water security. This present study can serve as an important evidence-based reference for guiding long-term, sustainable water resource management planning and policy decisions in Crete.
The following conclusions can be drawn:
  • The developed suitability maps demonstrate satisfactory predictive performance, validating their value as a preliminary screening tool, identifying potential dam sites across an extensive area. More favorable locations are prioritized and highly unsuitable areas are excluded, significantly reducing the resources needed for on-site investigations.
  • The framework’s inherent flexibility offers significant advantages by enabling customization for specific regional characteristics, and adaptation to different project objectives, as demonstrated in prior applications for hydropower dams [18,45] and earth dams [19].
  • The use of Fuzzy AHP didn’t provide any additional value when compared to the AHP method. Fuzzy AHP can handle uncertain or inconsistent input data, e.g., multiple divergent expert judgments [30]. However, for cases where pairwise comparisons can be defined with high certainty (crisp data), the additional computational complexity of the fuzzy extension may not be justified by a corresponding increase in result accuracy.
The following limitations are highlighted:
  • The reliability of the results is intrinsically linked to the quality, resolution, and completeness of the underlying geospatial data, as well as to the subjective judgments of the decision-makers.
  • The results should be interpreted as a tool to narrow down potential locations and should not be used for definitive judgements. Further geospatial analysis as well as on-site investigations should be carried out to identify suitable locations for dam siting.
  • This study used stream order and a catchment area threshold as hydrological parameters and did not include rainfall/runoff measurements. This decision was based on the case-specific conditions and validation revealed satisfactory performance. However, for an in-depth evaluation of selected locations, a detailed hydrological analysis is needed. Additionally, when applying this methodology to other areas, these criteria may not suffice.
Future research could include:
  • Implementation of valley morphology assessment methods. Valley morphology plays a key role in dam feasibility, characteristics, and performance and should be included in site identification. However, implementing valley morphology in GIS tools remains challenging.
  • Incorporation of more precise hydrologic indices (rainfall patterns, runoff volumes). While stream order serves as a water volume proxy, it is only an indirect indicator that stems solely from the geomorphological characteristics of the area. Although our comparison with rainfall data demonstrated its utility, a more comprehensive analysis evaluating stream order against direct actual runoff data could further quantify stream order’s reliability and refine its application as a proxy.

Author Contributions

Conceptualization, K.K., A.B. and E.B.; methodology, K.K.; validation, K.K.; investigation, K.K.; resources, K.K. and A.B.; data curation, K.K. and A.B.; writing—original draft preparation, K.K.; writing—review and editing, K.K., A.B. and E.B.; visualization, K.K. and A.B.; supervision, E.B. All authors have read and agreed to the published version of the manuscript.

Funding

This research received no external funding.

Data Availability Statement

The data presented in this study are available on request from the corresponding author. The Copernicus datasets are © of the European Union or otherwise publicly available and were used under their respective Copernicus/Open Data policies. The OpenStreetMap data used in this study are openly available under the Open Database License (ODbL) 1.0, provided by the OpenStreetMap Foundation. The Global Hydrologic Soil Groups (HYSOGs250m) dataset used in this study is publicly available and developed by the International Institute for Applied Systems Analysis (IIASA) and ISRIC—World Soil Information.

Conflicts of Interest

The authors declare no conflicts of interest.

Abbreviations

The following abbreviations are used in this manuscript:
RSRemote Sensing
GISGeographic Information Systems
MCDMMult-Criteria Decision-Making
AHPAnalytic Hierarchy Process
FAHPFuzzy Analytic Hierarchy Process
LULCLand Use Land Cover
HSGHydrologic Soil Group
DEMDigital Elevation Model
TPITopographic Position Index

References

  1. Al-Ruzouq, R.; Shanableh, A.; Yilmaz, A.G.; Idris, A.; Mukherjee, S.; Khalil, M.A.; Gibril, M.B.A. Dam Site Suitability Mapping and Analysis Using an Integrated GIS and Machine Learning Approach. Water 2019, 11, 1880. [Google Scholar] [CrossRef]
  2. Noori, A.; Pradhan, B.; Ajaj, Q. Dam Site Suitability Assessment at the Greater Zab River in Northern Iraq Using Remote Sensing Data and GIS. J. Hydrol. 2019, 574, 964–979. [Google Scholar] [CrossRef]
  3. Shao, Z.; Jahangir, Z.; Muhammad Yasir, Q.; Atta-ur-Rahman; Mahmood, S. Identification of Potential Sites for a Multi-Purpose Dam Using a Dam Suitability Stream Model. Water 2020, 12, 3249. [Google Scholar] [CrossRef]
  4. Karimi, H.; Zeinivand, H. Integrating Runoff Map of a Spatially Distributed Model and Thematic Layers for Identifying Potential Rainwater Harvesting Suitability Sites Using GIS Techniques. Geocarto Int. 2019, 36, 320–339. [Google Scholar] [CrossRef]
  5. Luis, A.d.A.; Cabral, P. Small Dams/Reservoirs Site Location Analysis in a Semi-Arid Region of Mozambique. Int. Soil Water Conserv. Res. 2021, 9, 381–393. [Google Scholar] [CrossRef]
  6. Sayl, K.; Muhammad, N.S.; El-Shafie, A. Robust Approach for Optimal Positioning and Ranking Potential Rainwater Harvesting Structure (RWH): A Case Study of Iraq. Arab. J. Geosci. 2017, 10, 413. [Google Scholar] [CrossRef]
  7. Wang, Y.; Tian, Y.; Cao, Y. Dam Siting: A Review. Water 2021, 13, 2080. [Google Scholar] [CrossRef]
  8. Yadav, S.; Mohseni, U.; Vasave, M.D.; Thakur, A.S.; Tadvi, U.R.; Pawar, R.S. Assessing Dam Site Suitability Using an Integrated AHP and GIS Approach: A Case Study of the Purna Catchment in the Upper Tapi Basin, India. Environ. Earth Sci. Proc. 2025, 32, 21. [Google Scholar] [CrossRef]
  9. Gacko, I.; Muchová, Z.; Jurík, Ľ.; Šinka, K.; Fabian, L.; Petrovič, F. Decision Making Methods to Optimize New Dam Site Selections on the Nitra River. Water 2020, 12, 2042. [Google Scholar] [CrossRef]
  10. Majid, S.Z.; Saeed, M.; Ishtiaq, U.; Argyros, I.K. The Development of a Hybrid Model for Dam Site Selection Using a Fuzzy Hypersoft Set and a Plithogenic Multipolar Fuzzy Hypersoft Set. Foundations 2024, 4, 32–46. [Google Scholar] [CrossRef]
  11. Ibrahim, G.R.F.; Rasul, A.; Ali Hamid, A.; Ali, Z.F.; Dewana, A.A. Suitable Site Selection for Rainwater Harvesting and Storage Case Study Using Dohuk Governorate. Water 2019, 11, 864. [Google Scholar] [CrossRef]
  12. Ullah, S.; Iqbal, M.; Waseem, M.; Abbas, A.; Masood, M.; Nabi, G.; Tariq, M.A.U.R.; Sadam, M. Potential Sites for Rainwater Harvesting Focusing on the Sustainable Development Goals Using Remote Sensing and Geographical Information System. Sustainability 2024, 16, 9266. [Google Scholar] [CrossRef]
  13. Alrawi, I.; Jianping, C.; Othman, A.; Ali, S.; Harash, F. Insights of Dam Site Selection for Rainwater Harvesting Using GIS: A Case Study in the Al- Qalamoun Basin, Syria. Heliyon 2023, 9, 16. [Google Scholar] [CrossRef] [PubMed]
  14. Aghaloo, K.; Chiu, Y.-R. Identifying Optimal Sites for a Rainwater-Harvesting Agricultural Scheme in Iran Using the Best-Worst Method and Fuzzy Logic in a GIS-Based Decision Support System. Water 2020, 12, 1913. [Google Scholar] [CrossRef]
  15. Al-Kakey, O.; Othman, A.A.; Al-Mukhtar, M.; Dunger, V. Proposing Optimal Locations for Runoff Harvesting and Water Management Structures in the Hami Qeshan Watershed, Iraq. ISPRS Int. J. Geo-Inf. 2023, 12, 312. [Google Scholar] [CrossRef]
  16. Fernández-Enríquez, A.; Pérez-Cayeiro, M.L.; Anfuso, G. GIS Modeling to Climate Change Adaptation by Reducing Evaporation in Water Reservoirs: Smart Location Technique of Minimal Evaporation Reservoirs (GIS-MER). Sustainability 2022, 14, 13822. [Google Scholar] [CrossRef]
  17. Masood, M.U.; Khan, N.M.; Haider, S.; Anjum, M.N.; Chen, X.; Gulakhmadov, A.; Iqbal, M.; Ali, Z.; Liu, T. Appraisal of Land Cover and Climate Change Impacts on Water Resources: A Case Study of Mohmand Dam Catchment, Pakistan. Water 2023, 15, 1313. [Google Scholar] [CrossRef]
  18. Minatour, Y.; Khazaei, J.; Ataei, M. Earth Dam Site Selection Using the Analytic Hierarchy Process (AHP): A Case Study in the West of Iran. Arab. J. Geosci. 2012, 6, 3417–3426. [Google Scholar] [CrossRef]
  19. Dirie, A.; Jamei, M.; OleiwiSulaiman, S. A Comprehensive Review for the Dams Site Selection Based on Multi-Criteria: Assessment and Evaluation. AUIQ Tech. Eng. Sci. 2024, 1, 4. [Google Scholar] [CrossRef]
  20. Mbura, F. Site Selection for an Earth Dam in Mbeere North, Embu County—Kenya. J. Geosci. Environ. Prot. 2018, 06, 113–133. [Google Scholar] [CrossRef]
  21. Zytoon, A.; Gharineiat, Z.; Alajarmeh, O. Supplementary Dam Site Selection Using a Geospatial Approach: A Case Study of Wivenhoe Dam. ISPRS Int. J. Geo-Inf. 2024, 13, 180. [Google Scholar] [CrossRef]
  22. Rahmati, O.; Kalantari, Z.; Samadi, M.; Uuemaa, E.; Moghaddam, D.D.; Nalivan, O.A.; Destouni, G.; Tien Bui, D. GIS-Based Site Selection for Check Dams in Watersheds: Considering Geomorphometric and Topo-Hydrological Factors. Sustainability 2019, 11, 5639. [Google Scholar] [CrossRef]
  23. Minatour, Y.; Khazaei, J.; Ataei, M.; Javadi, A.A. An Integrated Decision Support System for Dam Site Selection. Sci. Iran. 2015, 22, 319–330. [Google Scholar]
  24. Liu, J.; Tan, J.; Zhang, S.; Zhong, C.; Lv, L.; Tara, A. Suitability Assessment of Small Dams’ Location as Nature-Based Solutions to Reduce Flood Risk in Mataniko Catchment, Honiara, Solomon Islands. Sustainability 2023, 15, 3313. [Google Scholar] [CrossRef]
  25. Teschemacher, S.; Bittner, D.; Disse, M. Automated Location Detection of Retention and Detention Basins for Water Management. Water 2020, 12, 1491. [Google Scholar] [CrossRef]
  26. Handhal, A. A GIS-Based Integrated Fuzzy Logic and Analytic Hierarchy Process Model for Assessing Water-Harvesting Zones in Northeastern Maysan Governorate, Iraq. Arab. J. Sci. Eng. 2017, 42, 2487–2499. [Google Scholar]
  27. Khan, D.; Raziq, A.; Young, H.-W.V.; Sardar, T.; Liou, Y.-A. Identifying Potential Sites for Rainwater Harvesting Structures in Ghazi Tehsil, Khyber Pakhtunkhwa, Pakistan, Using Geospatial Approach. Remote Sens. 2022, 14, 5008. [Google Scholar] [CrossRef]
  28. Odiji, C.; Adepoju, M.; Ibrahim, I.; Oluwatola, A.; Ihenacho, N.; Olaide, A. Small Hydropower Dam Site Suitability Modelling in Upper Benue River Watershed, Nigeria. Appl. Water Sci. 2021, 11, 1–17. [Google Scholar] [CrossRef]
  29. Saaty, T.L. A Scaling Method for Priorities in Hierarchical Structures. J. Math. Psychol. 1977, 15, 234–281. [Google Scholar] [CrossRef]
  30. Liu, Y.; Eckert, C.; Earl, C. A Review of Fuzzy AHP Methods for Decision-Making with Subjective Judgements. Expert Syst. Appl. 2020, 161, 113738. [Google Scholar] [CrossRef]
  31. Othman, A.A.; Al-Maamar, A.F.; Al-Manmi, D.A.M.A.; Liesenberg, V.; Hasan, S.E.; Obaid, A.K.; Al-Quraishi, A.M.F. GIS-Based Modeling for Selection of Dam Sites in the Kurdistan Region, Iraq. ISPRS Int. J. Geo-Inf. 2020, 9, 244. [Google Scholar] [CrossRef]
  32. Baltas, E.; Tzoraki, O. Water Resources Management on the Island of Crete: Lessons Learned. In Free Flow—Reaching Water Security Through Cooperation, Tudor Rose; United Nations International Year of Water Cooperation, UNESCO, Tudor Rose: Paris, France, 2013; pp. 285–289. ISBN 978-92-3-104256-0. [Google Scholar]
  33. Tzanakakis, V.A.; Angelakis, A.N.; Paranychianakis, N.V.; Dialynas, Y.G.; Tchobanoglous, G. Challenges and Opportunities for Sustainable Management of Water Resources in the Island of Crete, Greece. Water 2020, 12, 1538. [Google Scholar] [CrossRef]
  34. UNISEF Confronting a Changed Childhood in Crete. Available online: https://www.unicef.org/greece/en/confronting-changed-childhood-crete (accessed on 24 August 2025).
  35. Hellenic Statistical Authority 2021 Population-Housing Census. Available online: https://www.statistics.gr/en/2021-census-pop-hous (accessed on 24 August 2025).
  36. Hellenic Statistical Authority Gross Domestic Product. 2022. Available online: https://www.statistics.gr/en/statistics/-/publication/SEL48/- (accessed on 24 August 2025).
  37. Stavropoulou, I. Dam Site Selection Using GIS Techniques on the Island of Corfu. Master’s Thesis, National Technical University of Athens, Athens, Greece, 2024. [Google Scholar]
  38. European Space Agency (ESA). Copernicus Digital Elevation Model (DEM) GLO-30. Available online: https://dataspace.copernicus.eu/explore-data/data-collections/copernicus-contributing-missions/collections-description/COP-DEM (accessed on 24 August 2025).
  39. European Space Agency (ESA) Copernicus Land Monitoring Service—CORINE Land Cover (CLC) 2018, Version 2020_20u1. Available online: https://land.copernicus.eu/pan-european/corine-land-cover/clc2018 (accessed on 7 November 2025).
  40. Ross, C.W.; Prihodko, L.; Anchang, J.; Kumar, S.; Ji, W.; Hanan, N.P. HYSOGs250m, Global Gridded Hydrologic Soil Groups for Curve-Number-Based Runoff Modeling. Sci. Data 2018, 5, 180091. [Google Scholar] [CrossRef]
  41. OpenStreetMap Contributors, OpenStreetMap 2025. Available online: https://www.openstreetmap.org/ (accessed on 25 August 2025).
  42. Earthquake Planning & Protection Organisation Hellenic DataBase of Active Faults—HeDBAF. Available online: https://activefaults.eagme.gr/el/ (accessed on 7 November 2025).
  43. Lagouvardos, K.; Kotroni, V.; Bezes, A.; Koletsis, I.; Kopania, T.; Lykoudis, S.; Mazarakis, N.; Papagiannaki, K.; Vougioukas, S. The Automatic Weather Stations NOANN Network of the National Observatory of Athens: Operation and Database. Geosci. Data J. 2017, 4, 4–16. [Google Scholar] [CrossRef]
  44. Bunruamkaew, K. How to Do AHP Analysis in Excel. Division of Spatial Information Science, Graduate School of Life and Environmental Sciences, University of Tsukuba. 1 March 2012. Available online: https://giswin.geo.tsukuba.ac.jp/sis/gis_seminar/How%20to%20do%20AHP%20analysis%20in%20Excel.pdf (accessed on 24 August 2025).
  45. Jozaghi, A.; Alizadeh, B.; Hatami, M.; Flood, I.; Khorrami, M.; Khodaei, N.; Ghasemi Tousi, E. A Comparative Study of the AHP and TOPSIS Techniques for Dam Site Selection Using GIS: A Case Study of Sistan and Baluchestan Province, Iran. Geosciences 2018, 8, 494. [Google Scholar] [CrossRef]
  46. Facchinetti, G.; Ricci, R.G.; Muzzioli, S. Note on Ranking Fuzzy Triangular Numbers. Int. J. Intell. Syst. 1998, 13, 613–622. [Google Scholar] [CrossRef]
  47. Kar, A. A Hybrid Group Decision Support System for Supplier Selection Using Analytic Hierarchy Process, Fuzzy Set Theory and Neural Network. J. Comput. Sci. 2014, 6, 23–33. [Google Scholar] [CrossRef]
  48. Zyoud, S.H.; Kaufmann, L.G.; Shaheen, H.; Samhan, S.; Fuchs-Hanusch, D. A Framework for Water Loss Management in Developing Countries under Fuzzy Environment: Integration of Fuzzy AHP with Fuzzy TOPSIS. Expert Syst. Appl. 2016, 61, 86–105. [Google Scholar] [CrossRef]
  49. Petheram, C.; Gallant, J.; Read, A. An Automated and Rapid Method for Identifying Dam Wall Locations and Estimating Reservoir Yield over Large Areas. Environ. Model. Softw. 2017, 92, 189–201. [Google Scholar] [CrossRef]
  50. Wimmer, M.H.; Pfeifer, N.; Hollaus, M. Automatic Detection of Potential Dam Locations in Digital Terrain Models. ISPRS Int. J. Geo-Inf. 2019, 8, 197. [Google Scholar] [CrossRef]
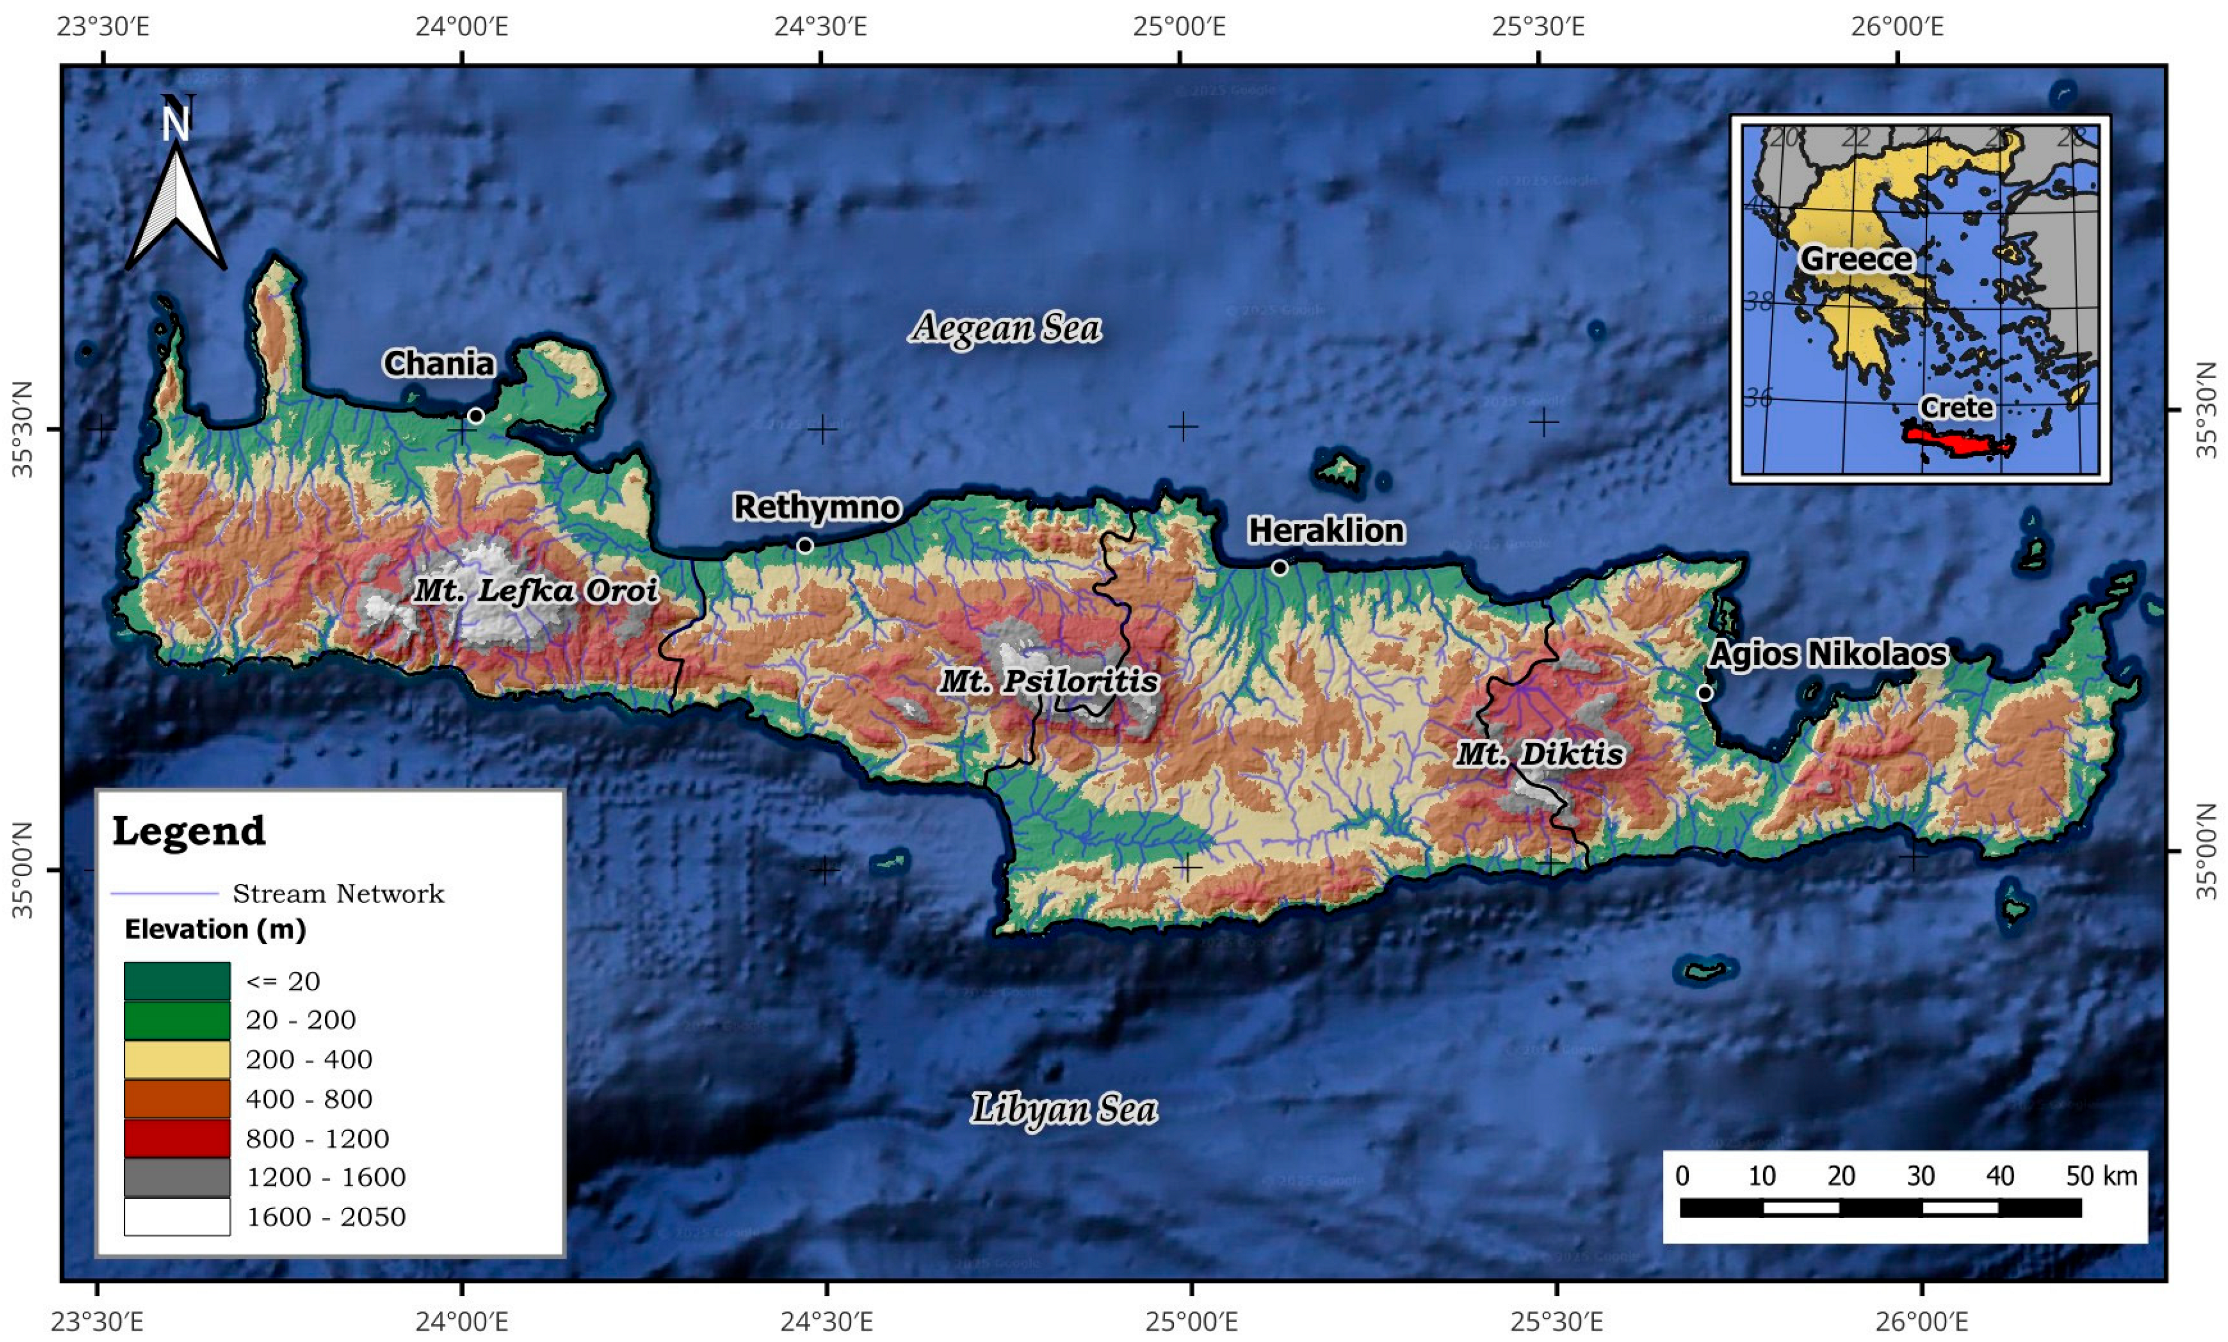
Figure 1. The study area’s morphology and main cities.
Geographies 05 00071 g001
Figure 2. The study’s framework.
Geographies 05 00071 g002
Figure 3. The eight thematic layers/criteria used in this study: (a) DEM. (b) Slope. (c) HSG. (d) LULC. (e) Stream order. (f) Distance to faults. (g) Distance to roads. (h) Distance to urban areas.
Geographies 05 00071 g003
Figure 4. AHP and Fuzzy AHP methodology framework.
Geographies 05 00071 g004
Figure 5. The 9-level fuzzy scale, taken from [30].
Geographies 05 00071 g005
Figure 6. The generated suitability maps: (a) with the AHP method. (b) with the Fuzzy AHP method.
Geographies 05 00071 g006
Figure 7. Location of the suggested and existing dams in Crete.
Geographies 05 00071 g007
Figure 8. 3D analysis results for three dams, dam 1 (top row), dam 3 (middle row), dam 4 (bottom row). Left Column, (subfigures (a,c,e)) illustrates the reservoir surface area in relation to water level; Right columns (subfigures (b,d,f)), illustrate the surface-volume-water level curves for each dam.
Geographies 05 00071 g008
Table 1. Most used criteria for dam siting, based on literature.
CategoryCriteria
TopographicElevation; Slope
GeotechnicalSoil Type; Distance to Faults;
HydrologicalPrecipitation; Runoff/Discharge; Stream Order
Curve Number
EnvironmentalLand Cover
Socio-economicDistance to Roads; Distance to Cities/villages
The criteria used in the current study are highlighted with bold
Table 2. Criteria weights and Consistency Ratio derived from both methods.
MethodCR1CR2CR3CR4CR5CR6CR7CR8CR
AHP0.2650.2160.1940.1270.0860.0560.0320.0230.082
Fuzzy AHP0.2780.2090.1950.1250.0820.0540.0320.0240.082
CR1: Slope, CR2: Stream order, CR3: HSG, CR4: Elevation, CR5: LULC, CR6: Dist. to Faults, CR7: Dist. to Urban, CR8: Dist. to Roads, CR: Consistency Ratio.
Table 3. Reclassification scheme used for each criterion.
CriterionClassesPreference Value
Slope (°)<29
2–48
4–67
6–86
8–105
10–203
>201
Stream Order49
38
27
15
HSGD9
C5
B1
A0-Restricted
Elevation (m)0–1509
150–3007
300–5005
500–10003
>10001
LULCOpen spaces9
Agricultural areas7
Shrubland5
Forests3
Artificial surfaces1
Dump sites, critical infrastructure0-Restricted
Distance to Faults (m)>10,0009
7500–10,0007
5000–75005
2500–50003
1000–25001
<10000-Restricted
Distance to Roads (m)<10009
1000–25007
2500–40005
4000–55003
>55001
Distance to Urban (m)2000–35009
3500–50007
1000–20006
5000–65005
6500–80003
>80000-Restricted
Table 4. Suitability assessment for the thirteen identified existing dam.
NoDam NameSuitability
1Bramiana DamHIGH
2Agias DamMODERATE
4Potamon DamHIGH
5Partiron DamHIGH
6Aposelemis DamHIGH
7Amourgelles DamRestricted
8Balsamiotis DamRestricted
9Chalavrianos DamHIGH
10Damania DamRestricted
11Armanogion DamHIGH
12Ini-Mahera DamRestricted
13Plakiotissa DamMODERATE
Table 5. Criteria weights ranking order for each sensitivity scenario.
RankFuzzy AHPSens1Sens2Sens3Sens4Sens5Sens6
1SlopeStream orderSlopeSlopeSlopeSlopeSlope
2Stream orderHSGHSGStream orderStream orderStream orderStream order
3HSGSlopeElevationElevationHSGHSGHSG
4ElevationElevationStream orderLULCLULCElevationElevation
5LULCLULCLULCHSGFaultsFaultsLULC
6FaultsFaultsFaultsFaultsElevationUrbanUrban
7UrbanUrbanUrbanUrbanUrbanLULCRoad
8RoadRoadRoadRoadRoadRoadFaults
Bold denotes the criterion that was systematically demoted by two positions in the overall ranking.
Table 6. Dam/reservoir characteristics for the three selected locations.
Dam IDReservoir Area (km2)Storage Volume (hm3)Max Dam Height (m)Crest Length (m)Catchment Area (km2)
Dam 11.155.914100032.6
Dam 24.81197.78133100061.34
Dam 45.56210.8103100039.87
Table 7. Characteristics of Dam 2 and 4 at 61 m height compared to Aposelemis Dam.
Dam IDReservoir Area (km2)Storage Volume (hm3)Dam Height (m)Crest Length (m)Catchment Area (km2)
Aposelemis Dam1.636.261660143
Dam 20.9422.46161361.34
Dam 42.3352.996166039.87
Disclaimer/Publisher’s Note: The statements, opinions and data contained in all publications are solely those of the individual author(s) and contributor(s) and not of MDPI and/or the editor(s). MDPI and/or the editor(s) disclaim responsibility for any injury to people or property resulting from any ideas, methods, instructions or products referred to in the content.