Abstract
Market gardening plays a crucial role in ensuring food security and reducing poverty in Africa’s rapidly urbanizing regions. However, urban agricultural systems are increasingly threatened by climatic shocks such as floods, droughts, and heat waves. This study uses an integrated approach to analyze the multidimensional factors of climatic vulnerability among urban market gardeners in the Grand Nokoué region of Benin. Based on socio–economic, technico–agronomic, and perceptual data collected from 369 growers, multiple correspondence analysis (MCA) coupled with ascending hierarchical analysis (AHA) was performed to identify vulnerability profiles. K–means partitioning was used to confirm the optimal number of groups, thereby guaranteeing the robustness and internal consistency of the typology. Three distinct vulnerability groups were identified, each characterized by specific socioeconomic, technical, and territorial characteristics, as well as varying exposure to the risks of flooding, drought, and dry spells. The results show that the most vulnerable farmers tend to be young women with low incomes, limited access to land, and a reliance on manual irrigation in flood–prone areas. These findings emphasize the uneven distribution of adaptive capacities and the pressing requirement for tailored public policies to enhance resilience, especially among small–scale, low–income, and land–insecure urban farmers, who are vulnerable to various climate–related risks.
1. Introduction
In a global context characterized by rapid urbanization and the increasingly evident effects of climate change, Africa’s cities are experiencing significant social, economic, and environmental transformations [1,2,3]. This accelerated, often unplanned, urban growth exerts considerable pressure on natural resources, infrastructure, and food systems [4,5]. In 2020, over 55% of the world’s population lived in urban areas, a proportion projected to rise to 70% by 2050 [6], which will inevitably increase the demand for food in cities. In the face of these challenges, urban agriculture is emerging as a significant source of food and employment [4,7,8,9]. It contributes to food security, income generation, and environmental resilience [10,11]. It is estimated that around 15–20% of the world’s food production currently comes from urban areas [12], and this proportion is set to increase [13] in order to meet urban food needs amid rapid urbanization. Market gardening is a fundamental component of urban agriculture and plays a crucial role in improving food security in urban centers [14].
However, the development of this sector is taking place against a backdrop of growing climatic vulnerability [15,16]. Climate change is indeed increasing the frequency and intensity of extreme weather events such as floods, heatwaves, and droughts, which directly affect agricultural productivity and income [17,18,19]. Consequently, urban market gardeners are increasingly confronted with irregular weather conditions, resulting in unstable harvests and substantial agricultural losses [20,21]. These impacts are exacerbated by social inequalities, land insecurity, and inadequate urban infrastructure. Although urban agriculture is vital, it is predominantly practiced by low–income populations who often lack the means to implement resilient solutions [22]. Furthermore, increasing urbanization is leading to a significant reduction in available land and increased fragmentation of agricultural plots [23], pushing smallholders and marginalized communities to settle on degraded land or in flood–prone areas such as lowlands [24,25]. This constrained location makes them even more vulnerable to climatic hazards. These vulnerable producers are among those most affected by environmental degradation, resulting in a marked drop in agricultural productivity. Some studies estimate that yields can fall by more than 90% during extreme weather events in such conditions [26].
In Benin, however, market gardening plays an important role, particularly in urban and peri–urban areas [27,28]. While this sector appears to offer a promising solution to urban food insecurity, experience to date shows that the development of urban gardens has fallen short of expectations [29]. This is particularly evident in the context of recurring floods, droughts, and heatwaves [30,31]. Numerous studies, including those referenced in [32,33], predict that episodes of extreme heat, drought, and flooding will become more frequent and intense in these regions. A report by the Intergovernmental Panel on Climate Change [34] confirms that the intensification of these extreme events is exacerbating climate risks and directly affecting people’s livelihoods. The strong urbanization trend in Benin, illustrated by a projected increase of 60% in the urban population between 2025 and 2050 from an estimated 7.15 million to 11.44 million inhabitants [35], is putting increased pressure on infrastructure, the environment, and basic resources. This exacerbates existing pressures in these areas. This exacerbates food insecurity, particularly among disadvantaged populations, increasing competition for land and relegating agricultural activities to marginal areas that are often exposed to climatic hazards. Against this backdrop, although vegetable production is a potential response to growing food needs, it remains the sector most vulnerable to the effects of climate change [36,37,38].
According to several authors [39,40], this vulnerability stems from the interplay of exposure to hazards, the sensitivity of farming systems, and the capacity of farmers to adapt. This integrated approach highlights the influence of local contexts on vulnerability levels. Indeed, vulnerability factors are interdependent and act in combination [41,42]. Although many studies have addressed issues related to urban agriculture or climate hazards, these topics are often considered in isolation from each other. Most studies focus on a single type of climate risk or neglect the specifics of the urban context. In Benin, although several studies have examined urban agriculture, certain key dimensions remain insufficiently explored. For instance, one study [29] identifies the main factors influencing the development of urban agriculture without establishing a direct link to climate risks. Other studies focus on the typology of producers and their capacity to adapt in coastal peri–urban areas but do not consider disparities in exposure to hazards or the underlying structural and socio–economic factors of these differentiated vulnerabilities. Furthermore, while studies by [30] highlight the effects of climate variability on vegetable production, particularly the disruption to the agricultural calendar and the importance of access to water, they do not provide an integrated analysis of technical, land–related, and institutional vulnerability factors. Although agriculture is the country’s main source of income [43,44,45], the region’s future economic, political, and social development depends on agriculture’s ability to adapt to multiple pressures, particularly those caused by climate disruption and rapid population growth [46]. Several authors have emphasized the importance of identifying the technical, structural, socio–economic, and institutional factors that increase vulnerability to various climate risks in an integrated manner [41,47,48]. This study is notable for its integrated, multidimensional approach to climate vulnerability. It considers both differentiated exposure to climate hazards and adaptive capacities within an urban context. The study aims to analyze the structural, socio–economic, and environmental factors that influence the vulnerability of urban market gardeners in the Greater Nokoué region of Benin. The study uses a cross–cutting approach based on indicators of exposure, sensitivity, and adaptive capacity. The study is guided by several key questions: (1) What are the socio–agronomic profiles of urban market gardeners in the face of climate hazards? (2) What structural factors are associated with greater climate vulnerability? And (3) To what extent do exposure and adaptive capacity vary according to the individual, land, and institutional characteristics of producers?
2. Materials and Methods
2.1. Study Area
The Grand Nokoué area is located in southern Benin between 6°18′ and 6°30′ north latitude and 2°02′ and 2°40′ east longitude. It is bordered by inland communes to the north, the Atlantic Ocean to the south, Nigeria to the east, and the commune of Grand Popo to the west (Figure 1). The 380 km2 area comprises the municipalities of Abomey–Calavi, Cotonou, Ouidah, Porto–Novo, and Semè–Podji.
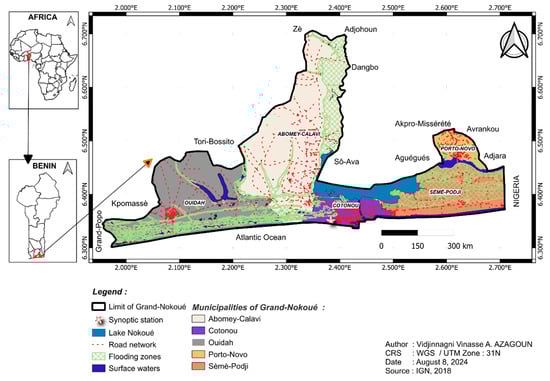
Figure 1.
Geographical location of Grand Nokoué.
From 1979 to 2013, Grand Nokoué’s population grew phenomenally, increasing from 604,106 to nearly two million (1,984,206). According to projections, it could surpass three million in 2026, representing around a quarter of the national population [49]. This rapid urban growth inevitably increases food requirements, underscoring the urgent need to understand factors that hinder the development and resilience of urban vegetable farms. These farms are essential for ensuring food security in this strategic region.
In terms of climate, Grand Nokoué has a tropical climate, with annual rainfall ranging from 898.2 mm to 1749.8 mm, with a median of 1287.1 mm. The month of June records the highest rainfall (212.8 mm). The rainfall variance between the months with the lowest and highest rainfall is 194.88 mm. The median annual temperature is 26.7 °C. The difference between the lowest and highest temperatures of the year is 31 °C (Figure 2).
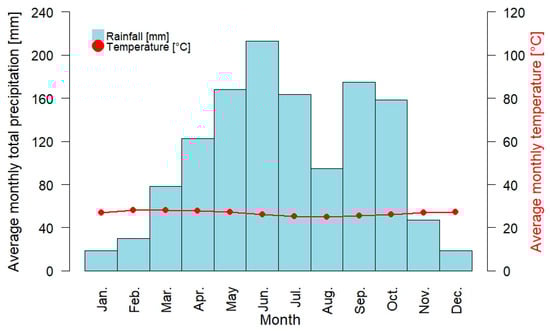
Figure 2.
Walter–Lieth ombrothermic diagram of the Grand Nokoué region, based on average monthly temperature and precipitation data from 1991 to 2020. Source: Synoptic data collected from the Benin Meteorological Agency (Météo Bénin), 2024.
2.2. Reason for Choosing the Zone
The Greater Nokoué region was selected due to its pivotal role in urban vegetable production in Benin. Encompassing several municipalities, including Cotonou, Sèmè–Podji, and Ouidah, it accounts for a significant proportion of urban agricultural activities, which are directly linked to the growing demand for fresh produce in urban centers [30,50]. The area is also particularly vulnerable to the effects of climate change, including rainfall variability, seasonal flooding, coastal erosion, and inundation, all of which directly impact agricultural practices. In recent years, the frequency of extreme rainfall and heatwaves has exceeded historical trends [32]. Furthermore, the region’s rapid urban growth has led to a reduction in natural spaces in favor of built–up areas, putting additional pressure on agricultural resources. This makes it all the more necessary to conduct an in–depth analysis of the factors that may hinder the development and resilience of urban market gardens, which are essential to the food security of local populations. While Greater Nokoué is not representative of Benin as a whole in terms of agroecology and the economy, it is a relevant case study for analyzing the challenges of adapting to climate change in a coastal urban context. Lessons learned from this region can therefore inform broader reflections on resilience policies in other areas facing similar dynamics.
2.3. Data Collection
Both primary and secondary data were collected and processed for this study. Secondary data collection was based on a literature review that first explored the methodologies employed in similar studies conducted in other countries. Then, the literature review was used to identify the main climate risks likely to affect agriculture, as well as the vulnerability factors specific to market gardeners in the country, based on scientific works and strategic documents (notably communications on climate change; Nationally Determined Contributions—NDCs; and the National Adaptation Plan). These risks were validated through interviews with key stakeholders, who were selected using a snowball sampling method. Twenty experts recognized for their technical expertise and local involvement in agriculture, climate, and risk management were interviewed using this technique. To gain a more comprehensive understanding of all aspects of the study, primary data collection employed both quantitative and qualitative methods. These data were obtained through individual surveys of 369 farming households. The households were selected from the towns of Cotonou, Sèmè–Podji, and Ouidah. The selection of households in these areas was based on their significant involvement and experience in market gardening in the Grand Nokoué region. The total sample size (n = 369) was calculated using Daniel Schwartz’s formula, which has been shown to be effective in a number of research studies [1,51]. This sample was then distributed proportionally to the number of registered vegetable producers in each municipality, based on official statistics provided by the Vegetable Sector Support Project (PADMAR) in June 2023. Equation (1) below shows Schwartz’s formula; let nq be the sample size for market gardening area q.
where Za is the fixed deviation or deviation reduced to a risk of 5% (1.96), corresponding to a 95% confidence interval; d is the margin of error set at 10%; and P is the estimated proportion of market gardening households exposed to climate risks. In the absence of previous data to reliably estimate this proportion, the conservative value of P = 0.5 was used to apply the formula. This choice, in line with methodological recommendations in the literature [51,52,53], maximizes the variance P(1 − P) and thus ensures the sample size is sufficient to guarantee the statistical robustness of the study in an uncertain context. Table 1 shows the distribution of surveyed market gardeners by municipality.

Table 1.
Distribution of market gardeners surveyed by commune.
In order to achieve this sample size, 500 vegetable producers were initially contacted. Of these, 369 agreed to participate and completed the questionnaire, giving an overall response rate of 73.8%. This rate varied slightly by area: 78.2% in Cotonou, 71.5% in Sèmè–Podji, and 68.4% in Ouidah. In accordance with ethical research principles, participation in the survey was based on free, informed, and voluntary consent. Although no strict criteria were defined regarding the socio–economic characteristics of participants, efforts were made with the support of local agricultural advisors to ensure diversity within the sample.
To ensure the quality and efficiency of data collection, the survey form was digitized using the KoboToolbox platform [1] and administered face–to–face by trained interviewers using the ODK Collect mobile application (v2024.3.6) [54,55]. This approach reduced data entry errors, ensured better traceability of responses, and enabled real–time monitoring.
Similarly, three focus groups were conducted, one for each locality. Each group consisted of eight to ten people, including representatives from the women’s and men’s communities. These discussions were used to triangulate individual information.
2.4. Data Processing
The data were exported from the Kobotoolbox platform in CSV format and imported into RStudio v4.4.0 software [56] for purification, which included identifying missing values, verifying data consistency, and converting variables to the correct format (character or factor). The data set consists of 15 variables and 44 modalities. The selected variables were identified from a literature review on climate vulnerability and are based on three interdependent dimensions: (1) exposure to climatic hazards, as reflected by the perceived intensity of the main risks (e.g., floods, droughts, and heat waves); (2) socioeconomic sensitivity, as reflected by demographic characteristics (e.g., age and gender), level of education, locality, and access to water and information; and (3) adaptive capacity, as assessed by farming practices (e.g., irrigation systems and agroecological practices), means of production (e.g., tenure system and area farmed), and financial resources (e.g., access to credit and monthly income). Table 2 below shows the distribution of modalities by variable.
Table 2.
Lists of different variables and associated modalities.
2.5. Data Analysis
To better understand the relationship between vulnerability factors and more precisely draw conclusions on the vulnerability profiles of market gardeners, a multivariate analysis was performed on the data. Multiple component analysis (MCA) and ascending hierarchical analysis (HCA) are exploratory statistical tools that identify the characteristics defining a set of interactions for individuals with more than three variables [57,58]. Multiple correspondence analysis (MCA) facilitated the graphical representation of the main oppositions and associations of characteristics describing vegetable farms. The factorial axes represent groups of variable modalities structuring the analysis. Each axis shows groups of associations and oppositions between modalities. Some modalities are positively correlated with a specific axis, while others are negatively correlated. Analyzing these correlations makes interpreting the nature of these axes possible. Additionally, these axes are distinguished by the percentage of overall inertia of the group of individuals they represent. This makes it possible to evaluate how much information each individual contributes to distinguishing or establishing similarities between them. Thus, we evaluate the relative importance of each group of associations and oppositions of characteristics to understand the disparities between vegetable farms.
2.5.1. Technique for Selecting the Number of Axes to Be Defined
Multiple correspondence analysis (MCA) is characterized by a marked dispersion of eigenvalues. This makes applying the mean inertia threshold automatically tricky because it can lead to either excessive retention of uninformative axes when inertia is moderately dispersed or premature elimination of relevant dimensions when inertia is highly concentrated. Unlike principal component analysis (PCA), where the scree plot often shows a clear break indicating the number of axes to be retained, MCA generally shows no such drop–off. Therefore, there is no universal rule for rigorously determining the optimal number of dimensions to retain [59,60]. In this study, MCA was used to extract 25 dimensions reflecting the complexity of the categorical variables involved. We selected dimensions that highlighted clear, interpretable contrasts in the vulnerability profiles of urban market gardeners to climatic extremes, in line with our research objectives. The first four dimensions were thus selected.
The total inertia is 2.08, with axis 1 explaining 0.3 (13%) of the variation. The cumulative projected inertia indicates that the first four axes explain 37.8% of the observed variation in our sample. Figure 3 shows the cumulative evolution of the variance explained in relation to total inertia.
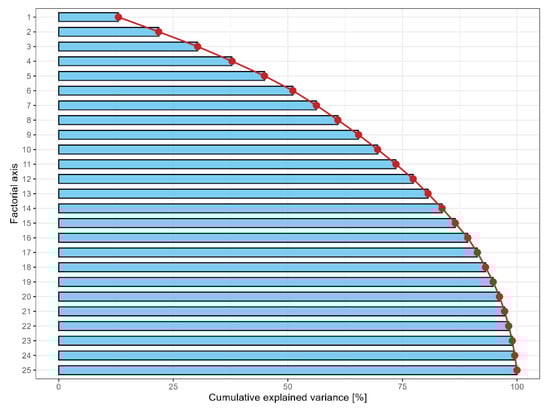
Figure 3.
Cumulative progression of explained variance as a proportion of total inertia.
2.5.2. Selecting and Integrating Additional Variables
Integrating additional variables, also known as illustrative variables, is a significant methodological advance in interpreting the results of factorial analyses, such as multiple correspondence analysis (MCA) [53]. These variables are incorporated into the analysis a posteriori, or after the factorial axes have been constructed. Unlike active variables, which are involved in determining factorial dimensions, additional variables maintain analytical neutrality. In the present study, the goal of projecting the additional variables is to relate the socioeconomic profiles of market gardeners to their level of exposure to climatic hazards without influencing the construction of the axes. The additional variables selected relate to sensitivity to flooding, drought, and heat waves. Each variable is conceptualized as having one of three levels: low, medium, or high. These dimensions do not directly contribute to the construction of the factorial axes but are considered complementary explanatory variables. They identify the market gardening profiles most exposed to these hazards.
2.5.3. Identification of Typological Profiles
In order to identify typological profiles, a hierarchical ascending classification (HAC) was applied to the principal components resulting from the factorial analysis. This classification was carried out using Ward’s method, which minimizes intra–class variance [61]. Distances between individuals were calculated from squared Euclidean distances, while dissimilarity between profiles was based on chi2 distances.
where
- d2(i,j): chi2 distance between individuals i and j.
- fik,fjk: Frequency (or reduced centered values) of k modalities for i and j.
- pk: global proportion of the k–mode.
- k: total number of modalities.
After establishing the clusters, the k–means method was used to confirm their number. A chi–squared test of independence was then used to assess the agreement between the two classification methods. Finally, overrepresentation tests were used to refine the cluster analysis.
3. Results
3.1. Socio–Demographic Characteristics
The study sample comprised 369 urban market gardeners, the majority of whom were located in Sèmè–Podji (41%), followed by Cotonou (36%) and Ouidah (24%). Most participants were male (79%), while females accounted for 21% of the surveyed population. The dominant age group was adults aged 35 to 60 (60%), while younger participants (under 35) accounted for 31% and seniors over 60 comprised 8.9%.
In terms of education, nearly half (46%) had completed secondary education, while 31% had finished primary school. Only 5.1% had reached university level and 8.7% were literate despite having received no formal education; a further 8.7% had received no schooling. In terms of land tenure, the majority (71%) cultivated public land, while 20% operated under rental agreements. A small proportion reported owning the land (6%) or having inherited it (3%). Monthly income was generally low: 42% of respondents earned less than XOF 50,000 and only 21% reported an income between XOF 50,000 and XOF 100,000. Access to credit remained limited, with only 8.7% of participants having received any form of credit. In terms of plot size, 54% of farmers cultivated medium–sized plots (1000–3000 m2), while 34% cultivated small plots (<500 m2). Only 5.7% had access to plots larger than 3000 m2. The most commonly used water sources for irrigation were boreholes (47%), followed by wells (28%) and surface water (25%). The characteristics of the surveyed farmers in terms of their socio–demographic background are presented in Table 3 below.
Table 3.
Socio–demographic characteristics of surveyed farmers.
3.2. Analysis of the Main Climatic Hazards Likely to Affect Market Gardeners
Table 4 illustrates market gardeners’ perspectives in Grand Nokoué regarding their sensitivity to climatic extremes. Analysis of the data reveals that they are considerably exposed to three main risks: flooding, heat waves, and drought conditions. Nearly half of the producers (49%) are highly sensitive to flooding, which underscores the importance of this risk in the urban context examined. Almost a quarter (24%) of vegetable growers are considered highly vulnerable to heat waves, and drought conditions negatively impact 23% of the farming population.
Table 4.
Market gardeners’ perception of their level of sensitivity to climatic extremes.
3.3. Market Gardeners’ Profile
We applied multiple correspondence analysis (MCA) to data collected from urban market gardeners in Grand Nokoué to identify the main patterns of variability within this group. The analysis revealed significant diversity in socio–economic profiles, access to land, and technical practices. The first four factorial dimensions collectively explain 37.8% of the total inertia of the data. In the context of multidimensional qualitative data analysis, this percentage is considered appreciable, reflecting the dimensions’ capacity to synthesize a significant part of the information present in the relationships between variables. Each dimension reveals distinct social, economic, technical, and territorial organizational gradients, enabling us to characterize different groups of market gardeners.
3.3.1. Structuring of Market Gardener Profiles by MCA Factorial Axis Oppositions
Figure 4 shows the factorial axes of the MCA graphically. It can be interpreted as follows.
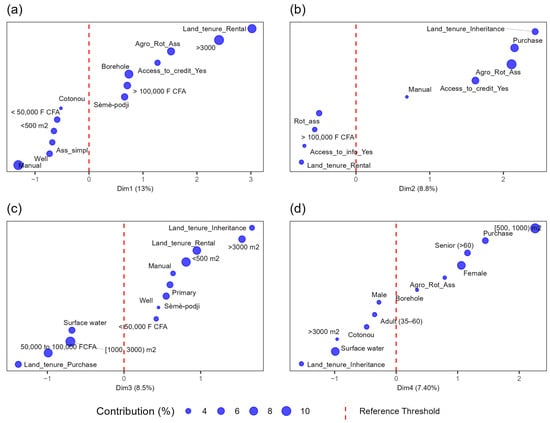
Figure 4.
Oppositions between the most contributing modalities across each factorial axis of the MCA. (a) first axis; (b) second axis; (c) third axis and (d) fourth axis.
The first axis (Figure 4a) alone explains 13% of the total inertia. It reflects the economic and technical structuring of market gardening practices. Based on the modalities that contribute most to this axis, there is an opposition between two profiles of market gardeners. On the one hand are market gardeners with more modern and structured practices. These market gardeners are often squatters or tenants of land (+3.02). They farm more than 3000 m2 (+2.41) and have access to credit (+1.27). They practice agroforestry, association, and crop rotation (+1.52). They have boreholes for irrigation (+0.74) and benefit from monthly incomes in excess of XOF 100,000 (+0.71). This profile is mainly observed in the commune of Sèmè–Podji (+0.66). The other profile is of market gardeners in a more precarious situation. They use manual watering, have traditional wells, cultivate areas of less than 500 m2 (−0.65), have incomes of less than XOF 50,000 (−0.59), and adopt simplified forms of association. Most of these farmers are located in Cotonou (−0.52).
The second axis (Figure 4b) explains 8.8% of the variance and reveals differences in access to resources and land, as well as cultivation practices. On the one hand, market gardeners are characterized by a better economic and land structure. These gardeners practice agroforestry with crop rotation and associations, own their land through purchase or inheritance, and have access to credit. This profile reflects more stable and secure access to resources, which reinforces the capacity to invest in sustainable practices. In contrast, less favorable modalities are found on the other end of the spectrum: monthly incomes exceeding XOF 100,000 (−0.56), tenure by rent (−0.74), access to information (−0.70), and rotational association practices alone (−0.50).
The third dimension (Figure 4c) primarily distinguishes two groups of farmers based on their access to land, income, and plot size. On one hand, there are low–income farmers (50,000 to 100,000 XOF; coordinate = −0.99) who use surface water (−0.68) and occupy acquired land (−1.38). They have medium–sized plots (−1000 to 3000 m2; contribution = 12.16), reflecting a moderate but limited investment strategy. On the other hand, there are producers with large plots of land (>3000 m2; coordinate = +1.54). These producers are often heirs or tenants of the land (inheritance = +1.67; tenancy = +0.95). They also tend to have low incomes (<XOF 50,000; coordinate = +0.42) and use manual or rudimentary irrigation systems (e.g., wells or manual irrigation). This dimension appears to create a gradient of land and productive capital, contrasting more established farmers, who have access to more land resources (inheritance and large surface areas), with farmers in a more unstable situation who invest through purchase but have smaller surface areas.
Figure 4d, the fourth dimension, accounts for 7.5% of total inertia and highlights the gendered and generational structuring of urban market gardeners. This dimension contrasts two operator profiles. The majority are women over the age of 60, cultivating median areas of 500 to 1000 m2. These farmers purchased their land (+1.45), practice integrated cropping systems such as association–rotation–agroforestry (+0.79), and obtain their water supply from boreholes (+0.34). Conversely, the axis groups male farmers (−0.28), primarily adults aged 35–60 (−0.64) who live in Cotonou (−0.48) and have inherited their land (−1.54). These farmers sometimes cultivate large plots of over 3000 m2, use surface water for irrigation, and employ relatively simple cropping practices, particularly association only. These differences reveal diverse trajectories and adaptation strategies influenced by gender, age, land tenure, water resources, and cropping practices.
3.3.2. Analysis of the Relationship Between Market Gardeners’ Profiles and Their Sensitivity to Climatic Extremes
The goal of projecting the additional variables is to relate the market gardeners’ profiles to their perceived sensitivity to climatic hazards without allowing these variables to influence the construction of the axes. This allows us to determine which profiles are most vulnerable to which types of hazards.
Figure 5a shows distinct groupings of the “Drought_High” “Manual” and “Heat_Wave_High” variables in the lower left quadrant of the factorial plane. This proximity suggests a high association; areas or individuals characterized by manual farming practices are more frequently confronted with intense droughts and heat waves. The same grouping includes the <50,000 and Well variables. This proximity reinforces the idea that this profile is often associated with low incomes (less than 50,000 XOF) and dependence on wells for water, characteristics that can exacerbate vulnerability to extreme climatic hazards. At the opposite end of the scale are the “Wave_heat_Low” and “Drought_Low” variables, which are closely associated with “Drilling.” This indicates that having a borehole correlates with lower sensitivity to heat waves and droughts. The proximity of the “motorized” variable to the others reinforces the hypothesis of a more favorable economic situation. Individuals or areas with motorized transportation are likely better equipped to face environmental challenges and invest in infrastructure, such as boreholes.
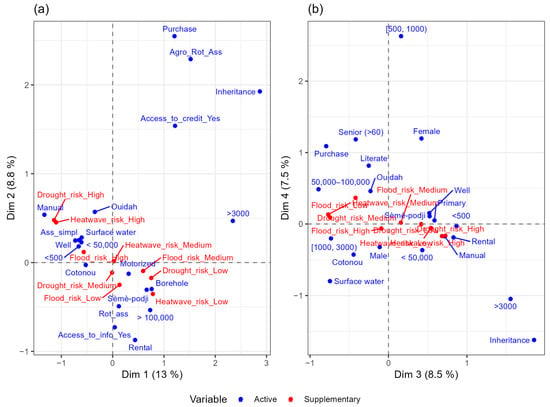
Figure 5.
Graphical representation of MCA results. (a) Representation on the first factorial plane (Dim1 × Dim2) of the 20 most contributing modalities of the active and additional variables. (b) Representation on the second factorial plane (Dim3 × Dim4) of the 20 most contributing modalities of the active and additional variables.
Figure 5b shows a correlation between the Drought_Medium and Heat_Wave_Medium variables and the income categories [1000–3000] and 50,000–100,000. This suggests that farmers with modest incomes or incomes in these ranges appear to be less sensitive to the climatic hazards of drought and medium–intensity heat waves. This relative resilience could be explained by the presence of Agro_Rot_Ass nearby. This indicates that agroforestry, crop rotation, and crop association are effective strategies for reducing vulnerability to these hazards. The “Purchase” variable, which is also close to this group, suggests that land tenure security, achieved through land purchases, could encourage the adoption of these more resilient agroecological practices. Conversely, the “Drought_High” and Heat_wave_High variables are grouped with Primary. This association underscores the heightened vulnerability of farms managed by individuals with limited education (i.e., a primary school education) to droughts and intense heat waves. Furthermore, the proximity of the “Feminine” and “Location” variables to these extreme hazards suggests that being a female farmer and having limited access to land (often through a lease, which implies less security of tenure) negatively impact a farm’s sensitivity to these climatic hazards.
3.4. Categorization of Market Garden Farms
Classification based on the variables retained in the multiple correspondence analysis (MCA) revealed three relatively homogeneous groups of individuals. The optimal solution revealed three clusters comprising 87, 166, and 116 individuals, respectively. These clusters correspond to 23.6%, 45.0%, and 31.4% of the total sample, respectively. The chi–squared test of independence, applied to the cross–tabulation of the AHC and K–means classifications, reveals High agreement between the two methods (p < 0.01), attesting to the robustness of the defined segments. Figure 6 illustrates the typology of the surveyed market gardeners.
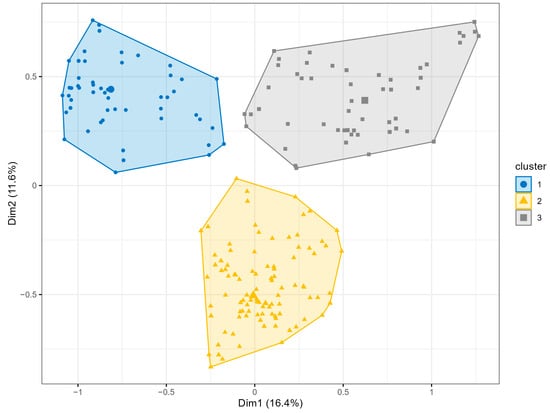
Figure 6.
Typology of market garden farms.
Table 5 presents the results of the description of each group of market gardeners.
Table 5.
Description of each cluster by category.
The first group consists mainly of young (31.03%) and female (38.46%) farmers with very low monthly incomes (XOF 50,000, or 43.23%) who farm small areas (less than 500 m2, or 56.8%) located mainly on public land (29.77%). These farmers use manual irrigation (100%), which is fed mainly by surface water (51.43%). They apply a few agroecological techniques, limiting themselves to simple crop associations (Ass_simpl; 50.88%). This group is located in Cotonou (39.39%) and is highly exposed to the three main climatic hazards. These associations are statistically highly significant (p < 0.01). This cluster represents a group of highly vulnerable farmers.
The second group consists of mostly uneducated farmers (62.5%) with intermediate monthly incomes (85.5% earn between XOF 50,000 and XOF 100,000) and medium–sized plots of land (67.7% are between 1000 and 3000 m2). These market gardeners work on public land (52.29%), use motorized irrigation systems fed by wells (55.52%), and practice crop rotation and crop diversification (59.6%). They are mainly present in Ouidah (70.1%) and Cotonou (58.3%) and are highly exposed to flooding (91.3%). However, they are only moderately sensitive to heat waves and drought (medium perception of 100% and 93.4%, respectively). Despite their technical organization, their insecure land tenure situation and limited human capital may hinder their ability to withstand increasing climate hazards.
The third group is characterized by low exposure to heat waves (96.64%) and drought (88.46%), and medium exposure to flooding (65.66%). It is heavily concentrated in the commune of Semè–Podji (72.67%), where market gardeners mainly farm land inherited (90.91%) or rented (68.92%). Plots are less than 3000 m2 in size (100%), and irrigation relies on motorized systems (38.80%), supplied mainly by boreholes (58.38%). In socio–economic terms, 57.25% of producers have an income of less than XOF 100,000, 34.71% are male, 35.91% are adults (35–60 years), and 50% report having access to credit. In terms of farming practices, 47.06% use agroforestry, rotation, and association (Agro_Rot_Ass).
To test the statistical significance of differences between groups, particularly characteristics overrepresented in Group 1, a comparative table (Table 6) was created.
Table 6.
Intergroup comparison of significantly overrepresented modalities.
Table 6 shows the qualitative variables for which certain categories are significantly more common in group 1 than in groups 2 and 3. All of these modalities are significantly associated with clustering (p < 0.01), as determined by the chi–square test. Notably, there is a high concentration of individuals exposed to high levels of climate stress (e.g., heat waves, droughts and floods), alongside socio–economic characteristics indicating vulnerability, such as having a monthly income of less than XOF 50,000 (76.8%), owning a plot of less than 500 square metres (65.6%) or relying on surface sources for water (96.7%). Furthermore, most of these individuals are located in Cotonou, are under 35 years old and are female. These results confirm the existence of a specific socio–climatic profile for group 1, characterized by exposure to multiple climate hazards combined with limited capacity for structural adaptation.
4. Discussion
The main risks affecting market gardeners in the Grand Nokoué region are flooding, drought, and heat waves. Organizing urban market gardeners into distinct categories highlights the inequitable aspects of their vulnerability and capacity to adapt to climatic threats. These arrangements reflect the social and territorial dynamics of marginalization, far beyond simply representing a variety of personal characteristics. The results reveal that farmers most exposed to adverse climatic conditions exhibit multiple vulnerability factors, such as being female, being young, having a low income, and having limited access to land and essential infrastructure. These characteristics are not random; rather, they reflect an unequal distribution of productive resources, often shaped by power dynamics, gender– and age–related social norms, and less inclusive land policies. These findings corroborate those of [62], which indicate that women market gardeners in Cameroon have limited access to essential resources and are experiencing a decline in income from gardening, which is a crucial element in their household’s livelihood. Results from studies of [63] conducted in Lagos, Nigeria, point in the same direction, indicating that societal and economic factors often hinder women’s ability to prosper in urban agriculture. However, this study goes beyond previous analyses by highlighting the cumulative effect of multiple vulnerability factors. Notably, the results suggest that young women with low incomes and small plots of land are significantly overrepresented in the most vulnerable group. Previous studies have rarely addressed this combination of factors gender, age, land access and income jointly. Vulnerability is as much a question of climate as it is of social position within the economic and spatial systems. These dynamics raise broader questions about urban climate justice and call for targeted, equitable adaptation policies that account for this stratification of vulnerability. Interventions cannot be limited to improving agricultural techniques or infrastructure. They must also include a rethinking of mechanisms for accessing land, credit, and training. This will ensure the effective inclusion of historically marginalized groups in decision–making processes [64,65].
While some farms appear to be exposed to all hazards, such as floods, droughts, and heat waves, others reveal a more targeted vulnerability depending on the type of hazard. The second group (45.0%) is an example of this. Despite improved technical organization, such as motorized irrigation and agro–ecological practices, this group remains highly vulnerable to flooding. This contradiction can probably be explained by the farms’ geographical location, as they are often situated in flood–prone areas due to a lack of available land in urban areas, as highlighted by [24]. This finding confirms that nearly half of all growers (49%) are highly sensitive to flooding. Studies of [66] in Ho Chi Minh City show that urban farmers are gradually being pushed to areas with a high climate risk, often on the outskirts, where available land is most exposed to flooding and water stress. These results underscore the need to better integrate the land dimension into urban adaptation policies to limit vegetable farms’ exposure to areas at high climatic risk.
Market gardeners who rely on manual irrigation or have limited economic resources are particularly vulnerable to extreme temperatures because they cannot easily adjust their work schedule or acquire effective protective equipment. Similarly, droughts impact growers who depend on shallow wells or lack motorized systems more severely, limiting their ability to access water during periods of water stress. These situations demonstrate that resilience depends not only on farming practices but also on water infrastructure quality, land tenure conditions, and farmers’ investment capacity. Investing in infrastructure, such as irrigation systems, is thus essential for adapting to hazards. For example, ref. [67] points out that improving water infrastructure can increase agricultural production and improve adaptation to extreme weather conditions. Furthermore, in small–scale irrigation systems, water storage capacity and access to technical services directly influence farmers’ ability to cope with water shortages and thus condition their level of resilience [68].
It is important to emphasize that adopting good agricultural practices alone is not enough to protect farmers in the long term, particularly when the risks they face are structurally linked to their territory. Market gardeners who apply recommended agroecological techniques or use motorized irrigation systems remain vulnerable if their farms are located in areas that are highly exposed to flooding, drought, or heatwaves. Studies carried out in the Kairouan plain in Tunisia [69] and in the city of Lomé in Togo [70] have shown that farmers operating in areas highly exposed to environmental and climatic risks remain vulnerable, regardless of the irrigation techniques and systems used. Furthermore, more than half of the farmers in group 3 (68.92%, v-test = 7.5, p < 0.001) farm on publicly owned land, which generates high land tenure insecurity as they often farm it without a formal title or written contract.
Ref. [71] highlights the lack of political support, which is largely due to the absence of reliable information on the selection criteria for agricultural production sites in urban areas. However, several studies, such as references [72,73], have shown that farmers are reluctant to invest in sustainable agricultural practices or resilient infrastructures in the absence of guarantees of continuity in the medium or long term. Their vulnerability thus appears to be more linked to institutional and legal insecurity than to a technical deficit. Insecurity of land tenure increases their dependence on local political decisions and the pressures exerted by increasing urbanization, reducing their chances of accessing support mechanisms such as agricultural credit, public subsidies, and land security programs [74,75].
In short, this study emphasizes the complexity and multifaceted nature of climatic vulnerability among urban market gardeners in the Grand Nokoué region. The differentiated profiles identified reveal that exposure to hazards, such as flooding, drought, and heat waves, is closely linked to socioeconomic, technical, and land–related factors. Although some farms have advanced technical organization, their geographical location and insecure land tenure persist as major obstacles to resilience. Furthermore, the analysis shows that adopting good farming practices is insufficient without a favorable material and institutional framework, particularly regarding access to hydraulic infrastructures and land tenure security.
These findings underscore the importance of adopting appropriate measures that consider the diversity of farmers’ profiles and the specific risks they face. To propose targeted, integrated strategies aimed at strengthening the resilience of urban market gardeners, the following recommendations are made:
- ✓
- Integrate urban agriculture into urban and land use planning documents to avoid installation in at–risk areas and reduce land use conflicts.
- ✓
- Establish a system for registering land leases for market gardeners.
- ✓
- Develop differentiated support programs (training, targeted subsidies, and adapted microcredits) that address gender and generational inequalities to strengthen capacity for adaptation.
- ✓
- Deploy local agroclimatic services using accessible channels such as SMS, local radio stations, and relay agents to disseminate climate bulletins that are easy to understand and include practical recommendations on crop choices and resilience practices.
- ✓
- Train young market gardeners and women, who are heavily represented in the vulnerable group, in resilient agricultural practices such as mulching, intercropping, and using drought–tolerant varieties, through climate–smart farmer schools.
Limitations of the Study and Prospects
This study sheds light on the vulnerability profiles of market gardeners in Grand Nokoué, but it does have certain limitations. As data collection was limited to three urban municipalities, the scope of the results is restricted to these areas in Benin. Additionally, important variables such as household size were excluded from the analysis, which may affect the accuracy of interpreting socioeconomic vulnerabilities. Furthermore, the first four axes of the PCA explain only 37.8% of the total variance, reflecting the complexity of the phenomenon under study. To further explore these results, longitudinal surveys could be conducted or a mixed approach combining qualitative and quantitative data could be adopted to better understand how vulnerabilities evolve over time and the diversity of adaptation trajectories.
Despite these limitations, the study provides a solid empirical basis for investigating the varying dynamics of climate vulnerability in urban agricultural areas and highlights the need for further research in other regions and areas of focus.
5. Conclusions
Using multiple correspondence analysis (MCA) and Hierarchical Ascending Classification (HAC) together enabled us to identify three groups of farmers with different levels of climatic vulnerability. Identifying differentiated profiles according to socioeconomic, technical, and spatial characteristics shows that producers’ resilience depends not only on their farming practices but also on structural conditions such as secure land tenure and access to hydraulic infrastructure.
The results underscore the significance of socioeconomic factors (income, gender, and level of education), technical factors (irrigation methods and cultivation practices), and spatial factors (location, access to land, and land tenure status) in shaping vulnerability profiles. The accumulation of constraints, particularly for young women cultivating small areas in at–risk zones, increases their exposure to the effects of climate change and limits their capacity to adapt. In the context of rapid urbanization and climate change, it is crucial to promote differentiated adaptation strategies that build investment capacity, improve infrastructure, secure land tenure, and encourage inclusive local governance. Such measures are vital for ensuring the long–term sustainability of urban market gardening, which is a key sector for food security and the livelihoods of local populations.
To extend the findings of this study, future follow–up surveys could analyze the extent to which climate change adaptation policies produce different effects for the groups identified. This longitudinal approach would enable the equity and effectiveness of interventions to be assessed based on socioeconomic profiles and levels of exposure to hazards.
Author Contributions
Conceptualization, V.V.A.A.; Data curation, V.V.A.A.; Formal analysis, V.V.A.A. and K.K.; Funding acquisition, V.V.A.A.; Investigation, V.V.A.A.; Methodology, V.V.A.A. and K.K.; Resources, V.V.A.A. and K.S.K.; Software, V.V.A.A.; Supervision, K.S.K. and E.W.V.; Validation, K.K.; Visualization, V.V.A.A., D.F.B. and K.K.; Writing—original draft, V.V.A.A. and D.F.B.; Writing—review and editing, V.V.A.A.; Writing—review and editing, D.F.B. All authors have read and agreed to the published version of the manuscript.
Funding
This research was funded by the Regional Center of Excellence on Sustainable Cities in Africa (CERViDA–DOUNEDON), the Association of African Universities (AUA), and the World Bank. This research is funded under grant number IDA 5360 TG.
Institutional Review Board Statement
According to Article 58 of Law No. 2022-07 of June 27, 2022, governing statistical activities in the Republic of Benin, this study did not require prior approval from an ethics committee, as the data collected from vegetable farmers were anonymized and do not allow any direct or indirect identification of respondents. The use of these data is strictly limited to scientific research purposes.
Informed Consent Statement
Informed consent was obtained from all subjects involved in the study.
Data Availability Statement
The original contributions presented in this study are included in the article. Further inquiries can be directed to the corresponding author.
Acknowledgments
The authors would like to thank the Regional Centre of Excellence on Sustainable Cities in Africa (CERViDA–DOUNEDON), the Association of African Universities, and the World Bank Group for the financial support that made this study possible.
Conflicts of Interest
The authors declare that they have no conflicts of interest.
References
- Allarané, N.; Azagoun, V.V.A.; Atchadé, A.J.; Hetcheli, F.; Atela, J. Urban Vulnerability and Adaptation Strategies against Recurrent Climate Risks in Central Africa: Evidence from N’Djaména City (Chad). Urban Sci. 2023, 7, 97. [Google Scholar] [CrossRef]
- Li, X.; Stringer, L.C.; Dallimer, M. The Impacts of Urbanisation and Climate Change on the Urban Thermal Environment in Africa. Climate 2022, 10, 164. [Google Scholar] [CrossRef]
- Ofoezie, E.I.; Eludoyin, A.O.; Udeh, E.B.; Onanuga, M.Y.; Salami, O.O.; Adebayo, A.A. Climate, Urbanization and Environmental Pollution in West Africa. Sustainability 2022, 14, 15602. [Google Scholar] [CrossRef]
- Dölekoğlu, C.Ö.; Gün, S. Urban Agriculture: Search for Agricultural Practice in Urbanized Rural Areas. Turk. J. Agric. Food Sci. Technol. 2017, 5, 1461–1469. [Google Scholar] [CrossRef]
- Schilleci, F.; Giampino, A.; Todaro, V. Forms and Processes of Settlement Pressure on Natural Systems. In Urban Regionalisation Processes; Lo Piccolo, F., Picone, M., Todaro, V., Eds.; UNIPA Springer Series; Springer International Publishing: Cham, Switzerland, 2021; pp. 65–84. ISBN 978-3-030-64468-0. [Google Scholar]
- Preiss, P.V.; Schneider, S.; Marsden, T. Challenges and Perspectives for Food and Agriculture in Urbanized Societies in the 21st Century: An Introduction; Emerald Publishing Ltd.: Leeds, UK, 2022; Volume 26, pp. 1–6. [Google Scholar]
- Abdoulaye, A.-R.; Ramanou, A.Y.M.A. Urban Market–Gardening in Parakou (Republic of Benin): Spatial Dynamics, Food Security, Protection of the Environment and Creation of Employments. J. Geosci. Environ. Prot. 2015, 3, 93–103. [Google Scholar] [CrossRef]
- Céline, A.; Olivia, A.; Joëlle, S.; Michel, V.; Marc, O. Growth of Market Gardening for Local Sales in the Mount Everest Tourist Region of Pharak, Nepal. Rev. Géogr. Alp. 2019, 107-3, 1–17. [Google Scholar] [CrossRef]
- Thiaw, I.; Faye, C.; Dacosta, H.; Dione, D. Market Gardening and the Economy of Urban and Peri–Urban Households in the City of Dakar: Case of the Municipalities of Hann–Bel–Air, Parcelles Assainies, Ouakam and Grand–Yoff. Int. J. Environ. Agric. Biotechnol. 2022, 7, 092–111. [Google Scholar] [CrossRef]
- Knapp, L.; Veen, E.; Renting, H.; Wiskerke, J.S.C.; Groot, J.C.J. Vulnerability Analysis of Urban Agriculture Projects: A Case Study of Community and Entrepreneurial Gardens in the Netherlands and Switzerland. Urban Agric. Reg. Food Syst. 2016, 1, 1–13. [Google Scholar] [CrossRef]
- Mensah, J.K. Urban Agriculture, Local Economic Development and Climate Change: Conceptual Linkages. Int. J. Urban Sustain. Dev. 2023, 15, 141–151. [Google Scholar] [CrossRef]
- Altieri, M.A.; Nicholls, C.I. Agroecología Urbana: Diseño de Granjas Urbanas Ricas En Biodiversidad, Productivas y Resilientes. Agro Sur 2018, 46, 49–60. [Google Scholar] [CrossRef]
- Grafius, D.R.; Edmondson, J.L.; Norton, B.A.; Clark, R.; Mears, M.; Leake, J.R.; Corstanje, R.; Harris, J.A.; Warren, P.H. Estimating Food Production in an Urban Landscape. Sci. Rep. 2020, 10, 5141. [Google Scholar] [CrossRef]
- Eigenbrod, C.; Gruda, N. Urban Vegetable for Food Security in Cities. A Review. Agron. Sustain. Dev. 2015, 35, 483–498. [Google Scholar] [CrossRef]
- Tomatis, F.; Egerer, M.; Correa–Guimaraes, A.; Navas–Gracia, L.M. Urban Gardening in a Changing Climate: A Review of Effects, Responses and Adaptation Capacities for Cities. Agriculture 2023, 13, 502. [Google Scholar] [CrossRef]
- Yanogo, P.I. Rainfall Variability and Changes in Market Gardening Systems: A Case Study in Réo (Mid–West Region of Burkina Faso). Present Environ. Sustain. Dev. 2024, 17, 213–228. [Google Scholar] [CrossRef]
- Calvin, K.; Dasgupta, D.; Krinner, G.; Mukherji, A.; Thorne, P.W.; Trisos, C.; Romero, J.; Aldunce, P.; Barrett, K.; Blanco, G.; et al. IPCC, 2023: Climate Change 2023: Synthesis Report; Intergovernmental Panel on Climate Change (IPCC): Geneva, Switzerland, 2023. [Google Scholar]
- Pizzorni, M.; Innocenti, A.; Tollin, N. Droughts and Floods in a Changing Climate and Implications for Multi–Hazard Urban Planning: A Review. City Environ. Interact. 2024, 24, 100169. [Google Scholar] [CrossRef]
- Van Der Wiel, K.; Bintanja, R. Contribution of Climatic Changes in Mean and Variability to Monthly Temperature and Precipitation Extremes. Commun. Earth Environ. 2021, 2, 1. [Google Scholar] [CrossRef]
- Degefu, M.A.; Kifle, F. Impacts of Climate Variability on the Vegetable Production of Urban Farmers in the Addis Ababa Metropolitan Area: Nexus of Climate–Smart Agricultural Technologies. Clim. Serv. 2024, 33, 100430. [Google Scholar] [CrossRef]
- Nguyen, H.T.M.; Nguyen, B.P.; Ha, A.T.; Tran, V.T. Assessment of Climate Change Vulnerability to Urban Agriculture: A Case Study for the Crops Sector in Hochiminh City, Vietnam. 2023.
- Nofiu, N.; Baharudin, S.A. The Vulnerability of Smallholder Farmers to Flooding, Poverty, and Coping Strategies: A Systematic Review. Mesop. J. Agric. 2024, 52, 1–13. [Google Scholar] [CrossRef]
- Xie, Y.; Hunter, M.; Sorensen, A.; Nogeire-McRae, T.; Murphy, R.; Suraci, J.P.; Lischka, S.; Lark, T.J. U.S. Farmland under Threat of Urbanization: Future Development Scenarios to 2040. Land 2023, 12, 574. [Google Scholar] [CrossRef]
- Graner, A.; Dzamah, A.-F.; Ahovi, K.D.; Tchangani, L.; Michel, I. A Peri–Urban Market–Gardening Territory in Transition in Togo’s Djagblé Floodplain: Towards Agro–Ecological Practices? Acta Hortic. 2022, 1356, 179–190. [Google Scholar] [CrossRef]
- Maiga, Y. Market Gardening Exploitations in the Lowland of Sourgou–Center: Between Variability in Farming Practices, Land Precarity, Spatial Environmental Inequalities, and Producers’ Adaptation Strategies. Cuad. Geogr. 2023, 11, 57–79. [Google Scholar] [CrossRef]
- Marmai, N.; Franco Villoria, M.; Guerzoni, M. How the Black Swan Damages the Harvest: Extreme Weather Events and the Fragility of Agriculture in Developing Countries. PLoS ONE 2022, 17, e0261839. [Google Scholar] [CrossRef]
- Ahouangan, B.S.C.M.; Koura, B.I.; Lesse, A.D.P.; Ahoyo, C.C.; Toyi, S.M.; Vissin, E.W.; Houinato, M.R.B. Typology Analysis and Adaptive Capacity of Commercial Gardening Farmers to Climate Change in Peri–Urban Areas along the Coastal Area of Benin (West Africa). Front. Sustain. Food Syst. 2024, 8, 1356665. [Google Scholar] [CrossRef]
- Kouévi, T.A.; Adé, C.K.; N´Danikou, S.; Mongbo, R.L.; Komlan, C.; Dagnon, G.N.; Djossouvi, C.O.E.A.; Legba, E.C.; Achigan–Dako, E.G. Preferences of Market Gardeners for Traditional Vegetables and Associated Factors in Urban Areas of Southern Benin. Future Food J. Food Agric. Soc. 2023, 11. [Google Scholar] [CrossRef]
- Houessou, M.D.; Van De Louw, M.; Sonneveld, B.G.J.S. What Constraints the Expansion of Urban Agriculture in Benin? Sustainability 2020, 12, 5774. [Google Scholar] [CrossRef]
- Atidegla, S.C.; Koumassi, H.D.; Houssou, E.S. Variabilité Climatique et Production Maraîchère dans la Plaine Inondable d’Ahomey–Gblon au Bénin. Int. J. Biol. Chem. Sci. 2018, 11, 2254. [Google Scholar] [CrossRef][Green Version]
- Babah-Daouda, M.; Yabi, A.J.; Orou Wari, B. Variabilité Climatique et Rendement Maraîcher dans les Communes de Djougou et de Tanguiéta au Nord–Bénin. Int. J. Biol. Chem. Sci. 2022, 15, 1923–1936. [Google Scholar] [CrossRef]
- Azagoun, V.V.A.; Komi, K.; Vissin, E.W.; Klassou, K.S. Analysis of the Dynamics of Hydroclimatic Extremes in Urban Areas: The Case of Grand–Nokoué in Benin, West Africa. Climate 2025, 13, 39. [Google Scholar] [CrossRef]
- Egerer, M.; Lin, B.; Kendal, D. Temperature Variability Differs in Urban Agroecosystems across Two Metropolitan Regions. Climate 2019, 7, 50. [Google Scholar] [CrossRef]
- Intergovernmental Panel on Climate Change (IPCC). Climate Change 2022—Impacts, Adaptation and Vulnerability: Working Group II Contribution to the Sixth Assessment Report of the Intergovernmental Panel on Climate Change, 1st ed.; Cambridge University Press: Cambridge, UK, 2023; ISBN 978-1-00-932584-4. [Google Scholar]
- United Nations. World Urbanization Prospects: The 2024 Revision—Benin Country Profile. Available online: https://population.un.org/wup/countryprofiles?country=Benin (accessed on 2 August 2025).
- Moreau, T.L.; Adams, T.; Mullinix, K.; Fallick, A.; Condon, P.M. Chapter 25 Recommended Practices for Climate–Smart Urban and Peri–Urban Agriculture. In Sustainable Food Planning: Evolving Theory and Practice; Viljoen, A., Ed.; Brill|Wageningen Academic: Wageningen, The Netherlands, 2012; pp. 295–306. ISBN 978-90-8686-826-1. [Google Scholar]
- Apraku, A.; Morton, J.F.; Apraku Gyampoh, B. Climate Change and Small–Scale Agriculture in Africa: Does Indigenous Knowledge Matter? Insights from Kenya and South Africa. Sci. Afr. 2021, 12, e00821. [Google Scholar] [CrossRef]
- Williams, P.A.; Crespo, O.; Abu, M. Assessing Vulnerability of Horticultural Smallholders to Climate Variability in Ghana: Applying the Livelihood Vulnerability Approach. Environ. Dev. Sustain. 2020, 22, 2321–2342. [Google Scholar] [CrossRef]
- Djohy, G.L.; Sounon Bouko, B. Vulnérabilité et Dynamiques Adaptatives des Agropasteurs aux Mutations Climatiques dans la Commune de Tchaourou au Bénin. Rev. Élev. Méd. Vét. Pays Trop. 2021, 74, 27–35. [Google Scholar] [CrossRef]
- Kumbrottil Sundaran, N.; Radhakrishnan, A.; Ravindran, D.; Palackal Bonny, B.; Vijayan Nandini, N. Climate Change and Farmer Livelihoods in Wayanad, India: A Livelihood Vulnerability Index Assessment. Nat. Hazards Earth Syst. Sci. Discuss. 2024, 2024, 1–23. [Google Scholar] [CrossRef]
- Fuchs, S.; Birkmann, J.; Glade, T. Vulnerability Assessment in Natural Hazard and Risk Analysis: Current Approaches and Future Challenges. Nat. Hazards 2012, 64, 1969–1975. [Google Scholar] [CrossRef]
- Nagano, T.; Sekiyama, T. Review of Vulnerability Factors Linking Climate Change and Conflict. Climate 2023, 11, 104. [Google Scholar] [CrossRef]
- Adjatini, A.; Bonou-Gbo, Z.; Boco, A.; Yedomonhan, H.; Dansi, A. Diversité Biologique et Caractérisation de l’Activité de Maraîchage sur le Site de Grand–Popo au Sud Bénin. Int. J. Biol. Chem. Sci. 2020, 13, 2750. [Google Scholar] [CrossRef]
- Dossa, K.F.; Bissonnette, J.-F.; Barrette, N.; Bah, I.; Miassi, Y.E. Projecting Climate Change Impacts on Benin’s Cereal Production by 2050: A SARIMA and PLS–SEM Analysis of FAO Data. Climate 2025, 13, 19. [Google Scholar] [CrossRef]
- Mounirou, I.; Yebou, J. Is Contract Arrangement Source of Income Gain among Parboiled Rice Stakeholders in Benin? A Doubly Robust Analysis. Heliyon 2023, 9, e19121. [Google Scholar] [CrossRef]
- Sultan, B.; Bossa, A.Y.; Salack, S.; Sanon, M. Introduction Générale. In Risques Climatiques et Agriculture en Afrique de l’Ouest; Sultan, B., Bossa, A.Y., Salack, S., Sanon, M., Eds.; IRD Éditions: Paris, France, 2020; pp. 11–14. ISBN 978-2-7099-2820-5. [Google Scholar]
- Papathoma-Köhle, M.; Thaler, T.; Fuchs, S. An Institutional Approach to Vulnerability: Evidence from Natural Hazard Management in Europe. Environ. Res. Lett. 2021, 16, 044056. [Google Scholar] [CrossRef]
- Halkos, G.; Skouloudis, A.; Malesios, C.; Jones, N. A Hierarchical Multilevel Approach in Assessing Factors Explaining Country–Level Climate Change Vulnerability. Sustainability 2020, 12, 4438. [Google Scholar] [CrossRef]
- INSAE. Résultats Provisoires du RGPH 4; MDAEP—Ministère du Développement, de l’Analyse Économique et de la Prospective: Cotonou, Bénin, 2013; p. 8. [Google Scholar]
- Report Value Chain Maraichage Benin FINALE.Pdf. Available online: https://agritrop.cirad.fr/596364/1/Report%20Value%20Chain%20maraichage%20Benin%20FINALE.pdf (accessed on 22 January 2023).
- Garren, S.T.; Cleathero, B.A. Assessment of Required Sample Sizes for Estimating Proportions. Asian J. Probab. Stat. 2024, 26, 48–56. [Google Scholar] [CrossRef]
- Chander, N. Sample Size Estimation. J. Indian Prosthodont. Soc. 2017, 17, 217. [Google Scholar] [CrossRef] [PubMed]
- Patel, D. Sample Size Estimation in Clinical Trials. Natl. J. Community Med. 2024, 15, 503–508. [Google Scholar] [CrossRef]
- Sztabiński, P.B. The Use of Face–to–Face Interviews in Mixed Mode Design: The Problem of the Achieved Sample. Clov. Spoločnosť 2019, 22, 1–28. [Google Scholar] [CrossRef]
- Muszyński, M.; Jabkowski, P. What Can Interviewer–Collected Paradata Tell About Measurement Quality in Face–to–Face Surveys? Analyzing Response Styles in Six Rounds of the European Social Survey. 2023. Available online: https://osf.io/preprints/psyarxiv/byz45_v1 (accessed on 1 August 2025).
- R Core Team. R: A Language and Environment for Statistical Computing; R Foundation for Statistical Computing: Vienna, Austria, 2023. [Google Scholar]
- Baccar, M.; Bouaziz, A.; Dugué, P.; Gafsi, M.; Le Gal, P.-Y. Sustainability Viewed from Farmers’ Perspectives in a Resource–Constrained Environment. Sustainability 2020, 12, 8671. [Google Scholar] [CrossRef]
- Baki, C.B.; Wellens, J.; Traoré, F.; Palé, S.; Djaby, B.; Bambara, A.; Thao, N.T.T.; Hié, M.; Tychon, B. Assessment of Hydro–Agricultural Infrastructures in Burkina Faso by Using Multiple Correspondence Analysis Approach. Sustainability 2022, 14, 13303. [Google Scholar] [CrossRef]
- Ruggeri, G.; Mazzocchi, C.; Corsi, S. Urban Gardeners’ Motivations in a Metropolitan City: The Case of Milan. Sustainability 2016, 8, 1099. [Google Scholar] [CrossRef]
- Achim, A. Testing the Number of Required Dimensions in Exploratory Factor Analysis. Quant. Methods Psychol. 2017, 13, 64–74. [Google Scholar] [CrossRef]
- Kiliç, A.F. Deciding the Number of Dimensions in Explanatory Factor Analysis: A Brief Overview of the Methods. Pamukkale Univ. J. Soc. Sci. Inst. 2022, 51, 305–318. [Google Scholar] [CrossRef]
- Ngome, I.; Foeken, D. “My Garden Is a Great Help”: Gender and Urban Gardening in Buea, Cameroon. GeoJournal 2012, 77, 103–118. [Google Scholar] [CrossRef]
- Blessing, O.D. Challenges Encountered by Urban Women Farmers in Their Agricultural Activities. Agric. Ext. J. 2019, 3. [Google Scholar] [CrossRef]
- Azam-Ali, S.; Ahmadzai, H.; Choudhury, D.; Goh, E.V.; Jahanshiri, E.; Mabhaudhi, T.; Meschinelli, A.; Modi, A.T.; Nhamo, N.; Olutayo, A. Marginal Areas and Indigenous People Priorities for Research and Action. In Science and Innovations for Food Systems Transformation; Springer International Publishing: Cham, Switzerland, 2023; pp. 261–279. ISBN 978-3-031-15702-8. [Google Scholar]
- Leite, S.P.; Ávila, R.V.D. Reforma Agrária e Desenvolvimento na América Latina: Rompendo com o Reducionismo das Abordagens Economicistas. Rev. Econ. Sociol. Rural. 2007, 45, 777–805. [Google Scholar] [CrossRef]
- Tuan, N.T.; Hegedűs, G.; Phuong, N.T.T. Urbanization and Forecast Possibilities of Land Use Changes by 2050: New Evidence in Ho Chi Minh City, Vietnam. Open Agric. 2025, 10, 20250421. [Google Scholar] [CrossRef]
- Li, J.; Zhang, C.; Huang, Q.; Ding, M.; He, Y.; Liu, M.; Yang, C. Water Infrastructure Impacts of Agricultural Industry in China under Extreme Weather: A System Dynamics Model of a Multi–Level, Climate Resilience Perspective. Systems 2024, 12, 562. [Google Scholar] [CrossRef]
- Wijekoon, W.M.S.M.; Gunawardena, E.R.N.; Aheeyar, M.M.M.; De Silva, W.P.R.P. Resilience of Farmers at Water Shortage Situations in Minor Irrigation Systems: A Case Study in Kurunegala District, Sri Lanka. Trop. Agric. Res. 2018, 29, 242. [Google Scholar] [CrossRef]
- Akakpo, K.; Leauthaud, C.; Ben Aissa, N.; Bouarfa, S.; Bahri, A. In the Search for Innovative Agroecological Farming Practices in Irrigated Landscapes of North Africa: Case of Kairouan Plain in Central Tunisia. 2018, PS-7.3-03. Available online: https://agritrop.cirad.fr/588924/ (accessed on 8 July 2025).
- Kanda, M.; Wala, K.; Batawila, K.; Djaneye-Boundjou, G.; Ahanchede, A.; Akpagana, K. Le Maraîchage Périurbain à Lomé: Pratiques Culturales, Risques Sanitaires et Dynamiques Spatiales. Cah. Agric. 2009, 18, 356–363. [Google Scholar] [CrossRef]
- Sonneveld, B.G.J.S.; Houessou, M.D.; Van Den Boom, G.J.M.; Aoudji, A. Where Do I Allocate My Urban Allotment Gardens? Development of a Site Selection Tool for Three Cities in Benin. Land 2021, 10, 318. [Google Scholar] [CrossRef]
- Nair, R.; Barche, S. Protected Cultivation of Vegetables—Present Status and Future Prospects in India. Indian J. Appl. Res. 2011, 4, 245–247. [Google Scholar] [CrossRef]
- Yanore, L.; Sok, J.; Oude Lansink, A. Do Dutch Farmers Invest in Expansion despite Increased Policy Uncertainty? A Participatory Bayesian Network Approach. Agribusiness 2024, 40, 93–115. [Google Scholar] [CrossRef]
- Ekpodessi, S.G.N.; Nakamura, H. Impact of Insecure Land Tenure on Sustainable Agricultural Development: A Case Study of Agricultural Lands in the Republic of Benin, West Africa. Sustainability 2022, 14, 14041. [Google Scholar] [CrossRef]
- Kousar, R. Secured Land Rights, Household Welfare and Agricultural Productivity: Evidence from Rural Pakistan. Pak. J. Agric. Sci. 2018, 55, 243–247. [Google Scholar] [CrossRef]
Disclaimer/Publisher’s Note: The statements, opinions and data contained in all publications are solely those of the individual author(s) and contributor(s) and not of MDPI and/or the editor(s). MDPI and/or the editor(s) disclaim responsibility for any injury to people or property resulting from any ideas, methods, instructions or products referred to in the content. |
© 2025 by the authors. Licensee MDPI, Basel, Switzerland. This article is an open access article distributed under the terms and conditions of the Creative Commons Attribution (CC BY) license (https://creativecommons.org/licenses/by/4.0/).