
Assessment of Large Forest Fires in the Canary Islands and Their Relationship with Subsidence Thermal Inversion and Atmospheric Conditions


Abstract
1. Introduction
2. Materials and Methods
3. Results
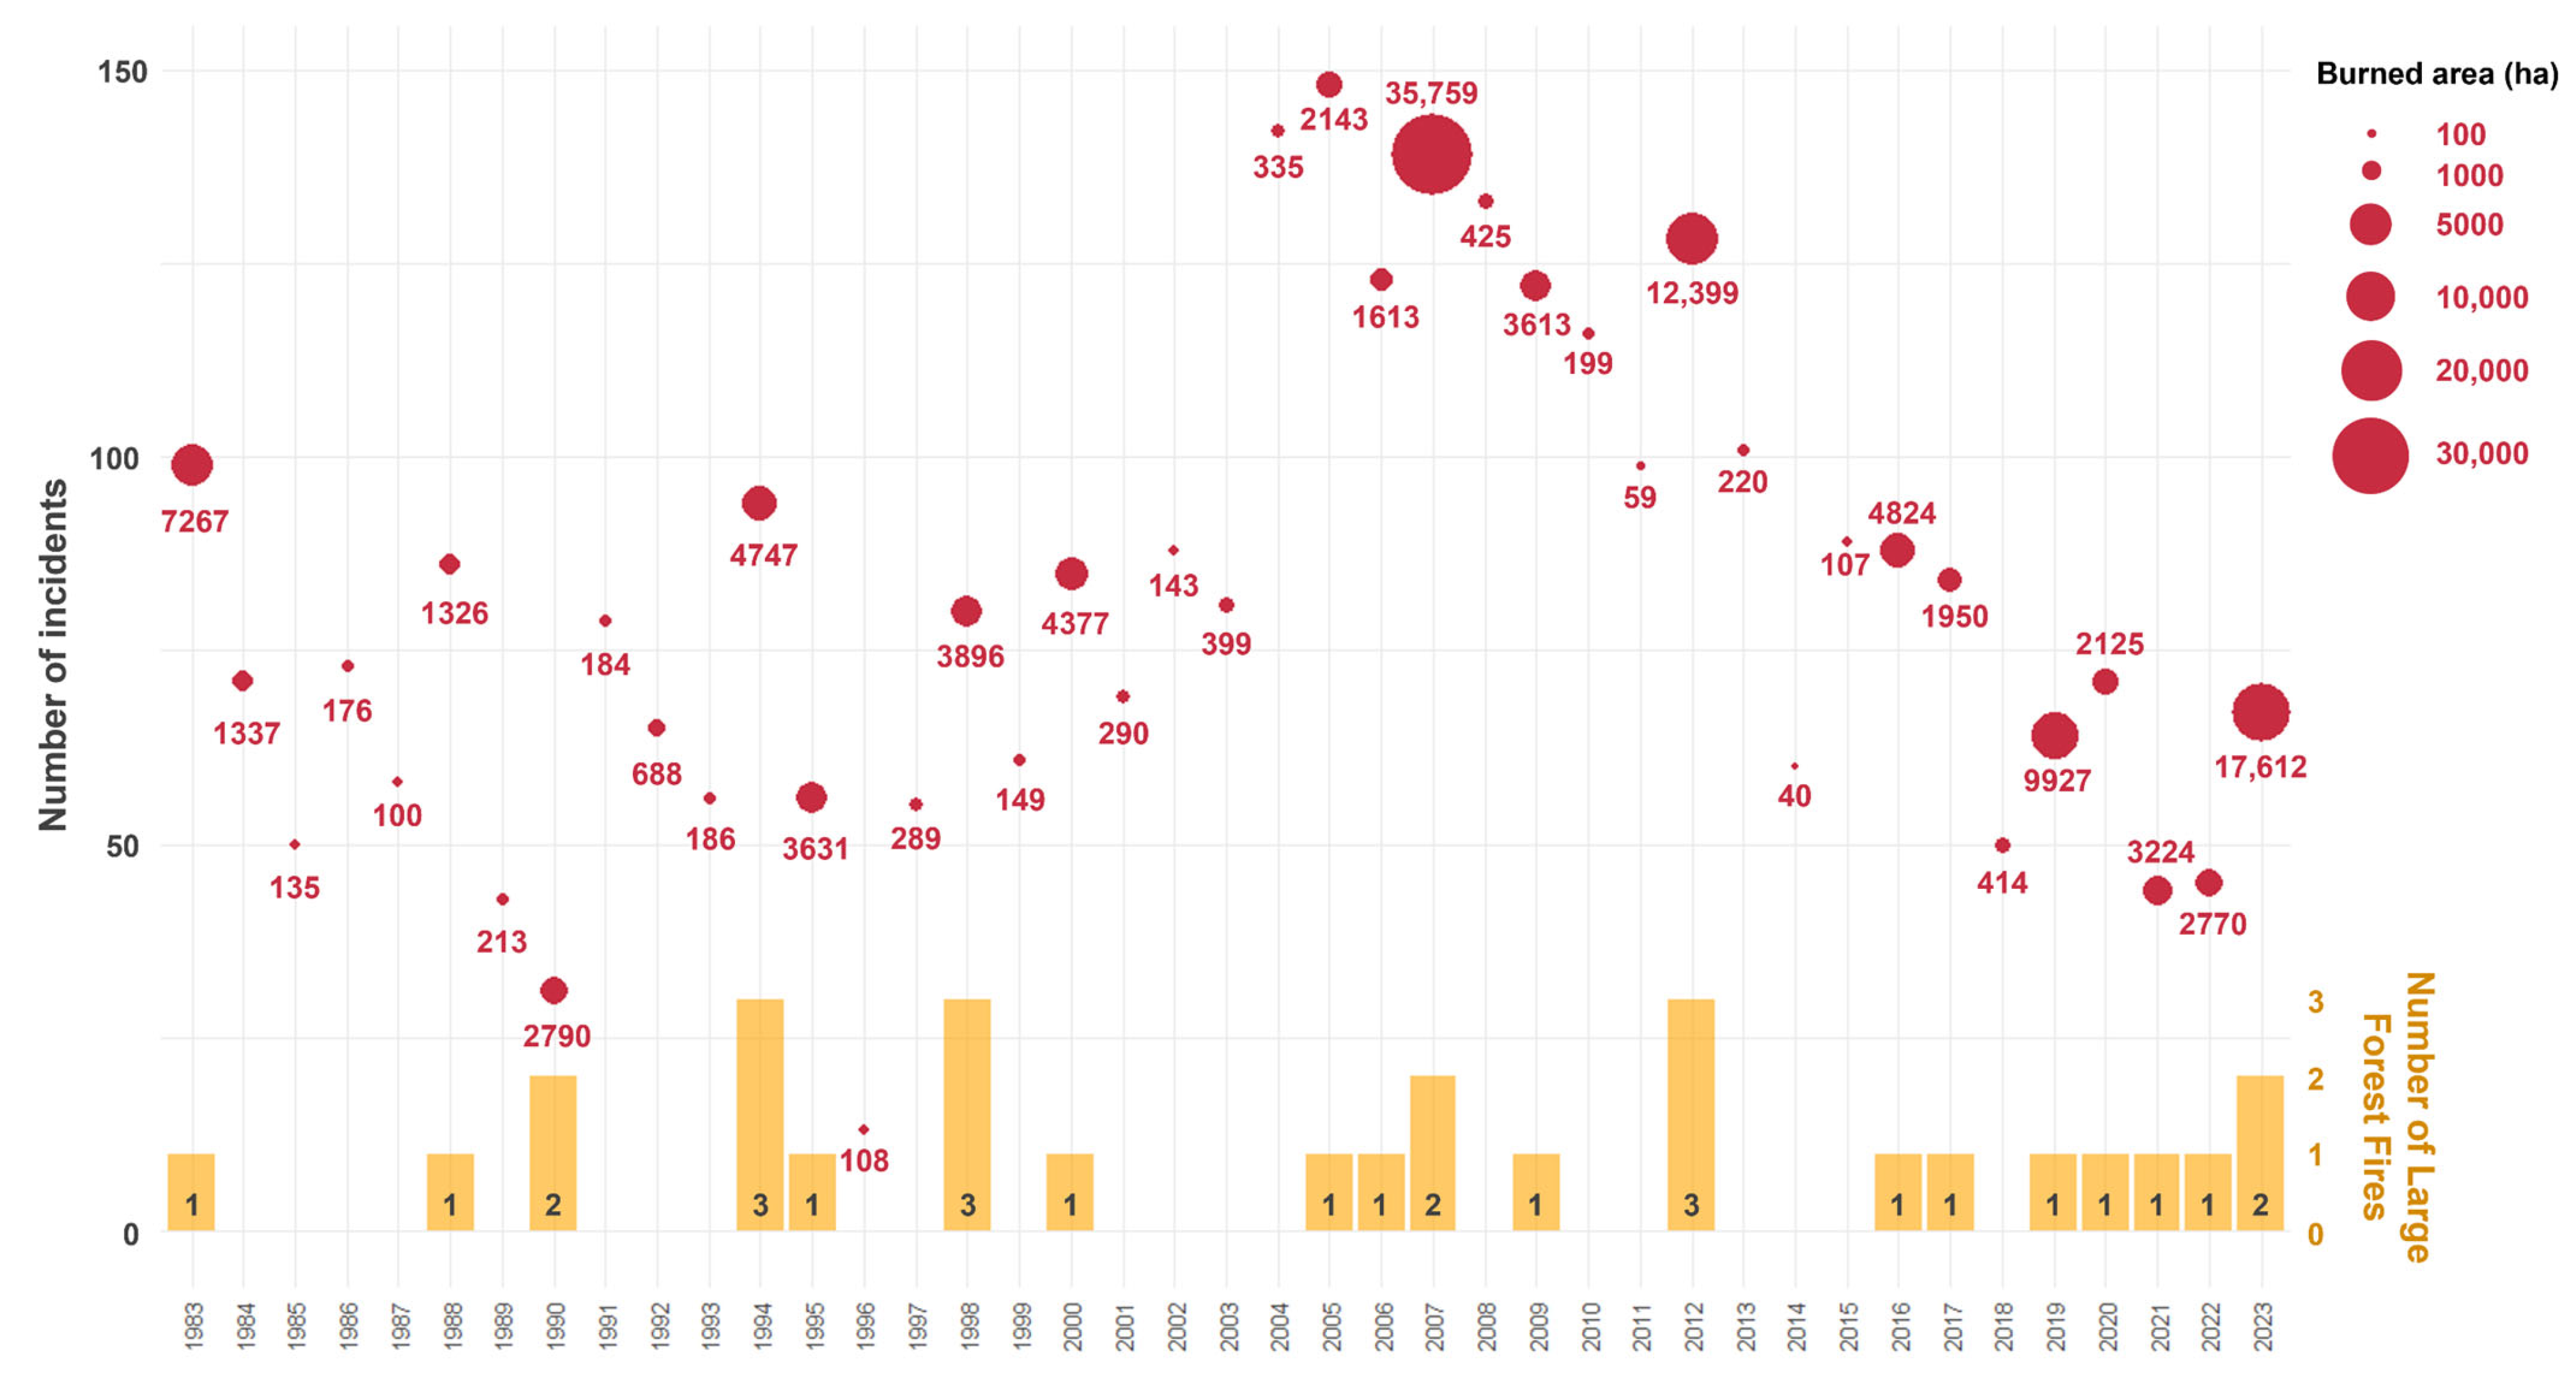
3.1. Large Forest Fires in the Canary Islands (1983–2023)
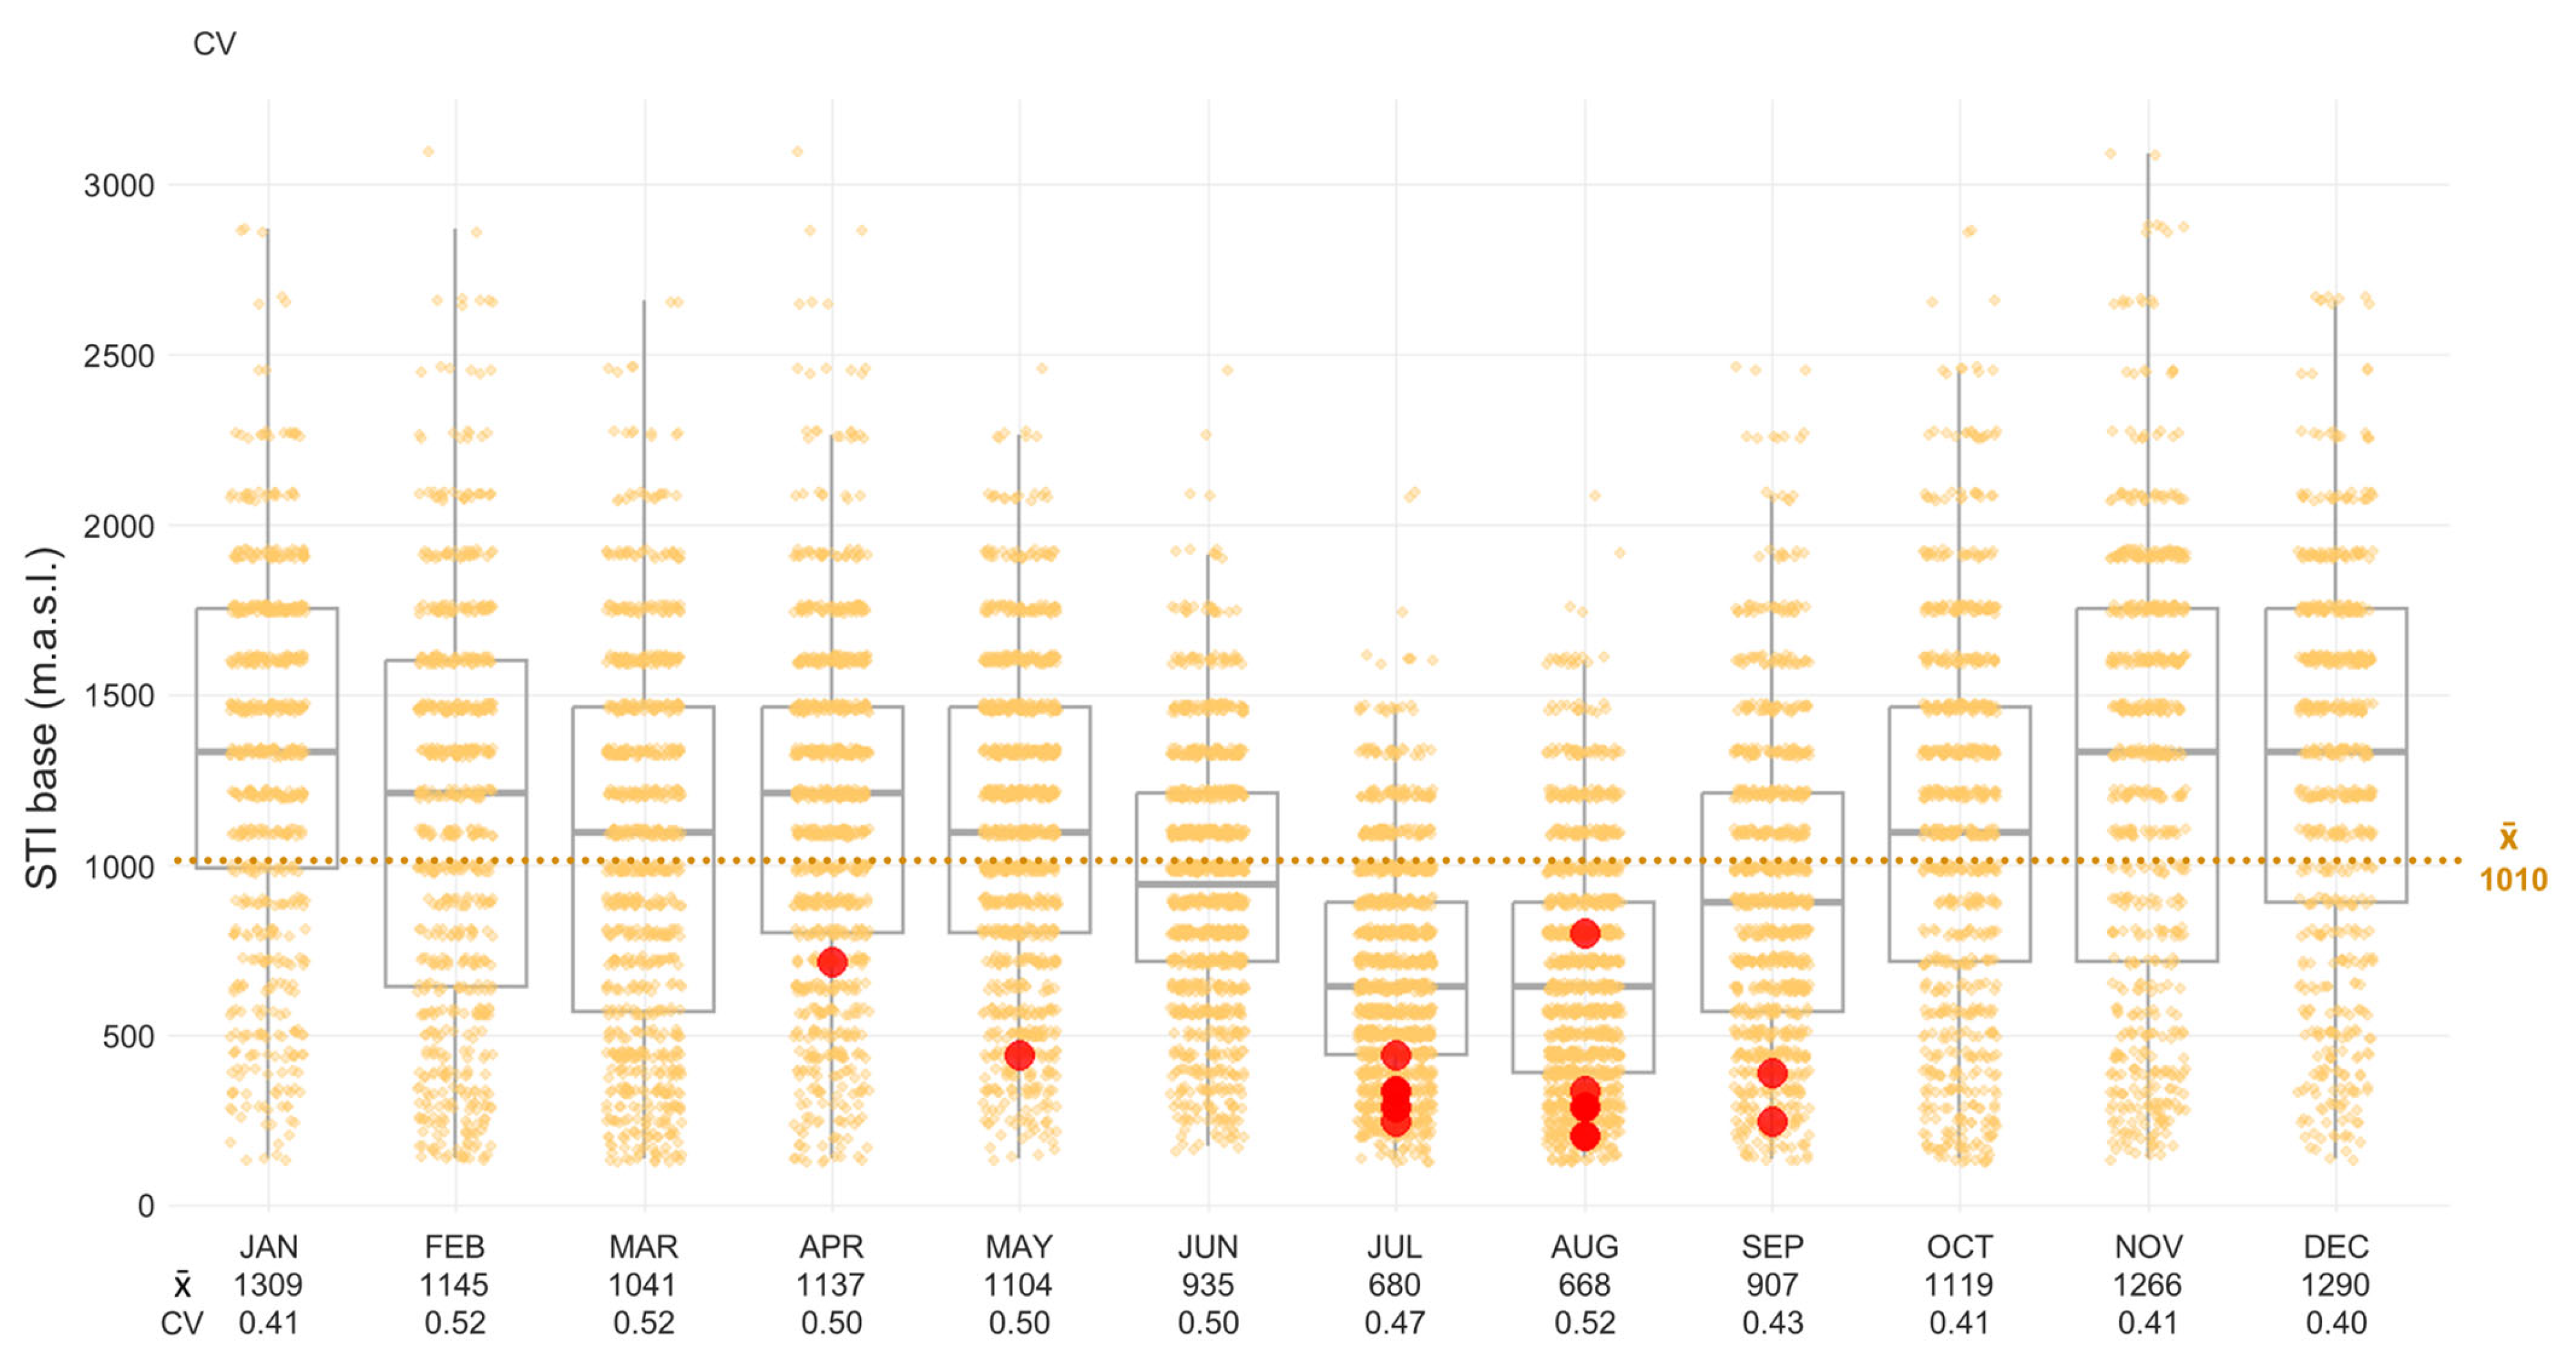
3.2. Subsidence Thermal Inversion
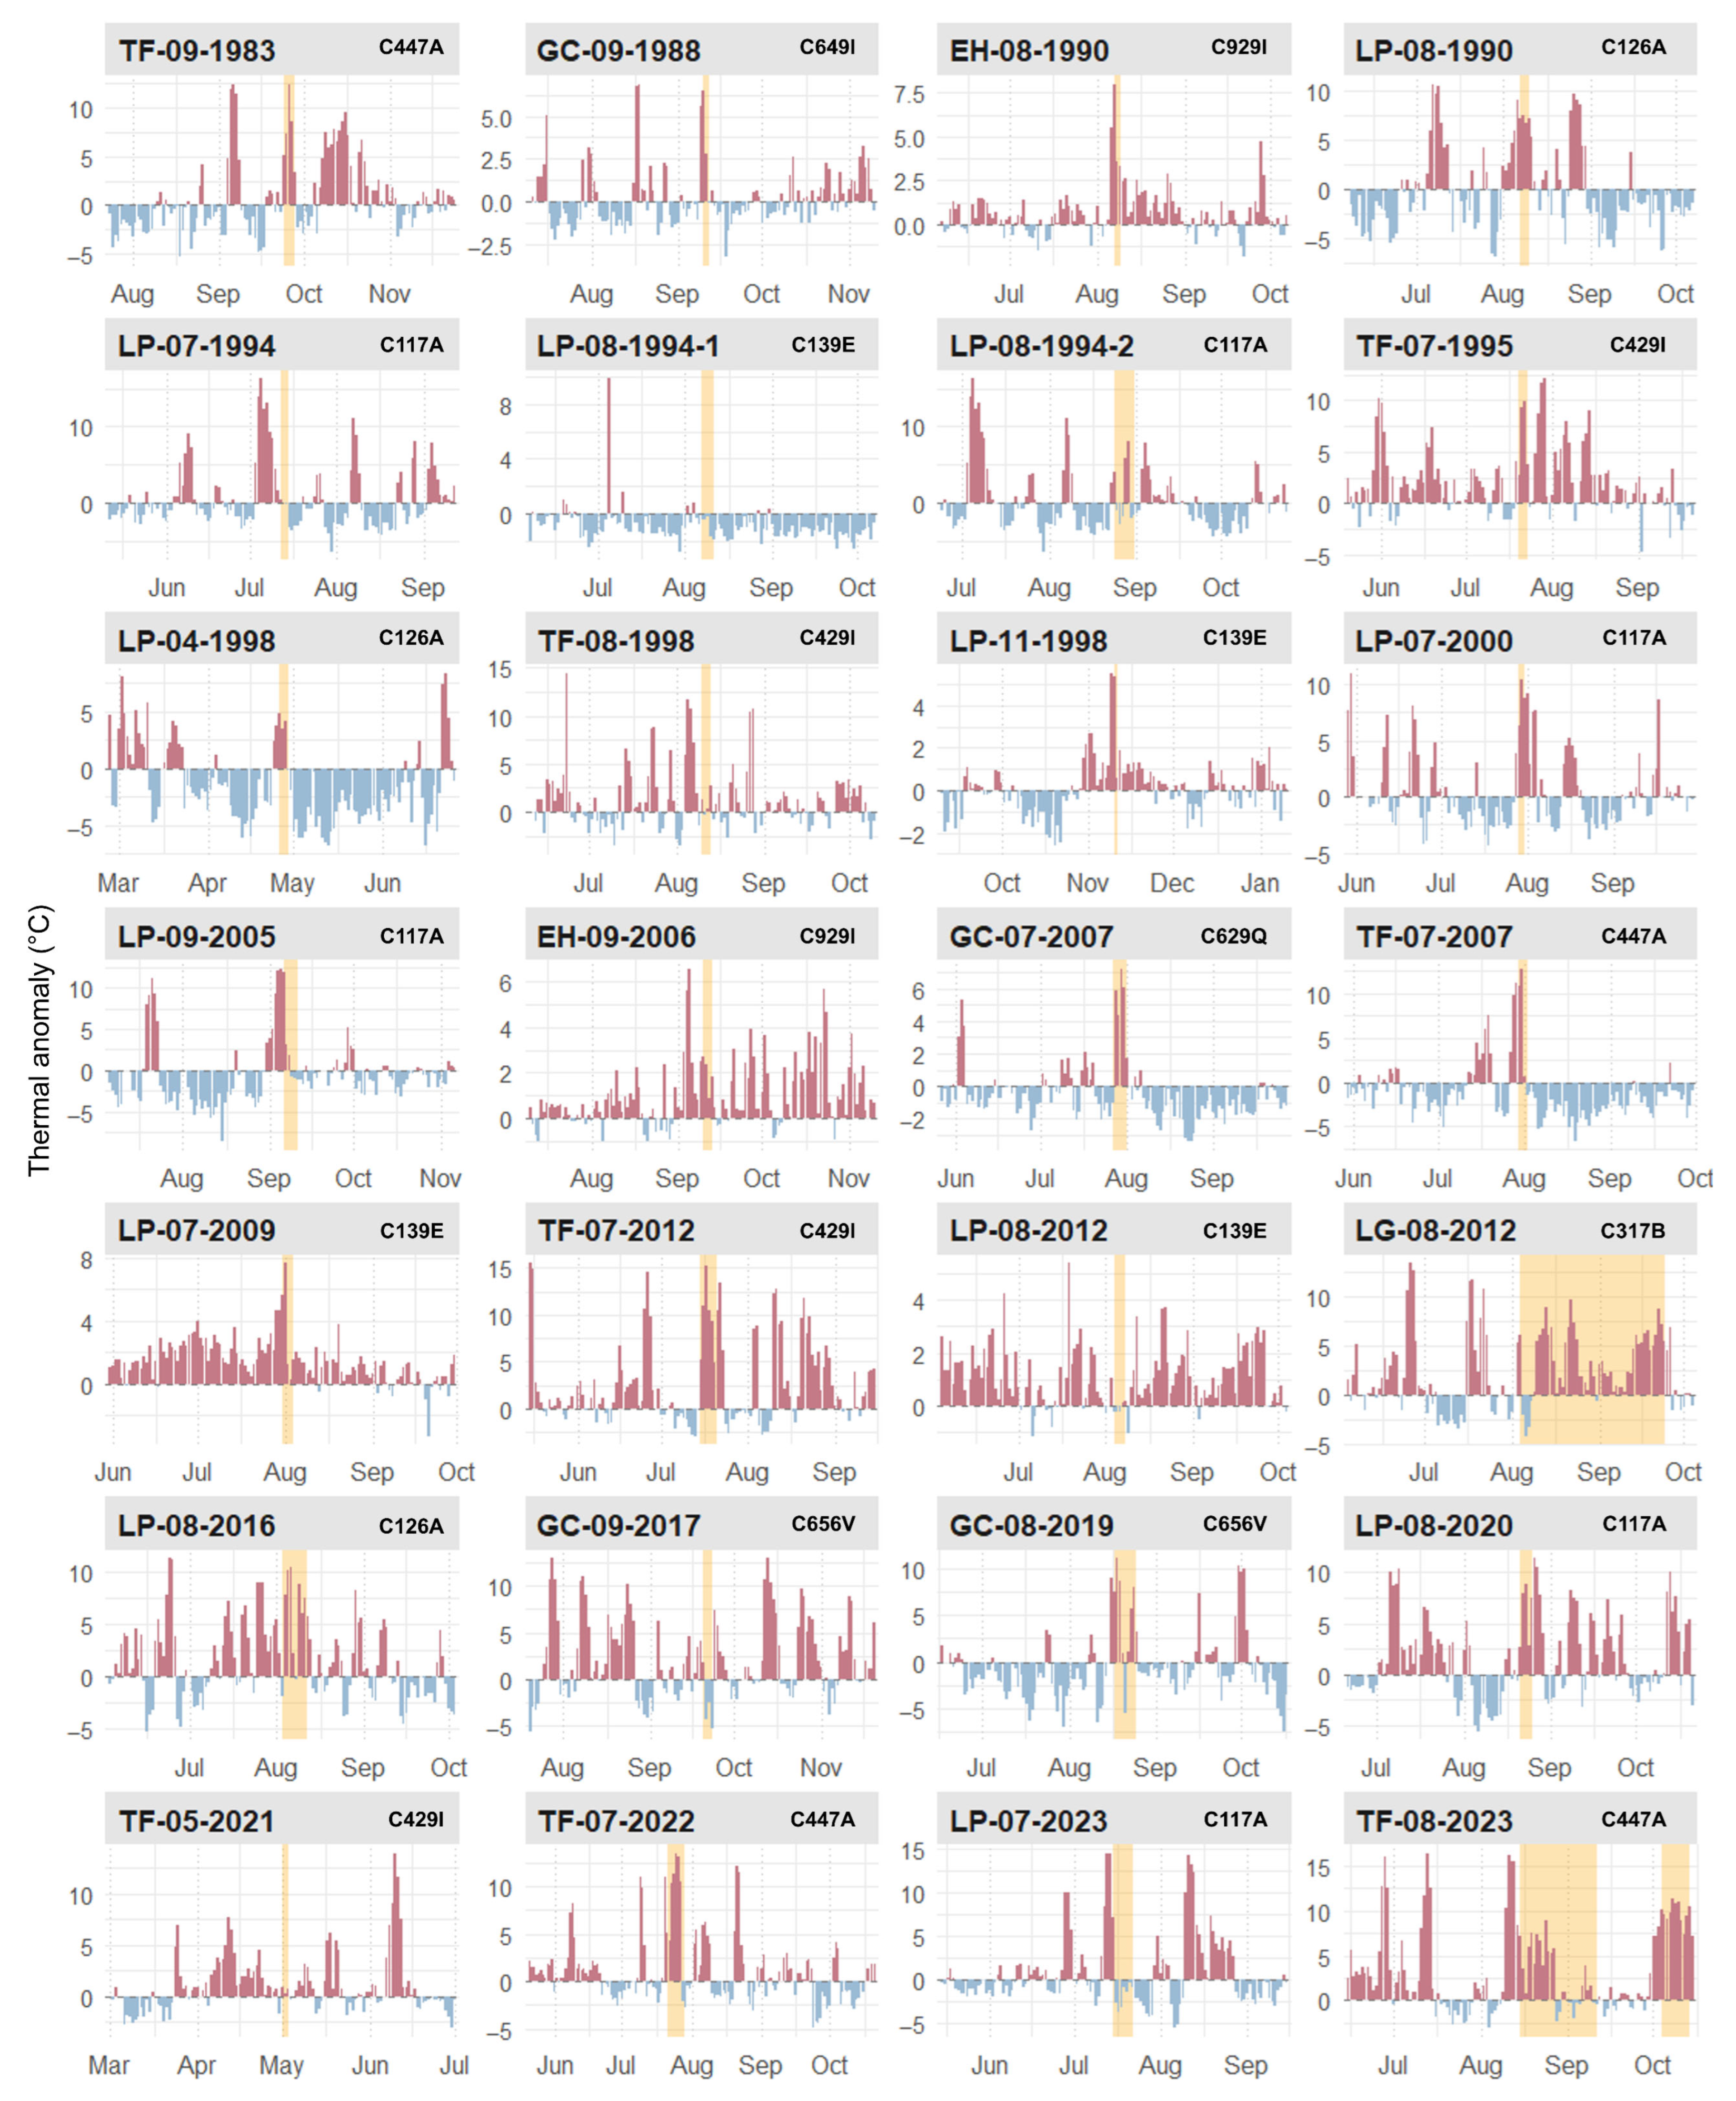
3.3. Temperature
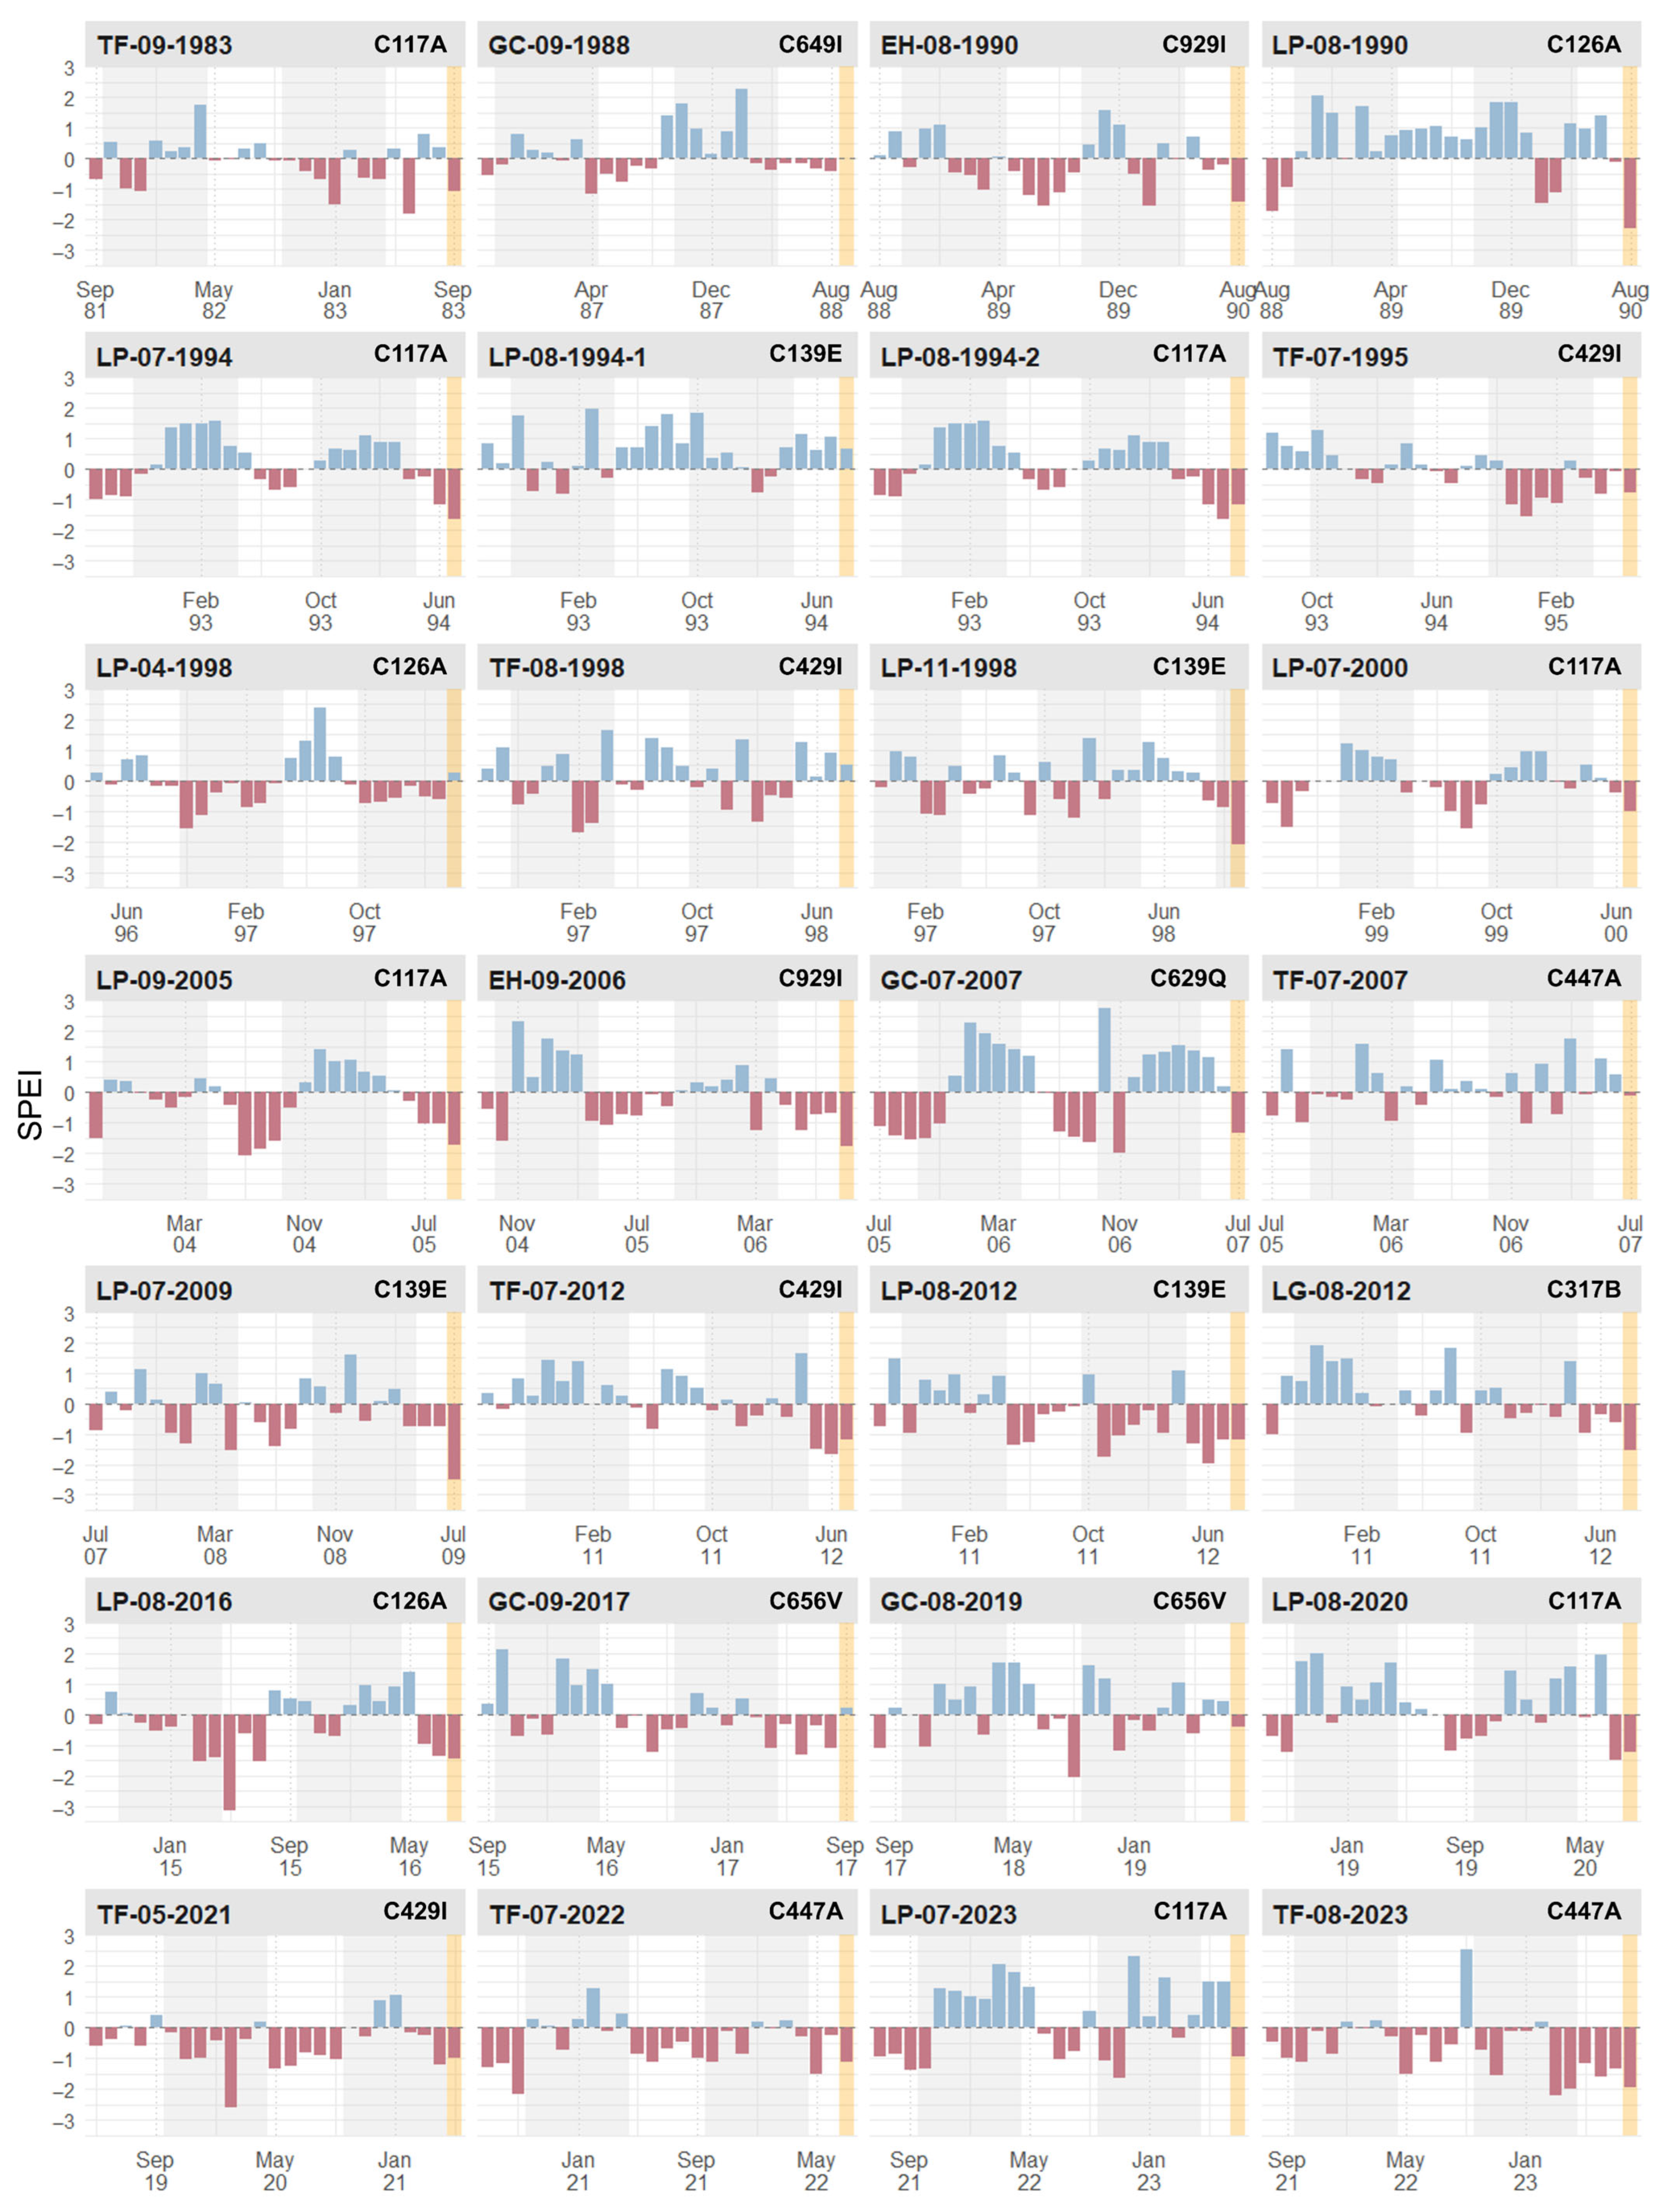
3.4. Precipitation
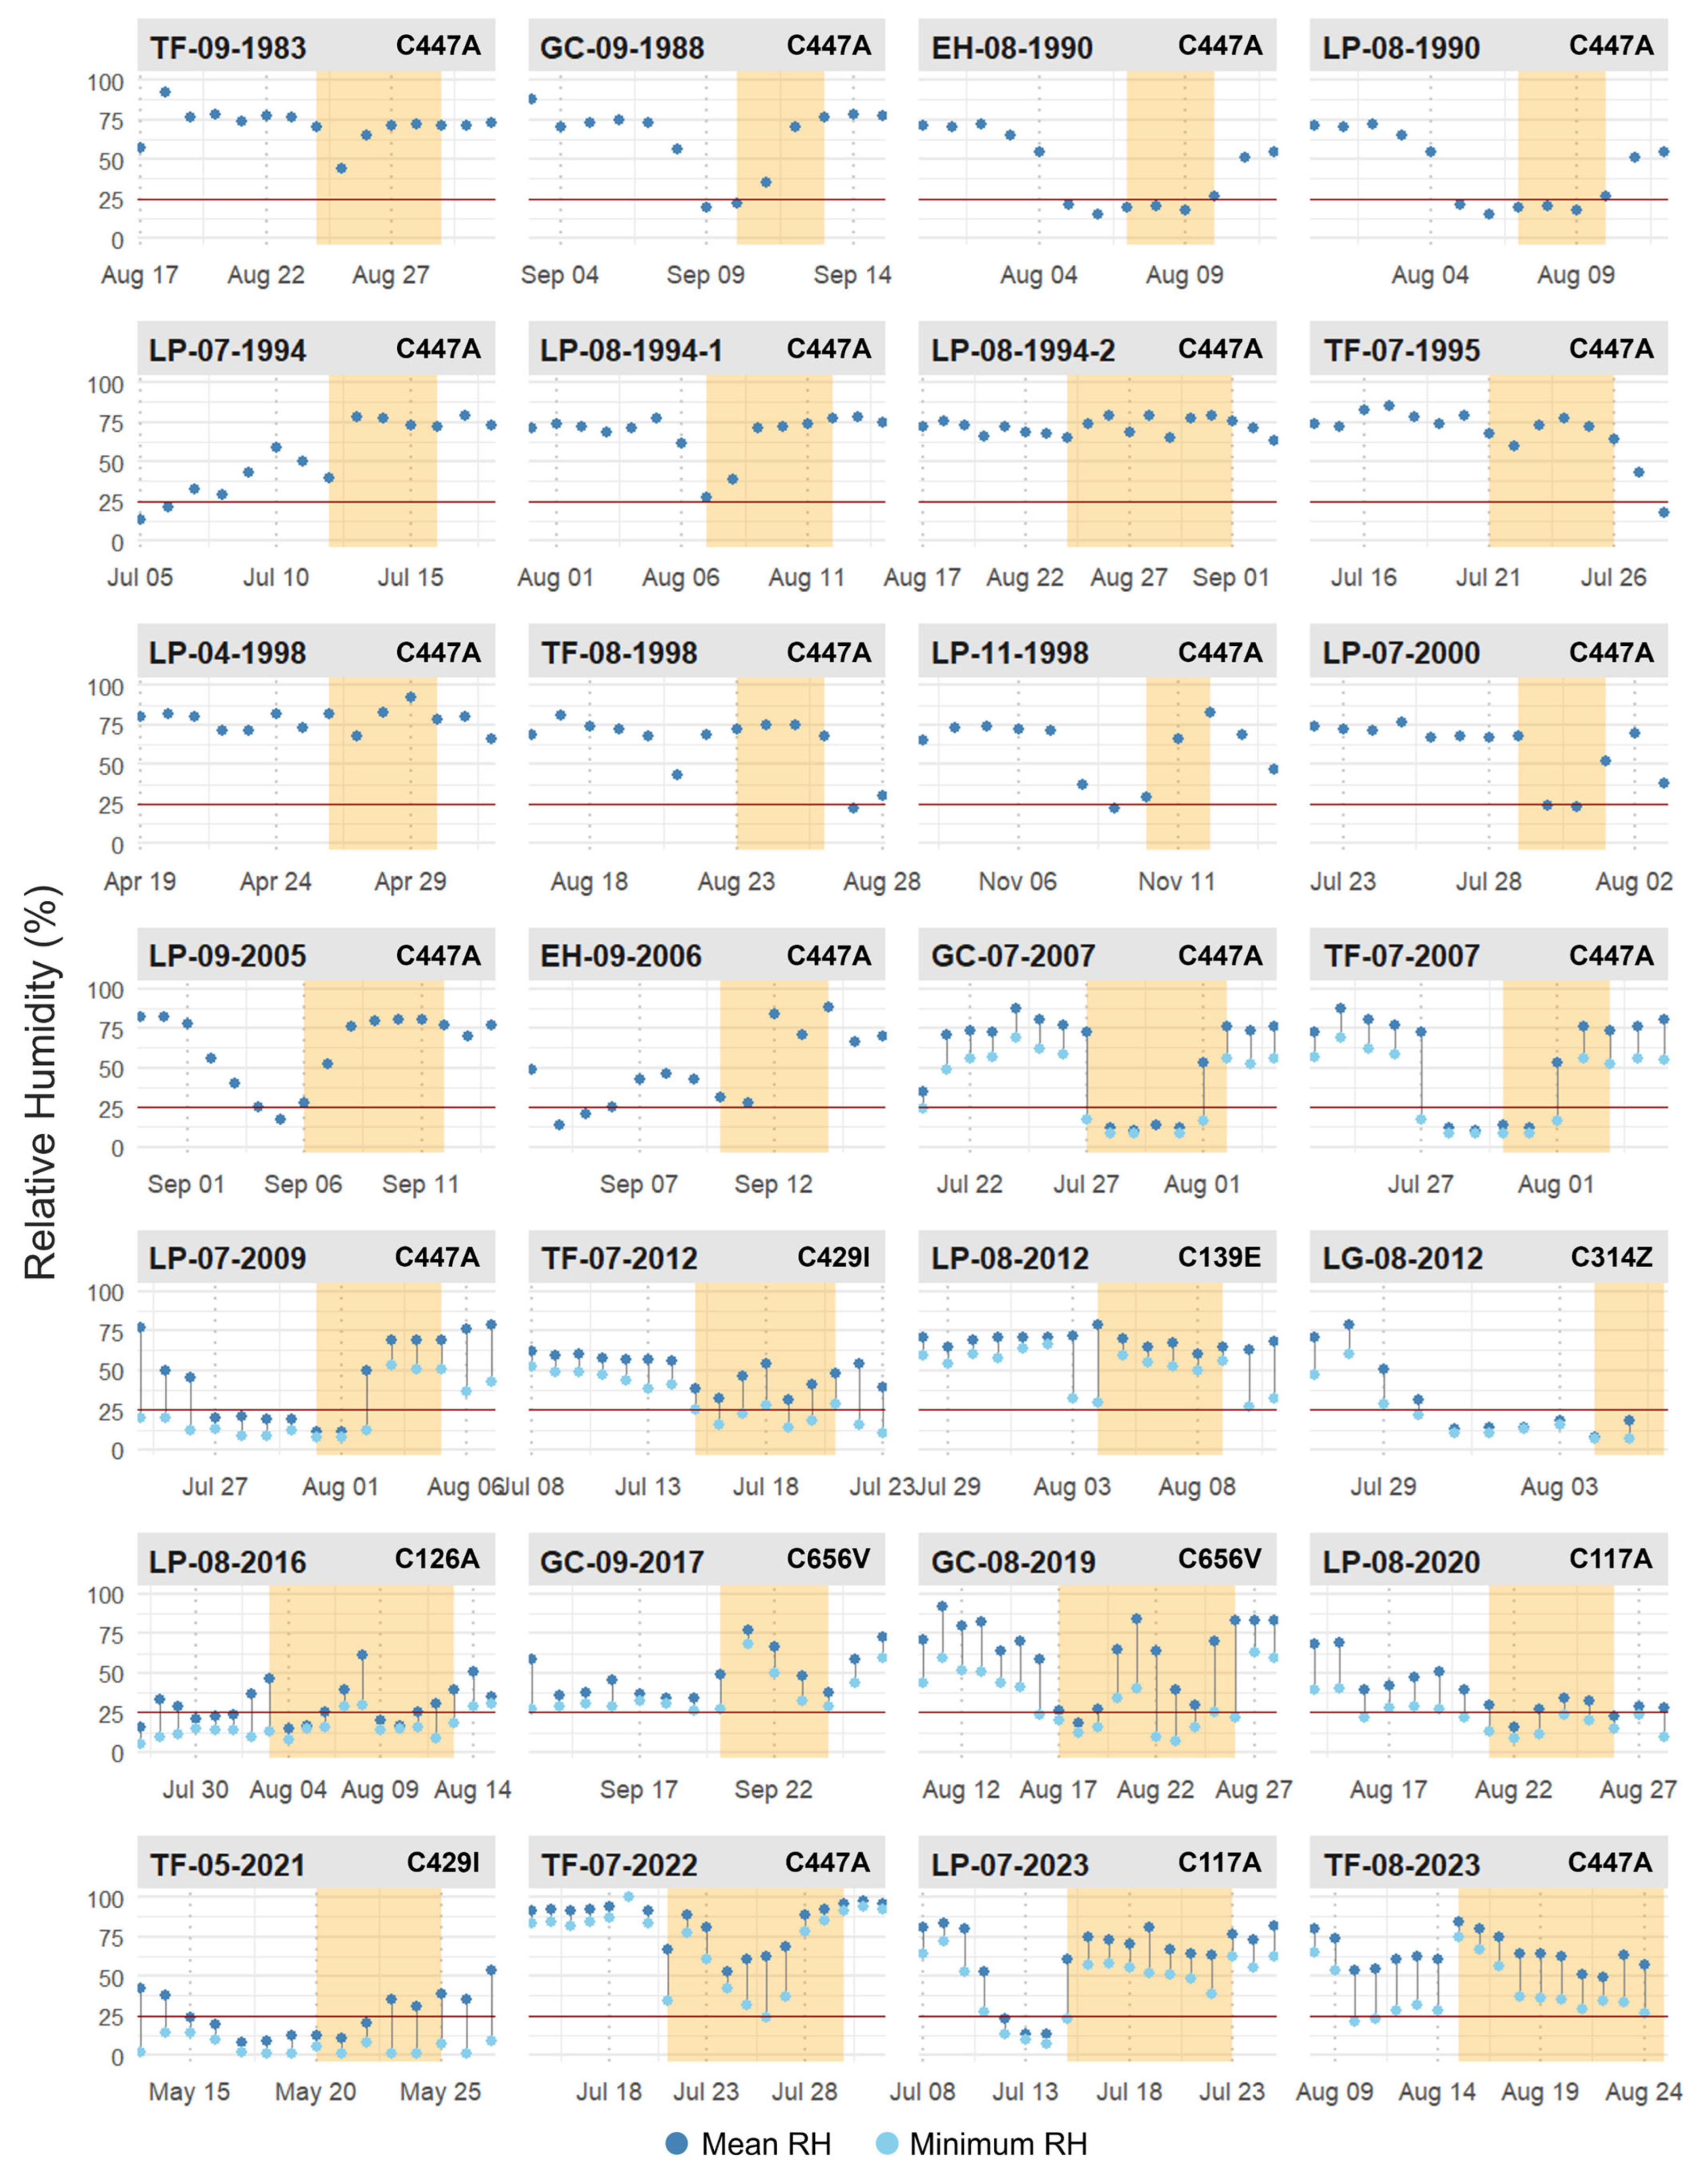
3.5. Relative Humidity
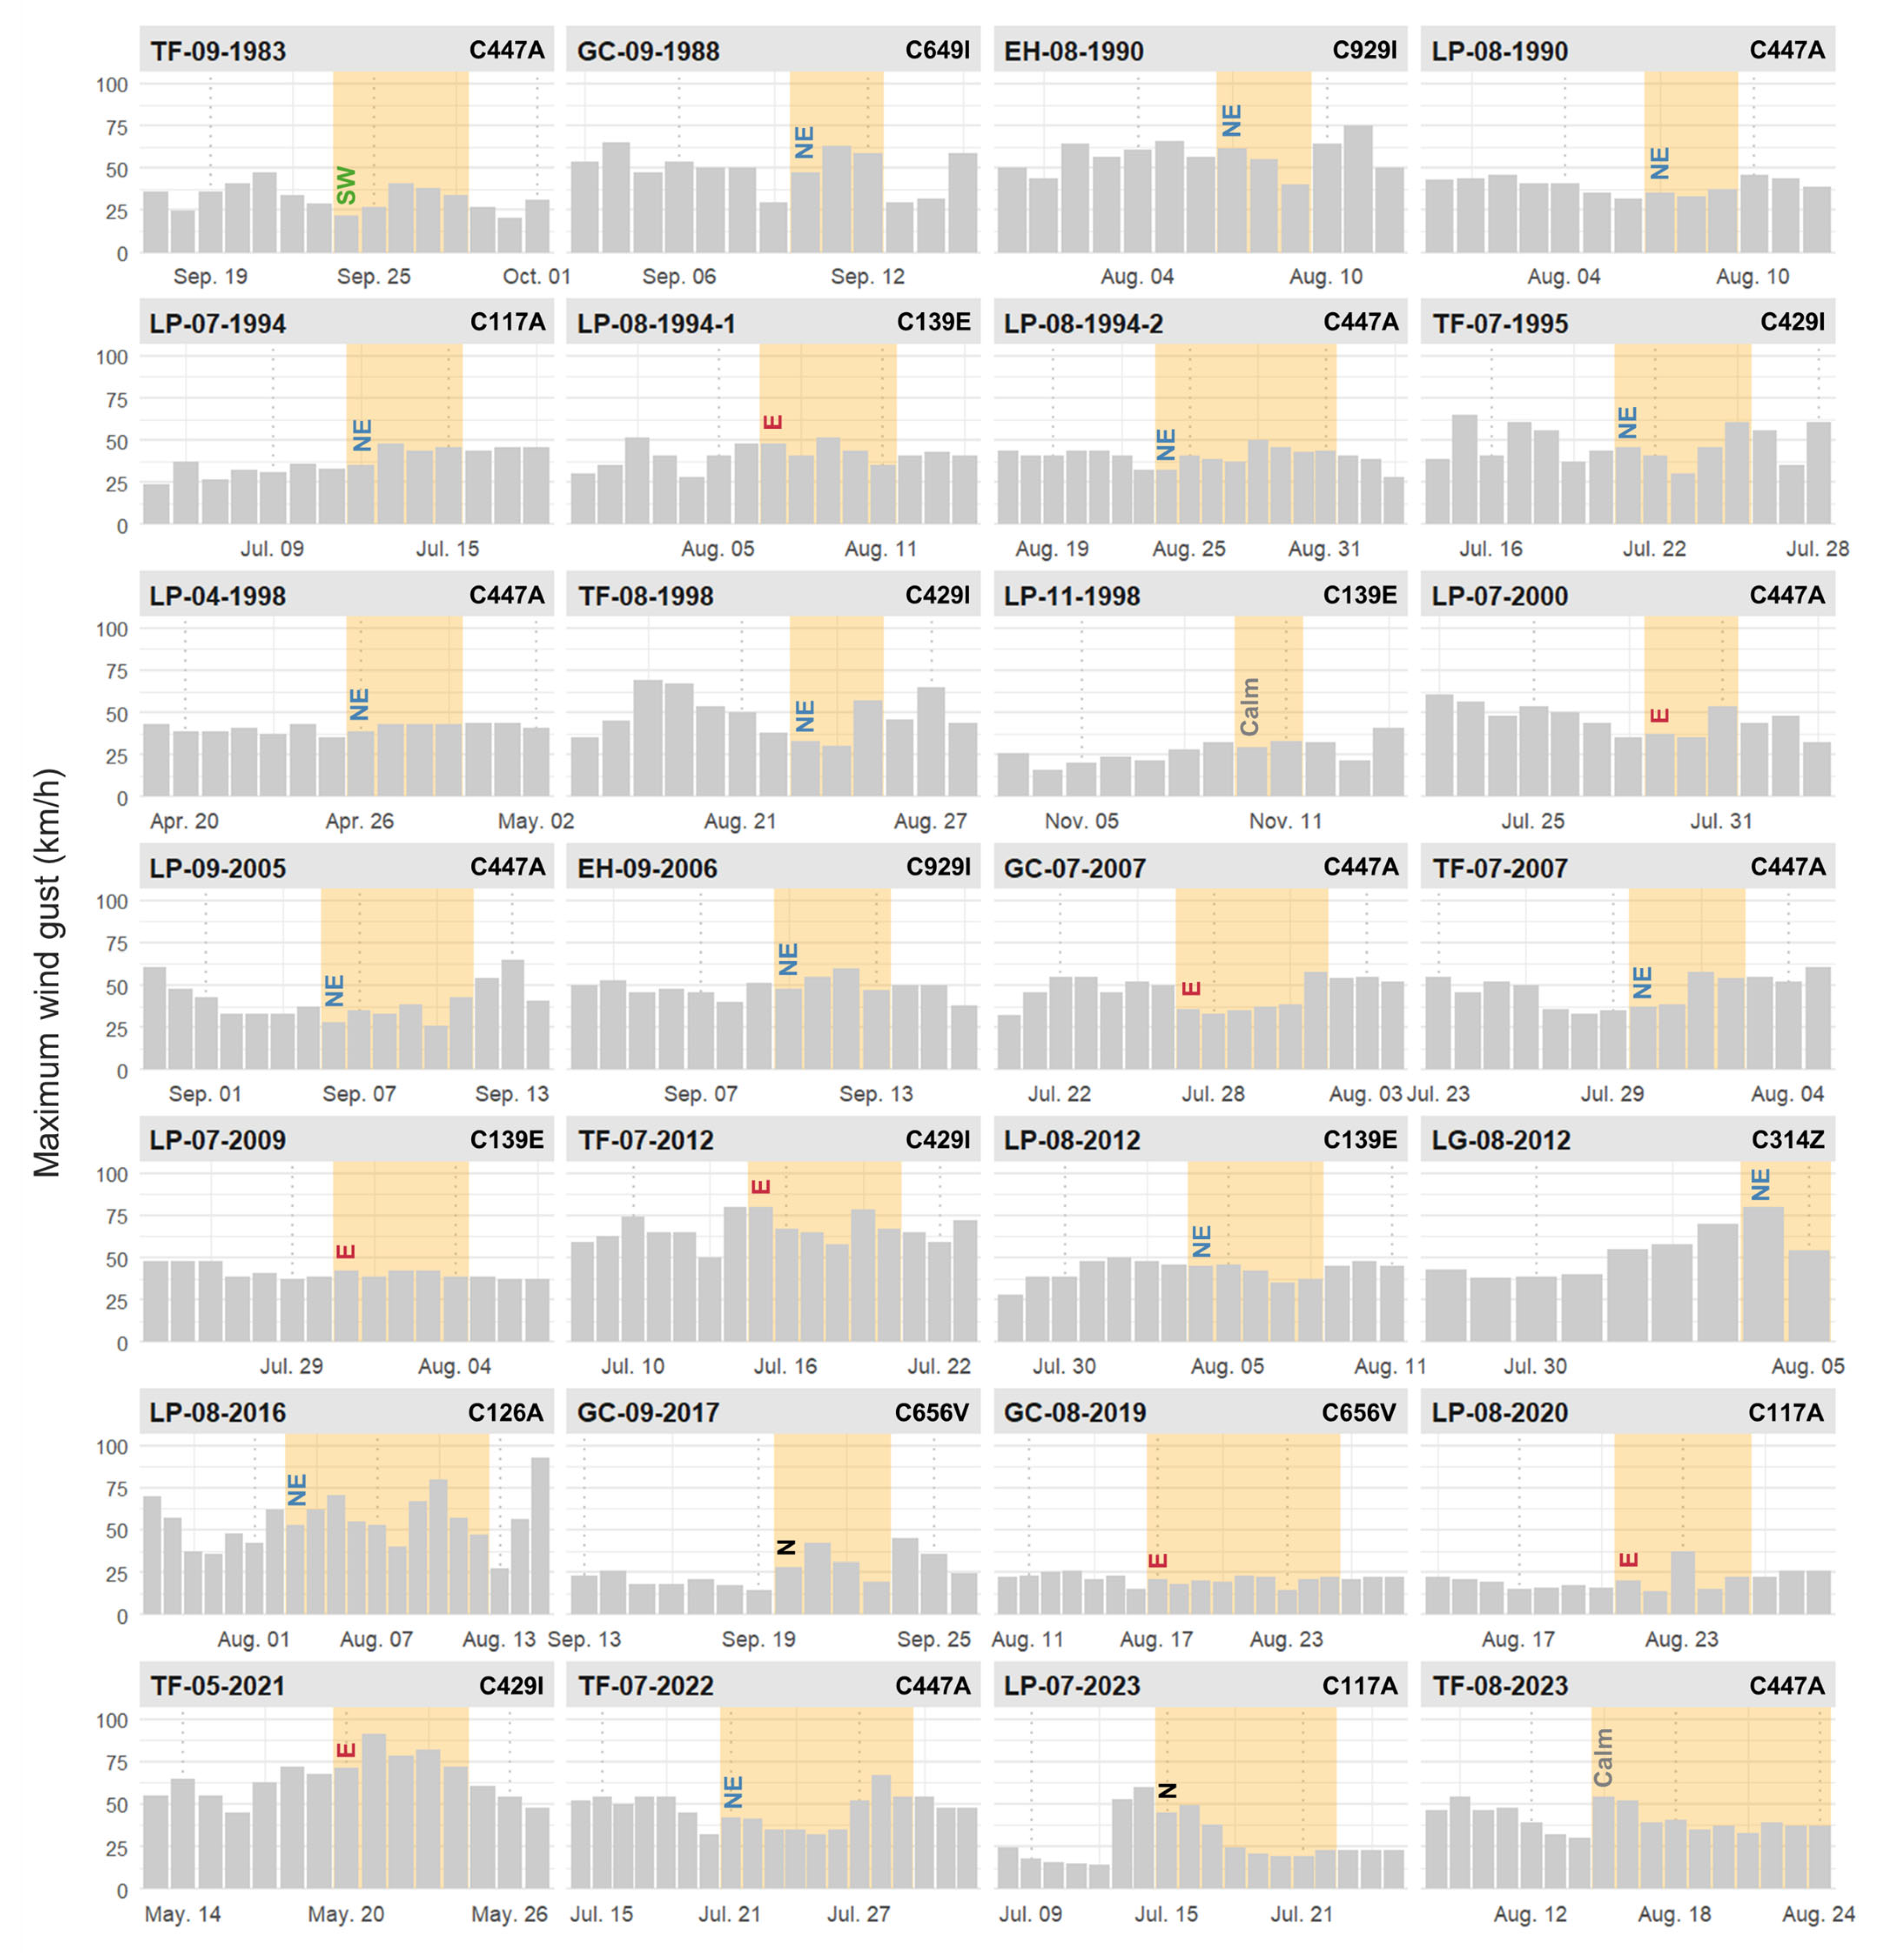
3.6. Wind
4. Discussion
5. Conclusions
Author Contributions
Funding
Data Availability Statement
Acknowledgments
Conflicts of Interest
Appendix A

| Fire Code | Start Date | Affected Area (ha) | Altitude of the STI Base (*) |
|---|---|---|---|
| TF-09-1983 | 24 September 1983 | 5895 | 637.76 |
| GC-09-1988 | 10 September 1988 | 1000 | 88 * |
| EH-08-1990 | 7 August 1990 | 1260 | 82 * |
| LP-08-1990 | 7 August 1990 | 1084 | 82 * |
| LP-07-1994 | 12 July 1994 | 562 | 287.52 |
| LP-08-1994 | 7 August 1994 | 539.6 | 205.44 |
| LP-08-1994 | 24 August 1994 | 562.3 | 287.52 |
| TF-07-1995 | 21 July 1995 | 931.2 | 334.24 |
| LP-04-1998 | 26 April 1998 | 1150 | 715.02 |
| TF-08-1998 | 23 August 1998 | 1101.58 | 334.24 |
| LP-11-1998 | 10 November 1998 | 575 | - |
| LP-07-2000 | 29 July 2000 | 2722.31 | 287.52 |
| LP-09-2005 | 6 September 2005 | 1351.4 | - |
| EH-09-2006 | 10 September 2006 | 1269.14 | 244.69 |
| GC-07-2007 | 27 July 2007 | 17,916.74 | 440.61 |
| TF-07-2007 | 30 July 2007 | 14364.1 | 114 * |
| LP-07-2009 | 31 July 2009 | 3037.53 | 121 * |
| TF-07-2012 | 15 July 2012 | 6277.8 | 334.24 |
| LP-08-2012 | 4 August 2012 | 2698.18 | 287.52 |
| LG-08-2012 | 4 August 2012 | 3961.92 | 287.52 |
| LP-08-2016 | 3 August 2016 | 4863.99 | 798.72 |
| GC-09-2017 | 20 September 2017 | 2446.87 | 385.16 |
| GC-08-2019 | 17 August 2019 | 9783.23 | 205.44 |
| LP-08-2020 | 21 August 2020 | 1177.99 | 287.52 |
| TF-05-2021 | 20 May 2021 | 3087.9 | 440.61 |
| TF-07-2022 | 21 July 2022 | 2752.9 | 244.69 |
| LP-07-2023 | 15 July 2023 | 3301.41 | 334.24 |
| TF-08-2023 | 15 August 2023 | 13,977.05 | 287.52 |
| Fire Code | Start Date | Affected Area (ha) | Reference Station | Tmax-Prev | Tmax-Prev (C447A) | Tmax-Start | Tmax-Start (C447A) | Tmax-During | Tmax-During (C447A) |
|---|---|---|---|---|---|---|---|---|---|
| TF-09-1983 | 24 September 1983 | 5895 | C447A | 23.1 | 29 | 31 | |||
| GC-09-1988 | 10 September 1988 | 1000 | C649I | 27.7 | 26.2 | 34 | 36.4 | 30.4 | 31.5 |
| EH-08-1990 | 7 August 1990 | 1260 | C929I | 26.4 | 30.6 | 33.8 | 36.4 | 30.8 | 35.6 |
| LP-08-1990 | 7 August 1990 | 1084 | C126A | 31.1 | 30.6 | 36 | 36.4 | 34.7 | 34.6 |
| LP-07-1994 | 12 July 1994 | 562 | C117A | 34.4 | 34.1 | 25.6 | 31.4 | 25.2 | 24.3 |
| LP-08-1994-1 | 7 August 1994 | 539.6 | C139E | 25.5 | 25.9 | 25.8 | 35.2 | 25.3 | 30.4 |
| LP-08-1994-2 | 24 August 1994 | 562.3 | C117A | 24.5 | 25.1 | 32 | 30.5 | 27.9 | 26.5 |
| TF-07-1995 | 21 July 1995 | 931.2 | C429I | 28.2 | 24.5 | 29 | 33.4 | 28.7 | 28.9 |
| LP-04-1998 | 26 April 1998 | 1150 | C126A | 17.6 | 19.1 | 23.2 | 19 | 21.9 | 18.8 |
| TF-08-1998 | 23 August 1998 | 1101.58 | C429I | 28.4 | 26.2 | 27 | 26.2 | 27.5 | 25.2 |
| LP-11-1998 | 10 November 1998 | 575 | C139E | 25.6 | 25 | 29.1 | 27.8 | 26.8 | 26.2 |
| LP-07-2000 | 29 July 2000 | 2722.31 | C117A | 25.4 | 24.6 | 33.7 | 31.8 | 35.1 | 32.4 |
| LP-09-2005 | 6 September 2005 | 1351.4 | C117A | 32.2 | 30 | 36.8 | 34.2 | 27.8 | 27.1 |
| EH-09-2006 | 10 September 2006 | 1269.14 | C929I | 29.6 | 31 | 29.2 | 29.1 | 28.6 | 25.9 |
| GC-07-2007 | 27 July 2007 | 17,916.74 | C623I | 29 | 22.5 | 35.5 | 28.3 | 36.2 | 32.4 |
| TF-07-2007 | 30 July 2007 | 14,364.1 | C447A | 26.3 | 35 | 29.4 | |||
| LP-07-2009 | 31 July 2009 | 3037.53 | C139E | 29 | 37.2 | 31.4 | 41.4 | 29 | 31.7 |
| TF-07-2012 | 15 July 2012 | 6277.8 | C429I | 27.6 | 21.7 | 29.8 | 28.8 | 33.8 | 33.4 |
| LP-08-2012 | 4 August 2012 | 2698.18 | C139E | 26.1 | 24.5 | 25.7 | 33.3 | 26.1 | 24.7 |
| LG-08-2012 | 4 August 2012 | 3961.92 | C314Z | 29.3 | 24.5 | 29.5 | 33.3 | 24.9 | 27.7 |
| LP-08-2016 | 3 August 2016 | 4863.99 | C126A | 31.6 | 24.2 | 25.4 | 21.4 | 33.5 | 31.6 |
| GC-09-2017 | 20 September 2017 | 2446.87 | C614H | 31.3 | 24.7 | 29.7 | 24.4 | 22.8 | 21.9 |
| GC-08-2019 | 17 August 2019 | 9783.23 | C656V | 26 | 26.9 | 34.6 | 35.1 | 31.6 | 30.2 |
| LP-08-2020 | 21 August 2020 | 1177.99 | C117A | 26.6 | 27.3 | 29.9 | 31.2 | 33.2 | 31.2 |
| TF-05-2021 | 20 May 2021 | 3087.9 | C423R | 21.5 | 20.9 | 34.2 | 24.4 | 24.6 | 21.1 |
| TF-07-2022 | 21 July 2022 | 2752.9 | C458U | 20.5 | 24.9 | 23.1 | 29.1 | 26.2 | 33.2 |
| LP-07-2023 | 15 July 2023 | 3301.41 | C117A | 30.6 | 30.5 | 33.4 | 25.1 | 25.6 | 23.4 |
| TF-08-2023 | 15 August 2023 | 13,977.05 | C436I | 33.2 | 34.2 | 27.3 | 32.1 | 30.5 | 31.7 |
| MEAN | 27.4 | 26.7 | 30.3 | 30.7 | 28.9 | 28.6 | |||
| PEARSON | 0.62 | 0.38 | 0.79 | ||||||
| Fire Code | Start Date | Affected Area (ha) | Reference Station | SPI-Prev | SPI-Prev (C447A) | SPEI-Prev | SPEI-Prev (C447A) | Dry-Months | Dry-Months (C447A) |
|---|---|---|---|---|---|---|---|---|---|
| TF-09-1983 | 24 September 1983 | 5895 | C447A | −0.63 | −0.55 | 6 (0) | |||
| GC-09-1988 | 10 September 1988 | 1000 | C649I | 0.62 | 0.47 | 0.78 | 0.42 | 2 (0) | 2 (1) |
| EH-08-1990 | 7 August 1990 | 1260 | C929I | 0.22 | 0.05 | 0.21 | 0.33 | 2 (1) | 3 (1) |
| LP-08-1990 | 7 August 1990 | 1084 | C126A | 0.82 | 0.05 | 0.57 | 0.33 | 2 (2) | 3 (1) |
| LP-07-1994 | 12 July 1994 | 562 | C117A | 0.31 | 0 | 0.59 | 0.03 | 1 (0) | 4 (1) |
| LP-08-1994-1 | 7 August 1994 | 539.6 | C139E | −0.03 | 0 | 0.36 | 0.03 | 2 (0) | 4 (1) |
| LP-08-1994-2 | 24 August 1994 | 562.3 | C117A | 0.31 | 0 | 0.59 | 0.03 | 1 (0) | 4 (1) |
| TF-07-1995 | 21 July 1995 | 931.2 | C429I | −0.67 | −0.75 | −0.64 | −0.71 | 5 (3) | 5 (4) |
| LP-04-1998 | 26 April 1998 | 1150 | C126A | −0.94 | −0.15 | −0.44 | −0.47 | 6 (0) | 6 (1) |
| TF-08-1998 | 23 August 1998 | 1101.58 | C429I | 0.1 | −0.15 | −0.26 | −0.47 | 5 (1) | 6 (1) |
| LP-11-1998 | 10 November 1998 | 575 | C139E | 0.32 | −0.15 | 0.03 | −0.47 | 3 (1) | 6 (1) |
| LP-07-2000 | 29 July 2000 | 2722.31 | C117A | 0.29 | −0.14 | 0.39 | −0.13 | 2 (0) | 3 (1) |
| LP-09-2005 | 6 September 2005 | 1351.4 | C117A | 0.29 | −0.18 | 0.63 | −0.27 | 1 (0) | 6 (1) |
| EH-09-2006 | 10 September 2006 | 1269.14 | C929I | 0.34 | 0.18 | 0.14 | 0.14 | 1 (1) | 4 (0) |
| GC-07-2007 | 27 July 2007 | 17,916.74 | C629Q | 0.99 | 0.04 | 0.95 | 0.18 | 1 (1) | 4 (1) |
| TF-07-2007 | 30 July 2007 | 14364.1 | C447A | 0.04 | 0.18 | 4 (1) | |||
| LP-07-2009 | 31 July 2009 | 3037.53 | C139E | 0.22 | 0.51 | 0.14 | 0.56 | 3 (0) | 2 (0) |
| TF-07-2012 | 15 July 2012 | 6277.8 | C429I | −0.56 | −1.43 | 0.01 | −0.91 | 4 (0) | 6 (4) |
| LP-08-2012 | 4 August 2012 | 2698.18 | C139E | −0.47 | −1.43 | −0.39 | −0.91 | 5 (2) | 6 (4) |
| LG-08-2012 | 4 August 2012 | 3961.92 | C317B | 0.12 | −1.43 | 0.14 | −0.91 | 4 (0) | 6 (4) |
| LP-08-2016 | 3 August 2016 | 4863.99 | C126A | −0.02 | −0.1 | 0.23 | −0.03 | 5 (2) | 3 (3) |
| GC-09-2017 | 20 September 2017 | 2446.87 | C656V | 0.19 | −0.1 | −0.09 | −0.21 | 4 (1) | 4 (1) |
| GC-08-2019 | 17 August 2019 | 9783.23 | C656V | 0.16 | −0.3 | 0.3 | −0.24 | 3 (1) | 5 (1) |
| LP-08-2020 | 21 August 2020 | 1177.99 | C117A | 1.11 | −0.49 | 0.5 | −0.49 | 3 (0) | 5 (2) |
| TF-05-2021 | 20 May 2021 | 3087.9 | C429I | 0.16 | 0.33 | 0.01 | 0.2 | 4 (1) | 2 (0) |
| TF-07-2022 | 21 July 2022 | 2752.9 | C447A | −0.13 | −0.29 | 5 (1) | |||
| LP-07-2023 | 15 July 2023 | 3301.41 | C117A | 0.86 | −0.73 | 0.24 | −0.93 | 3 (2) | 6 (3) |
| TF-08-2023 | 15 August 2023 | 13,977.05 | C447A | −0.73 | −0.93 | 6 (3) | |||
| MEAN | 0.12 | −0.26 | 0.12 | −0.23 | 3 (1) | 5 (2) | |||
| PEARSON | 0.41 | 0.58 | 0.42 (0.44) | ||||||
| Fire Code | Start Date | Affected Area (ha) | Reference Station | RH-Prev | RH-Prev (C447A) | RH-Start | RH-Start (C447A) | RH-During | RH-During (C447A) | RH-After | RH-After (C447A) |
|---|---|---|---|---|---|---|---|---|---|---|---|
| TF-09-1983 | 24 September 1983 | 5895 | C447A | 76.1 (−) | 65 (−) | 41.6 (−) | 81 (−) | ||||
| GC-09-1988 | 10 September 1988 | 1000 | C649I | 72.7 (−) | 64.9 (−) | 57 (−) | 22 (−) | 60 (−) | 42.3 (−) | 80 (−) | 77 (−) |
| EH-08-1990 | 7 August 1990 | 1260 | C929I | 82.3 (−) | 52.6 (−) | 53 (−) | 19 (−) | 60 (−) | 19 (−) | 77.3 (−) | 43.7 (−) |
| LP-08-1990 | 7 August 1990 | 1084 | C126A | - | 52.6 (−) | - | 19 (−) | - | 19 (−) | - | 43.7 (−) |
| LP-07-1994 | 12 July 1994 | 562 | C117A | - | 35.4 (−) | - | 40 (−) | - | 67 (−) | - | 74.7 (−) |
| LP-08-1994-1 | 7 August 1994 | 539.6 | C139E | 76.1 (−) | 70.9 (−) | 85 (−) | 27 (−) | 80.8 (−) | 56.6 (−) | 76.7 (−) | 76.7 (−) |
| LP-08-1994-2 | 24 August 1994 | 562.3 | C117A | - | 70.9 (−) | - | 65 (−) | - | 73.4 (−) | - | 70 (−) |
| TF-07-1995 | 21 July 1995 | 931.2 | C429I | 72.3 (−) | 77.9 (−) | 79 (−) | 68 (−) | 75 (−) | 70 (−) | 55 (−) | 41.7 (−) |
| LP-04-1998 | 26 April 1998 | 1150 | C126A | - | 77 (−) | - | 82 (−) | - | 81.3 (−) | - | 74.7 (−) |
| TF-08-1998 | 23 August 1998 | 1101.58 | C429I | 78.3 (−) | 68 (−) | 85 (−) | 72 (−) | 80.7 (−) | 74 (−) | 69.3 (−) | 40 (−) |
| LP-11-1998 | 10 November 1998 | 575 | C139E | 71.9 (−) | 59.1 (−) | 40 (−) | 29 (−) | 59 (−) | 47.5 (−) | 77 (−) | 66.3 (−) |
| LP-07-2000 | 29 July 2000 | 2722.31 | C117A | - | 70.9 (−) | - | 68 (−) | - | 38.3 (−) | - | 53.3 (−) |
| LP-09-2005 | 6 September 2005 | 1351.4 | C117A | - | 54.3 (−) | - | 28 (−) | - | 65.8 (−) | - | 74.7 (−) |
| EH-09-2006 | 10 September 2006 | 1269.14 | C929I | 69.9 (−) | 34.4 (−) | 69 (−) | 31 (−) | 71.5 (−) | 53.5 (−) | 73.3 (−) | 74.7 (−) |
| GC-07-2007 | 27 July 2007 | 17,916.74 | C629Q | - | 73.8 (53.6) | - | 58.5 (17) | - | 34.5 (11.4) | - | 76.2 (54.7) |
| TF-07-2007 | 30 July 2007 | 14,364.1 | C447A | 58.6 (39.9) | 14 (-) | 38.8 (26.7) | 76.3 (54.3) | ||||
| LP-07-2009 | 31 July 2009 | 3037.53 | C139E | 63.9 (36.7) | 49.4 (13.6) | 56 (19) | 24.5 (8) | −(32) | 47 (26.4) | −(57.7) | 69.7 (43.7) |
| TF-07-2012 | 15 July 2012 | 6277.8 | C429I | 58.4 (45.7) | 81 (65.7) | 38 (25) | 57 (20) | 40.3 (20.7) | 36.4 (12.2) | 47 (18.3) | 44.5 (14) |
| LP-08-2012 | 4 August 2012 | 2698.18 | C139E | 70 (56.1) | 78.6 (57.3) | 79 (30) | 54.5 (9) | 68.2 (49.2) | 67.0 (40.9) | 65.3 (38.3) | 83.3 (68.7) |
| LG-08-2012 | 4 August 2012 | 3961.92 | C314Z | 39.6 (25.9) | 78.6 (57.3) | 8 (7) | 54.5 (9) | 39.6 (22.8) | 67.0 (40.9) | 62.3 (49.3) | 83.3 (68.7) |
| LP-08-2016 | 3 August 2016 | 4863.99 | C126A | 26.1 (11.3) | 79.6 (61.1) | 46 (13) | 81 (67) | 29.6 (16.5) | 52.1 (25.3) | 41.7 (26) | 79.8 (63) |
| GC-09-2017 | 20 September 2017 | 2446.87 | C614H | 40.6 (29.3) | 73.8 (50.9) | 49 (27) | 61 (24) | 60.5 (44.3) | 78.4 (59.3) | 56.2 (44.3) | 70 (41.7) |
| GC-08-2019 | 17 August 2019 | 9783.23 | C656V | 74 (45.1) | 77.1 (56) | 26 (20) | 32.5 (24) | 47 (20) | 58.2 (36.1) | 83 (48.3) | 76.8 (55.7) |
| LP-08-2020 | 21 August 2020 | 1177.99 | C117A | 50.7 (29.6) | 62.3 (35.7) | 30 (13) | 46 (13) | 27.8 (15.4) | 52.8 (18.8) | 26.7 (16.3) | 47.8 (16.3) |
| TF-05-2021 | 20 May 2021 | 3087.9 | C423R | 21.8 (6.3) | 78.6 (59.4) | 12 (5) | 62 (27) | 22 (3.2) | 70.9 (47.4) | 42.5 (5.7) | 79.8 (63) |
| TF-07-2022 | 21 July 2022 | 2752.9 | C458U | 93.1 (86.1) | 67 (34) | 73.5 (52.2) | 96.2 (92.3) | ||||
| LP-07-2023 | 15 July 2023 | 3301.41 | C117A | 49.4 (35.1) | 55.2 (33.7) | 61 (23) | 60.5 (21) | 69.3 (47.9) | 77.8 (58) | 77 (59.7) | 77.7 (59.7) |
| TF-08-2023 | 15 August 2023 | 13,977.05 | C436I | 63.6 (35.9) | 59.6 (28.6) | 84.5 (75) | 69.5 (39) | 64.9 (44.7) | 55.4 (34.9) | 52.3 (33.3) | 63.3 (43.5) |
| MEAN | 62.4 (37.2) | 66.6(49.9) | 52.5 (24.3) | 49.1 (24) | 55.5 (30.4) | 55.7 (35) | 65.8 (41.8) | 68.5 (52.8) | |||
| PEARSON | −0.10 (0.35) | 0.23(0.21) | 0.29 (0.52) | 0.41 (0.59) | |||||||
| Fire Code | Start Date | Affected Area (ha) | Reference Meteorological Station | Max-Gust-Start | Max-Gust-Start (C447A) | Max-Gust-During | Max-Gust-During (C447A) | Wind-Direction |
|---|---|---|---|---|---|---|---|---|
| TF-09-1983 | 24 September 1983 | 5895 | C447A | 22 | 32.4 | SW | ||
| GC-09-1988 | 10 September 1988 | 1000 | C649I | 47.2 | - | 56.4 | - | NE |
| EH-08-1990 | 7 August 1990 | 1260 | C929I | 61.9 | 34.9 | 52.3 | 35 | NE |
| LP-08-1990 | 7 August 1990 | 1084 | C447A | - | 34.9 | - | 37.8 | NE |
| LP-07-1994 | 12 July 1994 | 562 | C117A | - | 34.9 | - | 43.2 | NE |
| LP-08-1994-1 | 7 August 1994 | 539.6 | C139E | 47.9 | 24.1 | 43.9 | 38.7 | E |
| LP-08-1994-2 | 24 August 1994 | 562.3 | C117A | - | 32 | - | 41.5 | NE |
| TF-07-1995 | 21 July 1995 | 931.2 | C429I | 46.1 | 46.1 | 44.8 | 43.4 | NE |
| LP-04-1998 | 26 April 1998 | 1150 | C126A | - | 38.9 | - | 41.9 | NE |
| TF-08-1998 | 23 August 1998 | 1101.58 | C429I | 33.1 | 42.8 | 40 | 43.3 | NE |
| LP-11-1998 | 10 November 1998 | 575 | C139E | 29.2 | 22 | 31.1 | 22 | Cal |
| LP-07-2000 | 29 July 2000 | 2722.31 | C447A | - | 37.1 | - | 42 | E |
| LP-09-2005 | 6 September 2005 | 1351.4 | C447A | - | 28.1 | - | 34 | NE |
| EH-09-2006 | 10 September 2006 | 1269.14 | C929I | 47.9 | 28.1 | 52.6 | 46.8 | NE |
| GC-07-2007 | 27 July 2007 | 17,916.74 | C629Q | - | 36 | - | 39.7 | E |
| TF-07-2007 | 30 July 2007 | 14364.1 | C447A | 37.1 | 47 | NE | ||
| LP-07-2009 | 31 July 2009 | 3037.53 | C139E | 42.1 | 38.9 | 40.8 | 43.6 | E |
| TF-07-2012 | 15 July 2012 | 6277.8 | C429I | 79.9 | 25.9 | 33.5 | 38.7 | E |
| LP-08-2012 | 4 August 2012 | 2698.18 | C139E | 45 | 51.8 | 41 | 52.3 | NE |
| LG-08-2012 | 4 August 2012 | 3961.92 | C314Z | 79.9 | 51.8 | 24.9 | 38.7 | NE |
| LP-08-2016 | 3 August 2016 | 4863.99 | C126A | 52.9 | 55.1 | 58.5 | 45.4 | NE |
| GC-09-2017 | 20 September 2017 | 2446.87 | C656V | 28.1 | 55.1 | 30.1 | 61.7 | N |
| GC-08-2019 | 17 August 2019 | 9783.23 | C656V | 20.9 | 32 | 20 | 38.8 | E |
| LP-08-2020 | 21 August 2020 | 1177.99 | C117A | 20.2 | 33.1 | 21.7 | 38.4 | E |
| TF-05-2021 | 20 May 2021 | 3087.9 | C429I | 70.9 | 54 | 78.8 | 55.2 | E |
| TF-07-2022 | 21 July 2022 | 2752.9 | C447A | 42.1 | 43.6 | NE | ||
| LP-07-2023 | 15 July 2023 | 3301.41 | C117A | 45 | 60.8 | 29.8 | 58.1 | N |
| TF-08-2023 | 15 August 2023 | 13,977.05 | C447A | 54 | 39.6 | Cal | ||
| MEAN | 45.4 | 39.0 | 41.1 | 42.3 | - | |||
| PEARSON | 0.27 | 0.29 | - | |||||
References
- Guo, Z.; Li, W.; Ciais, P.; Sitch, S.; van der Werf, G.R.; Bowring, S.P.K.; Bastos, A.; Mouillot, F.; He, J.; Sun, M.; et al. Reconstructed global monthly burned area maps from 1901 to 2020. Earth Syst. Sci. Data Discuss. 2025. [Google Scholar] [CrossRef]
- Xu, R.; Ye, T.; Huang, W.; Yue, X.; Morawska, L.; Abramson, M.J.; Chen, G.; Yu, P.; Liu, Y.; Yang, Z.; et al. Global, regional, and national mortality burden attributable to air pollution from landscape fires: A health impact assessment study. Lancet 2024, 404, 2447–2459. [Google Scholar] [CrossRef]
- Johnston, F.H.; Henderson, S.B.; Chen, Y.; Randerson, J.T.; Marlier, M.; DeFries, R.S.; Kinney, P.; Bowman, D.M.J.S.; Brauer, M. Estimated global mortality attributable to smoke from landscape fires. Environ. Health Perspect. 2012, 120, 695–701. [Google Scholar] [CrossRef]
- Keeley, J.E.; Bond, W.J.; Bradstock, R.A.; Pausas, J.G.; Rundel, P.W. Fire in Mediterranean Ecosystems: Ecology, Evolution and Management; Cambridge University Press: Cambridge, UK, 2011. [Google Scholar] [CrossRef]
- Turco, M.; Llasat, M.C.; von Hardenberg, J.; Provenzale, A. Climate change impacts on wildfires in a Mediterranean environment. Clim. Change 2014, 125, 369–380. [Google Scholar] [CrossRef]
- San-Miguel-Ayanz, J.; Durrant, T.; Boca, R.; Libertà, G.; Branco, A.; De Rigo, D.; Ferrari, D.; Maianti, P.; Artés Vivancos, T.; Oom, D.; et al. Forest Fires in Europe, Middle East and North Africa 2019; Publications Office of the European Union: Luxembourg, 2020; Available online: https://data.europa.eu/doi/10.2760/468688 (accessed on 23 June 2025).
- Navarro, G.; Caballero, I.; Silva, G.; Parra, P.-C.; Vázquez, Á.; Caldeira, R. Evaluation of forest fire on Madeira Island using Sentinel-2A MSI imagery. Int. J. Appl. Earth Obs. Geoinf. 2017, 58, 97–106. [Google Scholar] [CrossRef]
- Synolakis, C.E.; Karagiannis, G.M. Wildfire risk management in the era of climate change. PNAS Nexus 2024, 3, pgae151. [Google Scholar] [CrossRef] [PubMed]
- Plana, E.; Font, M.; Serra, M.; Borràs, M.; Vilalta, O. El Fuego y los Incendios Forestales en el Mediterráneo: La Historia de Una Relación Entre Bosques y Sociedad. Cinco Mitos y Realidades Para Saber Más; Ediciones del Centro Tecnológico Forestal de Cataluña: Barcelona, Spain, 2016; 36p, Available online: https://efirecom.ctfc.cat/docs/revistaefirecom_es.pdf (accessed on 23 June 2025).
- Pausas, J.G.; Keeley, J.E. A burning story: The role of fire in the history of life. BioScience 2009, 59, 593–601. [Google Scholar] [CrossRef]
- Beck, H.E.; McVicar, T.R.; Vergopolan, N.; Berg, A.; Lutsko, N.J.; Dufour, A.; Zeng, Z.; Jiang, X.; van Dijk, A.I.J.M.; Miralles, D.G. High-resolution (1 km) Köppen-Geiger maps for 1901–2099 based on constrained CMIP6 projections. Sci. Data 2023, 10, 724. [Google Scholar] [CrossRef]
- Ministerio para la Transición Ecológica y el Reto Demográfico del Gobierno de España. Mapa Forestal de España (MFE50). 2021. Available online: https://datos.gob.es/es/catalogo/e05068001-mapa-forestal-de-espana-escala-1-50-000 (accessed on 23 June 2025).
- Agencia Estatal de Meteorología; Instituto de Meteorologia de Portugal. Atlas Climático de los Archipiélagos de Canarias, Madeira y Azores: Temperatura del Aire y Precipitación (1971–2000). 2012. Available online: https://www.aemet.es/es/conocermas/recursos_en_linea/publicaciones_y_estudios/publicaciones/detalles/segundo_Atlas_climatologic (accessed on 23 June 2025).
- Marzol, M.V.; Máyer, P. Algunas reflexiones acerca del clima de las islas Canarias. Nimbus Rev. Climatol. Meteorol. Paisaje 2022, 29–30, 399–416. Available online: https://accedacris.ulpgc.es/handle/10553/58655 (accessed on 23 June 2025).
- Carrillo, J.; Hernández-Barrera, S.; Expósito, F.J.; Díaz, J.P.; González, A.; Pérez, J.C. The uneven impact of climate change on drought with elevation in the Canary Islands. npj Clim. Atmos. Sci. 2023, 6, 31. [Google Scholar] [CrossRef]
- Del Arco Aguilar, M.J.; Rodríguez Delgado, O. Vegetation of the Canary Islands. In Vegetation of the Canary Islands; Springer: Cham, Switzerland, 2018; Volume 16, pp. 117–131. [Google Scholar] [CrossRef]
- Fernández-Palacios, J.M.; Arévalo, J.R.; Balguerías, E.; Barone, R.; de Nascimento, L.; Delgado, J.D.; Elias, R.B.; Fernández-Lugo, S.; Méndez, J.; Menezes de Sequeira, M.; et al. La Laurisilva: Canarias, Madeira y Azores; Macaronesia Editorial: La Laguna, Spain, 2017; ISBN 978-84-697-5454-2. Available online: https://dialnet.unirioja.es/servlet/libro?codigo=828513 (accessed on 23 June 2025).
- Climent, J.; López, R.; González, S.; Gil, L. El pino canario (Pinus canariensis), una especie singular. Ecosistemas 2007, 16, 80–89. Available online: https://www.revistaecosistemas.net/index.php/ecosistemas/article/view/447/430 (accessed on 23 June 2025).
- Dorta, P. Las inversiones térmicas en Canarias. Investig. Geogr. 1996, 15, 109–124. [Google Scholar] [CrossRef]
- Dorta, P.; Correa, M. Methodological approach for the characterisation and trend analysis of subsidence thermal inversions: The case of the Canary Islands. Int. J. Clim. 2025. [Google Scholar] [CrossRef]
- Dorta, P. Aproximación a la influencia de las advecciones de aire sahariano en la propagación de los incendios forestales en la provincia de Santa Cruz de Tenerife. In Actas del XVII Congreso de Geógrafos Españoles; Rodríguez Gutiérrez, F., Menéndez Fernández, R., Montes Vigón, S., Poncelas Nieto, M., Eds.; Universidad de Oviedo: Oviedo, Spain, 2001; pp. 158–162. ISBN 84-9704-037-6. Available online: https://dialnet.unirioja.es/servlet/articulo?codigo=7564844 (accessed on 23 June 2025).
- Dorta, P.; Gelado Caballero, M.D.; Hernández Brito, J.J.; Cardona Castellano, P.J.; Collado Sánchez, C.; Mendoza Rodríguez, S.; Rodríguez, M.J.; Siruela Matos, V.F.; Torres Padrón, M.E. Frecuencia, estacionalidad y tendencias de las advecciones de aire sahariano en Canarias (1976–2003). Investig. Geogr. 2005, 38, 23–45. [Google Scholar] [CrossRef]
- Ministerio para la Transición Ecológica y el Reto Demográfico del Gobierno de España. Anuario de Estadística Forestal 2019; Ministerio para la Transición Ecológica y el Reto Demográfico: Madrid, Spain, 2021. Available online: https://www.miteco.gob.es/content/dam/miteco/es/biodiversidad/estadisticas/aef2019_completo_estandar_tcm30-534526.pdf (accessed on 23 June 2025).
- Instituto Nacional de Estadística. Superficie Forestal Como Porcentaje de la Superficie Total, Por Comunidades Autónomas. 2021. Available online: https://ine.es/jaxi/Datos.htm?tpx=68563#_tabs-tabla (accessed on 23 June 2025).
- Ministerio de Agricultura, Pesca y Alimentación del Gobierno de España. Los Incendios Forestales en España. Decenio 2006–2015; Ministerio de Agricultura, Pesca y Alimentación: Madrid, Spain, 2019. Available online: https://www.miteco.gob.es/content/dam/miteco/es/biodiversidad/temas/incendios-forestales/incendios-decenio-2006-2015_tcm30-521617.pdf (accessed on 23 June 2025).
- Ministerio para la Transición Ecológica y el Reto Demográfico (MITECO). XII Estudio de Inversión y Empleo en el Sector Forestal. Años 2019 y 2020; Enciso, E., López de Sancho, A., Eds.; Ministerio para la Transición Ecológica y el Reto Demográfico: Madrid, Spain, 2020. Available online: https://www.miteco.gob.es/content/dam/miteco/es/biodiversidad/estadisticas/12estudioxiinversionyempleo2019-2020_tcm30-552773.pdf (accessed on 23 June 2025).
- Huesca, M.; González-Alonso, F.; Cuevas, J.M.; Merino-de-Miguel, S. Estimación de la superficie quemada en los incendios forestales de Canarias en 2007 utilizando sinérgicamente imágenes MODIS y anomalías térmicas. Investig. Agrar. Sist. Recur. For. 2008, 17, 308–316. Available online: https://ris.utwente.nl/ws/portalfiles/portal/267317106/INVE_MEM_2008_54258.pdf (accessed on 23 June 2025).
- Guillén-Climent, M.L.; Marino, E.; Ranz, P.; Tomé, J.L. Spatial variability of vegetation recovery at La Gomera wildfire using high spatial resolution imagery. Rev. FLAMMA 2016, 7, 29–34. Available online: https://www.researchgate.net/publication/309458002_Spatial_variability_of_vegetation_recovery_at_La_Gomera_wildfire_using_high_spatial_resolution_imagery (accessed on 23 June 2025).
- Zamarreño-Aramendia, G.; Cristòfol, F.J.; de-San-Eugenio-Vela, J.; Ginesta, X. Social-media analysis for disaster prevention: Forest fire in Artenara and Valleseco, Canary Islands. J. Open Innov. Technol. Mark. Complex. 2020, 6, 169. [Google Scholar] [CrossRef]
- Correa, J.; Boulat, L.; Dorta, P. Forest Fires, Vulnerability, and Exposure: The Evaluation of What Was Salvaged in the 2023 Fire in Tenerife (Spain). Fire 2025, 8, 186. [Google Scholar] [CrossRef]
- Santana, L.M. Análisis Climático del Incendio Forestal de Tenerife. Comarcas de Abona e Isora: 15 a 21 de Julio de 2012; Cabildo Insular de Tenerife: Tenerife, Spain, 2012. Available online: https://www.agrocabildo.org/publica/analisisclimatico/IncendiosISORAjulio2012.pdf (accessed on 23 June 2025).
- Rasilla Álvarez, D.F.; Carracedo Martín, V.; Cuero, A. Tiempo, clima y grandes incendios forestales en las Islas Canarias. In El Clima: Aire, Agua, Tierra y Fuego; Montávez Gómez, J.P., Gómez Navarro, J.J., López Romero, J.M., Palacios Peña, L., Turco, M., Jerez Rodríguez, S., Lorente, R., Jiménez Guerrero, P., Eds.; Publicaciones de la Asociación Española de Climatología (AEC): Murcia, Spain, 2018; Serie A; pp. 849–859. Available online: https://aeclim.org/wp-content/uploads/2019/07/849-RASILLA.pdf (accessed on 23 June 2025).
- Gobierno de Canarias. Decreto 60/2014, de 29 de Mayo, por el que se Aprueba el Plan Especial de Protección Civil y Atención de Emergencias por Incendios Forestales de la Comunidad Autónoma de Canarias (INFOCA). Boletín Oficial de Canarias, N° 113, 13 June 2014. Available online: https://www.gobiernodecanarias.org/boc/2014/113/007.html (accessed on 25 June 2025).
- Molina-Terrén, D.M.; Fry, D.L.; Grillo, F.F.; Cardil, A.; Stephens, S.L. Fire History and Management of Pinus canariensis Forests on the Western Canary Islands Archipelago, Spain. For. Ecol. Manag. 2016, 382, 184–192. [Google Scholar] [CrossRef]
- Guindos-Rojas, F.; Arbelo, M.; García-Lázaro, J.R.; Moreno-Ruiz, J.A.; Hernández-Leal, P.A. Evaluation of a Bayesian Algorithm to Detect Burned Areas in the Canary Islands’ Dry Woodlands and Forests Ecoregion Using MODIS Data. Remote Sens. 2018, 10, 789. [Google Scholar] [CrossRef]
- Bello-Rodríguez, V.; Gómez, L.A.; Fernández López, Á.; Del-Arco-Aguilar, M.J.; Hernández-Hernández, R.; Emerson, B.; González-Mancebo, J.M. Short- and Long-Term Effects of Fire in Subtropical Cloud Forests on an Oceanic Island. Land Degrad. Dev. 2018, 29, 4434–4446. [Google Scholar] [CrossRef]
- García-Lázaro, J.R.; Moreno-Ruiz, J.A.; Arbelo, M.; del Águila Cano, I.M. Evaluación de un Algoritmo para Detección de Áreas Quemadas en Bosques de Canarias. In Teledetección: Humedales y Espacios Protegidos. XVI Congreso de la Asociación Española de Teledetección; Bustamante, J., Díaz-Delgado, R., Aragonés, D., Afán, I., García, D., Eds.; Spanish Remote Sensing Association: Sevilla, Spain, 2015; pp. 149–152. Available online: http://hdl.handle.net/10835/4845 (accessed on 15 July 2025).
- Dorta, P.; López Díez, A.; Díaz Pacheco, J.S. El calentamiento global en el Atlántico Norte Suroriental. El caso de Canarias. Estado de la cuestión y perspectivas de futuro. Cuad. Geogr. 2018, 57, 27–52. [Google Scholar] [CrossRef]
- Correa, J.; López Díez, A.; Dorta Antequera, P.; Martín Raya, N. The perception of climate change in island areas: The case of Tenerife. Boletín Asoc. Geógrafos Españoles 2023, 12, 8093. [Google Scholar] [CrossRef]
- Carrillo, J.; Pérez, J.C.; Expósito, F.J.; Díaz, J.P.; González, A. Projections of wildfire weather danger in the Canary Islands. Sci. Rep. 2022, 12, 8093. [Google Scholar] [CrossRef]
- Gobierno de Canarias. Sistema de Información para la Gobernanza Climática en Canarias. 2025. Available online: https://gobernanzaclimatica.sitcan.es (accessed on 23 June 2025).
- Biblioteca de la Universidad de La Laguna. Maresía: Prensa Digitalizada y Patrimonio Documental. Available online: https://www.ull.es/servicios/biblioteca/servicios/maresia/ (accessed on 15 July 2025).
- Wetterzentrale. CFSR: 850 hPa Temp. 2025. Available online: https://www.wetterzentrale.de/es/reanalysis.php?model=cfsr (accessed on 23 June 2025).
- Thornthwaite, C.W. An Approach toward a Rational Classification of Climate. Geogr. Rev. 1948, 38, 55–94. [Google Scholar] [CrossRef]
- Amador-González, A.; Marzol, M.V. Frequency and Intensity of Droughts on the Southern Slopes of the Canary Islands (1970–2018). Investig. Geográficas 2021, 61, 78–86. [Google Scholar] [CrossRef]
- ECMWF. L137 Model Level Definitions. 2024. Available online: https://confluence.ecmwf.int/display/UDOC/L137+model+level+definitions (accessed on 23 June 2025).
- Muñoz-Sabater, J.; Dutra, E.; Agustí-Panareda, A.; Albergel, C.; Arduini, G.; Balsamo, G.; Boussetta, S.; Choulga, M.; Harrigan, S.; Hersbach, H.; et al. ERA5-Land: A state-of-the-art global reanalysis dataset for land applications. Earth Syst. Sci. Data 2021, 13, 4349–4383. [Google Scholar] [CrossRef]
- Krüger, K.; Schäfler, A.; Wirth, M.; Weissmann, M.; Craig, G.C. Vertical structure of the lower-stratospheric moist bias in the ERA5 reanalysis and its connection to mixing processes. Atmos. Chem. Phys. 2022, 22, 15559–15574. [Google Scholar] [CrossRef]
- Gomis-Cebolla, J.; Rattayova, V.; Salazar-Galán, S.; Francés, F. Evaluation of ERA5 and ERA5-Land reanalysis precipitation datasets over Spain (1951–2020). Atmos. Res. 2023, 284, 106606. [Google Scholar] [CrossRef]
- Carrillo, J.; Guerra, J.C.; Cuevas, E.; Barrancos, J. Characterization of the Marine Boundary Layer and the Trade-Wind Inversion over the Sub-tropical North Atlantic. Bound.-Layer Meteorol. 2016, 158, 311–330. [Google Scholar] [CrossRef]
- University of Wyoming, Department of Atmospheric Science. Sounding. 2025. Available online: https://weather.uwyo.edu/upperair/sounding_legacy.html (accessed on 23 June 2025).
- Anuario de Estadística Forestal 2022; Ministerio para la Transición Ecológica y el Reto Demográfico del Gobierno de España: Madrid, Spain, 2024. Available online: https://www.miteco.gob.es/content/dam/miteco/es/biodiversidad/estadisticas/aef2022/Anuario%20Estadistica%20Forestal%202022.pdf (accessed on 23 June 2025).
- Instituto Canario de Estadística. Número de Siniestros y Superficie Afectada. Canarias by Years. 2024. Available online: https://www3.gobiernodecanarias.org/istac/statistical-visualizer/visualizer/data.html?resourceType=dataset&agencyId=ISTAC&resourceId=E04002B_000001&version=~latest#visualization/table (accessed on 23 June 2025).
- Agencia Estatal de Meteorología. Área de Climatología y Aplicaciones Operativas. In Olas de Calor en España Desde 1975 (Diciembre de 2024); Agencia Estatal de Meteorología: Madrid, España, 2024. Available online: https://www.aemet.es/documentos/es/conocermas/recursos_en_linea/publicaciones_y_estudios/estudios/Olas_calor/olas_calor_actualizacion_dic24.pdf (accessed on 24 June 2025).
- Dorta, P.; Marzol, M.V.; Valladares, P. Localisation et fréquence des cellules de pression dans l’Atlantique Nord, l’Europe Occidentale et le Nord de l’Afrique (1983–1992). In La Sécheresse en Méditerranée et dans les Pays Environnants; Maheras, P., Ed.; Publications de l’Association Internationale de Climatologie: Thessalonique, Grèce, 1993; Volume 6. [Google Scholar]
- Oom, D.; De Rigo, D.; Pfeiffer, H.; Branco, A.; Ferrari, D.; Grecchi, R.; Artés Vivancos, T.; Houston Durrant, T.; Boca, R.; Maianti, P.; et al. Pan-European Wildfire Risk Assessment; Publications Office of the European Union: Luxembourg, 2022; Available online: https://data.europa.eu/doi/10.2760/9429 (accessed on 15 July 2025).
- Canarias7. Las Imprudencias, Origen del 70% de los Incendios Forestales en Gran Canaria Desde 2013 Hasta Hoy. 27 July 2024. Available online: https://www.canarias7.es/canarias/gran-canaria/imprudencias-origen-incendios-forestales-gran-canaria-2013-20240727132444-nt.html (accessed on 14 July 2025).
- Consejería de Agricultura, Ganadería, Pesca y Soberanía Alimentaria del Gobierno de Canarias. Mapa de Cultivos de Canarias. 2022. Available online: https://opendata.sitcan.es/dataset/mapa-de-cultivos-de-canarias (accessed on 25 June 2025).
- GRAFCAN: Cartográfica de Canarias. Modelo Digital de Terreno (MDT) de 25x25 Metros. 2021. Available online: https://opendata.sitcan.es/dataset/modelo-digital-de-terreno-mdt-de-25x25-metros (accessed on 25 June 2025).
- Suárez-Molina, D.; Fernández-González, S.; Suárez González, J.C.; Oliver, A. Analysis of Sounding Derived Parameters and Application to Severe Weather Events in the Canary Islands. Atmos. Res. 2020, 237, 104865. [Google Scholar] [CrossRef]
- Westerling, A.L.; Gershunov, A.; Brown, T.J.; Cayan, D.R.; Dettinger, M.D. Climate and Wildfire in the Western United States. Bull. Am. Meteorol. Soc. 2003, 84, 595–604. [Google Scholar] [CrossRef]
- Turco, M.; von Hardenberg, J.; AghaKouchak, A.; Llasat, M.C.; Provenzale, A.; Trigo, R.M. On the Key Role of Droughts in the Dynamics of Summer Fires in Mediterranean Europe. Sci. Rep. 2017, 7, 81. [Google Scholar] [CrossRef]
- Martín, J.L.; Bethencourt, J.; Cuevas-Agulló, E. Assessment of Global Warming on the Island of Tenerife, Canary Islands (Spain). Trends in Minimum, Maximum and Mean Temperatures since 1944. Clim. Change 2012, 114, 343–355. [Google Scholar] [CrossRef]
- Correa, J.; López-Díez, A.; Dorta, P.; Díaz-Pacheco, J. Evolution of Warm Nights in the Canary Islands (1950–2023): Evidence for Climate Change in the Southeastern North Atlantic. Theor. Appl. Clim. 2025, 156, 87. [Google Scholar] [CrossRef]
- Lampin-Maillet, C.; Mantzavelas, A.; Galiana, L.; Jappiot, M.; Long, M.; Herrero, G.; Karlsson, O.; Iossifina, A.; Thalia, L.; Thanassis, P. Wildland Urban Interfaces, Fire Behaviour and Vulnerability: Characterization, Mapping and Assessment. In Towards Integrated Fire Management—Outcomes of the European Project Fire Paradox; Sande Silva, J., Rego, F., Fernandes, P., Rigolot, E., Eds.; European Forest Institute: Joensuu, Finland, 2010; Available online: https://hal.science/hal-00593577v1/document (accessed on 24 June 2025).
| Code | Start Date | Municipality | Island | Affected Area (ha) | Reference Meteorological Station |
|---|---|---|---|---|---|
| TF-09-1983 | 24 September 1983 | Los Realejos | Tenerife | 5895 | C447A—Tenerife North Airport (1941–2023) |
| GC-09-1988 | 10 September 1988 | San Bartolomé de Tirajana | Gran Canaria | 1000 | C649I—Gran Canaria Airport (1961–2023) |
| EH-08-1990 | 7 August 1990 | Valverde | El Hierro | 1260 | C929I—El Hierro Airport (1973–2023) |
| LP-08-1990 | 7 August 1990 | El Paso | La Palma | 1084 | C126A—El Paso (1986–2023) |
| LP-07-1994 | 12 July 1994 | Tijarafe | La Palma | 562 | C117A—Puntagorda (1986–2023) |
| LP-08-1994-1 | 7 August 1994 | Santa Cruz de La Palma | La Palma | 539.6 | C139E—La Palma Airport (1970–2023) |
| LP-08-1994-2 | 24 August 1994 | Garafía | La Palma | 562.3 | C117A—Puntagorda (1986–2023) |
| TF-07-1995 | 21 July 1995 | Candelaria | Tenerife | 931.2 | C429I—Tenerife South Airport (1980–2023) |
| LP-04-1998 | 26 April 1998 | El Paso | La Palma | 1150 | C126A—El Paso (1986–2023) |
| TF-08-1998 | 23 August 1998 | Vilaflor | Tenerife | 1101.6 | C429I—Tenerife South Airport (1980–2023) |
| LP-11-1998 | 10 November 1998 | Villa de Mazo | La Palma | 575 | C139E—La Palma Airport (1970–2023) |
| LP-07-2000 | 29 July 2000 | Garafía | La Palma | 2722.3 | C117A—Puntagorda (1986–2023) |
| LP-09-2005 | 6 September 2005 | Garafía | La Palma | 1351.4 | C117A—Puntagorda (1986–2023) |
| EH-09-2006 | 10 September 2006 | Frontera | El Hierro | 1269.1 | C929I—El Hierro Airport (1973–2023) |
| GC-07-2007 | 27 July 2007 | Mogán | Gran Canaria | 17,916.7 | C629Q—Mogán, Puerto Rico (1992–2023) and C623I—San Bartolomé Tirajana, Cuevas del Pinar (2003–2023) |
| TF-07-2007 | 30 July 2007 | Los Realejos | Tenerife | 14,364.1 | C447A—Tenerife North Airport (1941–2023) |
| LP-07-2009 | 31 July 2009 | Villa de Mazo | La Palma | 3037.5 | C139E—La Palma Airport (1970–2023) |
| TF-07-2012 | 15 July 2012 | Vilaflor | Tenerife | 6277.8 | C429I—Tenerife South Airport (1980–2023) |
| LP-08-2012 | 4 August 2012 | Villa de Mazo | La Palma | 2698.2 | C139E—La Palma Airport (1970–2023) |
| LG-08-2012 | 4 August 2012 | Valle Gran Rey | La Gomera | 3961.9 | C317B—Agulo (1986–2023) and C314Z—Vallehermoso, Alto Igualero (2009–2023) |
| LP-08-2016 | 3 August 2016 | El Paso | La Palma | 4864 | C126A—El Paso (1986–2023) |
| GC-09-2017 | 20 September 2017 | Tejeda | Gran Canaria | 2446.9 | C656V—Teror (1988–2023) and C614H—Tejeda (2017–2023) |
| GC-08-2019 | 17 August 2019 | Valleseco | Gran Canaria | 9783.2 | C656V—Teror (1988–2023) |
| LP-08-2020 | 21 August 2020 | Garafía | La Palma | 1178 | C117A—Puntagorda (1986–2023) |
| TF-05-2021 | 20 May 2021 | Arico | Tenerife | 3087.9 | C429I—Tenerife South Airport (1980–2023) and C423R—Picacho (2014–2023) |
| TF-07-2022 | 21 July 2022 | Los Realejos | Tenerife | 2752.9 | C447A—Tenerife North Airport (1941–2023) and C458U—Palo Blanco (2014–2023) |
| LP-07-2023 | 15 July 2023 | Puntagorda | La Palma | 3301.4 | C117A—Puntagorda (1986–2023) |
| TF-08-2023 | 15 August 2023 | Arafo | Tenerife | 13,977.1 | C447A—Tenerife North Airport (1941–2023) and C436I—Toponegro (2014–2023) |
Disclaimer/Publisher’s Note: The statements, opinions and data contained in all publications are solely those of the individual author(s) and contributor(s) and not of MDPI and/or the editor(s). MDPI and/or the editor(s) disclaim responsibility for any injury to people or property resulting from any ideas, methods, instructions or products referred to in the content. |
© 2025 by the authors. Licensee MDPI, Basel, Switzerland. This article is an open access article distributed under the terms and conditions of the Creative Commons Attribution (CC BY) license (https://creativecommons.org/licenses/by/4.0/).
Share and Cite
Correa, J.; Dorta, P. Assessment of Large Forest Fires in the Canary Islands and Their Relationship with Subsidence Thermal Inversion and Atmospheric Conditions. Geographies 2025, 5, 37. https://doi.org/10.3390/geographies5030037
Correa J, Dorta P. Assessment of Large Forest Fires in the Canary Islands and Their Relationship with Subsidence Thermal Inversion and Atmospheric Conditions. Geographies. 2025; 5(3):37. https://doi.org/10.3390/geographies5030037
Chicago/Turabian StyleCorrea, Jordan, and Pedro Dorta. 2025. "Assessment of Large Forest Fires in the Canary Islands and Their Relationship with Subsidence Thermal Inversion and Atmospheric Conditions" Geographies 5, no. 3: 37. https://doi.org/10.3390/geographies5030037
APA StyleCorrea, J., & Dorta, P. (2025). Assessment of Large Forest Fires in the Canary Islands and Their Relationship with Subsidence Thermal Inversion and Atmospheric Conditions. Geographies, 5(3), 37. https://doi.org/10.3390/geographies5030037