Abstract
Sustainable Development Reserves are organized units in the Amazon that are essential for the proper use and sustainable management of the region’s natural resources and for the livelihoods and economy of the local communities. This study aims to provide a climatic characterization of the Madeira River Sustainable Development Reserve (MSDR), offering scientific support to efforts to assess the feasibility of implementing adaptation measures to increase the resilience of isolated Amazon communities in the face of extreme climate events. Significant statistical analyses based on time series of observational and reanalysis climate data were employed to obtain a detailed diagnosis of local climate variability. The results show that monthly mean two-meter temperatures vary from 26.5 °C in February, the coolest month, to 28 °C in August, the warmest month. Monthly precipitation averages approximately 250 mm during the rainy season, from December until May. July and August are the driest months, August and September are the warmest months, and September and October are the months with the lowest river level. Cold spells were identified in July, and warm spells were identified between July and September, making this period critical for public health. Heavy precipitation events detected by the R80, Rx1day, and Rx5days indices show an increasing trend in frequency and intensity in recent years. The analyses indicated that the MSDR has no potential for wind-energy generation; however, photovoltaic energy production is viable throughout the year. Regarding the two major commercial crops and their resilience to thermal stress, the region presents suitable conditions for açaí palm cultivation, but Brazil nut production may be adversely affected by extreme drought and heat events. The results of this study may support research on adaptation strategies that includethe preservation of local traditions and natural resources to ensure sustainable development.
1. Introduction
A Sustainable Development Reserve is a category of conservation unit in Brazil in which the sustainable development of local communities is encouraged along with environmental preservation. Combining the preservation of local traditions and local natural resources with socioeconomic development is challenging. The state of Amazonas alone contains more than 34 reserves. These reserves, given the increase in the human population, play an important role in the maintenance of local biodiversity [1].
The Madeira River Sustainable Development Reserve (MSDR) extends for over 100 km along the banks of the Madeira River, covering an area of more than 283,000 hectares. The Madeira River is one of the major tributaries of the Amazon River, with a total length of 3240 km. The reserve was established to contribute to the conservation of its fauna and flora and, consequently, to the subsistence of communities living in the area. In the region, the vegetation is mainly classified as an Amazon Forest biome, encompassing Lowland Dense Ombrophilous Forest (77.2%), Alluvial Dense Ombrophilous Forest (13.6%), Pioneer Formation with Fluvial Influence (4.7%) and Savanna Vegetation (0.6%), with anthropized areas and water bodies accounting for 3.9% [2].
The region’s climate is characterized by a monsoonal regime [3]. A study of the spatial variability of precipitation in the Madeira Basin area found that the northern portion of the basin, where the reserve is located, has the most precipitation compared to the rest of the Basin [4]. Studies [5] show that this pattern is directly influenced by large-scale meteorological events, such as the El Niño-Southern Oscillation (ENSO).
The Am climate type, according to the Köppen classification, features a season of intense precipitation followed by a long dry season [6]. Monthly mean precipitation varies from the maximum of about 350 mm in January, February, and March to the minimum of about 50 mm in July. Temperatures in the MSDR vary from the minimum average of 21.7 °C in July to the maximum average of 34.4 °C in August [2]. The largest temperature amplitude occurs during the driest months because of reduced cloud cover and increased solar radiation.
These average values were obtained from 10-year weather station data at the border of the MSDR. In addition to the average conditions, climate variability, climate extremes, and the detection of trends in a changing climate are information that can be strategically employed for the planning of long-term sustainable use of the local natural resources. This work aims to characterize the climate variability and trends in the climate extremes in the MSDR to support planning for the sustainable socioeconomic development of the reserve. The climate analyses are based on precipitation, temperature, wind, radiation, and river level. These are essential climate variables that can support studies on local water resources, energy, agriculture, fisheries, and health risks.
Multiple datasets were gathered to produce clearer information about the MSDR. The proposed methodology is expected to be applicable to other Sustainable Development Reserves in the Amazon region, promoting the investigation of regional climatic stress indicators and the dissemination of climate knowledge to local populations.
2. Materials and Methods
2.1. Study Area
Located in the Madeira River Basin (Figure 1), the MSDR covers the municipalities of Borba (45.85%), Manicoré (15.32%), and Novo Aripuanã (38.83%). In the state of Amazonas, the MSDR is located at an elevation of approximately 30 m. The biome is classified as a typical Amazon forest, with high biodiversity [2]. The cash crops are the fruits from the açaí palm (Euterpe oleracea),Brazil nuts (Bertholletia excelsa), timber, bananas, copaiba (Copaifera langsdorffii) oil, and cumaru (Dipteryx odorata) essence. However, more than 816 inhabitant families in a total of 43 communities (0.11 inhabitants/km2) earn their livelihood from ecotourism in the region [2,7,8].
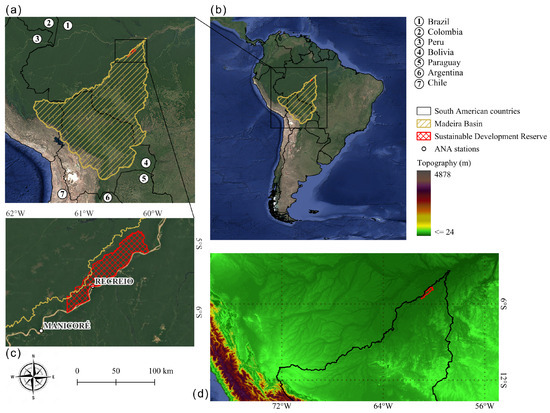
Figure 1.
(a) The Madeira River Basin (yellow hashed lines) and the surrounding countries (borders in black lines), (b) location of the Basin and the Reserve within South America, (c) location of the Madeira River Sustainable Development Reserve (red criss-cross lines) in Brazil, and (d) elevation map of the Basin and the Reserve, with color-shaded relief derived from a digital elevation model (DEM) obtained from Shuttle Radar Topography Mission (SRTM) data, at a 3 arc-second (approximately 90 m) resolution [9].
2.2. Observational Data
In this study, we consider datasets of daily precipitation, and temperature (daily average, daily minimum, and daily maximum) measured at Recreio weather station, which is maintained by the Brazilian National Meteorological Institute (INMET), and river flow measured at Manicoré river gauge, which is maintained by the National Water and Sanitation Agency (ANA). In addition, due to the scarcity of observational data for the region, this study employs reanalysis data generated from remote sensing and assimilated by numerical models [10] for variables not measured at the Recreio weather station. Solar radiation and wind at 10 and 100 m are from the ERA5 Reanalysis (the Fifth Generation European Centre for Medium-Range Weather Forecasts-ECMWF Reanalysis), extracted from the Copernicus database [11]. Table 1 lists the variables used and the corresponding period for each. Notably, this study covers a longer and more recent period of observations than [2].

Table 1.
Description of the climate variables. The sources of observational data for the station data are ANA and INMET. ERA5 derives from reanalysis data.
Based on the variables listed in Table 1, some extreme events and their trends were captured by calculating some of the climate indices (Table 2). These indices are those defined and proposed by the Expert Team on Climate Change Detection and Indices (ETCCDI) and promoted by the World Meteorological Organization (WMO) [12,13,14]. Precipitation indices such as Rx5days, R80, and R100 indicate severe rainfall events, which are often linked to natural disasters. The Rx5days index represents the accumulated amount of precipitation in 5 days, which may relate to the occurrence of floods and river erosions, events that represent the major concern in the region [14,15,16,17,18,19].
Table 2.
Indices of Climate Extremes.
Consecutive Dry Days (CDD) and the Standardized Precipitation Index (SPI) are used to represent the behavior of extreme dry events in the region over the years, allowing for the assessment of agricultural impacts. The SPI can be applied at different time scales, with values below −1 indicating drought conditions and values above +1 indicating excess precipitation [20].
Temperature indices such as Cold Spell Duration Index (CSDI) and Warm Spell Duration Index (WSDI) provide the maximum number of at least 6 days with minimum temperatures below the 10th percentile and maximum temperatures above the 90th percentile. Detailed information about the methods can be accessed on [14,21].
Non-parametric statistical tests were applied at the 95% significance level to assess the temporal trend of the extreme events. Trend analysis was conducted using the Mann–Kendall test, and the magnitude of the trend was estimated using Sen’s Slope Estimator. The Sen estimator is generally more robust than other tests, as it can be calculated despite outliers and missing data, yielding a stronger estimator compared to other methods [22,23,24].
3. Results
3.1. Annual Cycle of Climate Variables
Figure 2 presents boxplots of the variables listed in Table 1, illustrating the monthly climatic history over a 30-year period, including variability and extremes. Regarding the mean daily air temperature (Figure 2a), the highest values are recorded in August, and the lowest in February. A reduction in temperature amplitude is observed during the cooler months, from January to June, with average values around 26.5 °C. In contrast, greater amplitudes occur during the warmer months, from July to December, with cooler and warmer temperatures around 26 °C and 28.7 °C, respectively, and average temperatures around 27 °C. The presence of outliers indicates that warm spells are more frequent in October and November, while cold spells may occur only in May.
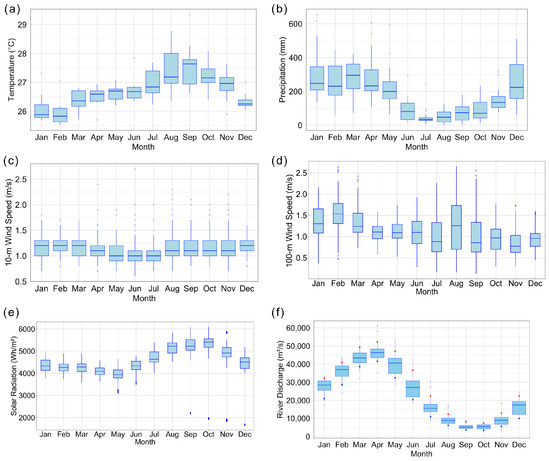
Figure 2.
Boxplots of (a) 2-m temperature (°C), (b) precipitation (mm), (c) 10-m wind speed (m/s), (d) 100-m wind speed (m/s), (e) solar radiation (Wh/m2), and (f) river discharge (m3/s). The thick dash line in the center blue bars indicates the mean, and the vertical blue line represents represent the variability of the values. Red and blues dots in (f) represents the 10th and the 90th percentile of the river flow. Outliers lie outside the boxplot whiskers. See Table 1 for details.
The most monthly precipitation (Figure 2b) occurs in March, one month after the minimum temperatures, while the least precipitation is recorded in July, one month before the temperature peak. Greater variability is observed during the wet months, especially in December, while reduced variability characterizes the dry months. Monthly extreme-precipitation events were recorded in January, as well as in April and May.
Wind speeds at 10 m (Figure 2c) are generally low, ranging from 1.0 to 1.5 m/s, with little variation throughout the year. Even the outliers rarely exceed 2.5 m/s, indicating extremely weak near-surface winds. The annual cycle of 100-m wind speed (Figure 2d) shows slightly stronger winds, averaging around 2.0 m/s, though these are still considered light.
Throughout the year, the MSDR receives more than 4000 Wh/m2 of solar energy (Figure 2e). Solar radiation peaks in August, September, and especially October, during the driest period of the year. The least radiation occurs between March and May. It is noteworthy that the minimum outlier values for radiation are found only between September and December.
River discharges (Figure 2f) are highest between March and May and lowest between August and October. The peak discharge occurs in April, exceeding 45,000 m3/s. Anomalously high discharge events, above the 90th percentile, were recorded in March, April, July, August, and November. Interestingly, discharge events below the 10th percentile occurred during the wet season, from January to April.
3.2. Annual Cycle of Extreme Climate Indices
Figure 3a shows that the coolest nights occur in July and August, when median temperatures range between approximately 19 °C and 20 °C. Outliers of extremely cold events are observed especially during these two months, with minimum temperatures reaching around 17 °C and 17.5 °C. Cold waves, as indicated by the CSDI, are defined by the persistence of cold days (at least 6 consecutive days) (Figure 3b). These events are recorded in June, July, and August but are most prominent in July, when an extreme cold spell lasting nearly 10 days was observed.
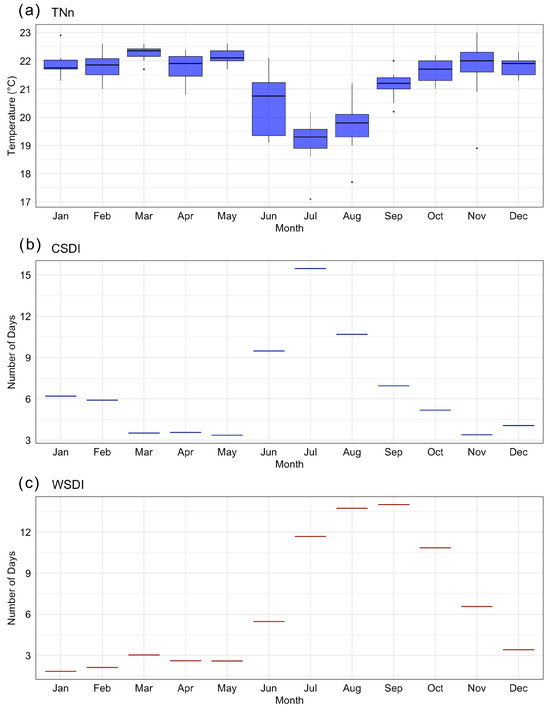
Figure 3.
Boxplot of the extreme-minimum-temperature indicator (a) TNn. Number of days with (b) cold spells (CSDI) and (c) warm spells (WSDI). See Table 2 for index definitions.
Heat waves in the region, as indicated by the WSDI (Figure 3c), occur most frequently in August and September, with durations exceeding 12 consecutive days. Throughout the year, they are observed in July, August, September, and October, these being months associated with higher temperatures. July and August exhibit the greatest numbers of both cold and hot days, marking them as the months with the most frequent extreme events, which also coincide with the lowest humidity levels.
3.3. Frequency Distribution
Figure 4 presents different frequency distributions for four types of variables. The precipitation frequency distribution indicates that the most common rainfall events are of low intensity, around 10 mm/day, although some high-intensity rainfall events, though less frequent, are also recorded (Figure 4a). Approximately 45% of the time, 2-m temperatures in the Reserve range between roughly 24 °C and 26 °C (Figure 4b); surprisingly, the 2-m temperature does not follow a normal distribution.
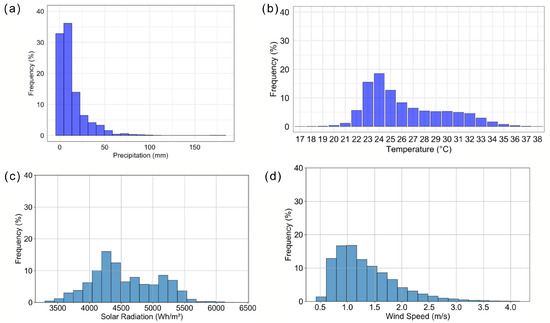
Figure 4.
Frequency distribution (%) of (a) daily precipitation (mm/day), (b) 2-m temperature (°C), (c) surface solar radiation (Wh/m2), and (d) 100-m wind speed (m/s).
3.4. Trends in Extremes
Figure 5 shows that one-day extreme rainfall (Rx1day) has become increasingly intense in recent years, with events reaching approximately 170 mm in 2017 and around 190 mm in 2018. A similar trend is observed for five-day accumulated rainfall events (Rx5days), with totals reaching 320 mm in 2018 (Figure 5a). Both indices exhibit significant increasing trends in the period (Table 3): approximately +1.41 mm and +3.32 mm for Rx1day and Rx5days, respectively.
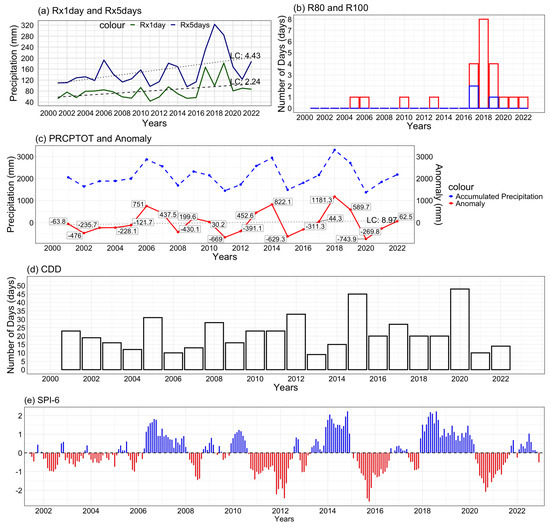
Figure 5.
Indicators of Extreme Precipitation: (a) Rx1day (green) and Rx5days (blue), (b) R80 (red) and R100 (blue), (c) PRCPTOT (blue) and PRCPTOT Anomaly (red), (d) CDD, and (e) SPI-6. Blue lines indicate wet conditions, while red lines represent dry conditions. Significant linear trends and coefficient values (LC) are shown with dashed lines (a,c). See Table 2 for details on the indices.
Table 3.
Trends in climate-change indicators. Statistical trend analysis based on the Mann–Kendall test at the 95% confidence level.
The frequency of more intense rainfall events (above 80 mm and 100 mm, referred to as R80 and R100, respectively) has increased in recent years. Few extreme precipitation events (above 80 mm and 100 mm) were recorded before 2015. Around 2018, the number of days with extreme rainfall events (up to 8 days exceeding 100 mm) increased significantly (Figure 5b).
Moreover, a slight positive trend can be observed in total annual precipitation (Figure 5c). It is worth noting the increase in precipitation variability, as evidenced by the increasing amplitude of precipitation anomalies over the years.
In the analysis of drought-related indices such as CDD (Figure 5d), the highest values of consecutive dry days are observed in the years 2015 and 2020, which are also the years with the lowest PRCPTOT records. The SPI-6 (Figure 5e) reflects drought conditions on a six-month cumulative scale. The use of the SPI-6 index is consistent with the 6-month length of the wet and dry seasons in near-equatorial regions like that where the Sustainable Development Reserve is located.
The index registers the highest values during the same period when the most extreme events occurred (2018). The years 2014 and 2018 are identified as the most extremely wet, consistent with other indices (Rx1day, Rx5days, R80, and PRCPTOT). The driest periods are concentrated in the years 2005, 2008, 2012, 2015, and 2020, aligning with the most extreme CDD values, indicating the occurrence of droughts in the region. A predominance of dry events is observed, along with an increase in the frequency of extreme rainfall events, which are particularly concentrated in recent years. Both indices exhibited nonsignificant increasing trends (Table 3).
4. Discussion
In a changing climate, investigating trends in climatic conditions can highlight the need to implement adaptation measures to maintain a sustainable economy and good living conditions [25]. Anomalous temperature events recorded in the region, particularly in 2007, 2008, 2011, 2017, and 2018, were classified individually as non-harmful to the health of the local population; however, an increase in the frequency and intensity of heat waves throughout the historical series of climate indices presents health risks to the inhabitants of the Reserve [5,26,27,28].
The period encompassing the warm spells in the region was also consistent with fire hotspot data released by the National Institute for Space Research (INPE). During the period from 1998 to 2023, records confirmed the highest concentration of fire hotspots between July and November in the Amazon region. In the MSDR, a total of 29 fire hotspots were recorded between June 2023 and June 2024, and 43 between June 2024 and June 2025. All hotspots in both periods occurred between July and November [8]. The highest temperatures were observed in August and September, the months that experienced the most intense warm spells in the Reserve area [2].
Regarding cold-wave events, residents in the reserve area may suffer from cold conditions, leading to serious health problems given the lack of preparedness of forest communities for such extremes. The frequency and intensity of these cold waves were reported by [2], who identified the lowest minimum temperatures as occurring between June and August. These cold waves are caused by strong cold front passages that reach lower latitudes during the month of July [29].
Studies have shown that changes in rainfall patterns during drier and warmer years, in association with El Niño events, may lead to a reduction in Brazil nut production; in drought years, the production of Brazil nuts can drop by 37% [30,31]. Brazil nuts are one of the main agricultural products traded (in 21 out of 43 communities within MSDR, for a frequency of 55%), along with açaí, which accounts for 37% of the total production of Non-Timber Forest Products (NTFPs) intended for food and commercial purposes in the region. The 2015/2016 El Niño event, as reflected in the negative SPI-6 values, led to a sharp decline in Brazil nut production in 2017, as assessed in the study by [30], which monitored production over the years in the eastern Amazon. Ref. [30] observed better Brazil nut production in years of ENSO neutrality or La Niña conditions.
While the 2023 drought event in the Amazon occurred during a Pacific equatorial La Niña between November 2022 and February 2023 [32], the drought of the following year, in 2024, occurred during a Pacific El Niño. In both years, the Tropical Northern Atlantic showed strong warm anomalies. Therefore, major ENSO events do not totally explain the droughts in the region. Ref. [10] showed that precipitation variability in the Madeira river basin is weakly negatively correlated with the El Niño 3.4 index. Monitoring river discharge levels is key for the transportation of food and various commercial products by the communities in the Reserve [33].
For a sustainable development, the MSDR requires locally generated renewable energy sources. The winds from the ERA5 dataset were weak at both 10 and 100 m. Wind turbines generally require wind speeds above 4 or 6 m/s. Therefore, based on this dataset, the MSDR site is unsuitable for the development of a wind power plant [34]. On the other hand, the high solar radiation reaching the MSDR site, especially between August and October, when cloud formation is minimal in the reserve, makes photovoltaic energy a strong alternative for power generation there [35].
Several studies of the Madeira River Basin, such as those by [10,36], have indicated the influence of climate change on increasing flow intensities and the frequency of climatic extremes. The substantial increase in river flows reported by [10,27], for example, corroborates the association of climate change with extreme flooding events.
However, these flows should be analyzed cautiously, since the Madeira River hosts two large upstream hydroelectric plants that play a fundamental role in regulating river flows and levels. Ref. [37] support research aimed at improving numerical climate and hydrological forecasts to minimize the impacts of climatic and hydrological extremes.
The temperature range in the MSDR encompasses the thermal limits suitable for açaí cultivation, which range approximately from 12 °C to 33 °C [7]. Winds at 100 m are insufficient for wind-energy production in the Reserve. Regarding extremes, a general increasing trend in precipitation events has been observed in the MSDR, especially for RX1day, Rx5days, and R80, which showed significant positive trends. As noted in other studies [4,38], the number of days with extreme precipitation in the Madeira River Basin has increased in recent years.
Based on these data, 2018 was a particularly rainy year, showing significant outlier values across all precipitation metrics and the highest SPI-6 values among analyzed years. In contrast, ref. [10] found a trend toward decreasing flow in rivers in the northern Madeira River Basin. This finding highlights the importance of monitoring future precipitation in the Reserve area, as it remains uncertain whether the increasing or decreasing trend will persist. Climate projections for the Reserve area under the scenarios of global climate change are recommended to assess the trends in climate extremes and the risks that may arise due to climate change.
5. Conclusions
This study provides climatic information to support the management of the Madeira River Sustainable Development Reserve, one of Brazil’s Conservation Units. The information presented includes climatic variables essential for planning adaptation measures, such as temperature, precipitation, solar radiation, wind, and extreme indices of temperature and precipitation. Median values, dispersion, outliers, frequency distribution, and trends in some of these climate variables were analyzed.
The study characterizes climatological features in the MSDR. The analysis is intended to raise awareness of the impacts of climate variability and extremes on activities including agriculture, health monitoring, river transportation, and renewable-energy planning. This study represents an essential step in detailing the Reserve’s climatic state, analyzing future trends, and maintaining sustainable livelihoods and economy in the region.
The updated observational dataset reveals that the median temperature in the MSDR ranges between 26.5 °C in February (the coldest month) and 28 °C in August (the warmest month). Additionally, outliers representing extreme events were identified. As precipitation reaches its minimum between July and August, temperature peaks between August and September, and the lowest river flow follows between September and October. The latter is a critical period for activities in the MSDR because precipitation reduction occurs together with extreme high temperatures and low river levels.
Another concern in the region is the frequency of extreme climatic conditions. Our findings highlight an increase in extreme meteorological events that may have contributed to flood occurrences. Besides precipitation events, persistent extreme temperatures resulting in cold or heat waves occur more frequently between July and September, requiring greater preparedness on the part of the local health system.
The MSDR presents ideal conditions for açaí production, as the crop’s base temperatures fall within the observed temperature range in the Reserve. Conversely, Brazil nut production may have been negatively affected during years of extreme drought and high temperatures, as indicated by outlier events in the boxplots. Brazil nuts and açaí are the two major cash crops in most of the Amazon communities and in the MSDR. The productivity of the nut and açaí palm trees is strongly dependent on water availability.
Regarding local production of renewable energy, wind speeds at 10 m and above the canopy (100 m) were low and unsuitable for operating wind turbines. On the other hand, the MSDR receives solar radiation exceeding 4000 Wh/m2 throughout the year, making it potentially highly productive for the generation of photovoltaic energy.
The analysis presented can support planning and management of water, energy, and agricultural resources in the Reserve, and the methodology can be applied to other specific areas of interest. Station data are very sparse in the Amazon. The observations used in this study are from the single weather station installed in the Reserve. Despite the limited representativeness of the data, useful climatic insights can be derived to support Reserve management.
Future climate projections for the MSDR should complement this study to support planning for adaptation aimed at sustainable development in the Reserve.
Author Contributions
Conceptualization, S.C.C., M.G.T., N.C.L., G.S.M., and F.W.C.; methodology, M.G.T., S.C.C., N.C.L., P.d.S.T., and J.L.G.; software, M.G.T., N.C.L., and P.d.S.T.; validation, M.G.T., S.C.C., N.C.L., P.d.S.T., and J.L.G.; formal analysis, M.G.T., N.C.L., P.d.S.T., S.C.C., and J.L.G.; investigation, M.G.T., N.C.L., S.C.C., J.A.M., and J.L.G.; resources, M.G.T., N.C.L., and P.d.S.T.; data curation, M.G.T., N.C.L., and S.C.C.; writing—original draft preparation, M.G.T., N.C.L., P.d.S.T., S.C.C., J.A.M., and J.L.G.; writing—review and editing, M.G.T., N.C.L., P.d.S.T., J.A.M., J.L.G., S.C.C., G.S.M., and F.W.C.; visualization, M.G.T., N.C.L., and P.d.S.T.; supervision, S.C.C.; project administration, S.C.C., and F.W.C.; funding acquisition, S.C.C., and F.W.C. All authors have read and agreed to the published version of the manuscript.
Funding
The authors are thankful for the support from the Coordenação de Aperfeiçoamento de Pessoal de Nível Superior (CAPES) Finance Code 001, and the CAPES grant 88881.688972/2022-01. This work was also supported jointly by FAPESP grant 2020/08796-2 and FAPEAM grant 01.02.016301.00268/2021. S.C. Chou thanks CNPq for grant 312742/2021-5.
Data Availability Statement
The raw data supporting the conclusions of this article will be made available by the authors on request.
Conflicts of Interest
The authors declare no conflicts of interest.
References
- Souza, V.A.S.D.; Rotunno Filho, O.C.; Rodriguez, D.A.; Moreira, D.M.; Rudke, A.P.; Andrade, C.D. Dinâmica da conversão de floresta e tendências climáticas na bacia do rio Madeira. Ciênc. Florest. 2022, 32, 2007–2034. [Google Scholar] [CrossRef]
- Governo do Estado do Amazonas. Plano de Gestão da Reserva de Desenvolvimento Sustentável do Rio Madeira; Série Técnica Planos de Gestão; Secretaria do Estado do Meio Ambiente e Desenvolvimento Sustentável/Centro Estadual de Unidades de Conservação: Novo Aripuanã, Brazil, 2014; Volume I. Available online: https://pdfhost.io/v/l~HCQy6hg_Plano_de_Gestao_RDS_Rio_Madeira_volume_Ipdf.pdf (accessed on 20 June 2024).
- Cavalcanti, I.F.; Souza, D.C.; Kubota, P.Y.; Coelho, C.A.S.; Figueroa, S.N.; Baker, J.C.A. The global monsoon system representation in BAM-v1.2 and HadGEM3 climate simulations. Int. J. Climatol. 2022, 42, 8089–8111. [Google Scholar] [CrossRef]
- Peña, C.A.S.; Panduro, I.L.V.; Araújo, L.M.N.; Barbosa, H.A.; Filho, O.C.R.; Marques, M.C.S.; Pereira, W.J.X.; Rodriguez, D.A. Análise Espacial de Eventos Extremos na Bacia do Rio Madeira. In Proceedings of the XXIII Simpósio Brasileiro de Recursos Hídricos, Foz do Iguaçu, Brasil, 24–28 November 2019; pp. 1–9. Available online: https://anais.abrhidro.org.br/job.php?Job=5507 (accessed on 16 December 2024).
- Clarke, B.; Barnes, C.; Rodrigues, R.; Zachariah, M.; Stewart, S.; Raju, E.; Baumgart, N.; Heinrich, D.; Libonati, R.; Santos, D.; et al. Climate Change, Not El Niño, Main Driver of Exceptional Drought in Highly Vulnerable Amazon River Basin; Grantham Institute for Climate Change: London, UK, 2024; 143p, Available online: http://hdl.handle.net/10044/1/108761 (accessed on 11 March 2025).
- Alvares, C.A.; Stape, J.L.; Sentelhas, P.C.; Gonçalves, J.L.d.; Sparovek, G. Köppen’s Climate Classification Map for Brazil. Meteorol. Z. 2013, 22, 711–728. Available online: https://www.schweizerbart.de/papers/metz/detail/22/82078/Koppen_s_climate_classification_map_for_Brazil?af=crossref (accessed on 25 July 2024). [CrossRef] [PubMed]
- Sousa, D.D.P.; Frare, J.C.V.; Farias, V.D.D.S.; Nunes, H.G.G.C.; Martins, M.S.; de Lima, A.F.T.; Tavares, L.B.; Costa, D.L.P.; Lima, M.J.A.d.; de Carvalho, C.J.R.; et al. Acai palm base temperatures and thermal time requirements in eastern Amazon. Pesquisa Agropecuária Brasileira 2022, 57, e01667. [Google Scholar] [CrossRef]
- UCB. Reserva de Desenvolvimento Sustentável. 2024. Available online: https://uc.socioambiental.org/pt-br/arp/4773 (accessed on 13 March 2025).
- Jarvis, A.; Guevara, E.; Reuter, H.I.; Nelson, A.D. Hole-Filled SRTM for the Globe: Version 4: Data Grid. CGIAR Consortium for Spatial Information. 2008. Available online: https://srtm.csi.cgiar.org/ (accessed on 18 April 2025).
- Laureanti, N.C.; Tavares, P.D.S.; Tavares, M.; Rodrigues, D.C.; Gomes, J.L.; Chou, S.C.; Correia, F.W.S. Extreme seasonal droughts and floods in the Madeira River Basin, Brazil: Diagnosis, causes, and trends. Climate 2024, 12, 111. [Google Scholar] [CrossRef]
- Hersbach, H.; Bell, B.; Berrisford, P.; Hirahara, S.; Horányi, A.; Muñoz-Sabater, J.; Nicolas, J.; Peubey, C.; Radu, R.; Schepers, D.; et al. The ERA5 global reanalysis. Q. J. R. Meteorol. Soc. 2020, 146, 1999–2049. [Google Scholar] [CrossRef]
- ETCCDI. ETCCDI Climate Change Indices. 2024. Available online: https://etccdi.pacificclimate.org/indices.shtml (accessed on 23 April 2025).
- Karl, T.R.; Nicholls, N.; Ghazi, A. Clivar/GCOS/WMO Workshop on Indices and Indicators for Climate Extremes Workshop Summary. Clim. Change 1999, 42, 3–7. [Google Scholar] [CrossRef]
- Camarinha, P.I. Relatório Final das Análises Climáticas para a Baixada Santista Considerando Dados Observados e Modelagem do Clima Futuro. MunicípiosPaulistas Resilientes. 2021. Available online: https://smastr16.blob.core.windows.net/home/2022/02/relatorio-final-baixada-santista-out_2021_completo-23.02.pdf (accessed on 18 July 2024).
- Santos, C.A.C.D.; Satyamurty, P.; Santos, E.M.D. Tendências de índices de extremos climáticos para a região de Manaus-AM. Acta Amaz. 2012, 42, 329–336. [Google Scholar] [CrossRef]
- CEPED (Centro Universitário De Estudos E Pesquisas Sobre Desastres). Atlas Brasileiro de Desastres Naturais: 1991–2012. 2013. Available online: https://educacao.cemaden.gov.br/wp-content/uploads/2017/07/atlas_brasileiro_desastres_naturais.pdf (accessed on 20 April 2025).
- Cortez, B.N.; Pires, G.F.; Avila-Diaz, A.; Fonseca, H.P.; Oliveira, L.R. Nonstationary extreme precipitation in Brazil. Hydrol. Sci. J. 2022, 67, 1372–1383. [Google Scholar] [CrossRef]
- Teixeira, D.B.S.; Cecílio, R.A.; Moreira, M.C.; Pires, G.F.; Filho, E.I.F. Recent advancements in rainfall erosivity assessment in Brazil: A review. CATENA 2022, 219, 106572. Available online: https://www.sciencedirect.com/science/article/pii/S0341816222005586?via%3Dihub (accessed on 17 April 2025). [CrossRef]
- Soldini, L.; Darvini, G. Variation in the Extreme Temperatures and Related Climate Indices for the Marche Region, Italy. Climate 2025, 13, 58. [Google Scholar] [CrossRef]
- McKee, T.B.; Doesken, N.J.; Kleist, J.; The Relationship of Drought Frequency and Duration to Time Scales. Eighth Conference on Applied Climatology. 1993. Available online: https://www.droughtmanagement.info/literature/AMS_Relationship_Drought_Frequency_Duration_Time_Scales_1993.pdf (accessed on 8 August 2024).
- Alexander, L.V.; Zhang, X.; Peterson, T.C.; Caesar, J.; Gleason, B.; Tank, A.M.G.K.; Haylock, M.; Collins, D.; Trewin, B.; Rahimzadeh, F.; et al. Global observed changes in daily climate extremes of temperature and precipitation. J. Geophys. Res. Atmos. 2006, 111, D05109. [Google Scholar] [CrossRef]
- Mann, H. Nonparametric Tests Against Trend. Econometrica 1945, 13, 245–259. Available online: https://www.jstor.org/stable/1907187 (accessed on 10 July 2025). [CrossRef]
- Kendall, M.G. Rank Correlation Methods. In Econometrica, 4th ed.; Charles Griffin: London, UK, 1975; Available online: https://archive.org/details/rankcorrelationm0000kend (accessed on 10 July 2025).
- Sen, P.H. Estimates of the regression coefficient based on Kendall’s Tau. J. Am. Stat. Assoc. 1968, 63, 1379–1389. Available online: https://www.tandfonline.com/doi/abs/10.1080/01621459.1968.10480934 (accessed on 11 July 2025). [CrossRef]
- Chen, C.; Kirabaeva, K.; Kolerus, C.E.; Parry, I.; Vernon, N. Changing Climate in Brazil: Key Vulnerabilities and Opportunities; International Monetary Fund: Washington, DC, USA, 2024; Volume 185, Available online: https://ssrn.com/abstract=4946567 (accessed on 11 July 2025). [CrossRef]
- Herraiz, A.D.; de Alencastro Graça, P.M.L.; Fearnside, P.M. Amazonian flood impacts on managed Brazilnut stands along Brazil’s Madeira River: A sustainable forest management system threatened by climate change. For. Ecol. Manag. 2017, 406, 46–52. [Google Scholar] [CrossRef]
- Gomes, D.C.; Ferreira, N.S.; Lima, A.M.M.; Serrao, E.A.O. Variabilidade Espaço-Temporal da Precipitação: Bacia Hidrográfica do Rio Madeira. Rev. Geogr. Acad. 2019, 13, 90–104. Available online: https://biblat.unam.mx/hevila/Revistageograficaacademica/2019/vol13/no1/6.pdf (accessed on 17 July 2024).
- Silva, N.D.S.; Alves, J.M.B.; Silva, E.M.D.; de Sousa, G.M. Ocorrência de ondas de calor com dados de reanálises em áreas do nordeste, Amazônia e centro-sudeste do Brasil. Rev. Bras. Meteorol. 2023, 37, 441–451. [Google Scholar] [CrossRef]
- Viana, L.P.; Herdies, D.L. Estudo de Caso de um Evento Extremo de Incursão de Ar Frio em Julho de 2013 sobre a Bacia Amazônica Brasileira. Rev. Bras. Meteorol. 2018, 33, 27–39. [Google Scholar] [CrossRef]
- Pastana, D.N.B.; Modena, E.D.S.; Wadt, L.H.D.O.; Neves, E.d.; Martorano, L.G.; Guedes, A.C.L.; Souza, R.L.d.; Costa, F.F.; Batista, A.P.B.; Guedes, M.C. Strong El Niño reduces fruit production of Brazil-nut trees in the eastern Amazon. Acta Amaz. 2021, 51, 270–279. [Google Scholar] [CrossRef]
- Meir, P.; Madeira, T.E.; Galbraith, D.R.; Brando, P.M.; Costa, A.C.L.D.; Rowland, L.; Ferreira, L.V. Threshold Responses to Soil Moisture Deficit by Trees and Soil in Tropical Rain Forests: Insights from Field Experiments. BioScience 2015, 65, 882–892. [Google Scholar] [CrossRef] [PubMed]
- Espinoza, J.C.; Jimenez, J.C.; Marengo, J.A.; Schongart, J.; Ronchail, J.; Lavado-Casimiro, W.; Ribeiro, J.V.M. The new record of drought and warmth in the Amazon in 2023 related to regional and global climatic features. Sci. Rep. 2024, 14, 8107. [Google Scholar] [CrossRef] [PubMed]
- Depetris, P.J. The Importance of Monitoring River Water Discharge. Front. Water 2021, 3, 745912. [Google Scholar] [CrossRef]
- Amarante, O.A.C.; Zack, M.B.J.; Sá, A.L. Atlas do Potencial Eólico Brasileiro, 1st ed.; Centro de Referência para Energia Solar e Eólica (CRESESB): Brasília, Brazil, 2001; 45p, Available online: https://cresesb.cepel.br/index.php?section=publicacoes&task=livro (accessed on 15 July 2025).
- Pereira, E.B.; Martins, F.R.; Gonçalves, A.R.; Costa, R.S.; Lima, F.J.L.; Rüther, R.; Abreu, S.L.; Tiepolo, G.M.; Pereira, S.V.; Souza, J.G. Atlas Brasileiro de Energia Solar, 2nd ed.; INPE: São José dos Campos, Brazil, 2017; 80p. [Google Scholar]
- Júnior, J.S.; Tomasella, J.; Rodriguez, D.A. Impacts of future climatic and land cover changes on the hydrological regime of the Madeira River basin. Clim. Change 2015, 129, 117–129. [Google Scholar] [CrossRef]
- Rodriguez, D.A.; Lopes, L.G.; Carriello, F.; Siqueira, J.L., Jr.; Pinto, G.L.; Tomasella, J.; Chou, S.C. Previsões de cheias extremas nos horizontes sazonais e de curto e médio prazos na bacia do rio Madeira: Estudo de caso da enchente de 30 de março de 2014 em Porto Velho. CEP 2017, 24210, 346. [Google Scholar] [CrossRef]
- Dereczynski, C.; Chou, S.C.; Lyra, A.; Sondermann, M.; Regoto, P.; Tavares, P.; Chagas, D.; Gomes, J.L.; Rodrigues, D.C.; Skansi, M.d.M. Downscaling of climate extremes over South America–Part I: Model evaluation in the reference climate. Weather. Clim. Extrem. 2020, 29, 100273. [Google Scholar] [CrossRef]
Disclaimer/Publisher’s Note: The statements, opinions and data contained in all publications are solely those of the individual author(s) and contributor(s) and not of MDPI and/or the editor(s). MDPI and/or the editor(s) disclaim responsibility for any injury to people or property resulting from any ideas, methods, instructions or products referred to in the content. |
© 2025 by the authors. Licensee MDPI, Basel, Switzerland. This article is an open access article distributed under the terms and conditions of the Creative Commons Attribution (CC BY) license (https://creativecommons.org/licenses/by/4.0/).