Article

Integrating Gravimetry and Spatial Analysis for Structural and Hydrogeological Characterization of the Northeast Tadla Plain Aquifer Complex, Morocco

1
Geo-Resources and Environment Laboratory, Department of Earth Sciences, Geo-Matics, Faculty of Sciences and Technology, Sultan Moulay Slimane University, Bp 523, Beni Mellal 23000, Morocco
2
Research Laboratory of Space, History, Dynamics, and Sustainable Development, Faculty of Arts and Humanities Sais-Fes, Sidi Mohamed Ben Abdellah University, Fes 30000, Morocco
3
Regional Centre of Agricultural Research of Tadla, National Institute of Agricultural Research (INRA), Avenue Ennasr, Bp 415 Rabat Principal, Rabat 10090, Morocco
4
AQUABI-OTECH Laboratory, Geosciences Unit, Department of Geology, Faculty of Sciences Semlalia, Cadi Ayyad University, Bp 2390, Marrakech 40000, Morocco
5
3GIE Laboratory, Mohammadia Engineering School, Mohammed V University, Bp 765, Rabat 10090, Morocco
*
Author to whom correspondence should be addressed.
Geographies 2025, 5(3), 35; https://doi.org/10.3390/geographies5030035
Submission received: 1 June 2025 / Revised: 9 July 2025 / Accepted: 12 July 2025 / Published: 16 July 2025

Abstract

This study was conducted in the northeast of the Tadla plain, within the Beni Mellal-Khenifra region of Morocco. The primary objective is to elucidate the geometric and hydrogeological characteristics of this aquifer by analyzing and interpreting data from deep boreholes as well as gravimetric and electrical measurements using GIS analysis. First, the regional gradient was established. Then, the initial data were extracted. Subsequently, based on the extracted data, a gravity map was created. The investigation of the Bouguer anomaly’s gravity map exposes the presence of a regional gradient, with values varying from −100 mGal in the South to −30 mGal in the North of the area. These Bouguer anomalies often correlate with exposed basement rock areas and variations in the thickness of sedimentary layers across the study area. The analysis of existing electrical survey and deep drilling data confirms the results of the gravimetry survey after applying different techniques such as horizontal gradient and upward extension on the gravimetric map. The findings enabled us to create a structural map highlighting the fault systems responsible for shaping the study area’s structure. The elaborated structural map serves as an indispensable geotectonic reference, facilitating the delineation of subsurface heterogeneities and providing a robust foundation for further hydrogeological assessments in the Tadla Plain.

1. Introduction

Water is a vital substance for the survival of living beings [1], and it is at the heart of major issues today, both globally and in countries with limited water resources [2,3]. Access to adequate quantities of safe drinking water is essential for the development of a healthy society [1,4]. In addition to its use for human consumption, water is also used by farmers for irrigation of crops to ensure food production and meet the growing needs of a growing global population [5,6]. Although it covers about 71% of the Earth’s surface, accessible freshwater represents just 3% of the total [7]. The vast majority, 97%, is made up of saltwater, which is unfit for human consumption and irrigation without treatment [8].
Groundwater is a reliable supply of potable water and irrigation [9,10,11], especially in arid and semi-arid regions where rainfall is low [12]. It is generally of better quality than surface water, as it is naturally filtered through the soil and naturally protected by geological layers [4,13,14]. The exploitation of groundwater is of capital importance for the socio-economic development of the semi-arid regions of Morocco [15,16,17] as well as for all the countries of the Mediterranean basin. This resource is used for both crop irrigation and drinking water supply [18].
The Tadla Plain aquifer system in Morocco serves as a striking example of the critical importance of groundwater [19,20]. This vital resource supplies a substantial portion of the water required for irrigation and human consumption in the Béni Mellal region [21,22]. However, recent observations have unveiled a concerning trend of declining groundwater levels in several Moroccan regions, including the Tadla Plain [23]. This alarming situation threatens the sustainability of this vital resource and jeopardizes the regional economy [21].
Rational and sustainable exploitation of groundwater resources necessitates a thorough understanding of the aquifers in question [24]. The initial step entails conducting a geometrical analysis of the groundwater reservoirs to assess their capacity and recharge potential. Given the current circumstances, it is now essential to step up investigations throughout the basin, especially using indirect approaches like geophysical techniques. This approach will enable the identification of yet-uncharted productive zones and yield precise information about the geological structure and physical properties of the subsurface.
This research aims to identify the geometrical structure of the northeastern Tadla plain aquifer system as well as its hydrogeological implications. To achieve these objectives, a study based on the analysis of gravimetric and vertical electrical sounding data as well as structural and stratigraphic data from the field and boreholes is conducted. The interpretation of these data is necessary for a better understanding of the structure and functioning of the aquifer system and to guide the installation of new boreholes for agricultural practice and provision of potable water as well as to ensure good groundwater management in the Tadla plain.

2. Materials and Methods
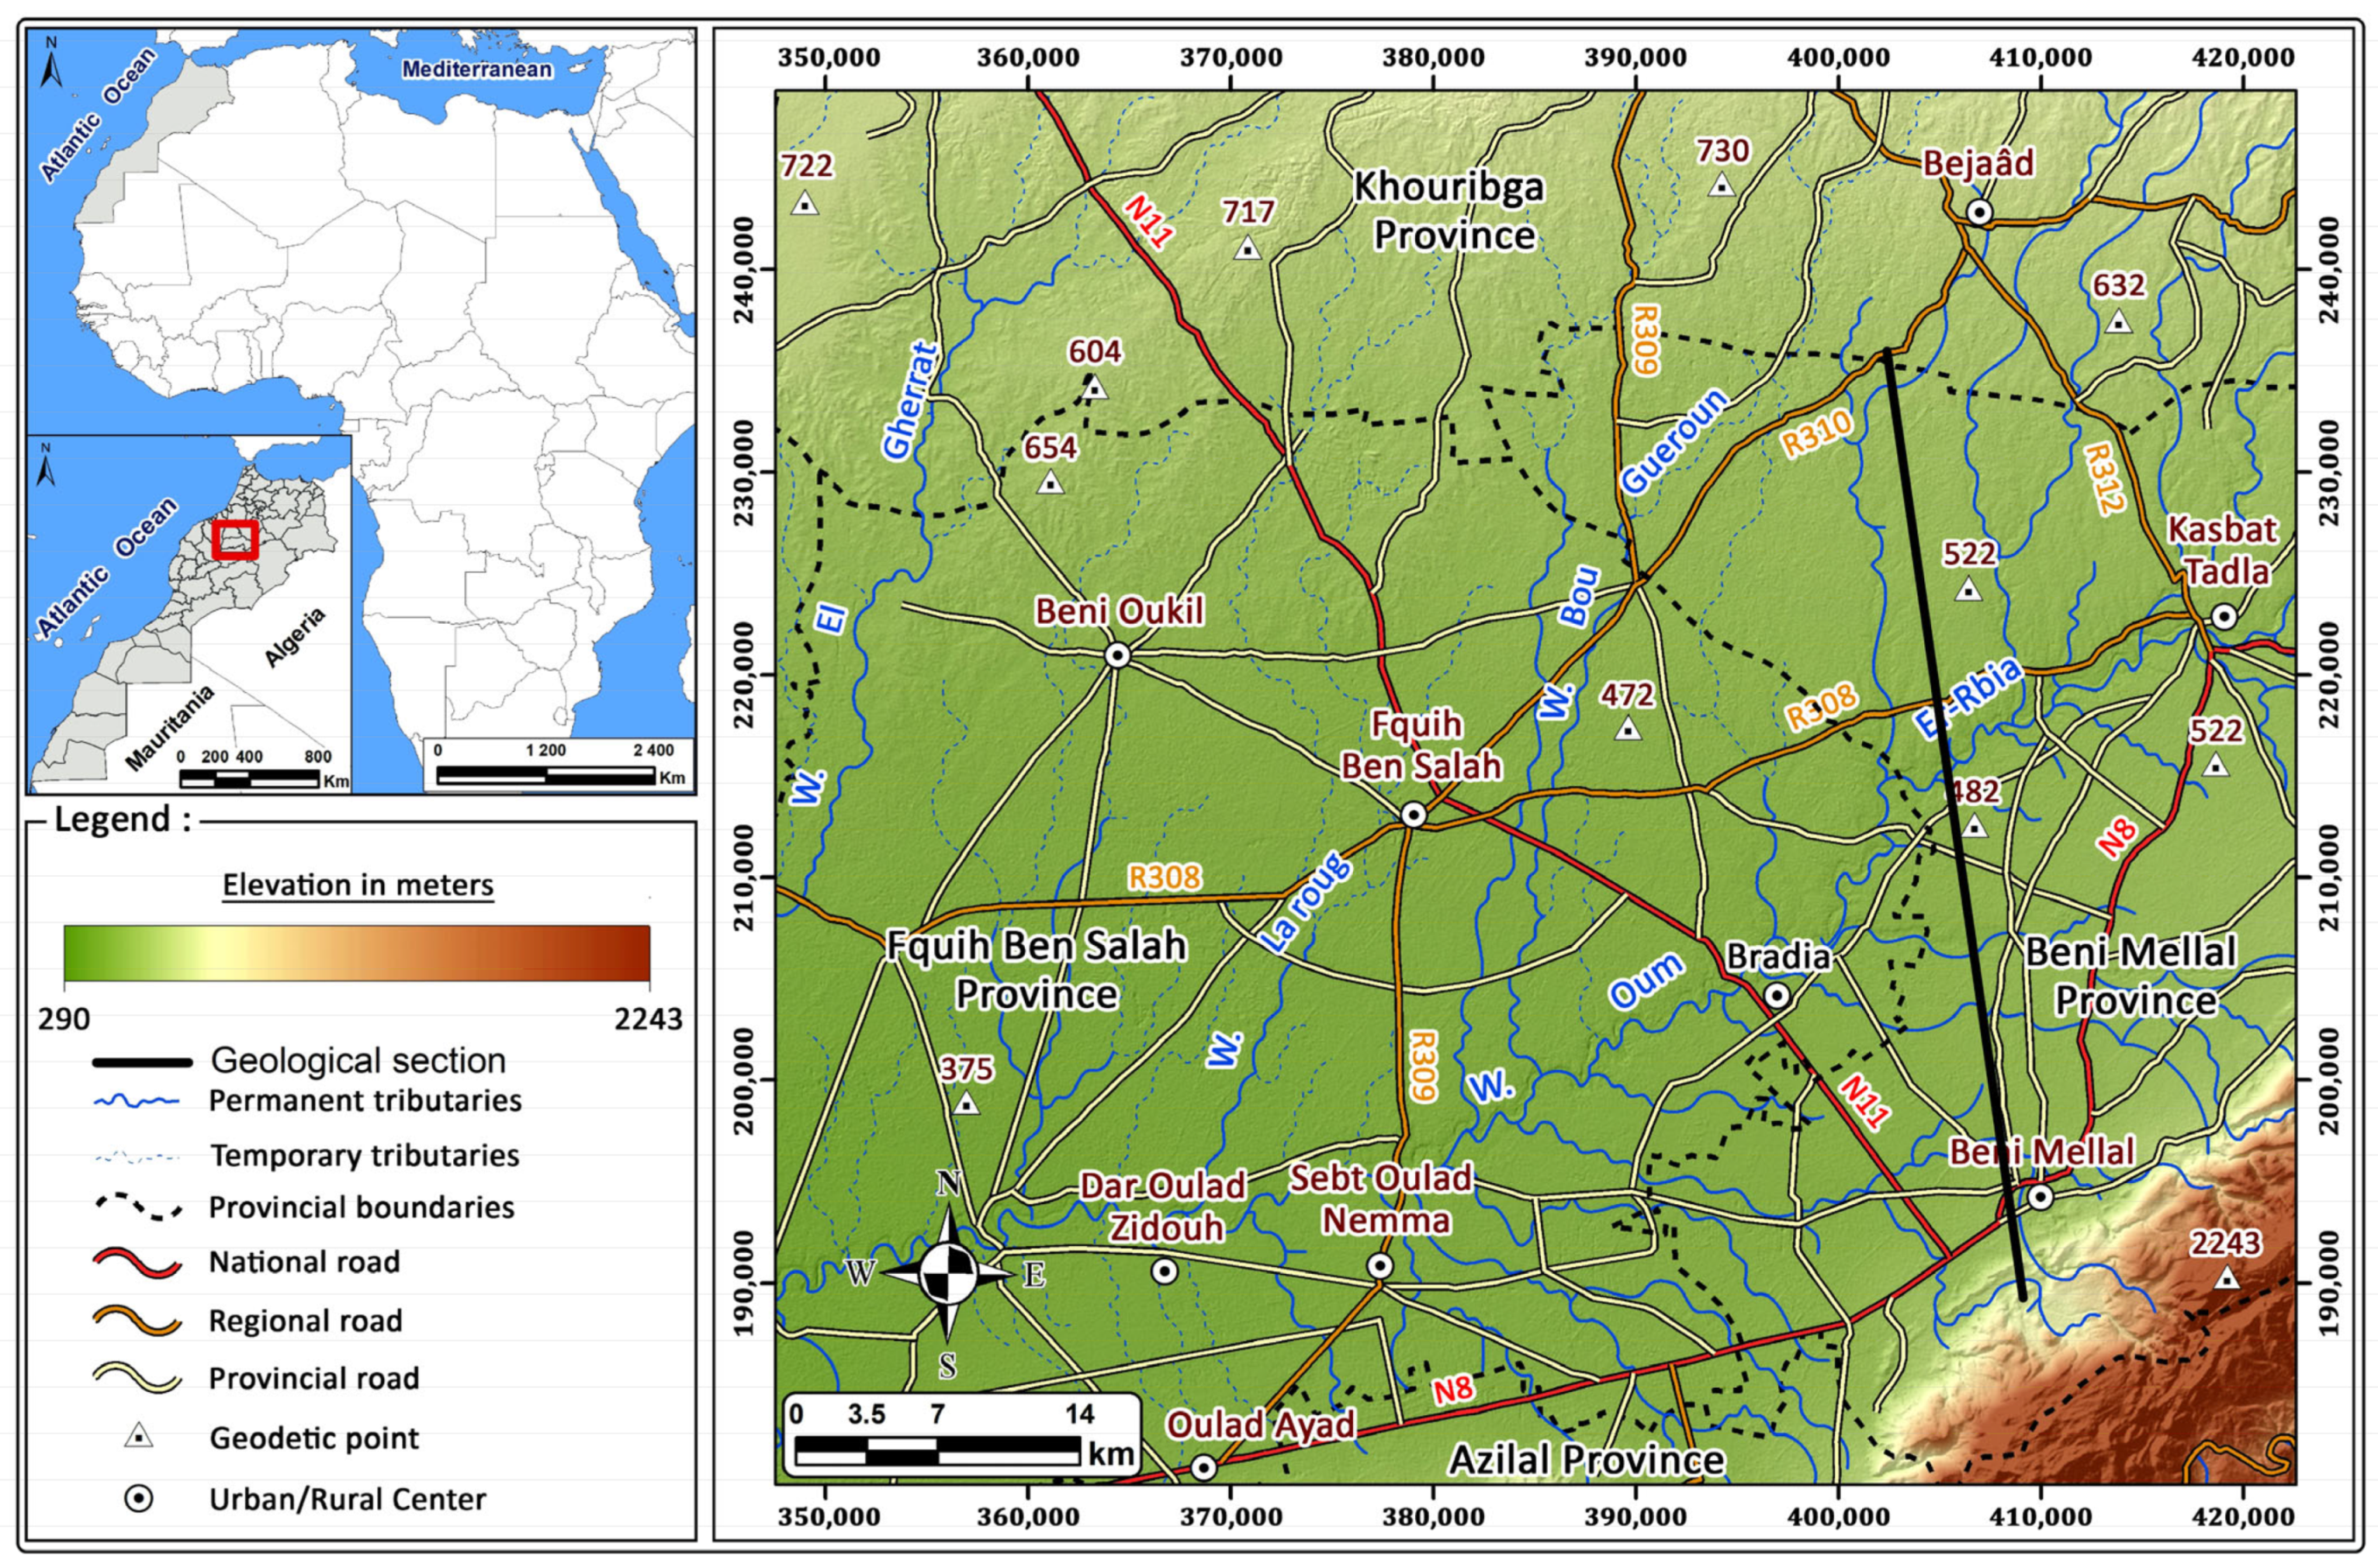
2.1. Study Area

The Tadla plain is a large, mono-synclinal depression stretching WNW–ESE, situated in central Morocco, approximately 200 km southeast of Casablanca [25,26]. It is situated between 6°42′21″ W and 6°16′03″ E longitude and 32°28′49″ N and 32°31′10″ N latitude. This basin spans 3600 km2 and is bounded to the north by the Phosphate Plateau [27]. To the east, the plain tapers along the Oum-er-Rbia river toward the rough terrain of the Zaian region (Figure 1). To the west, there is no clear boundary between Tadla and Bahira [28,29], but the lower course of the Oued El Abid will be taken as the regional boundary of this ensemble [30]. To the south, it is bordered by the Atlas mountain range, mainly Jurassic [31].
The Tadla plain is one of Morocco’s top farming regions, thanks to irrigation from the Oum Er-Rbia river. The area has a semi-arid climate, with hot, dry summers and most rain falling from November to March [4]. The plain is characterized by a length of 125 km and a maximum width of about 50 km in the center. The climate of the plain is of the semi-arid Mediterranean type, with cold winters and an average annual rainfall of 393.1 mm [32].
The average altitude ranges from 350 m to 500 m, with the lowest point at Sidi-Driss (hydrological station on the Oum-Er-Rbia: 315 m) [33].
The Tadla plain contains two distinct aquifers: the shallow unconfined aquifer and the deeper confined aquifer [19]. Generally, the phreatic aquifer is made up of various fluviolacustrine formations, including marly-calcareous, lacustrine limestones, and conglomerates. Groundwater flow in this aquifer is from northeast to southwest and is mainly used for irrigation and drinking water supply. This distinct hydrogeological unit consists of two layers, each positioned on opposite sides of the Oum Er-Rbia Basin (Figure 2) [19,31]. On the other side, the deep aquifer is contained in the Turonian dolomitic and limestone limestones and is composed of marls, clays, and anhydrites of the Cenomanian and sub-Cenomanian. The water from this unit is used for irrigation and drinking water, along with the phreatic aquifer [34].

2.2. Material

The gravimetric data used in this survey were published in 1961 by the Geological Survey of Morocco in the form of a Bouguer anomaly map (d = 2.67 g/cm3). The use of gravimetric data and the analysis of the Bouguer anomaly allowed for us to propose a new geological interpretation of the Tadla region, which has important implications for structural and hydrogeological research.
The Bouguer anomaly map of Tadla, established in 1961 by the Société de Prospection Géophysique d’Afrique du Nord (CPGNA) for the Mining Direction of Morocco Geology, represents an important contribution to the geological understanding of the region. Based on 3312 measurement points, it offers a detailed image of the variations in subsurface density at the scale of the Tadla Basin [35]. Early efforts to reduce the mass effect with low-pass filtering or upward continuation were not effective. The best outcome came from using the polynomial regression method [36]. In order to highlight the geological faults on the residual anomaly map, it was processed using a contact analysis strategy founded on two methods, horizontal gradient and upward continuation, using the Geosoft mapping and processing system [37].

2.3. Methods

Gravimetry is a fundamental discipline of geophysics that involves measuring and studying the spatial and temporal variations in the Earth’s gravitational field [38,39]. The applications of gravimetric measurements are numerous, including, for example, the exploitation of mineral resources and understanding the structure of various geological units, particularly the presence of mass heterogeneities in the subsurface [40,41]. Gravimetry is mainly founded on Newton’s law of universal gravitation, which states that two masses attract each other with a force proportional to the product of their masses and inversely proportional to the square of the distance between them. The formula for this law is presented by Equation (1):
F = G m 1 m 2 r ˆ 2
where
F is the gravitational force between the masses;
G is the universal gravitational constant;
m1 and m2 are the interacting masses;
r is the distance between the centers of the masses.
In practice, gravimeters are used to measure the small variations in gravity caused by the density of rocks and other formations beneath the surface. The gravimetric data are then interpreted to obtain an image of the deep structures, thereby helping to understand the composition and geological characteristics of the studied region [42,43].
Extracting the horizontal gradient from the residual anomaly map is very valuable for detecting geological contacts [44,45,46,47]. This is based on the following principle: the boundary between two blocks of different densities corresponds to the maximum of the horizontal gradient of the gravity anomaly [46,48].
The analysis of the gravity field proves to be a valuable tool for detecting density variations in the subsurface, especially in the presence of vertical contacts between rocks of different types. The principle is based on the direct influence of density on the force of gravity. Indeed, the higher the density of a rock, the greater its gravitational attraction. Thus, above a vertical contact between two rocks of different densities, a variation in the gravity field is observed [49,50] such that we can subdivide it:
Low-density zone: Above the low-density rock, the gravity field is weaker. This results in negative or lower than average gravity anomaly values [51,52].
High-density zone: At the level of the high-density rock, the gravity field is more intense. Positive or higher than average gravity anomaly values are then observed [51].
The point of inflection, that is to say, the point where the variation in gravity changes direction, is located precisely at the vertical of the contact between the two rock types. This characteristic of gravity anomalies allows for the localization of abrupt density variations [53].
Local maxima of horizontal gradients appear as narrow ridges above geological contacts where there are density contrasts [54]. Furthermore, to analyze the dips of the contacts and structures highlighted, we calculated the upward continuation of the residual anomaly map at several altitudes (0.5, 1, 2, and 4 km). We then located the local maxima of the horizontal gradient for each level. The migration of these maxima, as the continuation altitude increases, indicates the direction of the dip. For a vertical structure, all the maxima are superimposed [44]. Indeed, the effectiveness of these treatments has been proven by numerous studies, showing consistent and positive results in various applications [36,44,46,47,55,56].
Figure 3 presents the flowchart used for processing the gravimetric data. It outlines the complete workflow, starting from the acquisition of raw Bouguer anomaly data, digitization under ArcGIS, and processing using Oasis Montaj software v6.4.2. The procedure includes the generation of residual and horizontal gradient maps, upward continuation, and the integration of these outputs for final analysis and interpretation.

3. Results and Discussions

The Bouguer anomaly map is an image of Earth’s gravity, corrected to highlight variations caused by differing rock densities beneath the surface [57]. These variations can be due to large-scale geological structures, such as mountain ranges or sedimentary basins, as well as smaller-scale features, like mineral deposits or faults [58]. To better understand these data, geophysicists typically separate the regional component, related to large-scale structures, from the residual component, which reflects smaller-scale features. By analyzing abrupt changes in anomaly values, it is possible to detect the presence of discontinuities in the subsurface, such as changes in rock type or fracture zones [59].
The examination of the gravity map of the plain of Tadla reveals the existence of a regional gradient defined by increasing values from −100 mGal in the South to −30 mGal in the North (Figure 4). Considering the geological makeup of the region, this trend suggests a substantial thickening of the sedimentary layers towards the south.
The Bouguer anomaly map shows the presence of a marked regional gradient. This gradient, which can be assimilated to a progressive variation in gravity at the scale of the studied region, partly masks the finer and geologically interesting local anomalies.
To focus on smaller-scale gravitational anomalies, we remove the effects of larger, regional geological features. This process, termed “regional gradient determination and subtraction”, results in a residual map [60,61]. This map reveals lateral changes in density within the Earth’s upper layers. These variations can be attributed to differences in sediment thickness, the presence of intrusive igneous rocks, or underground voids [62,63]. Residual anomaly maps are indispensable tools for exploring natural resources and studying the Earth’s geological makeup [57].
The residual anomaly map (Figure 5), acquired by subtracting a regional assimilation from a plane, shows values between −18 and 12 mGal. Based on geological knowledge of the region, it is possible to make a qualitative interpretation of the anomalies. An overview of this map highlights the main gravimetric sectors that reflect the deep structure of the study area. We thus distinguish between areas with positive anomalies and areas with negative anomalies (Table 1).
An inspection of the residual anomaly map (Figure 5) reveals the presence of several positive (AP1 to AP3) and negative (AN1 to AN3) anomalies. These anomalies are well correlated with the main structural features of the region, as indicated below.
The Phosphate Plateau is characterized by a relatively calm gravity relief, with moderate variations in the residual anomaly (between −2 and −10 mGal). This observation can be explained by several factors:
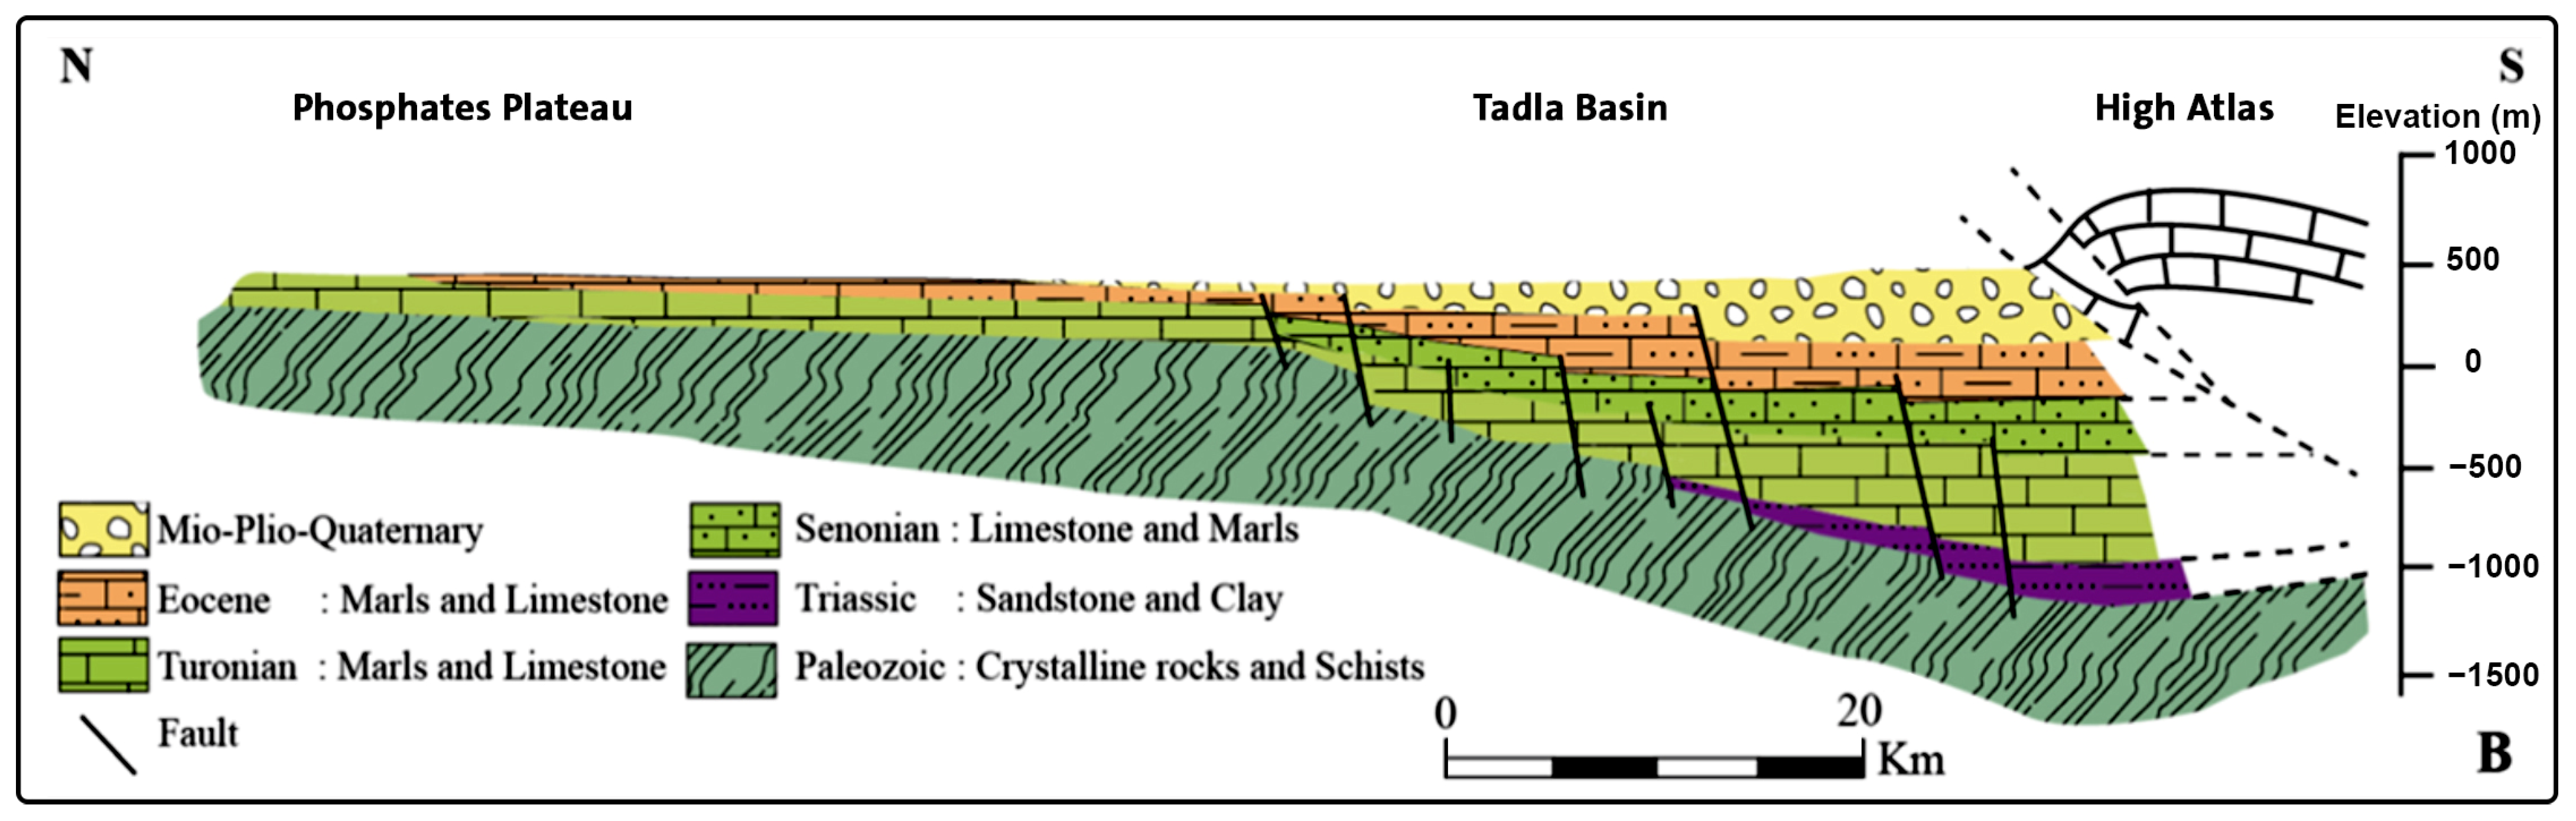
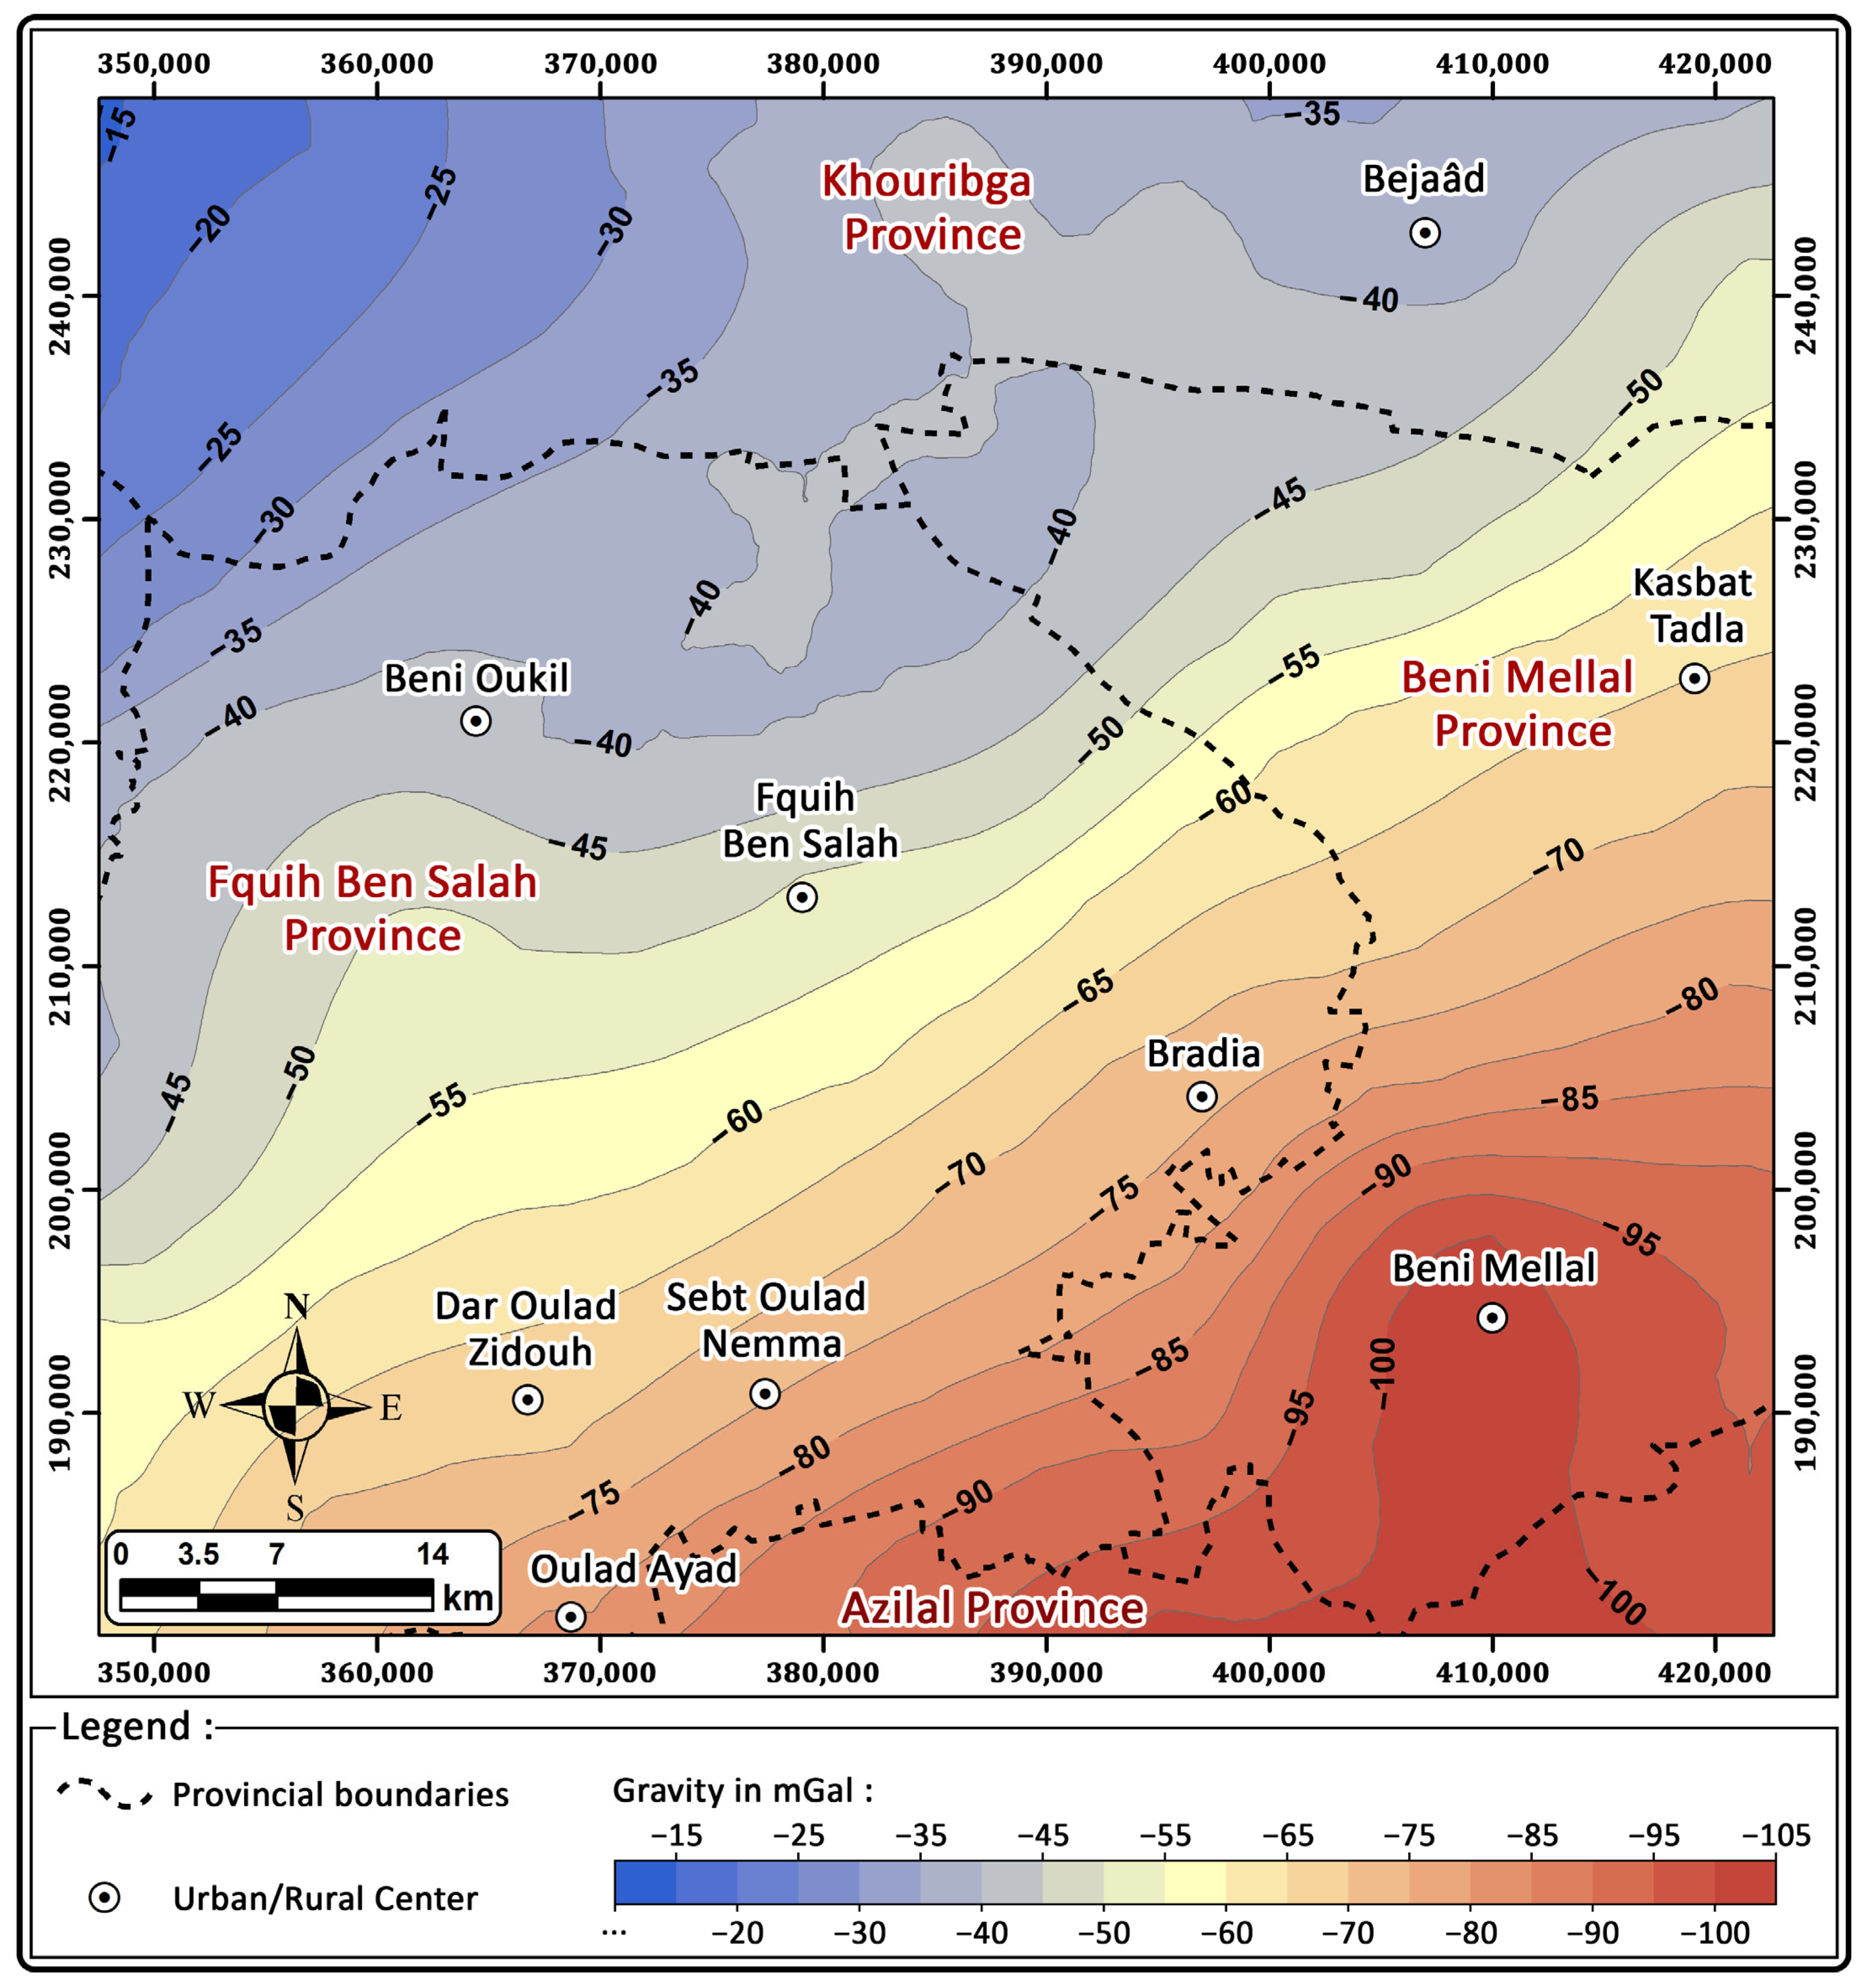
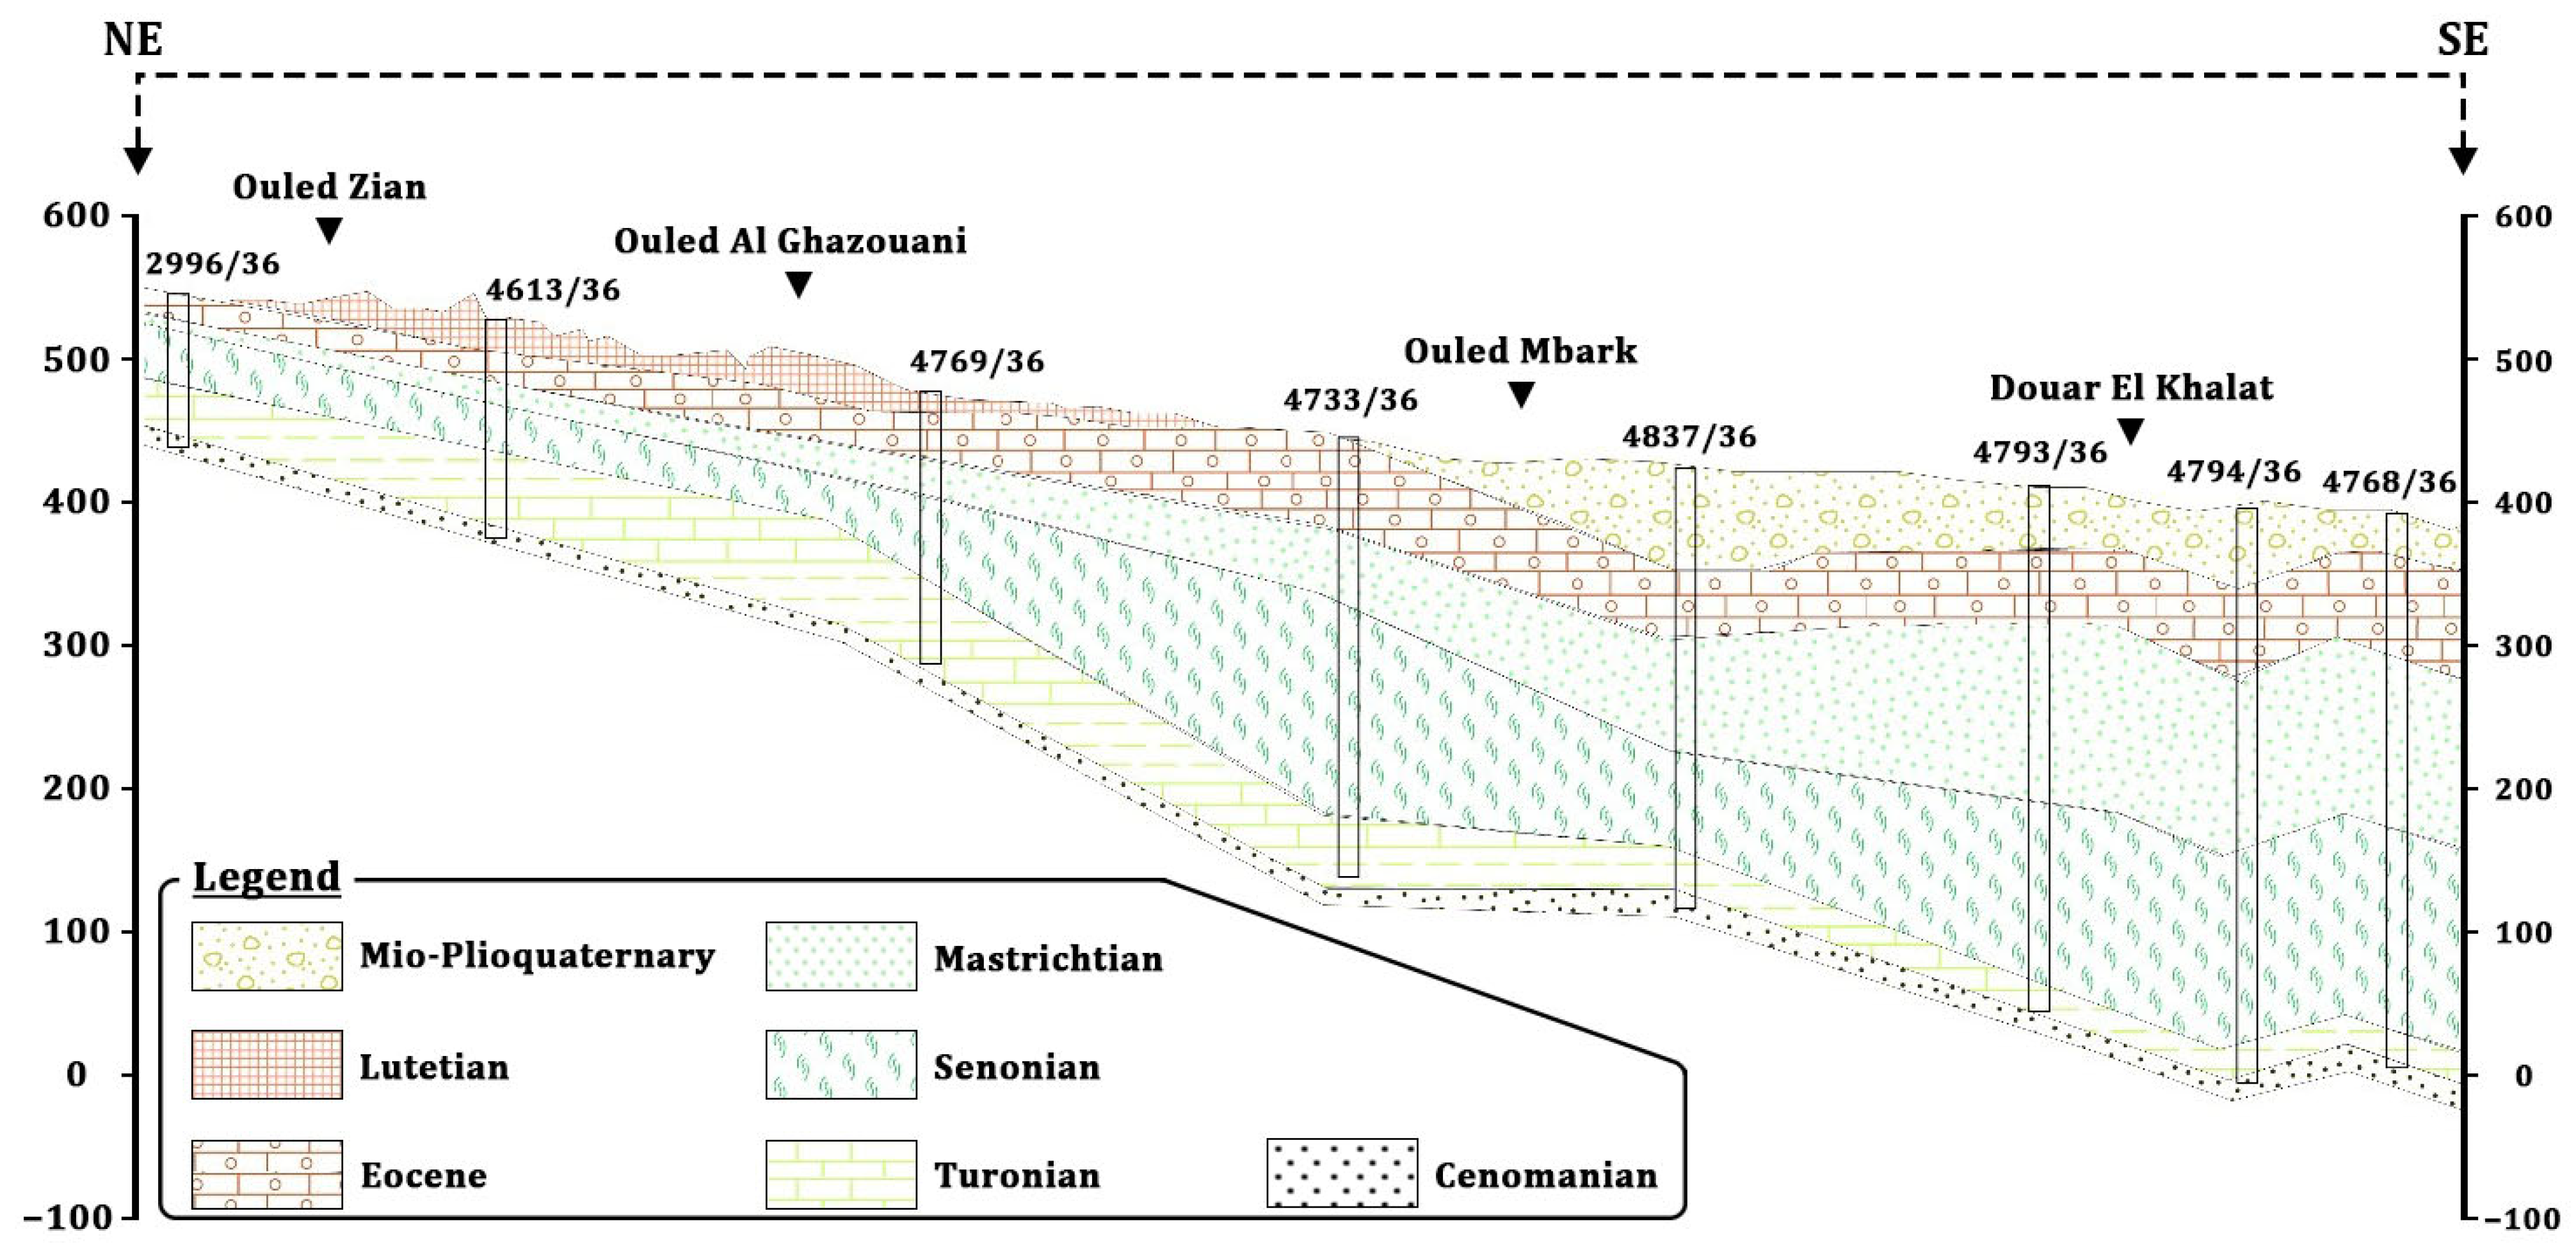
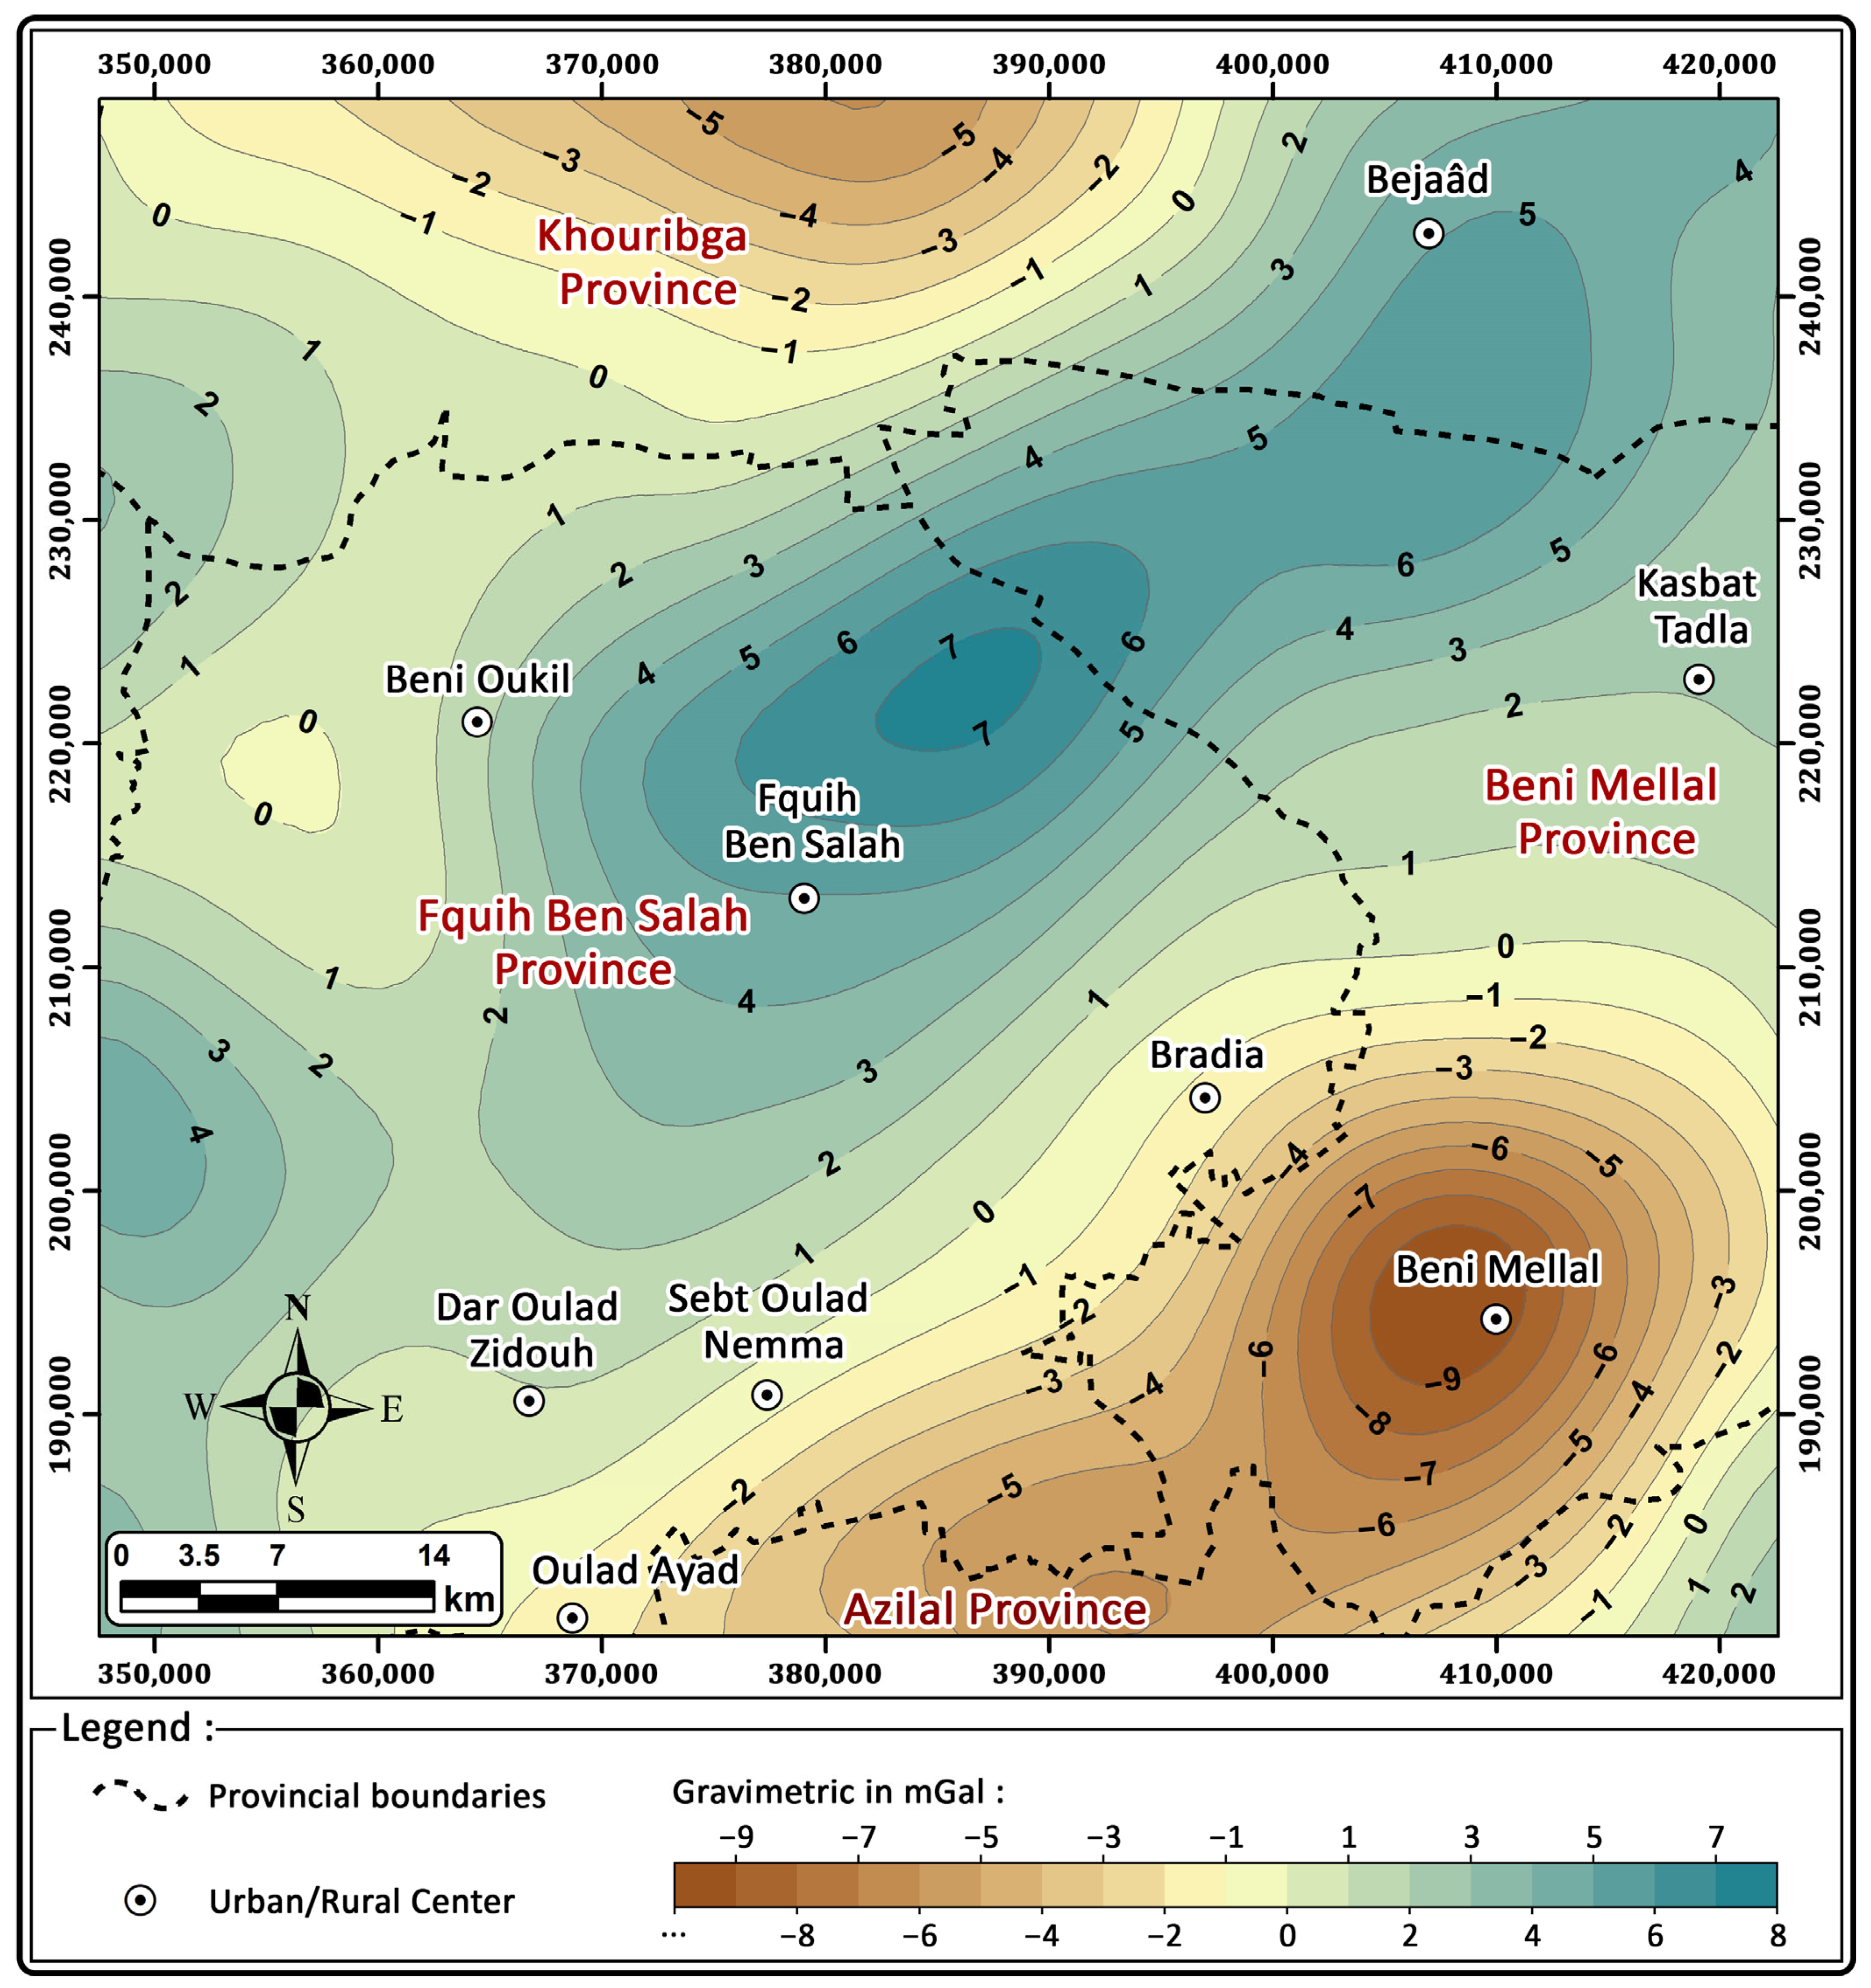
  • The presence of a relatively constant thickness of Meso-Cenozoic sedimentary cover explains the weak variations in the gravity field. This layer, characterized by a homogeneous density, masks the density variations in the underlying basement, thus attenuating the gravimetric anomalies.
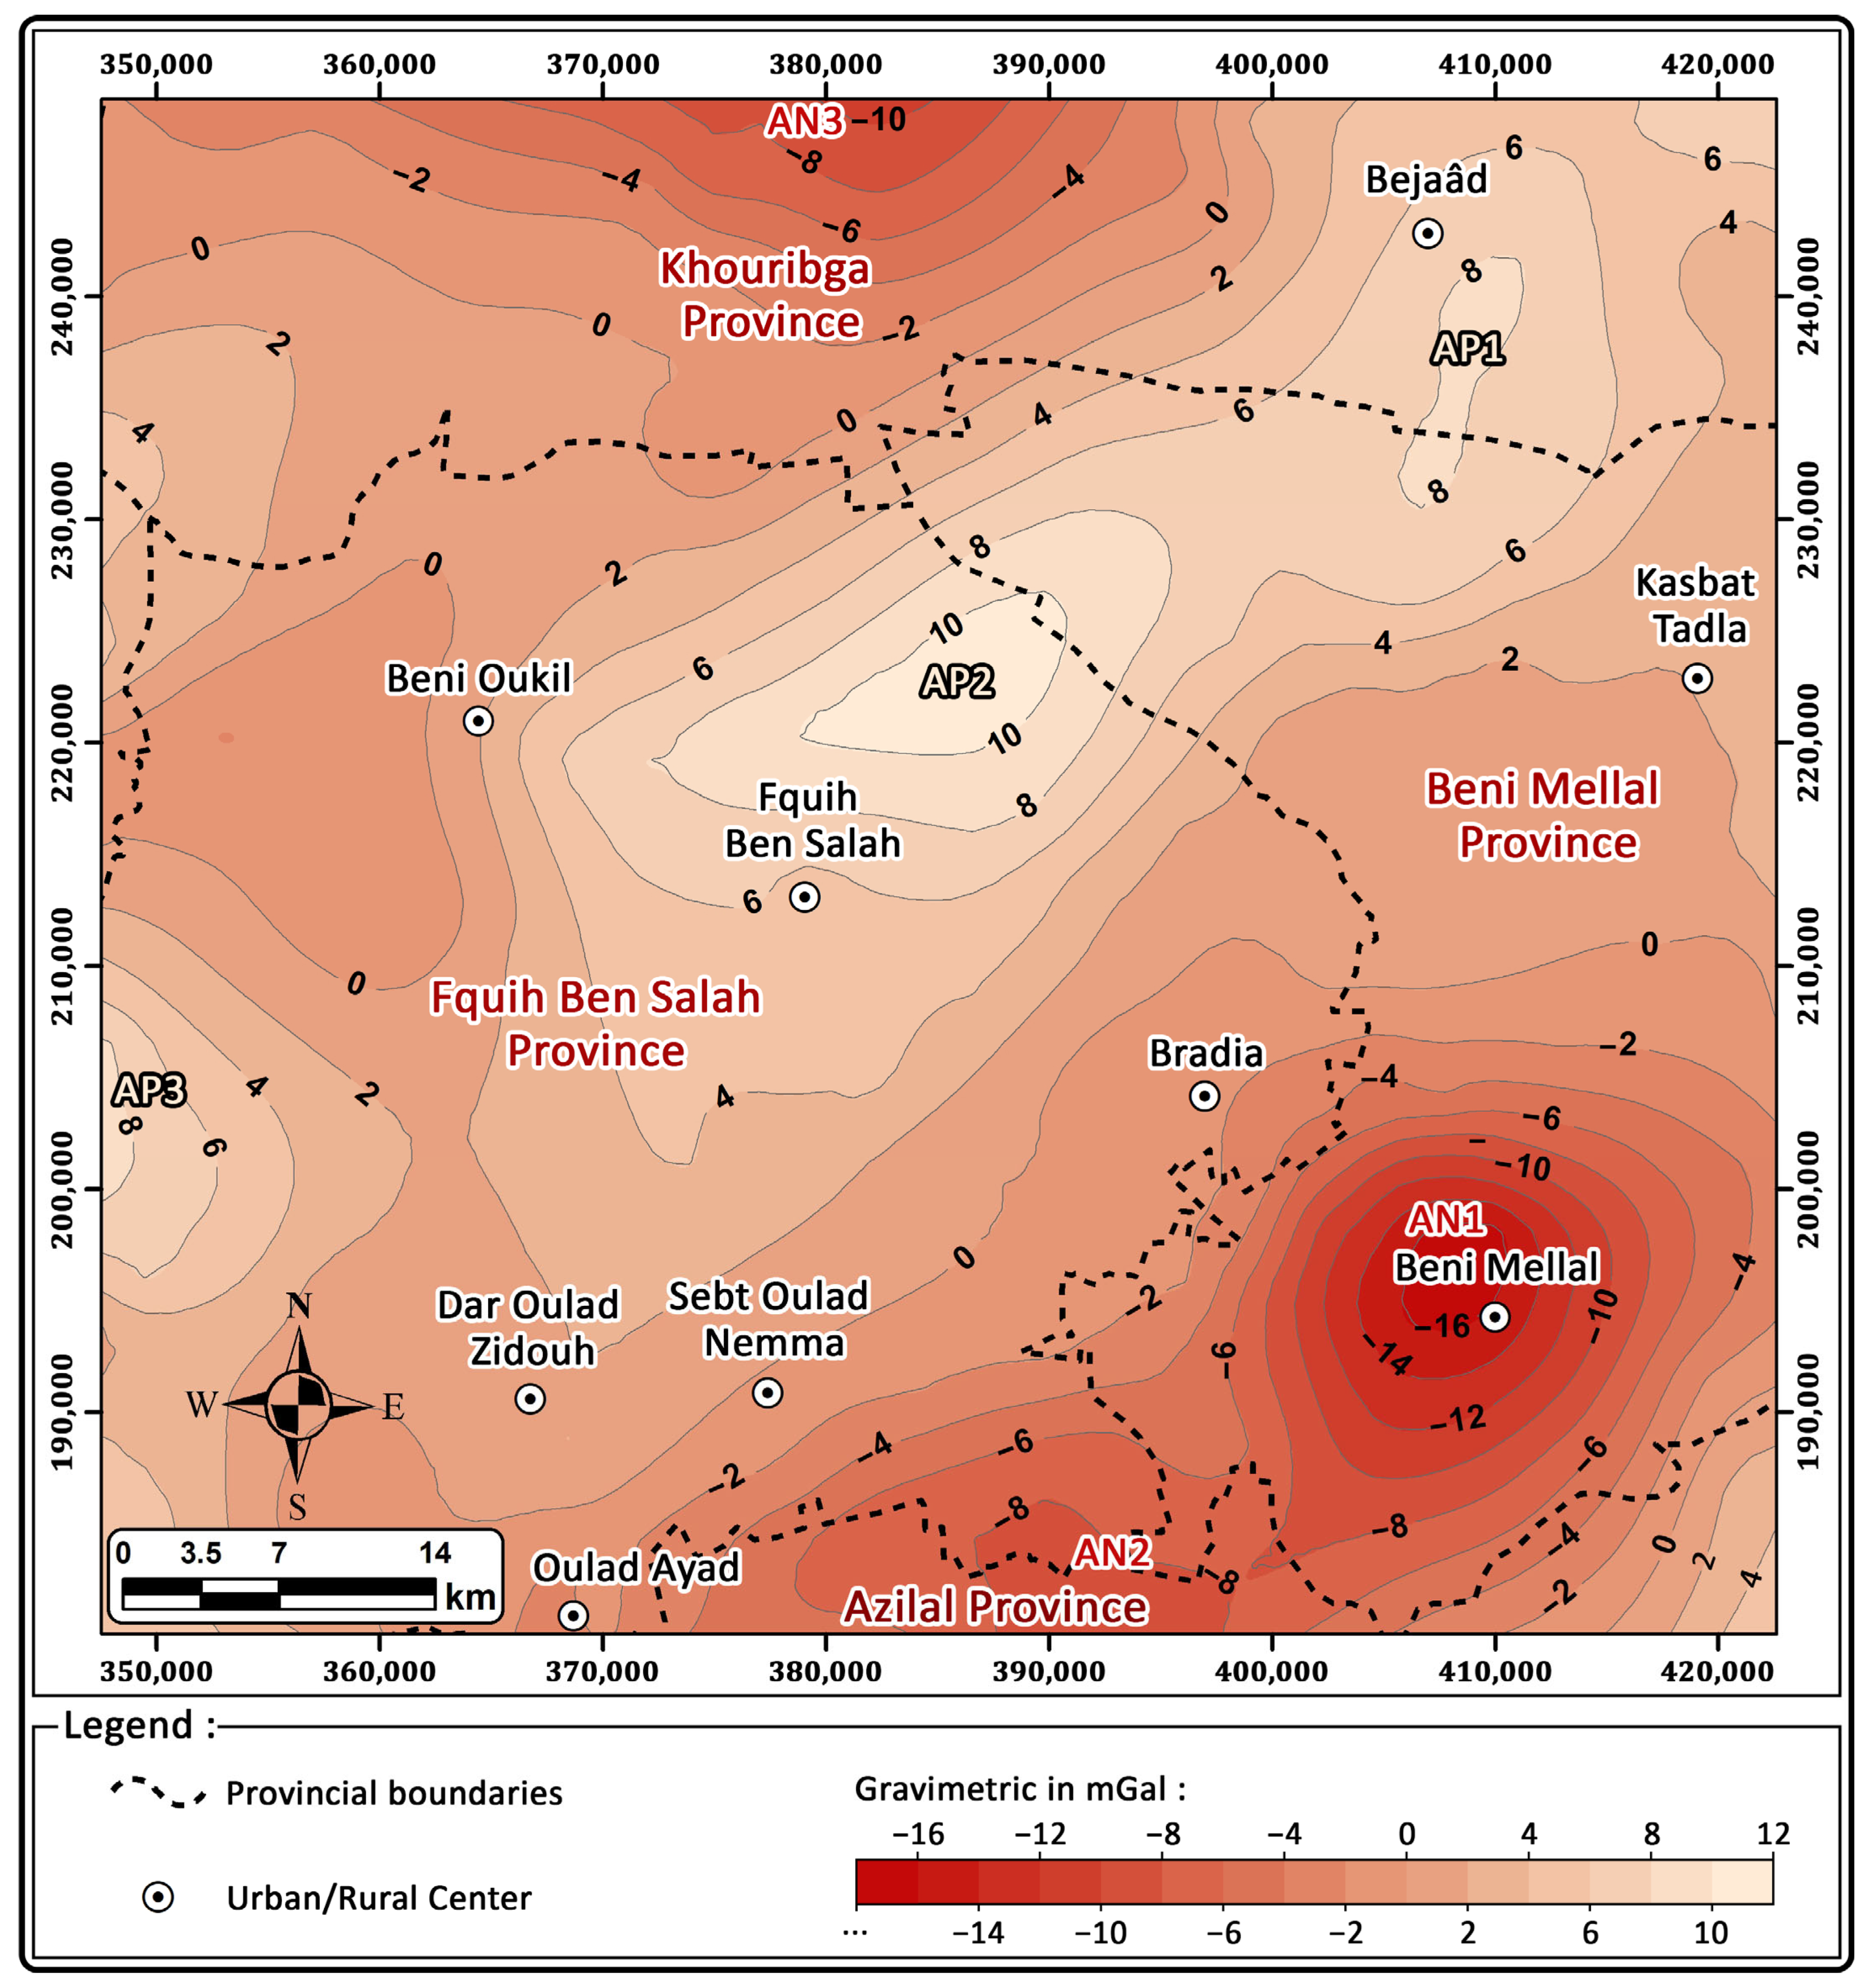
  • The small negative anomaly (AN3) observed at the edge of the Phosphate Plateau could indicate the presence of depressions in the roof of the Paleozoic basement. These depressions, filled with sediments denser than the Meso-Cenozoic cover, generate negative gravimetric anomalies.
Moving towards the center of the map, we observe a progressive decrease in the values of the residual anomaly in the Tadla Basin. This decrease occurs from north to south, which explains the increase in the thickness of the Tadla aquifer system from north to south.
The alignment of the negative anomalies AN1 and AN2, located near the southern limit of the plain, highlights the axis of the plain where the sedimentary series reaches its maximum thickness. This observation is crucial for understanding the region’s geological and hydrogeological structure.
Figure 6 and Figure 7 clearly illustrate this trend. In addition to confirming the increase in the thickness of the aquifer system towards the south, these Figures also allow for us to draw other important conclusions:
  • The presence of a thicker sedimentary series in the southern part of the plain indicates a more important subsidence in this zone.
  • The lateral continuity of the aquifer formations is favorable for groundwater flow.
This information is valuable for the sustainable management of water resources in the Tadla plain. It allows for a better understanding of the functioning of the aquifer system and the identification of areas where water resources are the most important.
The positive anomalies AP1, AP2, and AP3 present high amplitudes (6 mGal to 12 mGal), which correspond, respectively, with the outcrops of denser Paleozoic rocks in the uplifted areas of the Tadla plain and correspond to a zone of shallow depth of the basement, which should play an important role on the hydrogeological level.
Founded on the residual anomaly map, several areas with significant gravitational gradients can be observed [64]. This may indicate the presence of contacts or discontinuities in the subsurface structure, such as flexures or faults [65].
Indeed, faults create contacts between rock blocks of different densities. On a gravimetric map, these contacts are manifested by gradient zones, since gravity is affected by the density of the materials crossed [66]. To better identify and characterize these discontinuities, a contact analysis technique can be used. This technique calculates the horizontal gradient of the gravitational field and uses it to determine the position and dip of the contact [44]. By combining this information with other geological data, a more accurate picture of the subsurface structure can be obtained [67].
Gradient zones corresponding to inflection points on a gravity map are transformed into maxima after calculating the horizontal gradient [68]. The Blakely and Simpson [57] method allows for the automatic location of these maxima. Using this technique helps highlight local maxima of horizontal gradients on a gravity map, forming narrow ridges above abrupt density changes [69].
To determine the dip trace of the highlighted contacts, the upward continuation method of gravity data at different altitudes is used, as shown in Figure 8, Figure 9, Figure 10 and Figure 11. This is an effective and simple tool to implement and does not require a priori geological data. However, it is important to be aware of its limitations and to use it in conjunction with other geophysical interpretation methods [70].
The procedure, therefore, consists of performing a series of mathematical transformations on the gravity data, called analytical continuations, to extend them upwards. Then, for each level, the horizontal gradient is calculated, and its maxima are identified [57,71]. If the structures are vertical, the maxima of all levels are superimposed. On the other hand, the displacement of these maxima, when the length of the upward extensions increases, designates the direction of the dip. This approach works for two-dimensional structures with linear contacts separating blocks of different densities, just like the ones we are analyzing [36,48].
By analyzing the superposition of the points where the horizontal gradient is maximum on the map of the residual anomaly and its upward extensions at different altitudes, it is possible to identify the different limits between the geological formations and to determine their inclination (Figure 12).
The examination of the elongation of the obtained anomalies shows that they are organized into three families with NE–SW, E–W, and NW–SE directions. The analysis of the geological map of the study area and the whole of Morocco (at a scale of 1/1,000,000) around the Tadla Basin reveals important observations regarding the structural directions present.
The E–W and NW–SE directions are rare and only appear locally; however, the first direction, NE–SW, is very widely represented at the regional level. These structural directions indicate that the region has been affected by several tectonic phases.
This result matches the findings of earlier geological and hydrogeological studies [27,72], which indicate an increase in the thickness of the aquifer system of the Tadla Basin from north to south. This observation is also coherent with the results of structural studies executed in the region. These studies have identified three main fracture networks oriented in the NE–SW, E–W, and NW–SE directions (Figure 13).
In the same context, another study conducted by Bba, A.N., and their collaborators in 2018 in the Tadla Basin and the Phosphate Plateau identified contacts, the majority of which are oriented NE–SW and dip southeast. The northeast orientation of the detected discontinuities aligns with both the main structural trend of the Atlas Mountains and the major elongation of the Tadla Plain.
Compared with other studies conducted in the Haouz Basin, the map synthesized from gravity data reveals that the fault system responsible for structuring the basin is organized according to two families of NE–SW, NW–SE, and E–W directions, with NE–SW directions dominating [73,74]. On the other hand, analyses of gravity data from the Triffa Plain and the northern flank of the Béni-Snassen Mountains revealed four families of directions: N50, N65, N85, and directions between N110 and N160. These results made it possible to draw up a structural map showing the fault system responsible for structuring the study area. This map is a very useful document for guiding future hydrogeological research to be conducted in the study area [46].
These results highlight the importance of the geological structure in the configuration of the aquifer system of the Tadla Basin in such a way that the variation in thickness and the presence of differently oriented discontinuities create preferential zones for groundwater flow and, thus, represent favorable targets for the implementation of reconnaissance drilling for these waters.

4. Conclusions

This study’s geological and geophysical data analysis and interpretation allow for a better understanding of the geological nature and characterization of the aquifer system in the northeastern Tadla Plain. The phreatic aquifers of this system constitute a synclinal depression composed of geological formations dating from the Permo-Triassic to the Quaternary. They rest on a Paleozoic and Triassic shale and clay substrate.
Based on the results of this study, the top of the Paleozoic basement shows a progressive slope towards the South. This configuration leads to an asymmetric structure, characterized by a synclinal depression that corresponds to the location of the aquifer system. The Paleozoic basement gradually deepens from north to south, creating a kind of basin whose lowest point is located in the south. This depression, called a syncline, houses the aquifer in question. Accordingly, the produced structural map offers a valuable documentary tool for selecting suitable sites for groundwater reconnaissance studies. It is important to note that this particular configuration can have significant implications for groundwater flow, water resource distribution, and the overall geology of the region.
The application of the contact analysis technique to the gravimetric data revealed an important network of structures, confirming the major influence of Atlas tectonics on the study area. The boundaries of this area are defined by normal faults, which manifest as collapse structures related to the southward approach of the High Atlas.

Author Contributions

Conceptualization, S.D., S.E.B. and A.H.; methodology, S.D. and S.E.B.; software, S.E.B.; validation, S.D., A.H., A.N., A.W. and S.E.B.; formal analysis, S.D.; investigation, S.D., A.B. and S.B.; resources, S.E.B.; data curation, S.H. and S.D.; writing—original draft preparation, S.D., S.E.B., A.H. and S.H.; writing—review and editing, S.D., A.H., A.B., A.N. and A.W.; visualization, S.L.; supervision, S.E.B. and A.H.; project administration, A.H.; funding acquisition, H.S. All authors have read and agreed to the published version of the manuscript.

Funding

This research received no external funding.

Data Availability Statement

The data supporting the findings of this study are available from the corresponding author upon reasonable request. Gravimetric and geological datasets were obtained from the Moroccan Directorate of Geology and are subject to institutional data-sharing policies.

Conflicts of Interest

The authors declare no conflicts of interest.

References

  1. Popkin, B.M.; D’Anci, K.E.; Rosenberg, I.H. Water, hydration, and health. Nutr. Rev. 2010, 68, 439–458. [Google Scholar] [CrossRef] [PubMed]
  2. Turral, H.; Burke, J.; Faurès, J.-M. Climate Change, Water and Food Security; Food and Agriculture Organization of the United Nations (FAO): Rome, Italy, 2011. [Google Scholar]
  3. Taylor, R.G.; Scanlon, B.; Döll, P.; Rodell, M.; Van Beek, R.; Wada, Y.; Longuevergne, L.; Leblanc, M.; Famiglietti, J.S.; Edmunds, M. Ground water and climate change. Nat. Clim. Change 2013, 3, 322–329. [Google Scholar] [CrossRef]
  4. Karroum, L.; El Baghdadi, M.; Barakat, A.; Meddah, R.; Aadraoui, M.; Oumenskou, H.; Ennaji, W. Assessment of surface water quality using multivariate statistical techniques: EL Abid River, Middle Atlas, Morocco as a case study. Desalinat. Water Treat. 2019, 143, 118–125. [Google Scholar] [CrossRef]
  5. Ingrao, C.; Strippoli, R.; Lagioia, G.; Huisingh, D. Water scarcity in agriculture: An overview of causes, impacts and approaches for reducing the risks. Heliyon 2023, 9, e18507. [Google Scholar] [CrossRef] [PubMed]
  6. Altchenko, Y.; Biancalani, R.; Aróstegui, J.L.G.; Villholth, K.; Ducharne, A. Irrigation avec les eaux souterraines pour atteindre les Objectifs de Développement Durable sur l’éradication de la faim: Espoirs et limites pour l’Afrique Sub-Saharienne. Géologues 2022, 215, 75–81. [Google Scholar]
  7. Visbeck, M. Ocean science research is key for a sustainable future. Nat. Commun. 2018, 9, 690. [Google Scholar] [CrossRef] [PubMed]
  8. Cassardo, C.; Jones, J.A.A. Managing Water in a Changing World; MDPI: Basel, Switzerland, 2011; Volume 3, pp. 618–628. [Google Scholar]
  9. Tegegne, A.M.; Lohani, T.K.; Eshete, A.A. Evaluation of groundwater quality for drinking and irrigation purposes using proxy indices in the Gunabay watershed, Upper Blue Nile Basin, Ethiopia. Heliyon 2023, 9, e15263. [Google Scholar] [CrossRef] [PubMed]
  10. Carrard, N.; Foster, T.; Willetts, J. Groundwater as a source of drinking water in southeast Asia and the Pacific: A multi-country review of current reliance and resource concerns. Water 2019, 11, 1605. [Google Scholar] [CrossRef]
  11. Guo, H.; Li, M.; Wang, L.; Wang, Y.; Zang, X.; Zhao, X.; Wang, H.; Zhu, J. Evaluation of groundwater suitability for irrigation and drinking purposes in an agricultural region of the North China Plain. Water 2021, 13, 3426. [Google Scholar] [CrossRef]
  12. Mills, F.; Willetts, J.; Evans, B.; Carrard, N.; Kohlitz, J. Costs, climate and contamination: Three drivers for citywide sanitation investment decisions. Front. Environ. Sci. 2020, 8, 130. [Google Scholar] [CrossRef]
  13. Al-Hashimi, O.; Hashim, K.; Loffill, E.; Marolt Čebašek, T.; Nakouti, I.; Faisal, A.A.; Al-Ansari, N. A comprehensive review for groundwater contamination and remediation: Occurrence, migration and adsorption modelling. Molecules 2021, 26, 5913. [Google Scholar] [CrossRef] [PubMed]
  14. Lachassagne, P. Will We Soon Run Out of Water? Ann. Nutr. Metab. 2021, 76 (Suppl. 1), 17–24. [Google Scholar] [CrossRef] [PubMed]
  15. Analy, M.; Laftouhi, N.-E. Groundwater depletion in an urban environment under semiarid climate and persistent drought–city of Marrakesh (Morocco). Water 2021, 13, 3253. [Google Scholar] [CrossRef]
  16. Hssaisoune, M.; Bouchaou, L.; Sifeddine, A.; Bouimetarhan, I.; Chehbouni, A. Moroccan groundwater resources and evolution with global climate changes. Geosciences 2020, 10, 81. [Google Scholar] [CrossRef]
  17. Carneiro, J.F.; Boughriba, M.; Correia, A.; Zarhloule, Y.; Rimi, A.; El Houadi, B. Evaluation of climate change effects in a coastal aquifer in Morocco using a density-dependent numerical model. Environ. Earth Sci. 2010, 61, 241–252. [Google Scholar] [CrossRef]
  18. Baudron, P.; Barbecot, F.; Aróstegui, J.L.G.; Leduc, C.; Travi, Y.; Martinez-Vicente, D. Impacts of human activities on recharge in a multilayered semiarid aquifer (Campo de Cartagena, SE Spain). Hydrol. Process. 2014, 28, 2223–2236. [Google Scholar] [CrossRef]
  19. Bouchaou, L.; Michelot, J.; Qurtobi, M.; Zine, N.; Gaye, C.; Aggarwal, P.; Marah, H.; Zerouali, A.; Taleb, H.; Vengosh, A. Origin and residence time of groundwater in the Tadla basin (Morocco) using multiple isotopic and geochemical tools. J. Hydrol. 2009, 379, 323–338. [Google Scholar] [CrossRef]
  20. El-Halouani, H.; Yacine, Z.; Hasib, A. Study of the groundwater quality in the irrigated plain of Tadla. J. Mater. Environ. Sci 2017, 8, 2792–2799. [Google Scholar]
  21. Barakat, A.; Meddah, R.; Afdali, M.; Touhami, F. Physicochemical and microbial assessment of spring water quality for drinking supply in Piedmont of Béni-Mellal Atlas (Morocco). Phys. Chem. Earth Parts A/B/C 2018, 104, 39–46. [Google Scholar] [CrossRef]
  22. Abourida, A. Approche hydrogéologique de la nappe du Haouz (Maroc) par télédétection, isotopie, SIG et modélisation. Thès. Doct. Fac. Sci. Univ. Cadi Ayyad Semlaliya Marrakech 2007, 146. [Google Scholar]
  23. Ahmed, M.; Aqnouy, M.; El Messari, J.S. Sustainability of Morocco’s groundwater resources in response to natural and anthropogenic forces. J. Hydrol. 2021, 603, 126866. [Google Scholar] [CrossRef]
  24. Mastrocicco, M.; Vignoli, G.; Colombani, N.; Zeid, N.A. Surface electrical resistivity tomography and hydrogeological characterization to constrain groundwater flow modeling in an agricultural field site near Ferrara (Italy). Environ. Earth Sci. 2010, 61, 311–322. [Google Scholar] [CrossRef]
  25. Abdessamad, N.; Amina, W. Geological And Geotechnical Characterization of the Beni Moussa Perimeter in the Tadla Plain (Morocco). Eur. Sci. J. ESJ 2020, 16, 204. [Google Scholar] [CrossRef]
  26. Didi, S.; Housni, F.E.; Bracamontes del Toro, H.; Najine, A. Mapping of soil salinity using the Landsat 8 image and direct field measurements: A case study of the tadla plain, Morocco. J. Indian Soc. Remote Sens. 2019, 47, 1235–1243. [Google Scholar] [CrossRef]
  27. El Kiram, N.; Jaffal, M.; Kchikach, A.; El Azzab, D.; El Ghorfi, M.; Khadiri, O.; Jourani, E.-S.; Manar, A.; Nahim, M. Phosphatic series under Plio-Quaternary cover of Tadla Plain, Morocco: Gravity and seismic data. Comptes Rendus. Géosci. 2019, 351, 420–429. [Google Scholar] [CrossRef]
  28. Choubert, G.; Faure-Muret, A. Evolution du domaine atlasique marocain depuis les temps paléozoïques. Mémoire Hors-Série-Société Géologique Fr. 1960, 1, 447–527. [Google Scholar]
  29. Kuper, M.; Errahj, M.; Faysse, N.; Caron, P.; Djebbara, M.; Kemmoun, H. Autonomie et dépendance des irrigants en grande hydraulique: Observations de l’action organisée au Maroc et en Algérie. Nat. Sci. Soc. 2009, 17, 248–256. [Google Scholar] [CrossRef]
  30. El Hammoumi, N.; Sinan, M.; Lekhlif, B.; El Mahjoub, L. Évaluation de la qualité des eaux souterraines pour l’utilisation dans l’eau potable et l’agriculture: Plaine de Tadla, Maroc. Afr. Sci. Rev. Int. Des Sci. Technol. 2012, 8, 54–66. [Google Scholar]
  31. Hammani, A.; Kuper, M.; Debbarh, A.; Bouarfa, S.; Badraoui, M.; Bellouti, A. Evolution de l’exploitation des eaux souterraines dans le périmètre irrigué du Tadla. In Proceedings of the Séminaire sur la Modernisation de L’agriculture Irriguée, Rabat, Morocco, 19–21 April 2004; IAV Hassan II: Rabat, Morocco, 2004; p. 8. [Google Scholar]
  32. Aghzar, N.; Berdai, H.; Bellouti, A.; Soudi, B. Pollution nitrique des eaux souterraines au Tadla (Maroc). Rev. Des Sci. L’eau 2002, 15, 459–492. [Google Scholar] [CrossRef]
  33. Salahddine, D.; Housni, F.E.; Najine, A.; Wafik, A.; Aadraoui, M.; Hafiane, F.Z.; del Toro, H.B. Mapping and characterization of agricultural systems from time series of Normalized Difference Vegetation Index (NDVI) in the northeast area of Tadla, Morocco. Nat. Resour. 2017, 8, 24–30. [Google Scholar] [CrossRef]
  34. Zaitouni, M.; Ibouh, H. Apport de la Télédétection Dans L’évaluation de la Variation des Surfaces d’eau, du sol et du Couvert Végétal Dans la Plaine du Tadla entre 1984 et 2015. 2016. Available online: https://www.researchgate.net/publication/313851248_Apport_de_la_teledetection_dans_l%27evaluation_de_la_variation_des_surfaces_d%27eau_du_sol_et_du_couvert_vegetal_dans_la_Plaine_du_Tadla_entre_1984_et_2015 (accessed on 31 May 2025).
  35. Van den Bosch, J.W.H. Mémoire Explicatif de la Carte Gravimétrique du Maroc (Provinces du Nord) au 1/500,000; Editions du Service géologique du Maroc: Rabat, Morocco, 1981. [Google Scholar]
  36. Everaerts, M.; Mansy, J.-L. Le filtrage des anomalies gravimétriques; une clé pour la compréhension des structures tectoniques du Boulonnais et de l’Artois (France). Bull. La Société Géologique Fr. 2001, 172, 267–274. [Google Scholar] [CrossRef]
  37. Package, G. Geosoft Mapping and Processing System; Geosoft Inc.: Toronto, ON, Canada, 1994. [Google Scholar]
  38. René, R. Gravity inversion using open, reject, and “shape-of-anomaly” fill criteria. Geophysics 1986, 51, 988–994. [Google Scholar] [CrossRef]
  39. Vajda, P.; Bódi, J.; Camacho, A.G.; Fernández Torres, J.; Pašteka, R.; Zahorec, P.; Papčo, J. Gravimetric inversion based on model exploration with growing source bodies (Growth) in diverse earth science disciplines. AIMS Math. 2024, 9, 11735–11761. [Google Scholar] [CrossRef]
  40. Ducarme, B. La gravimétrie à l’Observatoire Royal de Belgique. Ciel Terre 1970, 86, 125. [Google Scholar]
  41. Fores, B. Gravimétrie et Surveillance Sismique Pour la Modélisation Hydrologique en Milieu Karstique: Application au Bassin du Durzon (Larzac, France). Ph.D. Thesis, Université Montpellier, Montpellier, France, 2016. [Google Scholar]
  42. Nasr, I.H.; Ben Salem, A.; Inoubli, M.H.; Dhifi, J.; Alouani, R.; Chaqui, A.; Perthuisot, V. Contribution of gravimetry in collapsed structure characterization in the Nebeur region (Northwest Tunisia). SWISS J. Geosci. 2008, 101, 16–27. [Google Scholar]
  43. Nackers, G.-C. Analyse des Données Gravimétriques en Forage d’un Gisement de Sulfures Massifs Volcanogènes Dans un Contexte Géologique Complexe. Ph.D. Thesis, École Polytechnique de Montréal, Montréal, QC, Canada, 2013. [Google Scholar]
  44. Archibald, N.; Gow, P.; Boschetti, F. Multiscale edge analysis of potential field data. Explor. Geophys. 1999, 30, 38–44. [Google Scholar] [CrossRef]
  45. Khattach, D.; Mraoui, H.; Sbibih, D.; Chennouf, T. Analyse multi-échelle par ondelettes des contacts géologiques: Application à la carte gravimétrique du Maroc nord-oriental. Comptes Rendus Geosci. 2006, 338, 521–526. [Google Scholar] [CrossRef]
  46. Khattach, D.; Keating, P.; Chennouf, T.; Andrieux, P.; Milhi, A. Apport de la gravimétrie à l’étude de la structure du bassin des Triffa (Maroc nord-oriental): Implications hydrogéologiques. Comptes Rendus Geosci. 2004, 336, 1427–1432. [Google Scholar] [CrossRef]
  47. Vanié, L.T.A.; Khattach, D.; Houari, M.R. Apport des filtrages des anomalies gravimétriques à l’étude des structures profondes du Maroc oriental. Bull. Inst. Sci. 2005, 29–40. [Google Scholar]
  48. Cordell, L.; Grauch, V. Mapping basement magnetization zones from aeromagnetic data in the San Juan Basin, New Mexico. In The Utility of Regional Gravity and Magnetic Anomaly Maps; Society of Exploration Geophysicists: Houston, TX, USA, 1985; pp. 181–197. [Google Scholar]
  49. Abubakar, A.; Likkason, O.K. Exploring the application of potential field gravity method in characterizing regional-trends of the Earth’s sequence system over the Sokoto Basin, NW, Nigeria. In Earth’s Crust and Its Evolution—From Pangea to the Present Continents; IntechOpen: London, UK, 2022. [Google Scholar]
  50. Jacoby, W.; Smilde, P.L. Gravity Interpretation: Fundamentals and Application of Gravity Inversion and Geological Interpretation; Springer Science & Business Media: Berlin/Heidelberg, Germany, 2009. [Google Scholar]
  51. Bassett, D.; Watts, A.B. Gravity anomalies, crustal structure, and seismicity at subduction zones: 1. Seafloor roughness and subducting relief. Geochem. Geophys. Geosyst. 2015, 16, 1508–1540. [Google Scholar] [CrossRef]
  52. Dai, S.-K.; Jia, J.-R.; Qiang, J.-K.; Chen, Q.-R.; Ling, J.-X.; Zhang, Y. Three-dimensional numerical simulation of geothermal field in space—Wavenumber domain. Appl. Geophys. 2021, 18, 435–450. [Google Scholar]
  53. Khattach, D.; Houari, M.; Corchete, V.; Chourak, M.; El Gout, R.; Ghazala, H. Main crustal discontinuities of Morocco derived from gravity data. J. Geodyn. 2013, 68, 37–48. [Google Scholar] [CrossRef]
  54. Timur, E. Assessment of Vertical Magnetic Gradient Data of Tuzla Fault Using Boundary Analysis and 3-D Inversion Techniques. J. Power Energy Eng. 2017, 5, 33. [Google Scholar] [CrossRef]
  55. Chennouf, T.; Khattach, D.; Milhi, A.; Andrieux, P.; Keating, P. Principales lignes structurales du Maroc nord-oriental: Apport de la gravimétrie. Comptes Rendus Géosci. 2007, 339, 383–395. [Google Scholar] [CrossRef]
  56. El Gout, R.; Khattach, D.; Houari, M.-R.; Kaufmann, O.; Aqil, H. Main structural lineaments of north-eastern Morocco derived from gravity and aeromagnetic data. J. Afr. Earth Sci. 2010, 58, 255–271. [Google Scholar] [CrossRef]
  57. Blakely, R.J.; Simpson, R.W. Approximating edges of source bodies from magnetic or gravity anomalies. Geophysics 1986, 51, 1494–1498. [Google Scholar] [CrossRef]
  58. Zakariah, M.N.A.; Roslan, N.; Sulaiman, N.; Lee, S.C.H.; Hamzah, U.; Noh, K.A.M.; Lestari, W. Gravity analysis for subsurface characterization and depth estimation of Muda River Basin, Kedah, Peninsular Malaysia. Appl. Sci. 2021, 11, 6363. [Google Scholar] [CrossRef]
  59. Harrison, J.; Dickinson, M. Fourier transform methods in local gravity modeling. Bull. Géodésique 1989, 63, 149–166. [Google Scholar] [CrossRef]
  60. Obasi, A.; Onwuemesi, A.; Romanus, O. An enhanced trend surface analysis equation for regional–residual separation of gravity data. J. Appl. Geophys. 2016, 135, 90–99. [Google Scholar] [CrossRef]
  61. Zhou, R.; Guo, J.; Ya, S.; Sun, H.; Liu, X. SDUST2023VGGA: A global ocean vertical gradient of gravity anomaly model determined from multidirectional data from mean sea surface. Earth Syst. Sci. Data 2025, 17, 817–836. [Google Scholar] [CrossRef]
  62. Tenzer, R.; Chen, W. Mantle and sub-lithosphere mantle gravity maps from the LITHO1. 0 global lithospheric model. Earth-Sci. Rev. 2019, 194, 38–56. [Google Scholar] [CrossRef]
  63. Zappone, A.; Kissling, E. SAPHYR: Swiss Atlas of Physical Properties of Rocks: The continental crust in a database. Swiss J. Geosci. 2021, 114, 13. [Google Scholar] [CrossRef]
  64. Kumar, P.; Mohanty, W.K. Evaluating the lithospheric structure and regional/residual bouguer anomalies in Peninsular India through potential field modeling and thermal analysis. J. Geophys. Res. Solid Earth 2025, 130, e2024JB029341. [Google Scholar] [CrossRef]
  65. Khattach, D.; El Gout, R.; Ziani, S.; Nouayti, A.; Nouayti, N.; Bouazza, M. Enhancing subsurface geological imaging of Angad Basin (northeastern Morocco) through the integration of gravity and electrical data: New insights into the Jurassic deep aquifer for groundwater exploration and development. Geophys. J. Int. 2025, 241, 1186–1203. [Google Scholar] [CrossRef]
  66. Bezák, V.; Bielik, M.; Marko, F.; Zahorec, P.; Pašteka, R.; Vozár, J.; Papčo, J. Geological and tectonic interpretation of the new Bouguer gravity anomaly map of Slovakia. Geol. Carpathica 2023, 74, 109–122. [Google Scholar] [CrossRef]
  67. Jaffal, M.; Charbaoui, A.; Kchikach, A.; El Ghorfi, M.; Khaldoun, A.; Safhi, A.E.M.; Bodinier, J.-L.; Yazami, O.K.; Jourani, E.-S.; Manar, A. Gravity study of the Western Bahira Basin and the Gantour Phosphatic Plateau, central Morocco: Interpretation and hydrogeological implications. J. Afr. Earth Sci. 2022, 193, 104581. [Google Scholar] [CrossRef]
  68. Ikirri, M.; Jaffal, M.; Rezouki, I.; Echogdali, F.Z.; Boutaleb, S.; Abdelrahman, K.; Abu-Alam, T.; Faik, F.; Kchikach, A.; Abioui, M. Contribution of gravity data for structural characterization of the Ifni inlier, western Anti-Atlas, Morocco: Hydrogeological implications. Appl. Sci. 2023, 13, 6002. [Google Scholar] [CrossRef]
  69. Bba, A.N.; Boujamaoui, M.; Amiri, A.; Hejja, Y.; Rezouki, I.; Baidder, L.; Inoubli, M.; Manar, A.; Jabour, H. Structural modeling of the hidden parts of a Paleozoic belt: Insights from gravity and aeromagnetic data (Tadla Basin and Phosphates Plateau, Morocco). J. Afr. Earth Sci. 2019, 151, 506–522. [Google Scholar] [CrossRef]
  70. Ndongmo, G.N.; Koumetio, F.; Ngapgue, F.; Lemoubou, E.L. Detection and characterization of lineaments using gravity data in the south-west Cameroon zone: Hydrogeological implications. Open Geosci. 2023, 15, 20220578. [Google Scholar] [CrossRef]
  71. Chennouf, T.; Khattach, D.; Milhi, A.; Andrieux, P.; Keating, P. Détermination de la structure du bassin des Triffa par interprétation conjointe des données gravimétriques et sismiques: Implications hydrogéologiques (résumé étendu). In Actes du 2e Colloque de Géophysique Appliquée; 2004; pp. 30–32. [Google Scholar]
  72. Najine, A.; Jaffal, M.; El-Khammari, K.; Aïfa, T.; Khattach, D.; Himi, M.; Casas, A.; Badrane, S.; Aqil, H. Contribution of gravimetry to the structural study of the Tadla basin: Hydrogeological implications. Comptes Rendus Geosci. 2006, 338, 676–682. [Google Scholar] [CrossRef]
  73. El Goumi, N.; Jaffal, M.; Kchikach, A.; Manar, A. Contribution of the gravimetry to the structural study of the Haouz basin (Morocco). Estud. Geol. 2010, 66, 181–191. [Google Scholar] [CrossRef]
  74. Khattach, J.A.D. Contribution de la gravimétrie à l’étude de la structure des Hauts Plateaux (Maroc oriental). Bull. L’institut Sci. Rabat 2010, 32, 19–30. [Google Scholar]
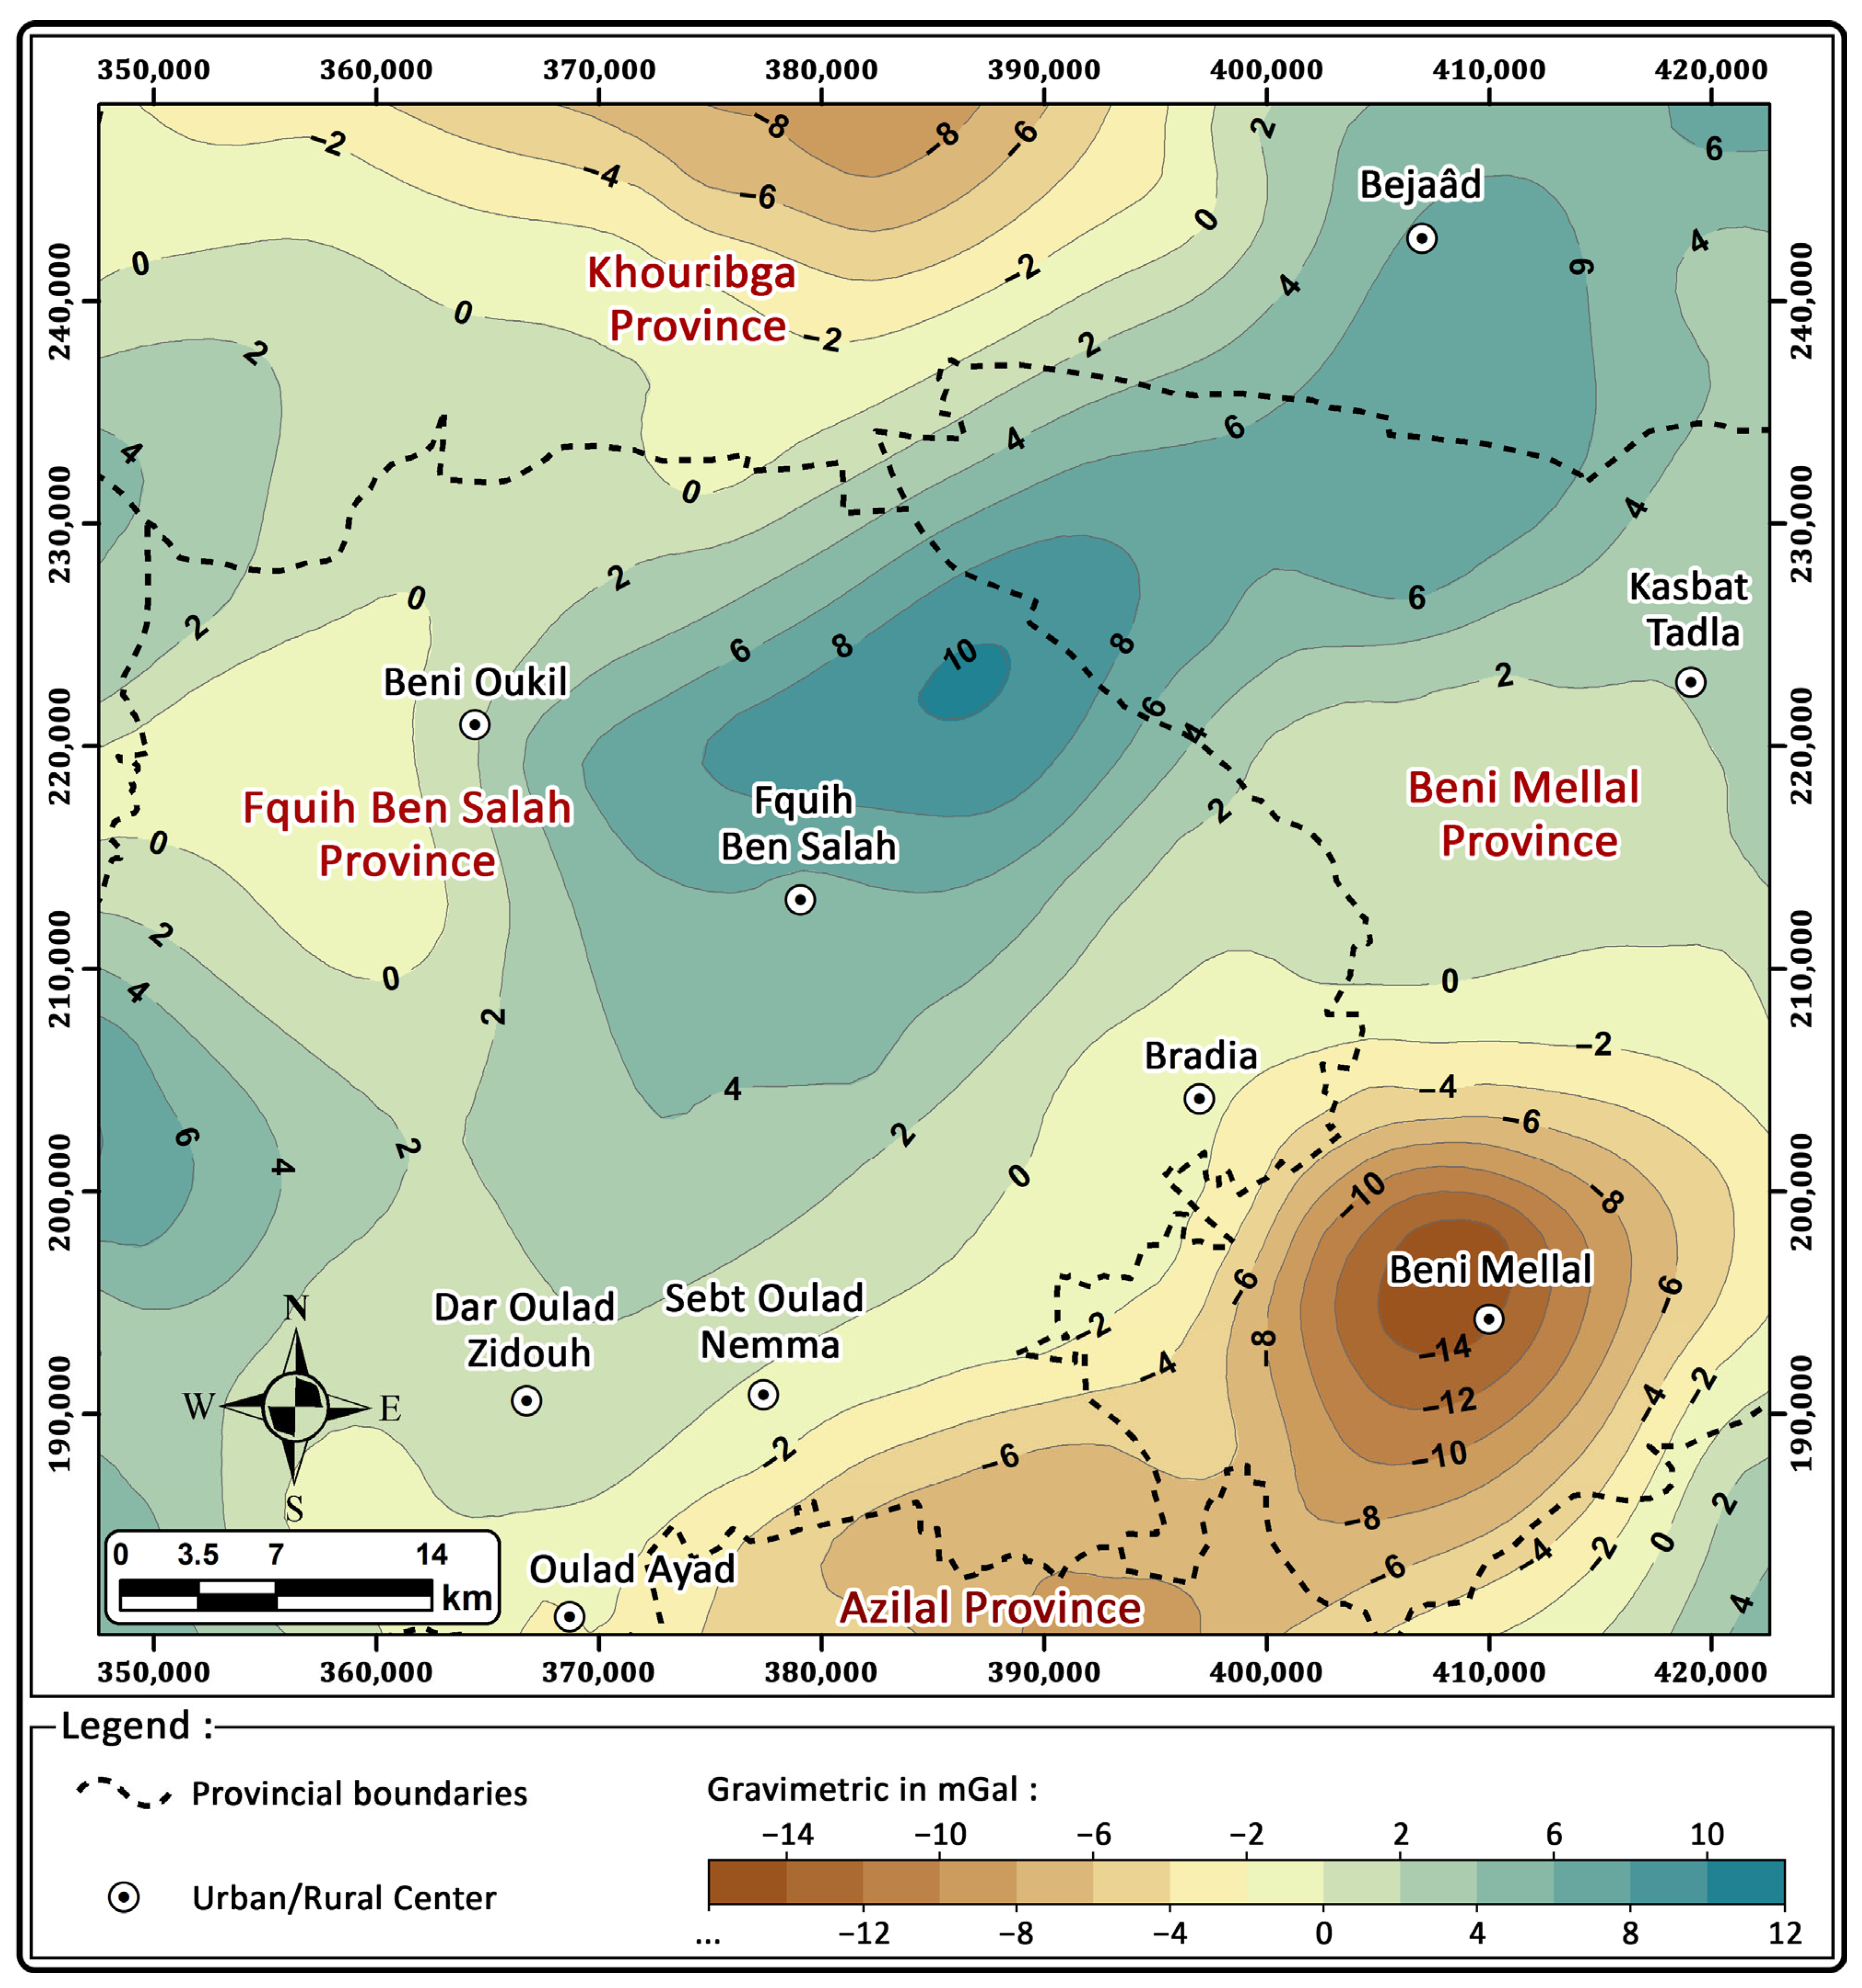
Figure 1. Situation of the study area at the scale of the Oum Er-bia Basin.
Geographies 05 00035 g001
Figure 2. Geological section showing the structure of the Tadla aquifer system [19].
Geographies 05 00035 g002
Figure 3. Flowchart used in this study.
Geographies 05 00035 g003
Figure 4. Gravity map of the Tadla Basin anomaly.
Geographies 05 00035 g004
Figure 5. Gravimetric map of the residual anomaly of the study area.
Geographies 05 00035 g005
Figure 6. Illustration of the thickening of the sedimentary cover from north to south across the Tadla Basin.
Geographies 05 00035 g006
Figure 7. Geoelectric section made from electrical surveys (SE) and boreholes.
Geographies 05 00035 g007
Figure 8. Map of extensions upwards in altitude of 0.5 Km.
Geographies 05 00035 g008
Figure 9. Map of extensions upwards in altitude of 1 Km.
Geographies 05 00035 g009
Figure 10. Map of extensions upwards in altitude of 2 Km.
Geographies 05 00035 g010
Figure 11. Map of extensions upwards in altitude of 3 Km.
Geographies 05 00035 g011
Figure 12. Superposition of the horizontal gradient gravity map to the maxima of the same gradient of the residual gravity map and its upward continuations to different heights: 200 m (1), 500 m (2), 1000 m (3), 2000 m (4), and 3000 m (5).
Geographies 05 00035 g012
Figure 13. Structural diagram of the study area.
Geographies 05 00035 g013
Table 1. Principal gravimetric anomalies of the Tadla plain.
AnomaliesDirectionLocationSource
AN1NE–SWBéni MellalHighly heterogeneous sedimentary infill
AN2NE–SWAfourar—Bni AyatThick Mio-Plio-Quaternary deposits
AN3NE–SWOulad AzzouzLocalized sedimentary thickening
AP1NNE–SSWSud-Ouest de BoujadUplift of the Paleozoic basement
AP2NNE–SSWOulad Boukhadouj—Ain KaicherUplift of the Paleozoic basement
AP3NW–SEAl KhoulouteShallow Paleozoic basement
Disclaimer/Publisher’s Note: The statements, opinions and data contained in all publications are solely those of the individual author(s) and contributor(s) and not of MDPI and/or the editor(s). MDPI and/or the editor(s) disclaim responsibility for any injury to people or property resulting from any ideas, methods, instructions or products referred to in the content.

