Article

Rural Depopulation in Greece: Trends, Processes, and Interpretations

by
Apostolos G. Papadopoulos
1,* and
Pavlos Baltas
2
1
Institute of Social Research, National Centre for Social Research (EKKE) and Department of Geography, Harokopio University, 176 76 Athens, Greece
2
Institute of Social Research, National Centre for Social Research (EKKE), 105 52 Athens, Greece
*
Author to whom correspondence should be addressed.
Geographies 2024, 4(1), 1-20; https://doi.org/10.3390/geographies4010001
Submission received: 1 October 2023 / Revised: 25 November 2023 / Accepted: 18 December 2023 / Published: 22 December 2023

Abstract

:
Depopulation is caused by low fertility rates and out-migration, and it applies to countries, regions and smaller areas. Rural depopulation is defined as a sharp population decline that falls well below an adequate population size and indicates that an area has lost its demographic reproductive capacity. This paper discusses the socioeconomic and territorial aspects of rural depopulation, attempting to do justice to the spatial dimensions of the phenomenon. Greece exhibits all the symptoms of demographic transition, leading to labour shortages, declining economic productivity, and increasing demands on the health and welfare system. The study on rural depopulation in Greece focuses on the changes and dynamics observed at the municipal and regional levels. A typology has been developed to identify rural communities in Greece. The main source of demographic data for our study is the Greek censuses (1991, 2001, 2011, and 2021). Demographic and socioeconomic trends in Greece are interlinked and show different regional and local dynamics. Rural depopulation is closely related to the study of (international and internal) migration, even though the latter does not provide a permanent solution to depopulation. An empirical analysis has shown that there is a need to revitalise rural areas through socioeconomic improvements, infrastructure investments, and policies that directly impact rural communities.

1. Introduction

The concept of depopulation refers to population decline caused by low fertility rates and out-migration, and it applies to countries, regions, and smaller areas. Depopulation does not simply refer to negative changes in the population size of a given area but refers to chronic population losses that prevent an area from regaining its previous population peak [1,2]. In this paper, we refer to rural depopulation as a sharp population decline that falls well below an appropriate population size and indicates that an area has lost its demographic reproductive capacity. It is important to note that the problem of population decline at the regional and rural levels goes hand in hand with regional and urban growth in other parts of the country. There are cases where long-term population decline is accompanied by permanent socioeconomic problems related to the abandonment of productive activities and/or when certain areas are exposed to international competition. Overall, population decline is not problematic by definition and is a controversial issue in any case, as its effects need to be carefully weighed in modern societies, and lower populations can have socioeconomic and environmental benefits [3] (p. 219). The rate and process of population decline are therefore important parameters that should not be neglected but properly calculated and evaluated [3] (pp. 239–240). Moreover, it is important that we place population decline and depopulation within the broader discussion of demographic transition, considered as a global phenomenon, and take into account the various demographic aspects, such as (a) changing age structure, (b) increased internal and international migration, (c) increased reproductive output due to declining fertility and mortality rates, and (d) increased life expectancy [4,5]. Far from arguing that demographic processes are the cause of socioeconomic and political processes, we argue here that we need to consider these processes in context. For example, demographic change and urbanisation may well be considered causes (rather than effects) of population decline in certain rural areas, as both are compatible with the prevailing model of economic development [6] (p. 50). This paper discusses the socioeconomic and territorial aspects of rural depopulation, attempting to do justice to the various spatial dimensions of the phenomenon.
However, the nuances of population change in a regularly changing rural environment should not be viewed only from a demographic perspective but must be linked to the dynamics of socioeconomic and spatial change in rural areas. At this point, it should be noted that rural areas are, from time to time, reclassified as urban areas, and/or, depending on the different criteria used to define areas as urban, the comparison of territorial units becomes more difficult. Moreover, the different typologies of rural areas and their extensive updates may well complicate the illustration of the long-term depopulation of rural areas in EU regions. Demographic change must be considered in conjunction with socioeconomic and spatial changes in specific areas. More specifically, the so-called “demographic problems” such as depopulation and/or population decline do not require “demographic solutions” but should be considered as socially and politically constructed [7]. Many decades ago, Saville [8], a British historian who studied and analysed the available evidence of rural depopulation in England and Wales between 1851 and 1951, stressed the urgent need for a comprehensive understanding of the phenomenon by social scientists (and in particular rural sociologists), “whose responsibility would be the analysis of the totality of rural life and the relation of each part to the whole”, while recognising the political reasons for the possible resolution of such demographic trends in the final sections of his book.
Rural depopulation is a global problem affecting different regions in the world, such as Latin America [9] and China [10] but also Europe, which is the wider region of concern. This paper focuses on Greece, a southern European country with similar demographic characteristics to other countries in the EU and among the more developed countries [11,12,13], which has recently suffered from a decline in population but also from a decades-long decline in rural population [14]. Rural depopulation is an emerging phenomenon in European regions that is often considered an important policy issue. According to an ESPON study [15], the regions most affected by depopulation are found in eastern [16] and Baltic countries, as well as in Germany and Southern European countries such as Greece, Portugal [17], Bulgaria [18], Romania [19], Spain [20], and Southern Italy [21]. In this study, depopulation is viewed as a “systemic phenomenon” associated with poor access to public services, low accessibility, lack of economic competitiveness and innovation, and ineffective governance. Similarly, a recent ESPON study [22] updated the relevant analysis in light of the pandemic crisis, arguing that “rural shrinkage” is symptomatic of a number of long-standing challenges to rural well-being and that long-standing processes of human capital depletion are undermining the ability of rural areas to respond to the growing opportunities of the post-pandemic world. There is an extensive amount of literature that emphasises the need to understand the population shrinkage of rural areas and find ways to confront this shrinkage in Spain and elsewhere [20,23,24,25]. The impact of rural depopulation is very important for the environment, especially because of the ecological consequences for the more vulnerable socioecological systems and mountain areas [26,27]. In this context, the European Commission, in its recent call (2021) for “A Long-term Vision for EU rural areas”, acknowledged the demographic problems faced by rural areas and launched the Rural Pact, intended as a framework for cooperation between public authorities, civil society, businesses, academia, and citizens at different administrative/spatial levels. This document [28] (p. 5) focuses on the dramatic developments regarding the population of rural areas, which is already older on average compared to other areas, and describes the challenges of negative population trends in these areas, which, combined with a lack of connectivity, infrastructures, and productivity, as well as low access to public services (e.g., education, health, care, etc.), will further deteriorate living conditions in rural areas. Concerns about the long-term prospects of rural areas are related to the objective of preserving territorial cohesion within Europe and between EU regions in particular, as the persistent lack of public services and employment opportunities will soon lead to feelings of remoteness, abandonment, and/or social exclusion. In recent years, and particularly in the context of the 2008/2009 economic crisis, the regions most affected by the economic recession, many of which were remote rural regions, have been portrayed as “left behind” regions/places [29,30]. Because demographics and economic development are closely linked, confirming divisive representations between “declining” and “better-off” regions leads to different discourses [31,32,33,34]. At the same time, we need to account for the resilience of some rural regions in times of crisis and their ability to survive despite all odds [35,36].
It is widely recognised among rural researchers and policy makers that rural areas should be viewed as a mosaic and not reduced to stereotypical notions of “backward”, “less developed”, and “less favourable” areas. Rural populations are often described as shrinking, ageing, and marginalised compared to urban and intermediate regions. This paper argues that it is important to consider the territorial and socioeconomic aspects of rural areas/regions when addressing rural population change. This is not to deny that many depopulated areas are rural, but at the same time, it cannot be argued that rural areas are depopulated by definition. The aim of this paper is to analyse the phenomenon of depopulation in the rural areas of Greece and to achieve a better understanding of the observed trends and the older/newer processes by seeking interpretations based on quantitative and qualitative data. In this context, the causes of rural depopulation in Greece are highlighted, its consequences are studied, and feasible strategies are proposed to counteract this demographic trend.
This paper is divided into four main sections. First, the socioeconomic context and the main demographic trends in Greece are discussed. Second, the data and the methodology used are briefly presented. This paper uses the available data from the latest Greek censuses (1991–2001–2011–2021) in combination with the population estimates of the Hellenic Statistical Authority (ELSTAT) for the period of 2011–2020. Third, the available census data are analysed, focusing on rural areas that have experienced population decline in recent decades. Next, depopulation trends in these areas are examined in combination with socioeconomic and spatial data to highlight the determinants and processes of depopulation. Some demographic and socioeconomic indicators are used to capture economic conditions, the impact of the economic recession, and socioeconomic trends in rural areas. Finally, based on the statistical results and empirical data, certain interpretations are proposed, and some policy recommendations are made to curb depopulation in rural areas of Greece. By combining academic research and empirical evidence, this study contributes to a better understanding of rural depopulation in the context of the European Union and provides information for policy interventions based on empirical evidence.

2. The Demographic and Socioeconomic Context
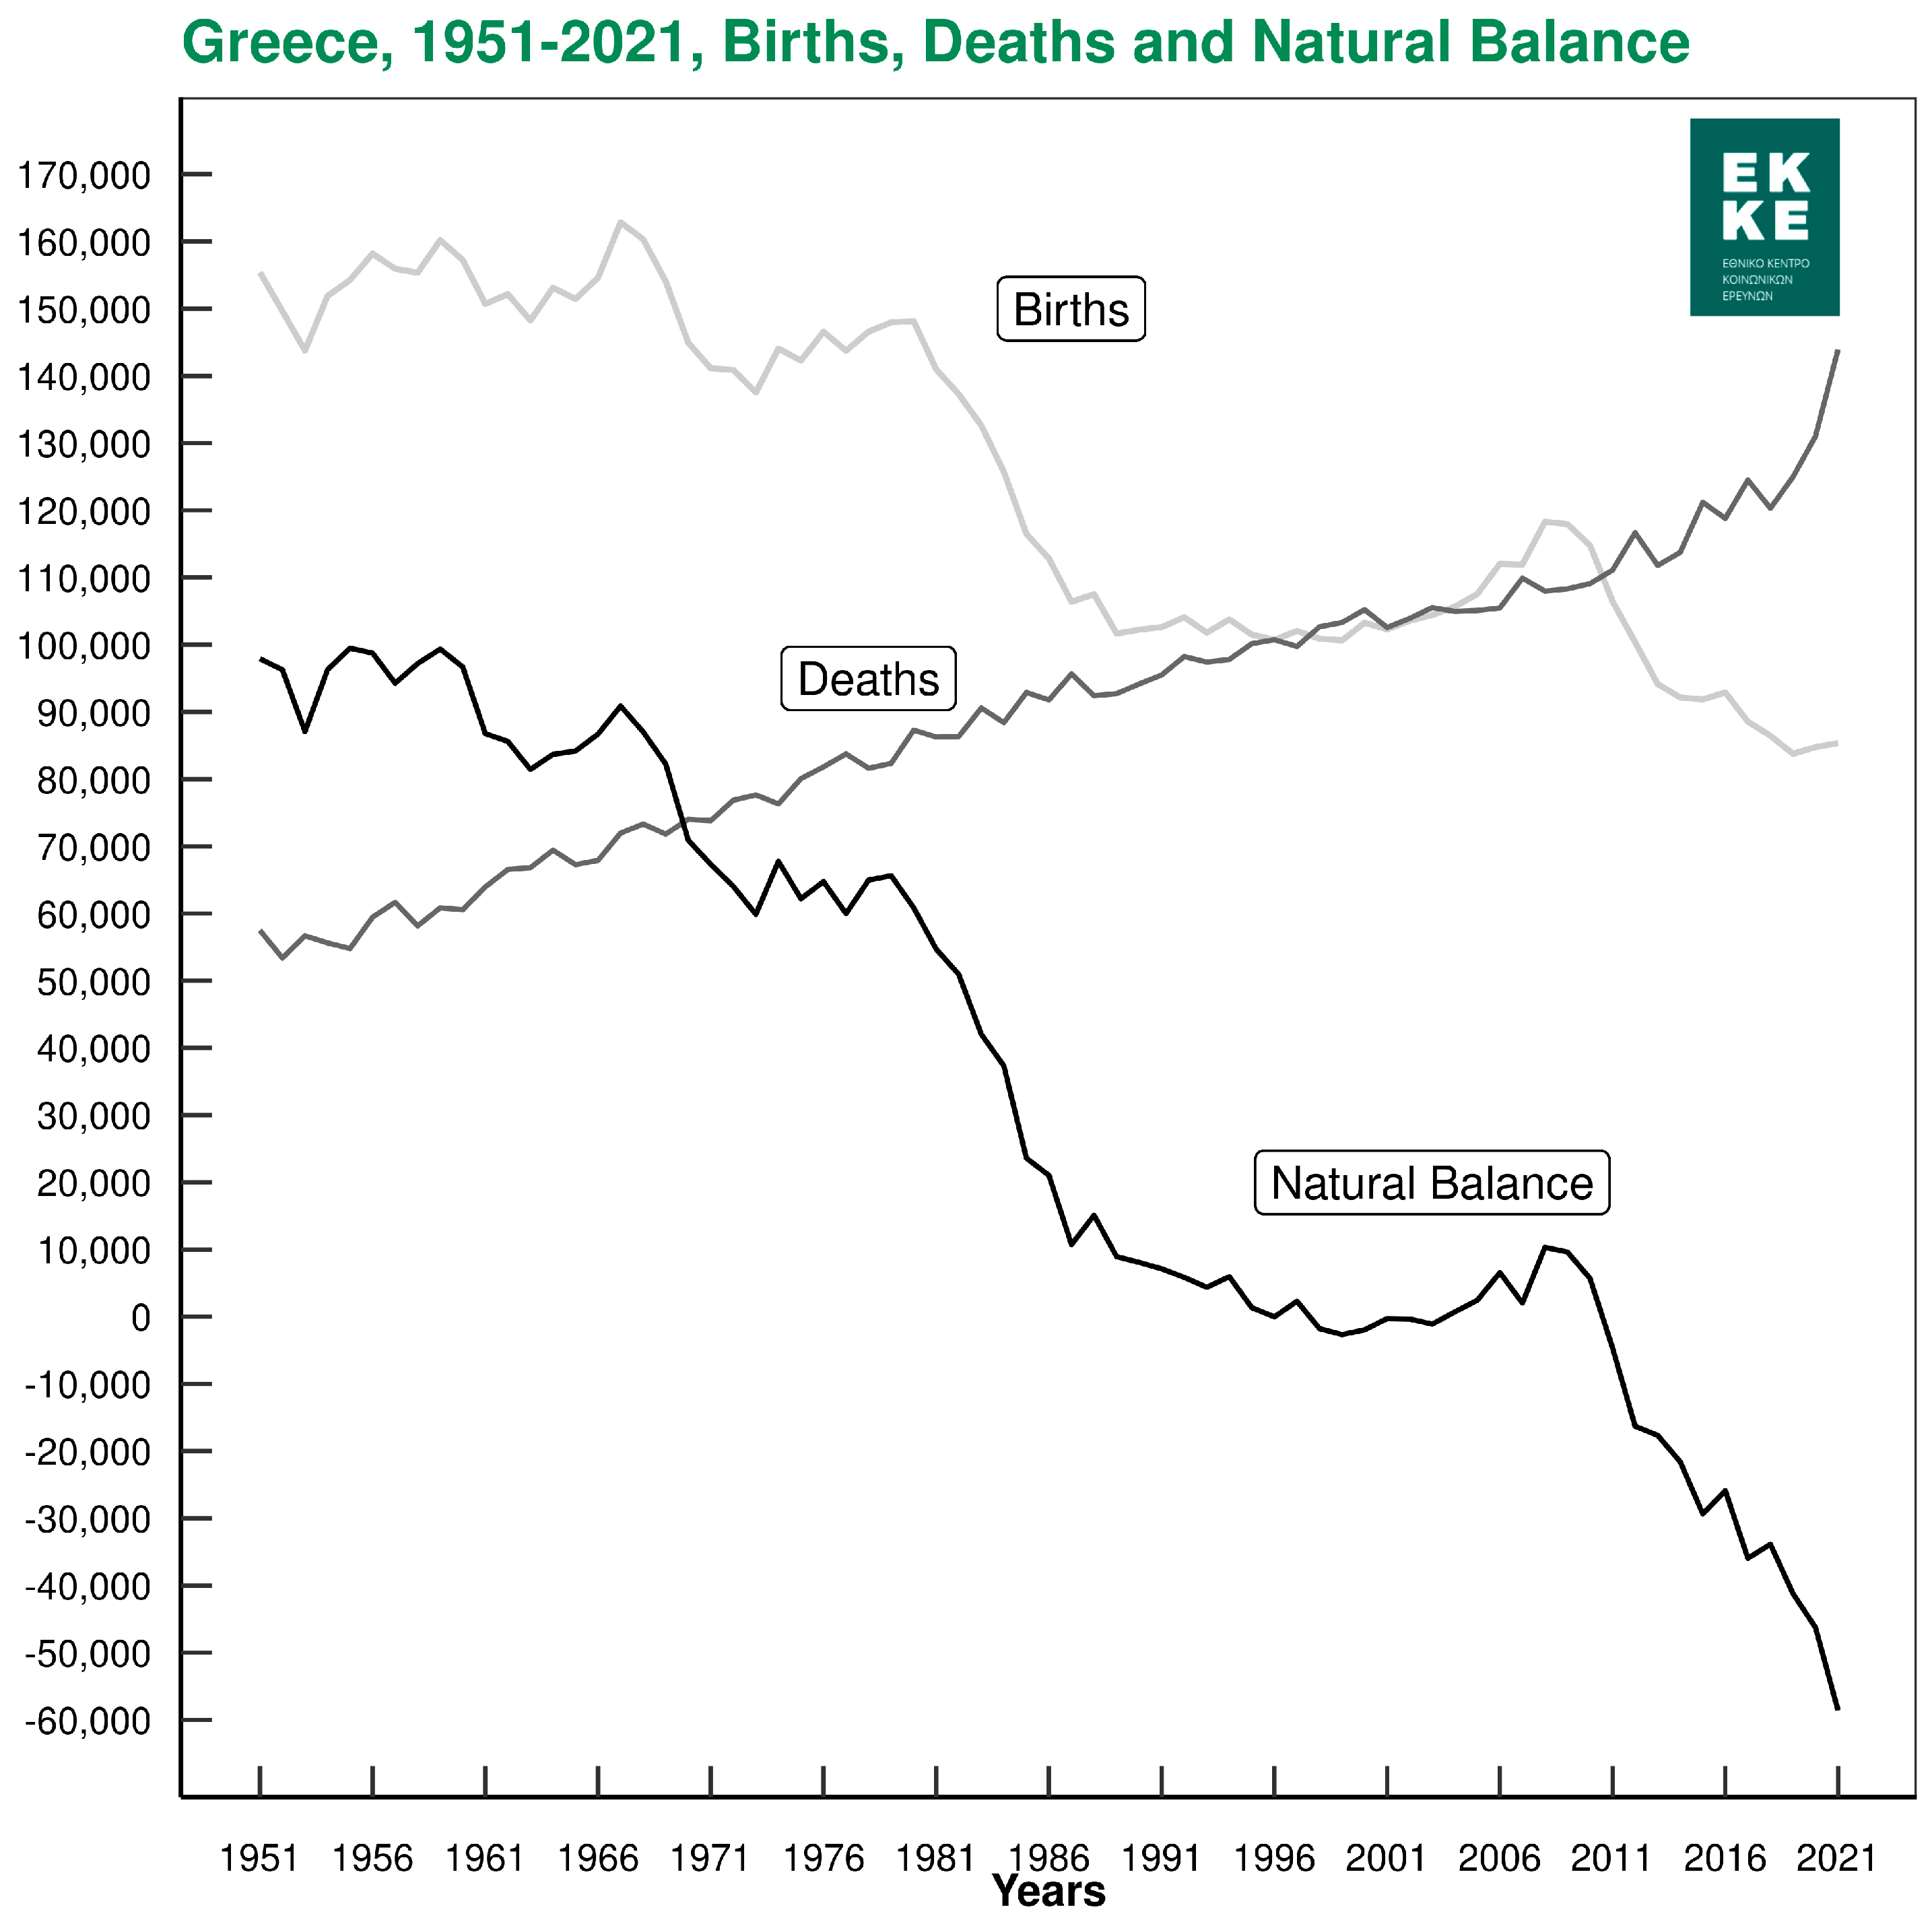
In the mid-1970s, the demographic picture of Greece strongly resembled that of economically developed countries, reflecting an increasing development dynamic that underscored the fact that the economy was growing and successful. The increasing social prosperity was probably related to the country’s entry into the European Common Market (EEC/EU), which was established by a group of strong countries. Within the country, the improvement in the educational level of the younger generation led them to reject low-skilled and unskilled jobs and instead seek permanent jobs with better pay and higher qualifications. Greece’s improved socioeconomic image attracted returnees (παλλιννοστούντες) and foreign labour migrants seeking to improve their lives.
Demographically, Greece, during this period, was in the phase of demographic transition, where despite the decline in the mortality rate, the fertility rate decreased, and the signs of ageing were already visible. Greece is considered a plausible application of the theory of demographic transition, since the assumed factors affecting fertility apply quite well in this case [37,38]. Between 1980 and 1986, the number of births decreased significantly from 148.0 to 112.0 thousand, while the crude birth rate decreased from 15‰ to 11.2‰. Fertility declined in urban areas, while in rural areas, the fertility rate maintained the generational change [39] (p. 67). The empirical results from this period show that 12.6% of women in the sample had three or more children, compared to 58.4% of their mothers. The decline in the number of births reflects, on the one hand, women’s decisions to systematically seek employment outside of the agricultural sector, and on the other hand, households’ decisions to value their income in relation to the expenses that are deemed necessary to raise children [38].
The breakdown of population by area type (urban, semi-urban, and rural) shows that rural depopulation continued in the 1970s and 1980s but was less pronounced compared to the previous decade. (“Urban areas” are areas with more than 10,000 inhabitants, “semi-urban” areas have between 2000 and 9999 inhabitants, and “rural areas” have fewer than 2000 inhabitants.) Specifically, the rural population declined from 35.2% of the total population in 1971 (3.081 million persons) to 28.4% in 1991 (2910 million persons). The numerical decrease in the period of 1971–1991 concerned 171.2 thousand persons (5.6%), while in the period of 1961–1971, there was a decrease of 592.9 thousand persons (16.1%). The population of semi-urban areas increased from 11.6% in 1971 (1.019 million persons) to 12.8% in 1991 (1.313 million persons), representing an increase of 293.3 thousand persons (28.8%). Conversely, the urban population increased from 53.2% in 1971 (4.667 million persons) to 58.8% in 1991 (6.036 million persons), which is a very significant increase of 1.369 million persons (29.8%). Especially in the decade of 1961–1971, the increase in the urban population was very significant (1.039 million persons or 29.3%) [40] (p. 48).
The particularly strong increase in the urban population between 1971 and 1991 was due to the internal population movement from the countryside to the city, but also to the return of Greek people who had emigrated in earlier periods. For example, it is worth noting that in the period of 1955–1977, about 1.236 million Greek people emigrated to the developed countries of Europe and the world, and 625.7 thousand people returned [39] (p. 69). The returnees’ preference for major urban centres can be attributed to numerous factors, including adaptation to urban consumption patterns in their host countries, the provision of social benefits, access to employment opportunities, and the acquisition of higher statuses associated with urban/consumer lifestyles.
An empirical study of Greek emigrants who returned during the period of 1971–1985, completed in 1985/1986, shows that out of a population of 627.6 thousand, more than two-thirds (69%) resided in urban areas, one in ten (9%) resided in semi-urban areas (cities and large villages), and one in four (23%) resided in rural areas. Most of the returnees (84%) were employed. In urban areas, nearly one-third of the population was in high-skilled occupations, one-third was in medium-skilled positions, and the remaining one-third comprised unskilled/manual workers. In rural areas, however, only 4% were in skilled occupations, 17% were in middle-skilled positions, and the vast majority (79%) were unskilled/manual labourers. In addition, 2% of the returnees in urban areas, 22% in semi-urban areas, and 58% in rural areas were employed in agriculture [41] (pp. 82, 85–86). The contribution of returnees in the different areas was considerable. Their reintegration into the settlement areas to which they had returned was neither facilitated nor easy, as there were no particularly targeted measures [42].
Another category of returnees are the ethnic Greek people (oμογενείς) originating from the former Soviet Union and other Eastern European countries, who have been granted the right of return since the mid-1970s [43]. Despite the difficulties in determining the size of this population—due to the fact that they travel very frequently between Greece and their countries of origin—it is estimated that between 1985 and 2000, about 150.0 thousand to 160.0 thousand ethnic Greek people returned to their homeland [44] (pp. 534, 539). This population was composed of different groups with different origins and specific challenges to their integration into Greek society. In short, they were directed to Northern Greece by official policies, while many of them ended up in large urban centres through their personal networks, as they saw more opportunities there [44] (pp. 535–537).
Until the mid-1970s, Greece was considered a country of emigration, but in the late 1980s, it joined the new immigration countries, and soon, net immigration became a significant factor in population growth [45,46,47]. The collapse of socialist regimes contributed to the fact that Greece now also received migration flows from the Balkan countries (i.e., Albania, Bulgaria, and Romania). In 1981, 176.1 thousand foreigners lived in Greece, of whom 53.7 thousand were EU citizens and 122.4 thousand were third-country nationals [48] (p. 156). Most immigrants (87%) lived in urban areas, while only 5% settled in semi-urban areas and 8% settled in rural areas. In 1991, the number of immigrants remained about the same at 167.3 thousand, of whom 32.6 thousand were EU citizens and 134.7 thousand were third-country nationals [41] (p. 58).
The share of immigrants in the total population was 1.6% in 1991, but it increased to 10% by 2001. According to estimates by the Ministry of Public Order, the number of persons with official permits ranged from 78.0 thousand to 120.0 thousand persons between 1987 and 1997, while the number of persons without permits (i.e., irregular immigrants) ranged from 160.0 thousand to 2270 thousand [46] (pp. 217–218). According to other estimates based on empirical research data, the number of irregular immigrants in the early 1990s was between 300.0 thousand and 500.0 thousand persons [45] (pp. 451–452). Most of these economic migrants, who came from Balkan and Eastern European countries, had entered irregularly to meet the growing demand for wage labour and remained irregular because the state restricted the issuance of legal documents to foreigners. Meanwhile, a large proportion of these irregular wage labour migrants, for whom there were signs of expansion, were employed in the grey labour market, particularly in agriculture, construction, and tourism, which are characterised by seasonality and a very high demand for unskilled/manual labour [47]. By the early 2000s, migration flows to Greece had become highly differentiated as geographic accessibility increasingly replaced geographic proximity to Albania, Bulgaria, and Romania as the key factor driving these flows [49]. As a result, the number of African and Asian migrants living in the country began to increase. In 2011, the number of Greek immigrants amounted to 912 thousand people, representing 8.4 percent of the total population [50,51].
The population of Greece experienced continuous and uninterrupted growth for about 60 years after the war (Table 1). Originally, this increase was due to a high natural equilibrium, that is, to the large surplus created by the number of births over deaths. The decline in births from 1980 onwards had no effect on this upward trend, while there was already a wave of return from the late 1970s onwards, which had an impact on net migration. Since the 1990s and in the following 20 years, population growth in Greece was mainly due to immigration. During this period, births were slightly higher than deaths, and the country recorded a slightly positive natural balance or even a zero balance (Figure 1).
In the period of 1991–2001, the contribution of immigrants to the growth of the country’s population was decisive. The surplus of the natural balance was positive in this decade, with only +21,617 persons, while the total increase in the country’s permanent population was +682.6 thousand persons, according to the ELSTAT data. In other words, the increase in the Greek population during this decade was almost entirely due to immigration. Between 2001 and 2011, there was a slight increase in births, which contributed positively to the population change, but the main source and cause of the continuous population growth was the positive immigration balance. However, the natural balance had already been negative since 2006. With the onset of the economic crisis, Greece was no longer attractive as a country of immigration. The economic crisis led not only to a halt in immigration, but also to a wave of emigration that not only affected the foreign population, but also the domestic population. Rising unemployment rates caused both foreigners and locals, especially young people under 35, to leave the country. Moreover, the crisis interrupted the recuperation of births that began in the early 2000s, and halted fertility increases among younger people [52]. The population decline between 2011 and 2015 was due both to the negative natural balance between successive years and primarily to emigration, which accounted for three-quarters of the total decline.
Table 1. Population, natural balance, and migration balance in Greece in the 1961–2021 period (numbers) (Source: [38,50,53]).
PopulationPeriodBirthsDeathsNatural BalanceMigration Balance
19618,388,5531951–19601,533,249577,212956,037−200,285
19718,768,6411961–19701,532,475693,050839,425−459,337
19819,740,4171971–19801,438,877801,509637,368334,408
199110,259,9001981–19901,183,634911,193272,441247,042
200110,964,0801991–20001,021,381999,76421,617682,563
201111,123,3922001–20101,098,4401,062,78635,654123,658
202110,678,6322011–2020921,3401,194,037−272,697−172,063
The influx of refugees since 2015, but especially since 2016 (when European countries gradually closed their borders), has slowed the country’s population decline. Specifically, the decline in the country’s population has slowed from −74.0 thousand people in 2015 to −20,000 people in the following three years, while Greece’s population decreased by only 6.0 thousand people between 1 January 2019 and 1 January 2020, according to ELSTAT estimates. The negative natural balance was consolidated with the latest data (2021) to −45,902 persons (84.8 thousand births versus 130.7 thousand deaths for 2021). However, it should be mentioned that most of the asylum seekers and refugees who came to Greece tended to move to other EU member states in search of a better quality of life [54]. Therefore, under the current conditions, the refugee population has only had a temporary and overall limited impact on population dynamics.

3. Data and Methods

The study on rural depopulation in Greece focuses on the changes and dynamics observed at the municipal level (325 municipalities). The main source of demographic data for our study was the Greek censuses of 1991, 2001, 2011, and 2021. These censuses provided detailed population data at the municipality level, allowing us to track population trends over time. The data come from the Panorama of Greek Census Data (https://panorama.statistics.gr/en/ (accessed on 18 January 2023)) application, developed by the National Centre for Social Research (EKKE) in collaboration with the Hellenic Statistical Authority (ELSTAT) (http://www.statistics.gr/ (accessed on 3 September 2023)). To gain a better understanding of the future outlook for Greek population size and structure, we also drew on data from EUROSTAT, which contained population projections for Greece up to the year 2100 and allowed us to analyse demographic trends and projected changes at the regional (NUTS2) level.
Using population data from the Greek censuses, we calculated the annual population growth rate (r) for different periods, including 1991–2001, 2001–2011, 2011–2021, and the period from 1991 to 2021. In addition, we created thematic maps showing the main variables at the municipality level for 1991, 2001, 2011, and 2021. These variables included the population density (persons/km2), percentage of people over 65, percentage of people with tertiary education, and percentage of people employed in the first sector of the economy. Thematic mapping allowed us to visualise the spatial patterns and variations. A typology was developed to identify the rural municipalities in Greece. This typology was primarily based on the following empirical criteria: a population density of less than 150 inhabitants per square kilometre (km2) and a share of employees in the primary sector of the economy of more than 30% (Figure 2a,b). Municipalities that met these criteria in the 1991 census were classified as rural. We then calculated the change between 1991 and 2011 for the above indicators. The main reason for not extending this analysis to 2021 is the lack of detailed population data from the last census. Despite the lack of detailed population data for 2021, we performed a Moran’s I analysis to assess the spatial autocorrelation and clustering of the annual population growth rates (r) over different time periods, including the 2011–2021 and 1991–2021 periods, which allowed us to identify spatial patterns and trends of depopulation or population growth at the municipal level. The growth rate (r) was calculated using the formula for exponential growth, r = ln(pn/p0)/n, where r is the exponential growth rate, ln() is the natural logarithm, pn is the population at the end of the period, p0 is the population at the beginning of the period, and n is the number of years in between.
Local Moran’s I maps are valuable tools for detecting spatial patterns and clusters in data [55], but like any statistical method, they have limitations of which researchers should be aware. Two important limitations are as follows: (a) the results of Local Moran’s I analysis can be sensitive to the choice of distance metric and neighbourhood definition, as different neighbourhood structures and distance metrics can lead to different cluster detection results, and (b) Local Moran’s I can identify spatial clusters and outliers, but does not provide information about the causes or processes underlying the observed spatial patterns. Researchers need to conduct further studies to understand the reasons for clustering. For the creation of the Local Moran’s I map, we used GeoDa [56]. The rest of the maps were created with R, and especially with the “Cartography” package (recently replaced by maps) [57]. Finally, the natural balance (or natural increase) is the difference between the number of births and the number of deaths in a given period. It is positive if the number of births is higher than the number of deaths, and negative if the number of deaths exceeds the number of births; it is called a “surplus” or “increase” if the number of births is higher than the number of deaths.

4. Data Analysis

For almost sixty years, Greece’s population increased steadily, but in the past decade, the country has experienced a significant population decline. From 7.5 million in 1951, the country’s population increased to 11.1 million in 2011, but since 2010, Greece has experienced a population decline due to the negative natural balance (see Figure 1) and negative net migration, which was particularly pronounced in the 2010–2015 period. The population decline coincided with the onset of the economic crisis, which soon turned into a long-term economic recession [35,36,58]. In the years that followed, the population did not recover, and the impacts of migration and refugee flows on the population size also need to be carefully studied. In particular, the population impact of the COVID-19 pandemic negatively affected the natural population balance (due to the substantial increase in deaths) and had dampening effects on migration and refugee influx. This section is divided into two sub-sections: (a) the first presents and discusses data at the local level (municipalities), and (b) the second includes data analysis at the regional level.

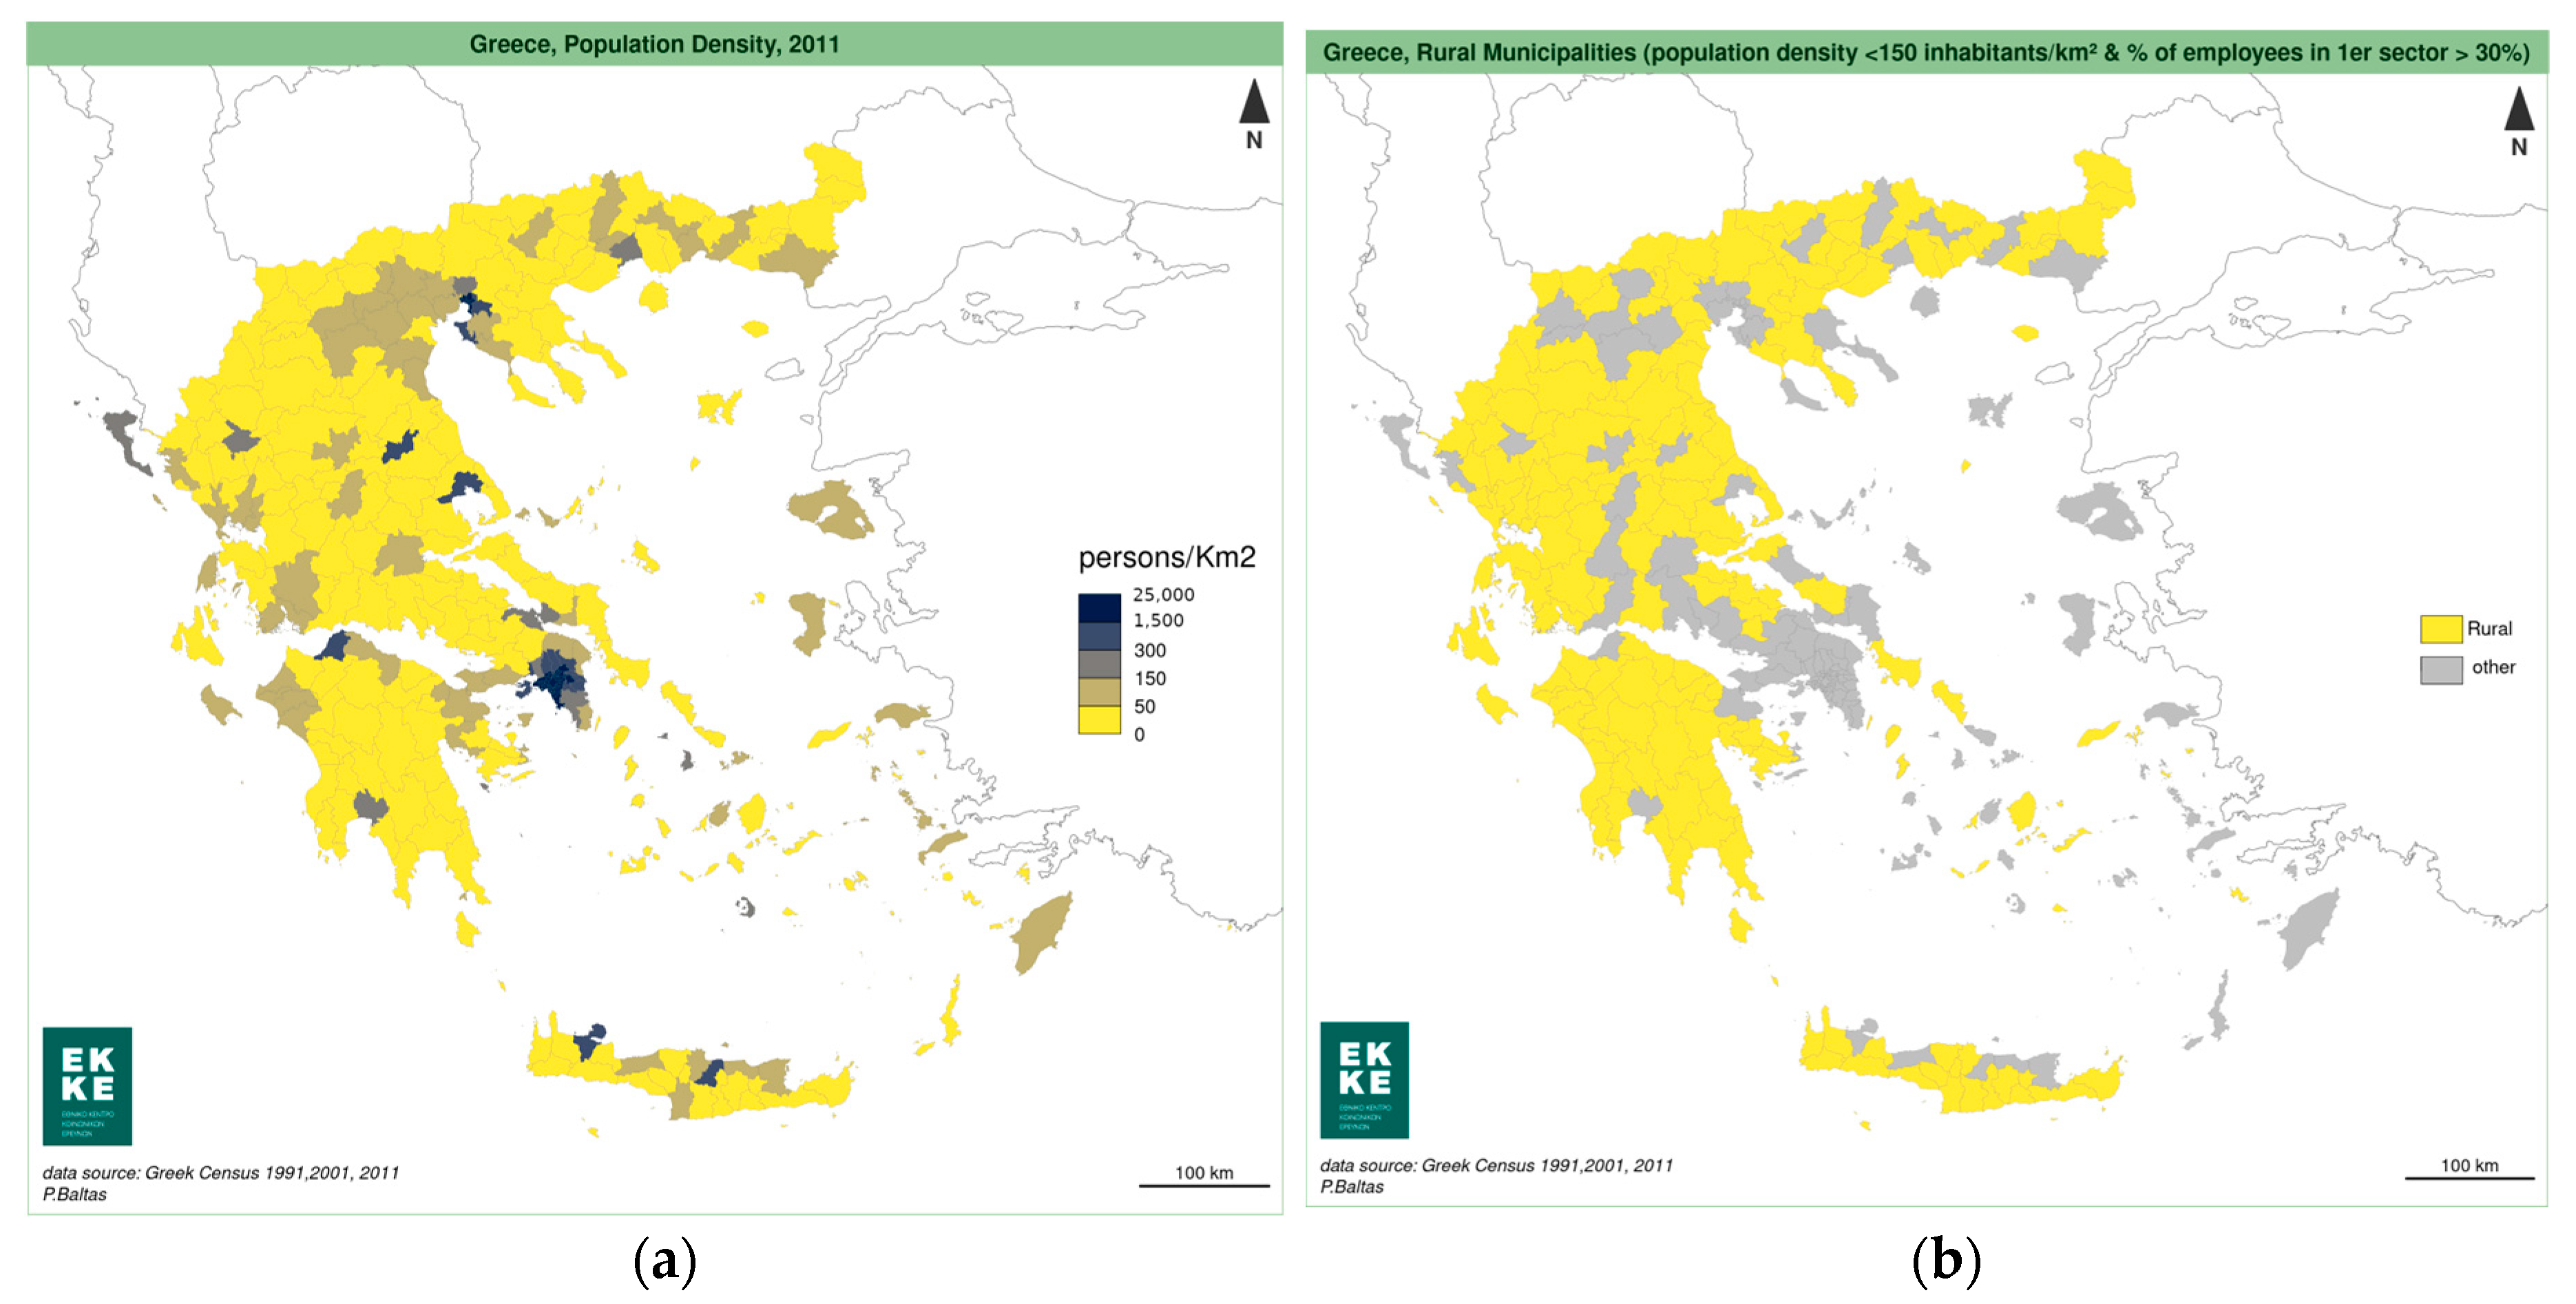
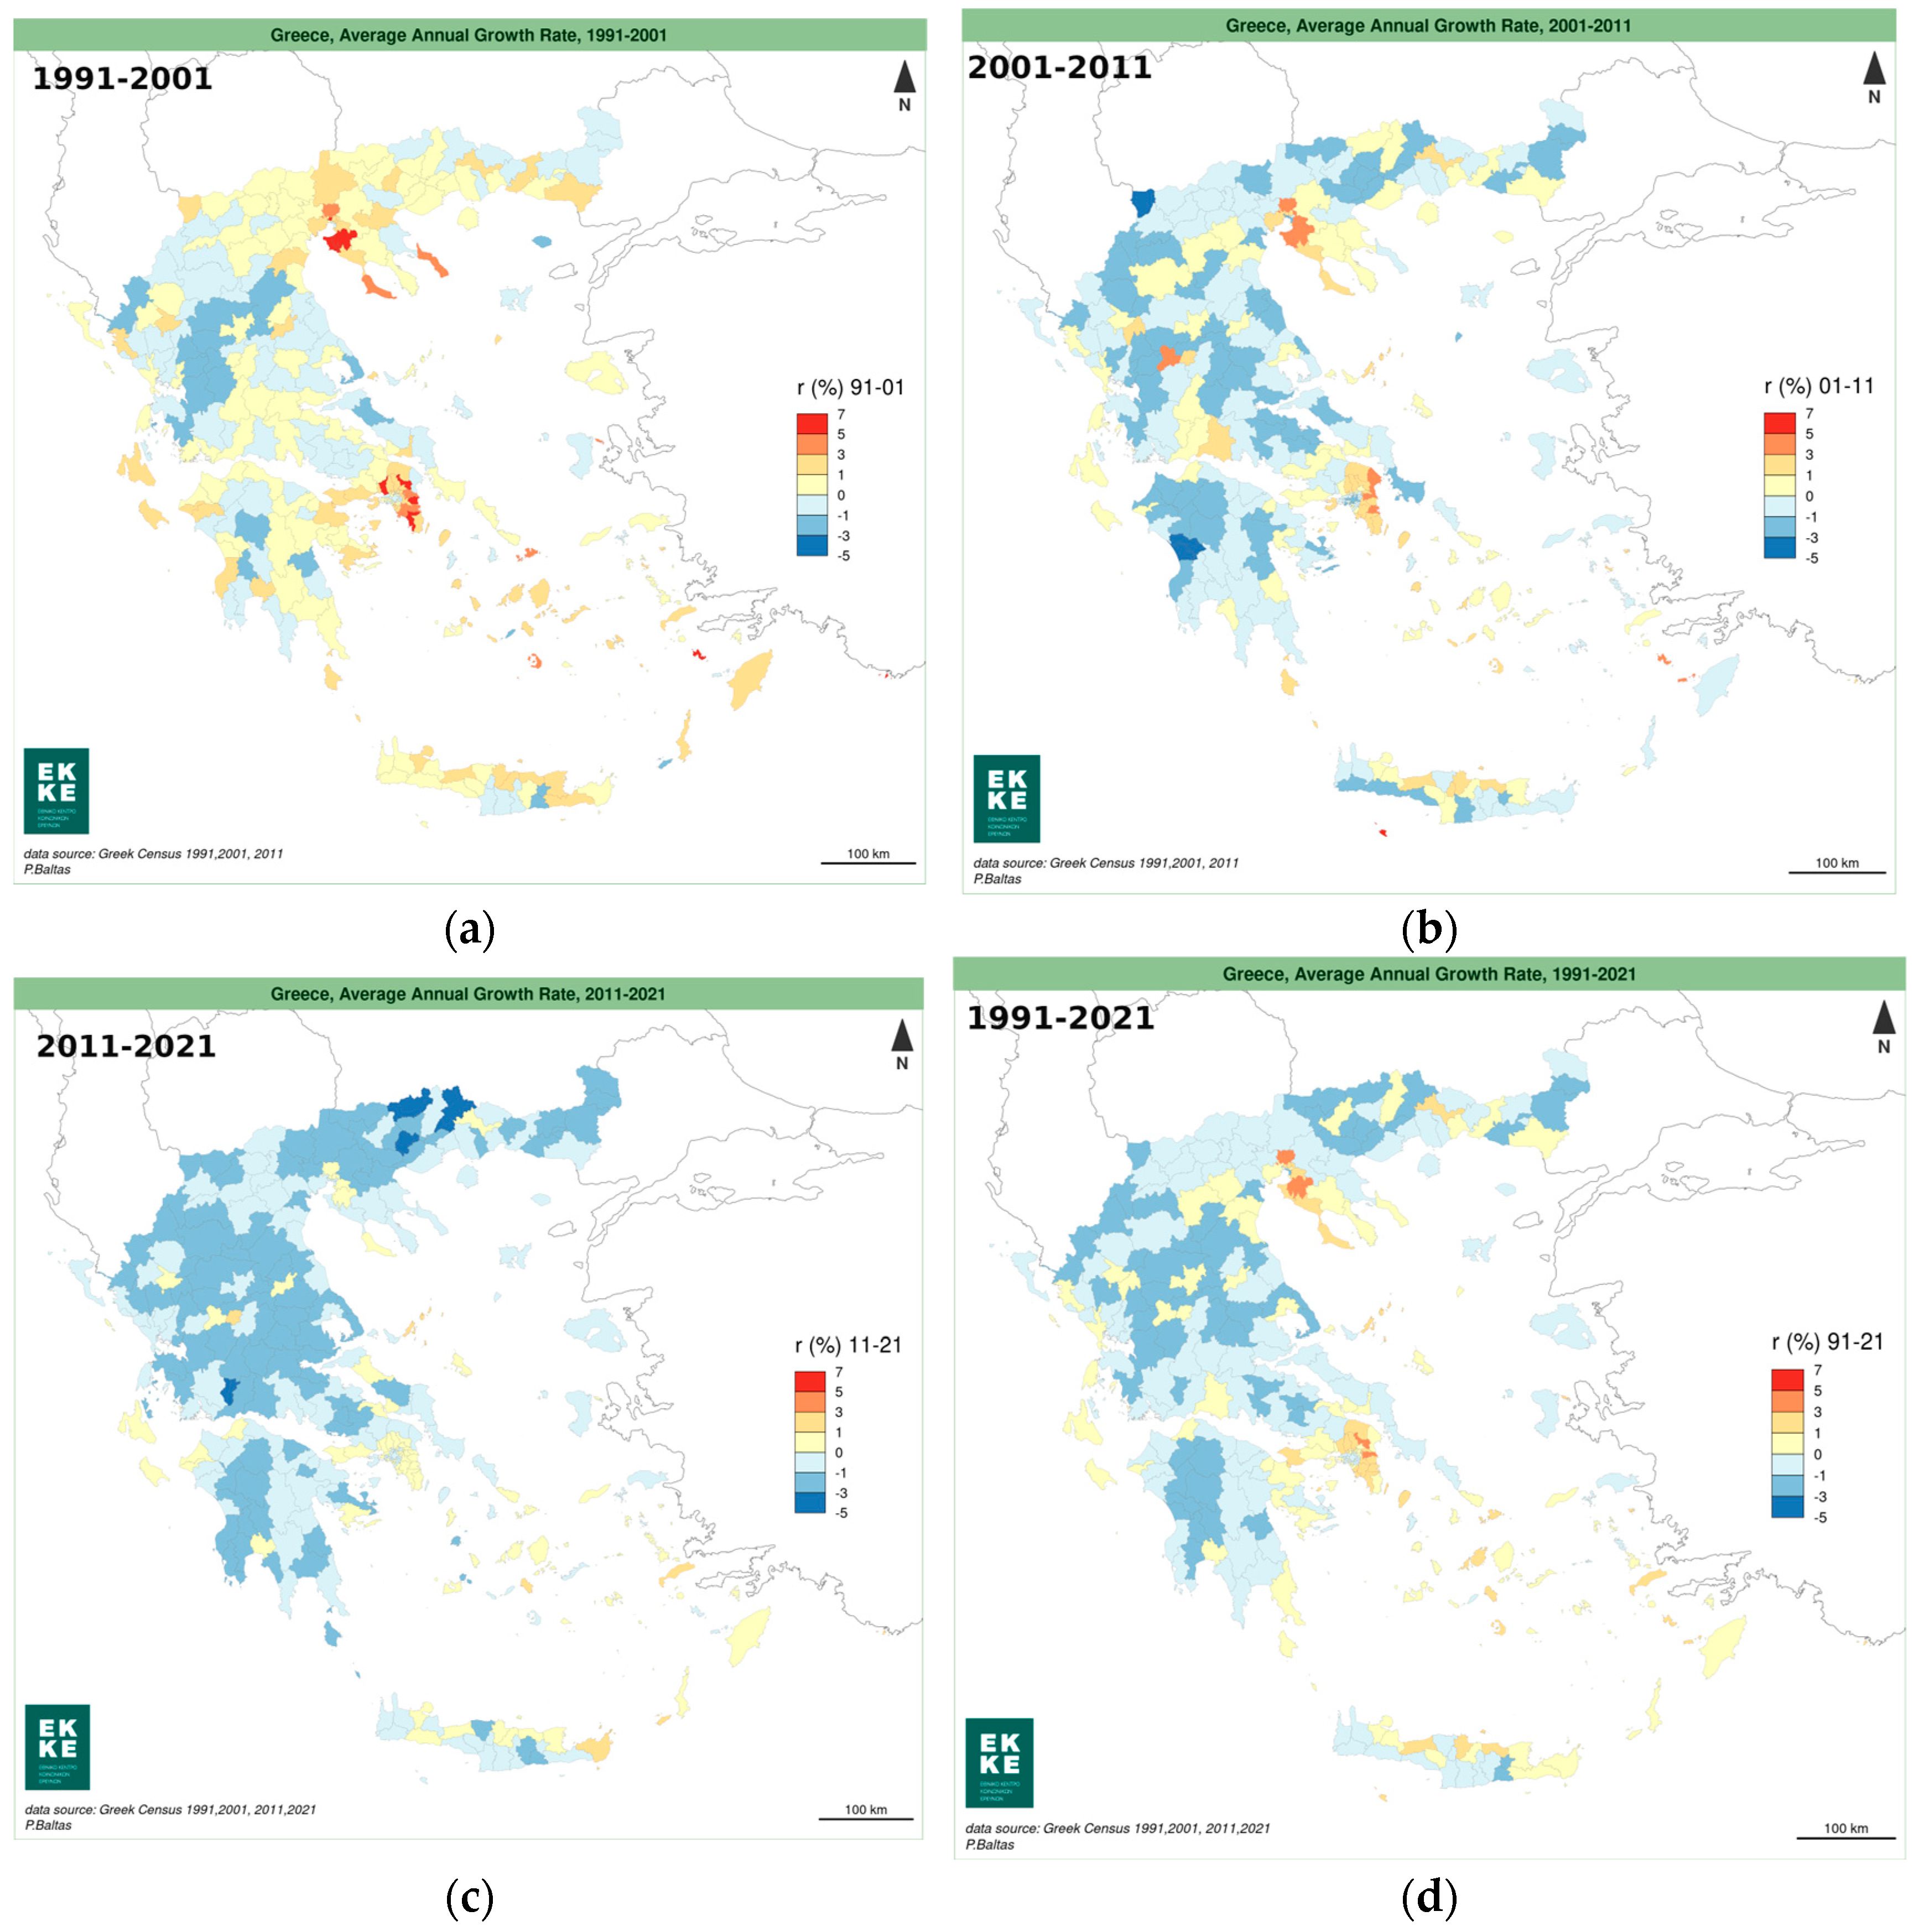
4.1. Dissecting Population Decline at the Municipal Level

During the 1991–2011 period, rural, mountainous, and remote municipalities experienced population declines, while populations continued to increase in urban areas and in the major metropolitan areas of Athens and Thessaloniki (Figure 3a,b). The Athens metropolitan area is home to nearly 40% of the total population, and if the Thessaloniki metropolitan area is added, the two major urban centres account for 50% of the country’s population. Between 2001 and 2011, more municipalities experienced a population decline than in the previous decade, but the peri-urban areas of Athens and Thessaloniki, the urban municipalities, and certain island regions show a potential for growth (Figure 3b). In this decade, the negative population trend affects a much larger number of municipalities on the mainland, in the mountainous and semi-mountainous regions, and in some coastal areas that are not developed for tourism. With depopulation and increasing concentration in urban centres, the population base of rural and remote areas is shrinking. Since this mainly affects the younger parts of the population, the depopulated areas are becoming older.
Between 2011 and 2021, many of the more rural areas on the mainland experienced population declines, while the islands appear to be more resilient, despite known problems in providing transportation, social, and welfare infrastructure (Figure 3c). When calculating the population trends for the most recent thirty-year period (1991–2021), it is clear that the mountainous mainland and northern rural areas are the most at risk of depopulation (Figure 3d), as they appear to be far from major urban centres and lack access to sufficient employment opportunities. Since rural areas in Greece are highly dependent on seasonal economic activities such as agriculture and tourism, there are recurrent periods of unemployment (or underemployment) during the off-season, leading to economic instability. As younger people and those of productive age seek more stable and consistent employment opportunities, they tend to move to urban centres and/or other EU countries, perpetuating the cycle of depopulation in rural areas.
Applying the Moran I index to the spatial autocorrelation of the average annual population growth of municipalities between 1991 and 2021 reveals interesting “hot spots”. Figure 4 shows several groups of clusters: the first cluster, “High-High” (which refers to municipalities with population growth close to other similar municipalities), includes the peri-urban areas of Greater Athens, the Cyclades, and the Dodecanese (in the Aegean Sea). The second cluster, “High-Low” (municipalities with population growth close to municipalities with population decline), includes medium-sized cities, mostly prefectural capitals such as Volos, Larissa, Karditsa, Trikala, Patras, and some Ionian islands. Finally, the “Low-Low” cluster (municipalities with population decline near other similar municipalities) includes mostly mountainous municipalities in Central Greece, the Peloponnese, and some municipalities in Thrace.
Another aspect of the population decline in rural areas is that this trend is certainly related to the Greek population, while the foreign population is increasing (Figure 5a,b), which was already observed in the previous decade when agriculture, construction, and tourism created a demand for low-paying jobs that was met by migrant workers from the Balkans and later from African and Asian countries [47,59]. The apparent population decline observed in many rural areas due to the out-migration of the Greek population must be carefully weighed against the evidence at the local level that several dynamic rural areas have maintained or even increased their population in terms of economic output due to economic opportunities related to profitable agricultural activities, the expansion of second home ownership, and the development of tourism. These areas are located in the coastal regions of the mainland and on the islands. In this context, the increase in the population with non-Greek nationality highlights the increasing presence of migrants throughout the country (Figure 5b), which, however, does not compensate for the decreasing presence of the Greek population (Figure 5a).
During the economic recession, there was evidence that some rural areas had managed to increase their populations by recruiting Greek nationals [58,60,61,62]. In most of these cases, however, it is difficult to generalise about the attractiveness of rural areas that have shown signs of reclaiming and/or stabilising their populations, while evidence is lacking on how their examples can be replicated by other rural areas.
Population decline has a significant impact on the population structures of rural areas, as young adults are enticed to leave their rural communities due to better employment opportunities, higher wages, and better infrastructure in urban areas. In addition, there is a tendency in Greece for people nearing or entering retirement to move to their second homes and/or home villages, where they would like to settle, because of the better quality of life. In this context, the proportion of people over 65 in rural municipalities increased significantly between 1991 and 2011 (Figure 6a,b). Mountain municipalities in mainland Greece and the Peloponnese, as well as municipalities in the northern border areas, show a very significant increase in the elderly population. The number of people over 65 years old increased by 24% during this period, while their share in the population of rural municipalities increased from 17.4% in 1991 to 25% in 2011.
Thus, many rural areas are transforming into places where the elderly population is increasing and/or constitutes the majority of the local population. This shift leads to a greater need for social and health infrastructure in rural areas, which is associated with higher costs for its provision. However, there is a spill-over effect of ageing due to the negative natural population balance that leads to an increase in the elderly population in semi-urban and urban areas, increasing pressure and competition between urban and rural areas for social and health infrastructure.
Despite the population decline in rural municipalities, and due to internal migration between urban and rural areas, the percentage of individuals with tertiary education increased between 1991 and 2011 (Figure 7a,b). The improvement in the educational level of the population in rural communities, which follows the general trend, is related to the fact that a larger number of persons with higher education remain in rural areas and that younger and/or older people who have higher educational qualifications migrate from semi-urban/urban areas. The number of individuals with university degrees increased by 63% during this period, while their share of the population of rural communities increased from 3.7% in 1991 to 6% in 2011. As noted earlier, a general population decline in an area does not preclude the possibility of in-migration, which cannot offset the trend of out-migration. More specifically, the perceived attractiveness of rural areas may be related to physical amenities (e.g., environmental resources, landscape, access to ecological services), a low population density, more relaxed lifestyles, relative distance from intensive production activities, etc. Thus, the higher standard of living and better access to social amenities that contribute to the attractiveness of urban areas are outweighed by the lower productive capacity, expected closer social ties, and environmental concerns that are more pronounced in rural areas. Perceptions of urban or rural areas are not always based on objective measurements and/or evidence-based material accounts of those areas. They may be influenced by the socioeconomic and educational backgrounds, social perceptions, and imaginations of residents or potential residents [61,63].
According to a recent quantitative study on attitudes and perceptions about the demographic problem in Greece [64], the majority of the population (men and women over 17 years old) (86%) consider that the demographic problem—related to the ageing of the population and the low fertility rate—is very important for the country. Surprisingly, there is no difference between urban and rural areas regarding the great importance of the demographic problem for Greece. However, it appears that those with primary education are somewhat more concerned than those with tertiary education and those living in regions outside of the two major urban centres. In terms of the specific problems related to where they live, those living in rural areas are more concerned because “youth are forced to leave their area due to limited prospects” (85% in rural areas vs. 54% in urban areas), “infrastructure in their area lags behind the rest of the country” (76% in rural areas vs. 45% in urban areas), and “residents in their area do not have the same opportunities to advance socially and professionally compared to the rest of the country” (69% in rural areas versus 46% in urban areas). This perception of problems in rural areas compared to urban areas shows that there is a clear urban–rural divide in Greece. Some other problems were also mentioned, such as “educational structures lag behind the rest of the country” (59% in rural areas versus 31% in urban areas) and “distance from the city is a problem for the quality of life of the region’s residents” (58% in rural areas versus 28% in urban areas). There is no significant difference in unemployment as a problem between rural and urban areas (57% vs. 55%). However, it appears that rural areas have less of a problem when it comes to feeling safe than urban areas due to high crime rates (28% vs. 43%).
The urban–rural divide is particularly pronounced in the area of agriculture, since in Greece, most rural areas are still dependent on agriculture, even though agriculture is changing due to modernisation, specialisation, and increased competition in agricultural and food production. The impact of these changes on the socioeconomic structures of rural areas is immensely important, as agriculture remains a “departure sector” for the Greek population and, at the same time, an “arrival sector” for a limited number of internal migrants, but especially international migrants, who are employed in agriculture [59] (Table 2). The overall picture of those employed in agriculture shows that their numbers declined sharply between 1991 and 2011 (Figure 8a,b). This decline in the number of people employed in agriculture follows the general trend of “deagriculturalisation” of rural areas caused, on the one hand, by the intensification of agricultural production and increasing competition among farmers, and on the other hand, by the expansion of non-agricultural sectors (e.g., construction, tourism, and other services) in rural areas [59,60].
In Greece, 604,053 persons were employed in agriculture in 2001, most of whom (87.6%) had Greek citizenship, while a significant percentage (8.3%) had Albanian citizenship. People from the Eastern Balkans (Bulgaria, Romania) and from the Indian Peninsula (India, Bangladesh, and Pakistan) formed the third and fourth ethnic groups, with 2.1% and 0.7%, respectively. In 2011, there was a significant decrease in the number of people employed in agriculture (−35.9%), as it decreased by one third (−216,632 people) compared to 2001. The decrease does not affect all ethnic groups to the same extent, but mainly people of Greek nationality, who decreased by 41.9% (−221,769). The Albanian population also lost about one fifth of its population compared to 2001 (−19.1%; −9526 people).
In contrast, the population from the Eastern Balkans and the Indian Peninsula employed in agriculture has increased during this decade. In particular, the population from the Eastern Balkans increased by 42.2% between 2001 and 2011 (from 12,420 to 17,659). For people from the Indian Peninsula, the increase was even larger, reaching 190% (from 4436 in 2001 to 12,888 in 2011). These changes, combined with the decrease in the number of people with Greek and Albanian citizenships, led to an increase in the specific weight of these people. As a result, the specific weight of persons from the Eastern Balkans more than doubled, as they now accounted for 4.6% of the country’s population employed in agriculture in 2011. Similarly, persons from the Indian subcontinent have almost quadrupled their specific weight, representing 3.3% of the total population employed in the agricultural sector.
In summary, the analysis of the statistical material of the censuses has shown that the areas most affected by the population decline are the municipalities designated as rural areas. However, rural areas are not synonymous with population decline, as the analysis of variables has shown. Rather, population decline may mask other trends related to the changing mosaic of rural society (e.g., improvements in educational attainment) and shifts in the area’s employment structure (e.g., changes in the position of agriculture).

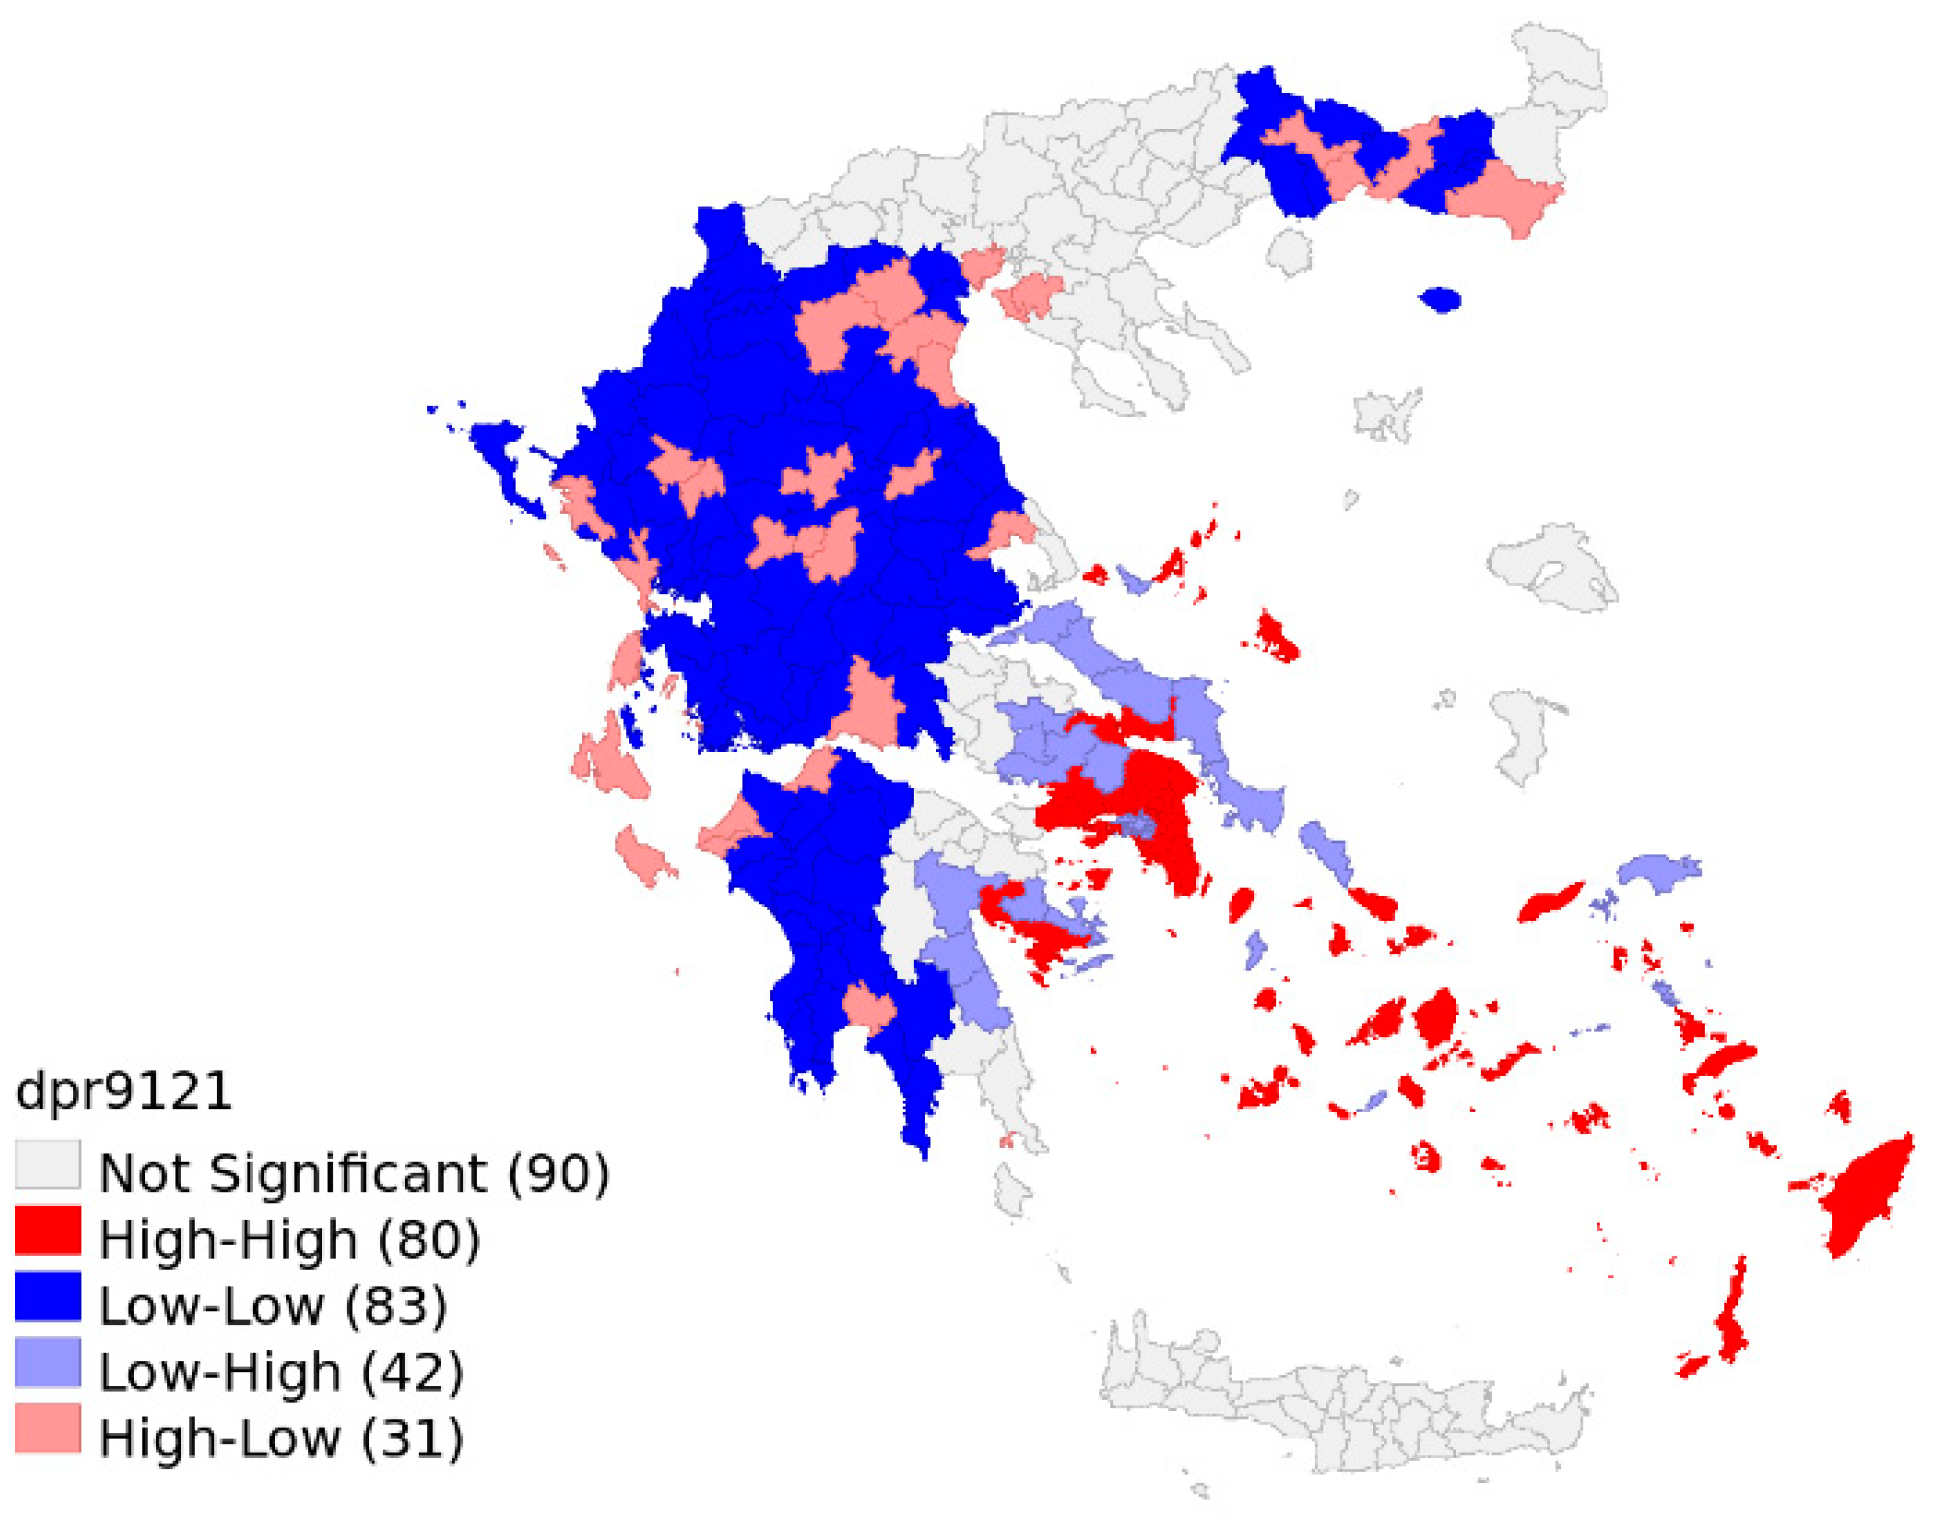
4.2. Dissecting Population Decline at the Regional Level

Examining population change at the regional level remains an important aspect of the analysis because it provides a more comprehensive view of demographic and socioeconomic trends. In addition, examining the regional level (NUTS 2) allows for a better understanding of the policy aspects of demographic and socioeconomic change, as regions are considered an integral part of multilevel governance.
Not surprisingly, population trends at the regional level shed light on how broader socioeconomic trends play out in different geographic and developmental contexts. Table A1 in Appendix A shows the natural balance of total population by region, i.e., births minus deaths, regardless of citizenship. Similarly, Table A2 in Appendix A presents the natural balance for persons with Greek citizenship, and Table A3 in Appendix A presents the natural balance for persons with foreign citizenship.
One of the most important results is that the natural balance of persons with foreign citizenship is positive throughout the period under consideration (2010–2019), regardless of the region. In contrast, the natural balance of persons with Greek citizenship is negative in all the years considered, except for the Crete and South Aegean regions (in some years). The contribution of foreigners (i.e., immigrants and refugees) to the natural balance was large enough to offset the natural population decline in most regions. In two regions, South Aegean and Crete, the contribution of foreigners was able to reverse the negative natural balance of persons of Greek nationality, thus not only preventing the natural decline but also creating a natural population surplus.
The regional dimension of the development of information and communication technologies (ICT) is important to represent the socioeconomic dynamics in the country. A set of indicators is used to show the digital divide between the Attica region (Greater Athens) and the other regions. The relevant statistical information is collected by ELSTAT, which conducts an annual survey titled “Use of Information, Communication and Electronic Commerce Technologies” for households and their members [65].
Over the years, the diffusion of information and communication technologies in households and businesses has gradually improved, but there is still a digital divide between regions, reflecting the different dynamics of economic development that accompany population change [66]. For example, household Internet access has increased from 46.4% in 2010 to 80.4% in 2020, which is an increase of 73.3%. However, in 2020, 83.6% of households in Attica, 82.4% in Northern Greece, 78.5% in the Aegean Islands and Crete, and 74.2% in Central Greece had access to the Internet. Similarly, the percentage of Internet users conducting e-commerce was 47.8% in 2020, compared to 18.4% in 2010, and the corresponding percentages are 50.2% in Attica, 50.8% in Northern Greece, 45.9% in the Aegean Islands and Crete, and 40.9% in Central Greece [65].
Despite the improvement in ICT performance, Greece is below the European average in most of the ICT indicators examined. The regional dimension seems to play an important role, as Central Greece has a significant digital divide compared to the other major geographical areas of Greece, while Attica has the best results in most of the indicators studied. Moreover, companies in the Aegean Islands and Crete are more likely to engage in e-sales than Attica, while the opposite seems to be the case for companies in Central Greece [67] (pp. 33–34). For indicators such as the use of enterprise resource management software packages (ERM software packages), the use of customer information management software packages (CRM software packages), and the use of cloud computing services, for example, there is a significant digital divide between Attica and Central Greece (between 17% and 25%), while the Aegean Islands and Crete, as well as Northern Greece, are in between [66] (p. 103). Also, in terms of the percentage of businesses with a website and the percentage of businesses using social media, the digital divide between Attica and Central Greece remains significant (the difference ranges from 10% to 13%) [50] (p, 105). For certain indicators, the Aegean Islands and Crete perform better Attica due to the development dynamics in tourism, services, and other economic sectors.
Based on recent demographic trends, there are demographic projections that illustrate future population growth and the future proportion of the elderly population (over 65) at the regional level (NUTS2) (Figure 9a,b). Both projections paint a bleak picture for the future of the country’s rural areas. Therefore, the regions of Attica and the Aegean Islands, as well as Crete, seem to have better chances of maintaining their population growth. However, population ageing seems to be increasing in all regions, with notable exceptions affecting some islands and areas on the mainland.
All in all, Greece is increasingly displaying the characteristics of an ageing population, which is putting pressure on the country’s social and healthcare systems [68]. Currently, Greece is discussing the introduction of fertility incentives and family policies to increase fertility. However, these discussions do not focus on measures to integrate migrants in order to improve the country’s demographic structure and economic activity. In addition, there are few initiatives to improve the national healthcare system and promote healthy ageing strategies that require innovative technologies and digital health. This mindset thus goes back to the need to improve infrastructures that should be adapted to the country’s future population structure.

5. Conclusions

The demographic and socioeconomic trends in Greece are apparently interrelated and exhibit different regional and local dynamics. Population decline has affected large parts of the country, although this change does not seem to be permanent everywhere. Greece exhibits all the symptoms of demographic transition, resulting in labour shortages, declining economic productivity, and increasing demands on health and welfare systems. In addition, the lack of young people hinders the sustainable development of the non-urban economy. These developments widen the urban–rural divide and increase regional inequalities. These inequalities are exacerbated by the impact of the digital divide on existing demographic and socioeconomic inequalities and trends.
Rural depopulation is a complex issue with far-reaching implications for rural communities in Greece and across the EU. However, rural communities are not, by definition, depopulating areas, as their socioeconomic characteristics play critical roles in maintaining their population sizes and/or increasing their populations. Many insular, coastal, and peri-urban rural areas are regaining attractiveness because their abilities to increase employment opportunities and improve their economic performances is symmetrical to declining agricultural activities (i.e., “deagriculturalisation”) [60], which are affected by competition and the need for modernisation, leading to the decline of those employed in agriculture. In this context, the increasing presence of migrant workers goes hand in hand not only with the modernisation process in agriculture, but also with the growing non-agricultural activities such as construction, tourism, services, etc. “Counter-urbanisation” and internal migration also play important roles in both rural depopulation and growth [69]. As mentioned earlier, rural depopulation is closely related to the study of migration (international and internal), albeit the latter does not offer a permanent solution to depopulation [70]. All in all, rural areas—and thus, “rurality”—are (re)constructed scientifically and administratively at different spatial scales, incorporating population-based and socioeconomic data.
The depopulation of some rural areas is related to specific socioeconomic processes (e.g., deagriculturalisation and ageing in rural areas) but needs to be linked to existing policy frameworks (e.g., CAP, rural development, regional policy, etc.) and the formulation of local/regional development plans to diversify local economies. In particular, CAP can provide valuable policy tools for revitalising rural areas by planning and implementing strategic actions in rural areas that are consistent with the Long-Term Rural Vision and the Rural Compact. Depopulation has spatial aspects that cannot be understood and addressed outside of the areas and regions where it unfolds.
By understanding the causes and far-reaching implications of this phenomenon, policymakers can develop effective strategies to address rural depopulation. EU funding and regional policy can play critical roles in promoting sustainable rural development and creating thriving, vibrant rural communities. By implementing evidence-based policies that prioritise economic diversification, infrastructure development, youth empowerment, and skill development, Greece can stem rural depopulation and secure a prosperous future for its rural regions. Moreover, mitigating depopulation could be well integrated into social policy, as it encompasses many aspects that affect disadvantaged/marginalised social groups.
Promoting economic diversification and new industries in rural areas can create employment opportunities and promote sustainable development. Investments in sectors such as agriculture, ecotourism, renewable energy, and small businesses can revitalise local economies. Improving transportation infrastructure and Internet access in rural areas can amplify accessibility and connectivity. Adequate access to health care, education, and other essential services is also necessary to make rural life more attractive. Community cohesion can be strengthened by involving youth in rural development projects and giving them more responsibilities. Supporting youth initiatives, vocational training, and entrepreneurship can increase the attractiveness and quality of life in rural areas. Investments in education and training relevant to the local economy can provide rural residents with the skills they need for employment in their respective communities.
One limitation of this work is that it does not include the latest data from the last census in 2021, as these data are not yet available. Future research should incorporate the census data and extend the analysis of the population growth/decline in rural areas in conjunction with digital infrastructures that are important for the revitalisation of rural areas.
All in all, the Greek government is trying to combat depopulation by taking measures to increase the birth rate. However, such measures seem to have only a limited impact on depopulation. Our analysis has shown that the revitalisation of rural areas can be achieved through socioeconomic improvements, infrastructure investments and policies that directly impact rural communities. The latter measures must also be long-term. As depopulation is a socio-spatial phenomenon, it needs to be reconsidered and understood through a nuanced approach, while policy planning should focus on socio-spatial justice and balanced development.

Author Contributions

Conceptualisation, A.G.P.; formal analysis, P.B. and A.G.P.; methodology, P.B.; writing—original draft, A.G.P. and P.B. All authors have read and agreed to the published version of the manuscript.

Funding

This research received no external funding.

Data Availability Statement

The authors used statistical data provided by the website of the Hellenic Statistical Authority (ELSTAT) and Eurostat.

Conflicts of Interest

The authors declare no conflicts of interest.

Appendix A

Table A1. Total population by region and physical balance (absolute numbers) in the 2010–2019 period (Source: Eurostat).
Region2010201120122013201420152016201720182019
E. Macedonia and Thrace−645−968−1797−1938−2163−2467−2357−3064−3003−3396
Central Macedonia145876−2745−2926−4416−5474−5174−7096−7122−8319
Western Macedonia−442−767−978−1045−1005−1287−1221−1400−1429−1708
Epirus−454−1272−2159−2103−1193−1580−1437−1739−1755−1936
Thessaly−300−793−1176−1199−2516−2698−2955−3410−3197−3895
Central Greece−138−311−673−507−2186−2629−2342−2887−2815−3529
Ionian Islands−422−865−1809−1703−606−907−758−953−793−942
Western Greece−720−1817−2241−1818−1839−2336−2109−2628−2563−3009
Peloponnese−1354−2030−2582−2420−2510−3228−2674−3395−3202−3618
Attica63053092−651−2166−2901−5949−4939−8374−7536−9925
North Aegean−405−502−746−664−702−839−643−691−481−491
South Aegean1101545669536479331606466573451
Crete212012541042759567209657−143256−153
Table A2. Greek population by region and natural balance (absolute numbers) in the 2010–2019 period (Source: Eurostat).
Region2010201120122013201420152016201720182019
E. Macedonia and Thrace−1136−1362−2069−2230−2471−2785−2652−3327−3265−3640
Central Macedonia−1253−2347−4721−4629−5928−6936−7003−8681−8785−9898
Western Macedonia−741−1016−1201−1219−1162−1443−1366−1546−1556−1873
Epirus−1624−2280−2946−2746−1416−1809−1672−1964−1988−2168
Thessaly−695−1162−1512−1427−3010−3197−3387−3824−3669−4306
Central Greece−688−796−1062−817−2704−3175−2810−3396−3310−3998
Ionian Islands−1315−1644−2225−2151−913−1231−1039−1248−1070−1216
Western Greece−1865−2771−3001−2488−2276−2729−2551−2991−2885−3326
Peloponnese−2669−3204−3560−3184−3204−3889−3309−4037−3725−4122
Attica−1434−3398−5815−6516−6903−9658−8861−12,379−11,330−13,353
North Aegean−745−788−1002−847−866−1032−917−999−1018−1064
South Aegean254−20719−5−41−189−33−143−46−250
Crete72913830−27−175−563−111−798−413−800
Table A3. Foreign population by region and natural balance (absolute numbers) in the 2010–2019 period (Source: Eurostat).
Region2010201120122013201420152016201720182019
E. Macedonia and Thrace491394272292308318295263262244
Central Macedonia2711242319761703151214621829158516631579
Western Macedonia299249223174157156145146127165
Epirus11701008787643223229235225233232
Thessaly395369336228494499432414472411
Central Greece550485389310518546468509495469
Ionian Islands893779416448307324281295277274
Western Greece1145954760670437393442363322317
Peloponnese13151174978764694661635642523504
Attica7739649051644350400237093922400537943428
North Aegean340286256183164193274308537573
South Aegean847752650541520520639609619701
Crete139111161012786742772768655669647

References

  1. Johnson, K.M.; Lichter, D.T. Rural Depopulation: Growth and Decline Processes over the Past Century. Rural Sociol. 2019, 84, 3–27. [Google Scholar] [CrossRef]
  2. Slack, T.; Jensen, L. The Changing Demography of Rural and Small-Town America. Popul. Res. Policy Rev. 2020, 39, 775–783. [Google Scholar] [CrossRef]
  3. Coleman, D.; Rowthorn, R. Who’s Afraid of Population Decline? A Critical Examination of its Consequences. Popul. Dev. Rev. 2011, 37, 217–248. [Google Scholar] [CrossRef] [PubMed]
  4. Lee, R.D.; Reher, D.S. Introduction: The Landscape of Demographic Transition and Its Aftermath. Popul. Dev. Rev. 2011, 37, 1–7. [Google Scholar] [CrossRef]
  5. Reher, D.S. Economic and Social Implications of the Demographic Transition. Popul. Dev. Rev. 2011, 37, 11–33. [Google Scholar] [CrossRef]
  6. Dyson, T. The Role of the Demographic Transition in the Process of Urbanization. Popul. Dev. Rev. 2011, 37, 34–54. [Google Scholar] [CrossRef] [PubMed]
  7. Vanhuysse, P.; Goerres, A. Political Demography as an Analytical Window on Our World. In Global Political Demography; Goerres, A., Vanhuysse, P., Eds.; Palgrave Macmillan: Cham, Switzerland, 2021; pp. 1–27. [Google Scholar]
  8. Saville, J. Rural Depopulation England and Wales, 1851–1951; Routledge and Kegan Paul: London, UK, 1957. [Google Scholar]
  9. Uribe-Sierra, S.E.; Mansilla-Quiñones, P.; Mora-Rojas, A.I. Latent rural depopulation in Latin American open-pit mining scenarios. Land 2022, 11, 1342. [Google Scholar] [CrossRef]
  10. Zang, Y.; Liu, Y.; Yang, Y.; Woods, M.; Fois, F. Rural Decline or Restructuring? Implications for Sustainability Transitions in Rural China. Land Use Policy 2020, 94, 104531. [Google Scholar] [CrossRef]
  11. Balbo, N.; Billari, F.C.; Mills, M. Fertility in Advanced Societies: A Review of Research. Eur. J. Popul. 2013, 29, 1–38. [Google Scholar] [CrossRef]
  12. Nickayin, S.S.; Nosova, B.; Turco, R.; Giacalone, M.; Salvati, L. Demographic Change and the Urban–Rural Divide: Understanding the Role of Density and Agglomeration in Fertility Transitions. Land 2022, 11, 1988. [Google Scholar] [CrossRef]
  13. Vinci, S.; Vardopoulos, I.; Salvati, L. A tale of a shrinking City? Exploring the complex interplay of socio-demographic dynamics in the recent development of Attica, Greece. Cities 2023, 132, 104089. [Google Scholar] [CrossRef]
  14. Rees, P.; Kupiszewski, M. Internal Migration and Regional Population Dynamics in Europe: A Synthesis; Council of Europe Publishing: Strasbourg, France, 1999. [Google Scholar]
  15. ESPON. Fighting Rural Depopulation in Southern Europe; ESPON: Luxemburg, 2018; Available online: https://www.espon.eu/soria (accessed on 21 August 2023).
  16. Vaishar, A.; Stastna, M.; Zapletalova, J.; Novakova, E. Is the European countryside depopulating? Case study Moravia. J. Rural Stud. 2020, 80, 567–577. [Google Scholar] [CrossRef]
  17. Rees, P.; Carrilho, M.-J.; Peixoto, J.; Durham, H.; Kupiszewski, M. Internal Migration and Regional Population Dynamics in Europe: Portugal Case Study; Working Paper 98/13; School of Geography, University of Leeds: Leeds, UK, 1998. [Google Scholar]
  18. Mladenov, C.; Ilieva, M. The depopulation of the Bulgarian villages. Bull. Geography. Socio–Econ. Ser. 2012, 17, 99–107. [Google Scholar] [CrossRef]
  19. Kupiszewski, M.; Berinde, D.; Teodorescu, V.; Durham, H.; Rees, P. Internal Migration and Regional Population Dynamics in Europe: Romanian Case Study; Working Paper 97/08; School of Geography, University of Leeds: Leeds, UK, 1997. [Google Scholar]
  20. Bayona-i-Carrasco, J.; Gil-Alonso, F. Is Foreign Immigration the Solution to Rural Depopulation? The Case of Catalonia (1996–2009). Sociol. Rural. 2013, 53, 26–51. [Google Scholar] [CrossRef]
  21. Rizzo, A. Declining, transition and slow rural territories in southern Italy: Characterizing the intra-rural divides. Eur. Plan. Stud. 2016, 24, 231–253. [Google Scholar] [CrossRef]
  22. ESPON. ESCAPE European Shrinking Rural Areas: Challenges, Actions and Perspectives for Territorial Governance; Synthesis Report; ESPON: Luxemburg, 2020; Available online: https://www.espon.eu/escape (accessed on 21 August 2023).
  23. Lotente, T.A.; Oliveira, J.L.; Cardoso, A.B. The Social Problem of Rural Depopulation in Spain and Portugal. In Social Problems in Southern Europe; Entrena-Durán, F., Soriano-Miras, R.M., Duque-Calvache, R., Eds.; Edward Elgar Publishing Limited: Cheltenham, UK, 2020; pp. 153–166. [Google Scholar]
  24. Pinilla, V.; Sáez, L.A. What do Public Policies teach us about rural depopulation: The Case Study of Spain. Eur. Countrys. 2021, 13, 330–351. [Google Scholar] [CrossRef]
  25. Valenzuela, V.G.; Holl, A. Growth and decline in rural Spain: An exploratory analysis. Eur. Plan. Stud. 2023. [Google Scholar] [CrossRef]
  26. Quaranta, G.; Salvia, R.; Salvati, L.; Paola, V.D.; Coluzzi, R.; Imbrenda, V.; Simoniello, T. Long-term impacts of grazing management on land degradation in a rural community of Southern Italy: Depopulation matters. Land Degrad. Dev. 2020, 31, 2379–2394. [Google Scholar] [CrossRef]
  27. Martínez-Abraín, A.; Jiménez, J.; Jiménez, I.; Ferrer, X.; Llaneza, L.; Ferrer, M.; Palomero, G.; Ballesteros, F.; Galán, P.; Oro, D. Ecological consequences of human depopulation of rural areas on wildlife: A unifying perspective. Biol. Conserv. 2020, 252, 108860. [Google Scholar] [CrossRef]
  28. European Commission. A Long-Term Vision for the EU’s Rural Areas—Towards Stronger, Connected, Resilient and Prosperous Rural Areas by 2040; 345 final; COM: Brussels, Belgium, 2021.
  29. Dijkstra, L.; Poelman, H.; Rodríguez-Pose, A. The geography of EU discontent. Reg. Stud. 2020, 54, 737–753. [Google Scholar] [CrossRef]
  30. Pike, A.; Béal, V.; Cauchi-Duval, N.; Franklin, R.; Kinossian, N.; Lang, T.; Leibert, T.; MacKinnon, D.; Rousseau, M.; Royer, J.; et al. ‘Left behind places’: A geographical etymology. Reg. Stud. 2023. [Google Scholar] [CrossRef]
  31. Rodríguez-Pose, A. The revenge of the places that don’t matter (and what to do about it). Camb. J. Reg. Econ. Soc. 2017, 11, 189–209. [Google Scholar] [CrossRef]
  32. Davoudi, S. Imaginaries of a ‘Europe of the Regions’. Trans. Assoc. Eur. Sch. Plan. 2019, 3, 85–92. [Google Scholar] [CrossRef]
  33. McKay, L.; Jennings, W.; Stoker, G. Political Trust in the ‘Places That Don’t Matter’. Front. Political Sci. 2021, 3, 642236. [Google Scholar] [CrossRef]
  34. Scipioni, M.; Tintori, G. A Rural-Urban Divide in Europe? An Analysis of Political Attitudes and Behaviour; Publications Office of the European Union: Luxembourg, 2021. [Google Scholar]
  35. Artelaris, P. Geographies of Crisis in Greece: A Social Well-Being Approach. Geoforum 2017, 84, 59–69. [Google Scholar] [CrossRef]
  36. Papadopoulos, A.G. Rural Planning and the Financial Crisis. In Routledge Companion to Rural Planning; Scott, M., Gallent, N., Gkartzios, M., Eds.; Routledge: Abingdon, UK, 2019; pp. 183–191. [Google Scholar]
  37. Symeonidou-Alatopoulou, H. An account on factors affecting fertility in Greece (1930–1975). Greek Rev. Soc. Res. 1979, 35, 90–110. [Google Scholar] [CrossRef]
  38. Emke-Poulopoulou, I. The Demographic Situation in Greece; Athens, Greece, 1986. (In Greek) [Google Scholar]
  39. Kioulafas, K.; Zaragkas, L. European Unification and Labour Market; IOBE: Athens, Greece, 1990. (In Greek) [Google Scholar]
  40. ELSTAT. Statistical Yearbook of Greece 1994–1995; ELSTAT: Athens, Greece, 1996. [Google Scholar]
  41. ELSTAT. Statistical Yearbook of Greece 1996; ELSTAT: Athens, Greece, 1997. [Google Scholar]
  42. Patiniotis, N. Return migration and socioeconomic reintegration. Greek Rev. Soc. Res. 1985, 56, 87–104. (In Greek) [Google Scholar] [CrossRef]
  43. Mavreas, K. Dimensions of social exclusion. Pontian and Northern-Epirus refugees in Greece. Greek Rev. Soc. Res. 1988, 96, 185–218. (In Greek) [Google Scholar] [CrossRef]
  44. Voutira, E. Ethnic Greeks from the Former Soviet Union as “Privileged Return Migrants”. Espace Popul. Soc. 2004, 4, 533–544. [Google Scholar] [CrossRef]
  45. Lianos, T.P.; Sarris, A.H.; Katseli, L.T. Illegal Immigration and Local Labour Markets: The Case of Northern Greece. Int. Migr. 1996, 34, 449–484. [Google Scholar] [CrossRef]
  46. Fakiolas, R. Socio-Economic Effects of Immigration in Greece. J. Eur. Soc. Policy 1999, 9, 211–229. [Google Scholar] [CrossRef]
  47. Kasimis, C.; Papadopoulos, A.G. The Multifunctional Role of Migrants in Greek Countryside: Implications for Rural Economy and Society. J. Ethn. Migr. Stud. 2005, 31, 99–127. [Google Scholar] [CrossRef]
  48. ELSTAT. Results of the Population Census of 5th April 1981; ELSTAT: Athens, Greece, 1981; Volume II. [Google Scholar]
  49. Cavounidis, J. Migration in Southern Europe and the Case of Greece. Int. Migr. 2002, 40, 45–70. [Google Scholar] [CrossRef]
  50. ELSTAT. Population Census 2011; ELSTAT: Athens, Greece, 2011. [Google Scholar]
  51. Papadopoulos, A.G. Migration and Security Threats in Southeastern Europe. J. Southeast Eur. Black Sea Stud. 2011, 11, 451–469. [Google Scholar] [CrossRef]
  52. Kotzamanis, B.; Baltas, P.; Kostaki, A. The Trend of Period Fertility in Greece and its Changes During the Current Economic Recession. Popul. Rev. 2017, 56, 30–48. [Google Scholar] [CrossRef]
  53. ELSTAT. Estimated Population (1.1.2021) and Immigration Flows (2020); Press Release; ELSTAT: Athens, Greece, 2021. (In Greek) [Google Scholar]
  54. Papadopoulos, A.G.; Fratsea, L.-M.; Baltas, P. Unravelling the complexities of the migration and refugee question in Greece. In Global Atlas on Refugee and Asylum; Vila-Freyer, A., Sirkeci, I., Eds.; Transnational Press London: London, UK, 2023; pp. 197–213. [Google Scholar]
  55. Anselin, L. Local Indicators of Spatial Association—LISA. Geogr. Anal. 1995, 27, 93–115. [Google Scholar] [CrossRef]
  56. GeoDa. Available online: https://spatial.uchicago.edu/geoda (accessed on 18 December 2023).
  57. Cartography Package. Available online: https://cran.r-project.org/web/packages/cartography/index.html (accessed on 18 December 2023).
  58. Papadopoulos, A.G.; Fratsea, L.-M.; Karanikolas, P.; Zografakis, S. Reassembling the Rural: Socio-Economic Dynamics, Inequalities and Resilience in Crisis-Stricken Rural Greece. Sociol. Rural. 2019, 59, 474–493. [Google Scholar] [CrossRef]
  59. Papadopoulos, A.G.; Fratsea, L.-M.; Spyrellis, S.N.; Baltas, P. Exploring the contribution of migrant labour in Greek agriculture. Ital. Rev. Agric. Econ. 2021, 76, 33–48. [Google Scholar]
  60. Kasimis, C.; Papadopoulos, A.G. Rural Transformations and Family Farming in Contemporary Greece. In Agriculture in Mediterranean Europe: Between Old and New Paradigms; Moragues Faus, A., Ortiz-Miranda, D., Arnalte Alegre, E., Eds.; Emerald Publications: Bingley, UK, 2013; pp. 263–293. [Google Scholar]
  61. Anthopoulou, T.; Kaberis, N.; Petrou, M. Aspects and experiences of crisis in rural Greece. Narratives of rural resilience. J. Rural Stud. 2017, 52, 1–11. [Google Scholar] [CrossRef]
  62. Benessaiah, K.; Eakin, H. Crisis, transformation, and agency: Why are people going back-to-the-land in Greece? Sustain. Sci. 2021, 16, 1841–1858. [Google Scholar] [CrossRef]
  63. Papadopoulos, A.G.; Ouils, A. Return to the countryside and permanent rural residents: Study of the perceptions of the rural in a coastal region of Corinthia. In The Geography of Coastal and Island Areas; Karymbalis, T., Papadopoulos, A.G., Chalkias, C., Eds.; Stamoulis: Athens, Greece, 2014; pp. 107–146. (In Greek) [Google Scholar]
  64. Kappa Research. The Demographic Problem in Greece: Attitudes and Perceptions; Heinrich Boell Stiftung: Thessaloniki, Greece, 2022. (In Greek) [Google Scholar]
  65. ELSTAT. Survey of Using ICT by Households and Individuals. Ecommerce; Press Release; ELSTAT: Athens, Greece, 2020. (In Greek) [Google Scholar]
  66. Kontolaimou, A.; Skintzi, G. Developments in the adoption of ICR and practices of electronic commerce by Greek enterprises: The regional dimension. KEPE Econ. Dev. 2020, 41, 98–109. (In Greek) [Google Scholar]
  67. Kontolaimou, A.; Korra, E.; Skintzi, G. Information and Communication Technologies (ICT) and Electronic Commerce in Greece; KEPE: Athens, Greece, 2021. (In Greek) [Google Scholar]
  68. Lamnisos, D.; Giannakou, K.; Jakovljevic, M. Demographic forecasting of population aging in Greece and Cyprus: One big challenge for the Mediterranean health and social system long-term sustainability. Health Res. Policy Syst. 2021, 19, 21. [Google Scholar] [CrossRef] [PubMed]
  69. Weekly, I. Rural Depopulation and Counterurbanisation: A Paradox. Area 1988, 20, 127–134. [Google Scholar]
  70. Bijak, J.; Kupiszewska, D.; Kupiszewski, M.; Saczuk, K.; Kicinger, A. Population and labour force projections for 27 European countries, 2002–2052: Impact of international migration on population ageing. Eur. J. Popul. 2007, 23, 1–31. [Google Scholar] [CrossRef]
Figure 1. Births, deaths, and natural balance in the 1951–2021 period (Source: ELSTAT, Eurostat).
Geographies 04 00001 g001
Figure 2. Specifying rural areas: (a) population and (b) rural municipalities.
Geographies 04 00001 g002
Figure 3. Average annual population growth rate for each decade and for the whole period: (a) average annual population growth in the 1991–2001 period, (b) average annual population growth in the 2001–2011 period, (c) average annual population growth in the 2011–2021 period, (d) average annual population growth rate per decade and for the period of 1991–2021.
Geographies 04 00001 g003
Figure 4. Local Moran’s I Lisa cluster map for the 1991–2021 period.
Geographies 04 00001 g004
Figure 5. Average annual population growth rate for (a) those with Greek citizenship and (b) those with other citizenship.
Geographies 04 00001 g005
Figure 6. Proportion of persons over 65 years of age in (a) 1991 and (b) 2011.
Geographies 04 00001 g006
Figure 7. Proportion of persons holding university degrees in (a) 1991 and (b) 2011.
Geographies 04 00001 g007
Figure 8. Proportion of persons employed the agricultural sector in (a) 1991 and (b) 2011.
Geographies 04 00001 g008
Figure 9. Future population projections: (a) Greece’s annual population growth in the 2019–2050 period and (b) Greece’s projected proportion of people aged 65+ in 2050.
Geographies 04 00001 g009
Table 2. Persons employed in the agricultural sector by citizenship in 2001 and 2011 (Source: ELSTA).
CitizenshipEmployed
Population
2001
Employed
Population
2011
%
2001
%
2011
% Change 2011/2001% Share of Change
All604,053387,421100.00100.00−41.9−9.4
Greek529,029307,26087.679.3−19.126.2
Albanian49,99240,4668.310.442.2121.7
Eastern Balkans12,42017,6592.14.6190.5353.0
Indian Peninsula443612,8880.73.311.974.5
Other817691481.42.4--
All604,053387,421100.00100.00−41.9−9.4
Disclaimer/Publisher’s Note: The statements, opinions and data contained in all publications are solely those of the individual author(s) and contributor(s) and not of MDPI and/or the editor(s). MDPI and/or the editor(s) disclaim responsibility for any injury to people or property resulting from any ideas, methods, instructions or products referred to in the content.

