Abstract
The inefficiency of transporting goods contributes to reduced economic growth and environmental sustainability in a country. Autonomous trucks (ATs) are emerging as a solution, but the imbalance in the weight moved and ton-miles produced by long-haul and short-haul trucking creates a challenge in targeting initial deployments. This study offers a unique solution by presenting a robust method that combines data mining and geographic information systems (GISs) to identify the optimal routes for ATs based on a top-down approach to maximize business benefits. Demonstrated in a U.S. case study, this method revealed that despite accounting for only 16% of the weight moved, long-haul trucking produced 56% of the ton-miles, implying a high potential for ATs in this segment. The method identified eight key freight zones in five U.S. states that accounted for 27% of the long-haul weight and suggested optimal routes for initial AT deployment. Interstate 45 emerged as a pivotal route in the shortest paths among these freight zones. This suggests that stakeholders should seek to prioritize funding for infrastructure upgrades and maintenance along that route and the other routes identified. The findings will potentially benefit a broad range of stakeholders. Companies can strategically focus resources to achieve maximum market share, regulators can streamline policymaking to facilitate AT adoption while ensuring public safety, and transportation agencies can better plan infrastructure upgrades and maintenance. Users globally can apply the methodological framework as a reliable tool for decision-making about where to initially deploy ATs.
1. Introduction
Trucks transport more than 72% of the tonnage carried by all domestic modes in the United States [1]. Researchers observed a similar dominance of trucks in freight movements in other parts of the world such as Australia, Europe, and Japan [2]. Analysts expect increasing demand for trucking due to growth in population, urbanization, and e-commerce [3]. The expected benefits of self-driving or autonomous truck (AT) deployments have spurred large investments to advance their progress [4], including billions of dollars invested in the development of self-driving technologies [5]. Currently, more than a dozen companies globally have shifted towards developing ATs [6]. As a result, advancements in sensing, communications, and computing have significantly improved AT technology [7].
The intermediary transfer hub model, aimed at reducing risks by circumventing complex urban areas, has gained popularity [8]. The transfer hub model moves freight along highways that connect AT depots located outside of urban areas. These hubs either assume control of the ATs or transfer the trailers to human-driven trucks for the urban facility connection. The compelling aspect of the transfer hub model lies in its ability to reduce risks in long-haul (LH) operations while transferring drivers to fill the capacity needs of short-haul (SH) markets. Another benefit is that SH drivers will be able to return home each day, improving work–life balance, enhancing driver retention, and potentially reducing medical and health costs [9]. A truck driver plays a significant role in customer service and is often the face of a company. Therefore, using SH drivers for last-mile connections will help maintain their role in enhancing business relationships.
Primary benefits expected from AT adoption include cost reduction through driver replacement [2] and freight capacity enhancement, achieved by ATs operating around the clock and covering longer distances without breaks [10]. ATs can also increase operational efficiencies and reduce fuel consumption resulting from more consistent movements and less idle time [11]. Furthermore, adding truck-platooning technology could further significantly enhance fuel efficiency [12]. Operators can schedule LH operations outside of peak traffic hours to help reduce congestion and related costs while focusing on other operations like freight transfer during peak traffic hours. The American Transportation Research Institute (ATRI) estimated that 87% of truck accidents were due to human error [13]. Bracy et al. (2019) found that AV technologies can prevent between 117 and 193 crashes involving large trucks in Missouri alone [14]. Therefore, ATs can reduce insurance premiums and liability expenses if the vehicles can eliminate accidents due to human error. ATs will reduce the risks of unsafe parking [15], such as on highway shoulders when truck-stop parking is unavailable [16]. ATs will also address the chronic driver shortage issue, particularly for LH segments that require drivers to stay away from home for multiple days [17].
Despite these anticipated benefits, uncertainties about optimal AT deployment locations have impeded the progress of supporting regulations and infrastructure planning [18]. The lack of clarity among roadway agencies about which roads through their jurisdiction ATs will affect, in terms of traffic and load stress [19], has added to this uncertainty. Manufacturers have been conducting early tests and pilots mostly in southern U.S. regions with favorable regulation, weather, and road conditions [20]. However, a top-down approach that starts with strong economic incentives to deploy along specific routes will guide decision-making to target those locations for investments in infrastructure, policy making, and technology robustness for all-weather driving.
Therefore, the goal of this research is to address two primary questions: (1) which geographical freight zones should planners target AT deployments to access the greatest initial opportunities for freight tonnage and ton-miles, and (2) which Interstate highways will be the most impacted in terms of traffic and pavement loading. The contribution of this paper is a method of integrating comprehensive freight movement data with spatial analysis using geographic information system (GIS) algorithms to offer a holistic view of optimal deployment areas. This study additionally contributes an understanding of how ATs will impact long-haul operations and implications for prioritizing highway maintenance. This research demonstrates the workflow by using the United States Freight Analysis Framework (FAF) dataset as a case study.
The organization of the rest of this paper is as follows: Section 2 presents a literature review that focuses on motivations to deploy ATs, anticipated deployment periods, potential barriers to adoption, research related to route identification, and gaps relating to the research questions posed earlier. Section 3 describes the datasets used and details of the combined data mining and GIS workflow. Section 4 presents the results of the U.S. case study using the workflow. Section 5 interprets the results, discusses implications, and highlights limitations of the work. Section 6 concludes this study and hints at future work.
2. Literature Review
Dong et al. (2021) conducted a systematic literature review and found that autonomous vehicles were prominent among nine technologies (3D printing, artificial intelligence, automated robots, autonomous vehicles, big data analytics, blockchain, drones, electric vehicles, Internet of Things) that will disrupt future freight transportation [21]. ATs can potentially increase productivity, GDP, capital, and employment, as identified by [22]. When ATs can operate in all weather conditions, they can replace up to 94% of LH operator-hours [8]. Huang and Kockelman (2020), assuming a 25% reduction in ton-mile cost, predicted that ATs will increase ton-mile production by 11%, while rail flows will decrease 4.8% [23]. The reduced travel time of ATs can significantly cut costs in the perishable and semi-perishable food supply chain, particularly in LH operations [24].
The potential business benefits of ATs have attracted significant investments, with investors pouring more than one billion USD into several startup companies (Aurora, Ike, Kodiak Robotics, Otto, Outrider, Oxbotica, Plus.ai, TuSimple, Waabi) to develop the technology [20]. Both traditional truck manufacturers such as Daimler and Volvo and non-traditional manufacturers like Google/Waymo and Tesla have begun developing ATs [25]. A survey found that the industry expects ATs to be in commercial service by 2027 [7]. ATs will also change traditional business models. Fritschy and Spinler (2019) determined that, by 2040, business models that offer holistic systems for automated driving will become commonplace [26]. Similarly, Monios and Bergqvist (2020) suggested that ATs will prompt a shift toward a network operator model [25].
Despite hefty investments and optimistic deployment timelines, the adoption of ATs faces numerous barriers. A survey of 76 practitioners in the logistics industry revealed that the lack of standardization will present a near-term barrier to AT adoption [27]. Regulations vary widely as U.S. states pivot between encouraging innovation and ensuring public safety [28]. The number of states enacting bills and considering autonomous vehicle regulation is increasing. In 2012, six states introduced legislation for autonomous vehicles, nine states in 2013, twelve states in 2014, and sixteen states in 2015 [29]. Alawadhi et al. (2020) posit that autonomous vehicles will shift liability away from humans, but there is no general rule for where the responsibility will land [30]. Adoption also hinges on acceptance [31]. For instance, a study by Mishler and Chen (2023) gauged the reaction of 122 participants to a takeover request during a critical hazard event in a driving simulation [32]. The study found that trust in the system declined with each takeover request. Simpson et al. (2019) developed Bass models to estimate the adoption rate of ATs and found that market penetration could range between 20% and 95% within 25 years, depending on the rate of technology improvement, acceptance, price, and marketing [33].
Questions of how the convergence of electric and autonomous trucks will impact the transport geography of intermodal freight movements have emerged [34]. To aid AT companies in selecting locations for initial testing and deployment, two consulting companies developed bottom-up scenario planning tools. Boston Consulting Group developed a model to determine the “most promising” routes for AT deployments by using criteria such as distance, the maturity of autonomous vehicle legislation, truck stops, congestion index, and freight volume [10]. Deloitte developed a similar model that considered existing AT investments with constraints such as snow, traffic congestion, roadway quality, current regulation, and state-level business friendliness [20].
Table 1 summarizes the various research methods in the AT deployment studies cited above. Overall, the literature has discussed AT development relative to its potential benefits, technical progress, impacts on society, and challenges to adoption. Significant uncertainties about AT deployments remain [35]. However, as ATs mature, no top-down planning has occurred for deployments based on potential economic opportunities. This research aims to fill that gap by developing a top-down approach to inform where to target initial opportunities and to quantify the impacts on the primary roadways that connect those regions. The impact of autonomous vehicles on transportation infrastructure has been one of the least studied areas [36]. Knowing the specific highways that ATs will impact can guide decisions about allocating dedicated lanes and revising highway geometry guidance based on automation levels [37]. The adoption level of ATs and the demand for freight movements on specific lanes will determine the level of lane exclusivity and the number of lanes [38].

Table 1.
Summary of Research Methods Used to Study AT Deployments.
3. Methods
The next two subsections describe the five datasets used and details of the data mining and GIS framework.
3.1. Datasets
This study utilized data from several sources, as summarized in Table 2.
Table 2.
Datasets used in the analysis.
The U.S. Bureau of Transportation Statistics (BTS) and U.S. Federal Highway Administration (FHWA) produced the FAF dataset by integrating data from a variety of sources to create a comprehensive representation of U.S. freight movements by all transportation modes. Version 5.5 of the FAF dataset includes 2.4 million records of origin–destination (OD) freight movement estimates. Each record provides an origin zone, a destination zone, the commodity category, the weight in kilotons, the production in millions of ton-miles, the value in millions of USD in 2017 valuation, and the mode of transportation used. The origins and destinations are 132 regions, some of which are metropolitan statistical areas (MSAs) as defined by the Office of Management and Budget. Non-MSA regions are either the remainder of a state or entire states. The transport modes are truck, rail, water, air, multiple modes and mail, pipeline, other, unknown, and no domestic mode. The truck mode includes private and for-hire trucks. There were 42 commodity categories. Additional columns contained forecasted weight, ton-miles, and value for years up to 2050. To provide context, this analysis converts the units of tons and ton-miles to semi-truck load (STL) and semi-truck mile (STM) equivalents. As a reference point, a standard North American semi-truck (class 8 big rig) cannot exceed a loaded weight of 40 tons, which means that it can carry an average of 22.5 tons of freight [43].
The U.S. Primary Roads National Shapefile provides GIS network geometry data for interstates, state highways, and other major highways in the United States. The U.S. Major Cities dataset includes the geospatial centroids of cities and towns in the United States with populations of at least 10,000. The American Transportation Research Institute (ATRI) provides truck bottleneck data, ranking the top 100 chokepoints or bottleneck locations on U.S. highways based on GPS data collected from trucks annually [42].
3.2. Data Mining
Figure 1 provides an overview of the research methodology with an illustration of the combined data mining and GIS workflow. The procedures shown are either Python code or GIS algorithms that filter the flow of data in three stages. The first filter stage involves extracting truck movements from the multimodal FAF dataset and dividing the OD flows into LH and SH movements. The FAF categorizes each OD flow within one of eight distance bands: {<100, 100–249, 250–499, 500–749, 750–999, 1000–1499, 1500–2000, >2000} miles. Distances below 250 miles signify that a round trip would be, at most, 500 miles. Therefore, the total round trip drive time at an average speed of 60 mph will be 8.3 h. Considering that U.S. hours-of-service (HOS) regulations limit driving to a maximum of 11 h after 10 consecutive hours off duty [44], a round trip of 500 miles leaves 2.7 h of margin for potential delays due to congestion and other activities such as load management, refueling, and documentation. A threshold of 250 miles is also consistent with the recharge capability of a typical fast charger for electrified trucks [45]. The U.S. DOT specifies long-haul, short-haul, and regional trucking as the three market segments in trucking in their report to Congress on automation in long-haul trucking [46]. The report defined long-haul trucking as distances where the driver is usually away from home, usually considered greater than 250 miles [47]. Hence, selecting 250 miles as the threshold to separate SH and LH truck movements was a justifiable scenario while maintaining consistency with the FAF distance bands.
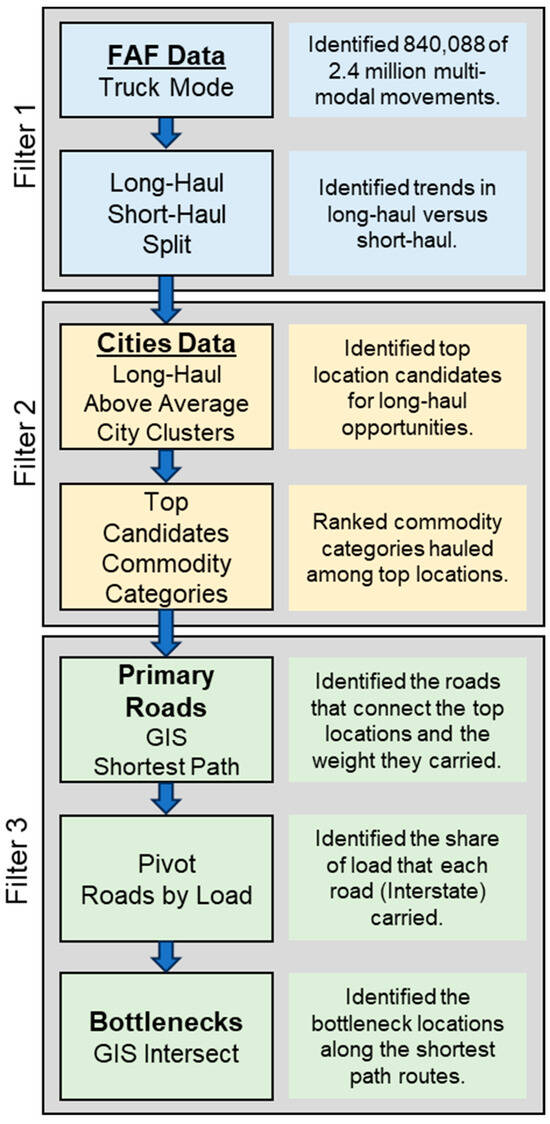
Figure 1.
Data mining and GIS workflow.
The second filter stage identified the priority zones for focusing initial deployments based on both the share of freight weight they processed and the share of ton-miles they moved. This stage pre-selected FAF zones which processed an above-average weight of LH movements among all FAF zones. The freight processed includes both inbound and outbound flow to reduce the likelihood of empty loads in any direction. The strategy to select the top FAF zones was that they should form a cluster of high weight and ton-mile values while also minimizing the number of states that carry those zones. The rational to minimize the number of states that contained these top FAF zones was that stakeholders would initially have to grapple with fewer differences in regulations and laws among jurisdictions.
The third filter stage pinpointed the shortest paths among the chosen zones and then summarized the share of the load carried by the Interstate highways along those paths. A GIS procedure distinguished the shortest paths among the selected cities. Each FAF zone is an aggregation of either a metropolitan statistical area (MSA), the remainder of a state (outside the MSA), or an entire state. The shortest path algorithm required nodes within FAF zones to identify the Interstate routes between those nodes that carry truck traffic. Therefore, the procedure used the location of the largest city in the selected FAF zones as nodes for the shortest path computation.
The GIS spatial intersection technique identified the top bottleneck locations along those shortest paths that connect the selected FAF zones [48]. According to ATRI, the average peak hour truck speed was 36.3 mph in 2023, which offers further insight into the impacts and importance as a factor in the decision-making process to target AT deployments.
4. Results
The next three subsections describe the results of the three filter stages of the data mining and GIS workflow.
4.1. Filter 1: SH and LH Split
The first filter, the truck mode filter, identified 840,088 of 2.4 million records as truck movements. Table 3 and Table 4 summarize the results of the first filter stage split for freight movement by miles band and year, respectively. Table 3 shows the weight moved in millions (M) of STL, billions (B) of STM, and the value moved in million USD per kiloton ($M/K-Ton). The columns labeled STL % and STM % show the share of weight moved and ton-miles produced, respectively. Table 3 shows the FAF forecast for STL, STM, and value moved LH and SH through 2050.
Table 3.
Summary statistic by miles band.
Table 4.
Summary statistic by year.
Figure 2 graphically represents the trends depicted in Table 3 and Table 4. Figure 2a plots the STL and STM share by miles band.
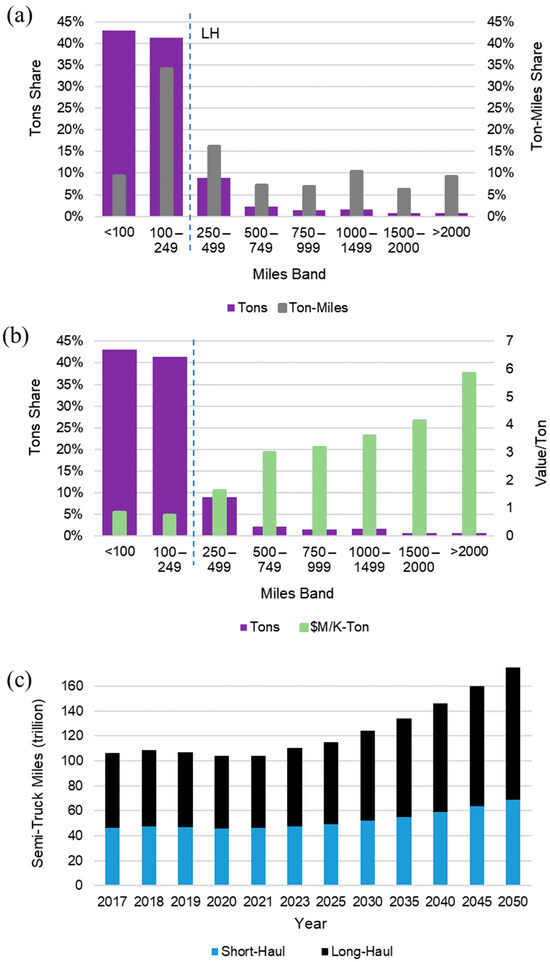
Figure 2.
Statistical analysis (a) STL and STM share by miles band, (b) value per ton, and (c) STM by forecast year.
The results indicate that LH trucking contributed to 16% of the weight moved and 56% of the ton-miles produced in 2017. Figure 2b shows that the value per ton moved across the LH distance bands demonstrated a monotonic increase. Figure 2c shows that the forecasted total STM will be 64% greater in 2050 relative to 2017. As shown in Figure 3a, the weight (or STL) moved by SH and LH trucking will increase by 47% and 72%, respectively, from 2017 to 2050. Figure 3b shows that the ton-miles (or STM) produced by SH and LH trucking will increase by 48% and 77%, respectively from 2017 to 2050. Figure 3c shows that the valued moved by SH and LH trucking will increase by 84% and 100%, respectively, from 2017 to 2050. Therefore, LH truck weight, ton-miles, and value will increase by 25%, 29%, and 16% more than those of SH, respectively, between 2017 and 2050.
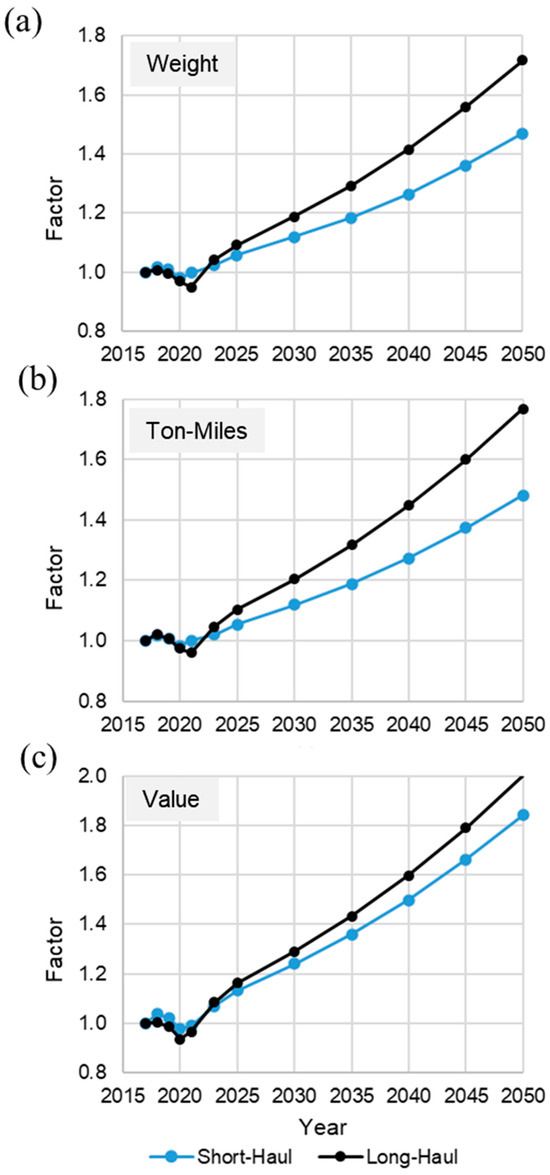
Figure 3.
SH and LH factor increase from 2017 of (a) weight, (b) ton-miles, and (c) value.
4.2. Filter 2: Top Zone Cluster
Figure 4 graphically presents the outcomes of the second filter stage.
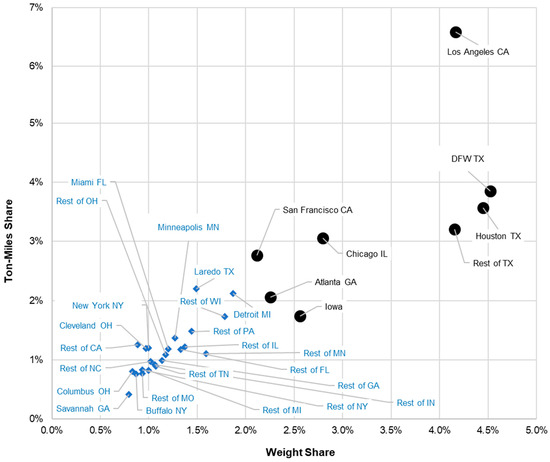
Figure 4.
FAF zones with above-average long-haul weight processed.
The scatter plot emphasizes FAF zones which processed a weight of LH movements that was above the average value transported among all FAF zones. The average value excluded movements within a FAF zone. The top cluster selected, represented by circle-shaped markers to clearly visualize the separation, comprised eight FAF zones within five states. These zones contributed 27% of the LH weight processed by all FAF zones. The top eight FAF zones were within the states of California (Los Angeles, San Francisco), Texas (Dallas Fort Worth or DFW, Houston, the rest of Texas), Illinois (Chicago), Georgia (Atlanta), and Iowa. Carriers can later expand this first stage of AT deployments by targeting routes that connect the remaining regions (diamond shaped markers) in the lower left quadrant.
Figure 5 summarizes the LH statistics for the commodity categories moved only among the top eight FAF zones. Those movements accounted for 9.6% of the LH weight processed and 7.2% of the LH STM produced by those top eight FAF zones. The chart presents a ranking trend based on the value per unit weight. The top seven commodity categories by value per unit weight account for approximately 8% of the ton-mile production. Therefore, most of the lowest value-per-unit-weight commodity categories contributed significantly to the ton-mile production. Only the categories of “electronics” and “motorized vehicles” were above average in both ton-miles and value per unit weight. Figure 6 plots the ton-mile and weight share of commodity categories. The categories of “fuel oils,” “natural gas and fossil products,” and “gasoline” were among the peak ton-mile production and weight moved by trucks. Those three categories accounted for more than 22% of the ton-miles and more than 35% of the weight but were among the lowest value per unit weight.
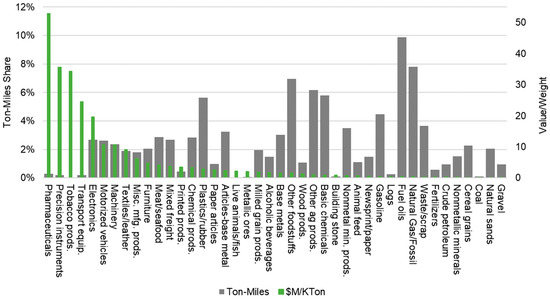
Figure 5.
Share of commodity categories long-hauled among the top eight FAF zones, and value per unit weight.
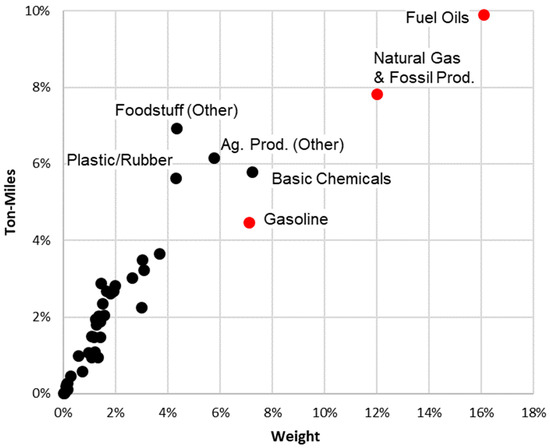
Figure 6.
Ton-mile and weight share of commodity categories.
4.3. Filter 3: Shortest Paths
Figure 7 highlights the output of the third filter stage, which is the GIS optimization algorithm to identify the shortest paths that connect the eight cities. In cases where the FAF zone did not specify a representative city, the largest city in that zone functioned as the node for the shortest path calculations. For example, the largest cities in the FAF Zones “Rest of TX” and “Iowa” were Lubbock and Des Moines, respectively. Table 5 lists the resulting 28 unique routes by their city terminal nodes, the STL in thousands, the distance in miles, and the highways utilized. It is evident that several of the highways are common among the paths to take between the eight cities. The average LH distance among the cities was 1253 miles. Table 6 summarizes the estimated weight and value share moved across each of the Interstates in 2017. Table 6 also includes a description and rank of the truck bottlenecks along those Interstate routes. For brevity and as a scenario, the table lists the top 20 bottlenecks in terms of severity. The table reveals that those bottlenecks affected 9 out of the 20 routes.
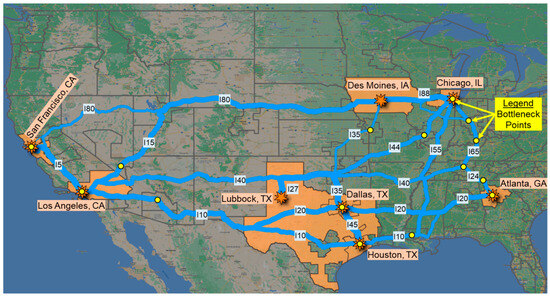
Figure 7.
Shortest paths among the largest cities of the top 8 FAF zones and bottleneck points. Map data: Google, Digital Globe (2023).
Table 5.
Statistics for routes among the top 8 FAF zones.
Table 6.
Interstate weight, value share, and bottlenecks.
The line thickness in the map (Figure 7) is proportional to the weight share that an Interstate route supported. Figure 8 visualizes the weight and value share that the Interstate highways supported. The figure presents a visualization showing that the highways I40, I45, and I27 are clear outliers in both weight and value share. From Figure 7, it becomes evident that these highways connect large port cities or freight hubs like Houston in the south, Los Angeles in the west, and Atlanta in the east. Interstate I35 provides a connection between the major highways that intersect in Dallas and those that intersect in Oklahoma, providing alternate routes that connect the eastern and western regions of the United States.
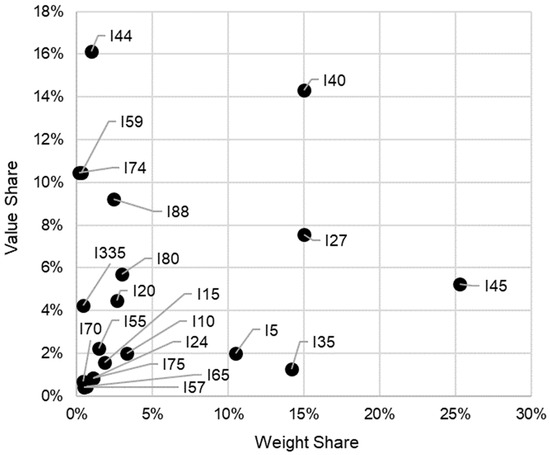
Figure 8.
Weight and value share of Interstate routes connecting the top eight FAF zones.
A key finding is that five highways (I45, I27, I40, I35, I5) supported approximately 80% of the weight moved across the 20 highways. In 2017, the equivalent of 17 million loaded semi-trucks traversed those 20 highways, with I45 carrying approximately one quarter of the weight. The bottleneck location ranked third impacted I45 located in Houston, Texas. The projected increase in weight on those highways in 2050 was 72% (Figure 3a) or the equivalent of 17 × 1.72 = 29 million loaded semi-trucks.
5. Discussion
This research addressed the problem of optimizing the deployment of autonomous trucks (ATs) by focusing on long-haul (LH) trucking data to identify the most efficient routes and regions for initial AT deployment. The problem is multidimensional, involving aspects of GIS, data mining, transportation logistics, and economic impact assessment. The gap filled with respect to prior research was the integration of comprehensive spatial data with detailed freight movement analytics, including assessing the impact of ATs on different types of trucking operations. Additionally, prior research lacked focus on how ATs will affect different commodity categories and how this will influence transportation infrastructure. The focus of this research on specific freight zones and their contribution to long-haul trucking ton-mile production is unique. Moreover, this study provided insights into the economic and infrastructural impacts of ATs on specific Interstate highways, an aspect not extensively explored in the current literature.
This study asserts that initial AT deployments should focus on LH opportunities, as LH accounted for 56% of the total ton-mile production in 2017, and the forecasted growth is 77% by 2050. This growth outstrips the forecasted growth for SH by 29%. This study identified eight regional freight zones, clustered by the highest ton-mile and weight shares, which accounted for 27% of the LH weight processed in the contiguous United States. This study also found a 25% greater increase in LH weight than in SH weight from 2017 to 2050. This suggests that LH truck movements will significantly influence future highway maintenance needs. The five states hosting these top freight zones are California, Texas, Illinois, Georgia, and Iowa. This study also revealed that movements solely between cities of these states, to ensure loaded backhaul, proved significant. They accounted for 9.6% of the LH weight processed and 7.2% of the LH STM produced in those states. AT manufacturers, who have been evaluating their vehicles primarily in less snowy states like Texas and California, will eventually operate in northern locations like Chicago and Iowa as the technology matures. This addresses the first research question, identifying where investors and AT companies may find the greatest initial opportunities to move LH freight.
This research determined that the shortest paths among the freight zones of the five states included 20 Interstate highways. The forecasted increase in weight on these highways from 2017 to 2050 will reach 72%, equivalent to 29 million loaded semi-trucks annually. Interestingly, the nation’s top 20 bottleneck locations affected nine of these routes. On average, the bottleneck locations had an average truck speed of 36.3 mph in 2022, which was 6.1% lower than the year prior [48]. The bottleneck ranking third was located on Interstate 45 in Houston, Texas, bearing more than 25% of all the weight transported across the 20 routes. At this bottleneck, traffic during peak hours reduced the average speed from 31.1 mph to a mere 21.7 mph. This finding responds to the second research question, highlighting which Interstate highways will experience the most significant impacts in terms of traffic and pavement loading.
Beyond addressing the two initial research questions, this study uncovered other intriguing findings. The 7 leading commodity categories out of 42, ranked by value per unit weight, accounted for a mere 8% of the ton-mile production. Only the categories of “electronics” and “motorized vehicles” involved above-average ton-mile production and value per unit weight. Consequently, 92% of the ton-mile production primarily involved commodity categories with a low value per unit weight. Thus, most LH opportunities will involve hauling low-value-per-unit weight commodity categories.
Interestingly, the fossil fuel-related categories, including “fuel oils”, “natural gas and fossil products”, and “gasoline”, were among the most prolific in terms of ton-mile production and weight moved by trucks. Those three categories accounted for more than 22% of the ton-mile production and more than 35% of the weight moved but were among the lowest value per unit weight. This suggests that fossil fuel production leads to significant truck traffic and road stress, two external costs not frequently addressed in the literature. However, if there is a strong shift towards renewable energy production and a lowering of demand for fossil fuels, that might reduce the number of trucks carrying fossil-fuel-related products.
Optimizing AT deployments can lead to more efficient transportation systems, reduced environmental impacts, and potential economic benefits through improved logistics and supply chain management. The methodology and findings provide a new framework for scientists to further research and contribute to the body of knowledge in transportation planning and logistics optimization. This research expands knowledge about how to integrate GIS and data mining to enhance transportation planning. This study also contributes to the theoretical framework of transportation economics by exploring the impact of ATs on long-haul and short-haul trucking, offering new insights into the spatial and economic dimensions of freight logistics. Additionally, this research provides a basis for understanding the role of commodity types in logistics optimization, which can influence future theoretical models in transportation economics and policy planning.
The existing patchwork and inconsistency of AT regulations across states present an opportunity for companies to shape these regulations. Examples of business case planning include justifying capital investments to purchase ATs, where to build truck transfer depots, and the potential to extend railroad intermodal business models by adding an AT modality. Transportation planning decisions can include considering dedicated lanes for autonomous vehicles, enhancing the reliability of communication and GPS signaling along specific routes, and implementing roadway facilities for refueling, charging, and maintenance. The involvement of major Interstate routes will require strong regulatory support from both federal and state governments that fund maintenance and enforce safety regulations on those highways.
This work is not without limitations. This top-down study focused on identifying opportunities to target AT deployments based on identifying top freight movement zones and the shortest route among them, rather than a bottom-up approach that avoided routes that traversed jurisdictions with restrictive regulations and regular adverse weather conditions. The shortest path algorithm used the largest city within each FAF zone as a node for that zone. Therefore, selecting the largest cities in some of the largest FAF zones, such as in Texas, may not necessarily capture the route with maximum traffic for AT deployment, albeit an opportunity, nevertheless.
Only a handful of large carriers dominating the industry may possess the financial resources necessary to invest in an AT fleet. Uncertainties persist about the capability of ATs to perform in all-weather conditions and the security challenges that owners may encounter. The expansion of sensor and communications technology to enable automation also amplifies vulnerabilities to cyberattacks. Cybersecurity countermeasures such as new hardware and system monitoring will add cost. The push towards electrifying trucks may initially limit LH capabilities, and manufacturers have yet to demonstrate the ability of ATs to recharge or refuel themselves without human intervention. Finally, the industry is still lacking in terms of regulations and standards to guide and scale AT operations, an issue that future studies can investigate.
Future work will assess the potential for mode shift from rail to ATs based on the shortest routes that run parallel to rail movements, as well as a mode shift from air based on price and delivery schedules. Further considerations will encompass road facility characteristics, the availability of terminal facilities near major metropolitan areas, and typical climate conditions. Future work will also explore opportunities in cold rural regions, particularly in the upper great plains of the United States, to enhance efficiencies in agricultural and energy transport.
6. Conclusions
This study introduced a combined data mining and GIS workflow that identified routes ideally suited for initial autonomous truck (AT) deployments based on the top-down approach of maximizing business benefits. Even though LH trucking only accounted for 16% of the weight moved in the contiguous United States in 2017, it produced 56% of the ton-miles. The forecasts indicated a 72% increase in LH ton-miles from 2017 to 2050, surpassing SH growth by 29%. The research identified eight freight zones in only five states, accounting for 27% of the LH weight processed in the contiguous United States in 2017. This suggests that companies should initially concentrate finite resources on employing smaller fleets of ATs to capture the largest share of the LH market, where driver shortages are more pronounced than in SH markets. Interstate I45 featured prominently in most of the shortest paths among the eight freight zones, carrying more than 25% of the weight. This outcome supports the industry’s inclination to establish initial proving grounds in Texas. The routes ranking second and third were I27 and I40, each handling 15% of the weight moved among the eight freight zones. This result suggests planners and investors should target their initial efforts on locating suitable transfer hub facilities at terminal points along the top routes, ensuring proximity to the urban delivery points for SH transfers. Likewise, transportation agencies across multiple jurisdictions could pool resources to fund infrastructure upgrades and maintenance along these top routes. Both state and federal regulators can streamline policymaking to alleviate adoption challenges while ensuring public safety along these routes. Using the hybrid data mining and GIS optimization framework, planners globally can employ local freight and traffic datasets to make informed decisions about where to deploy autonomous trucks initially. However, as mentioned in the limitations, the proposed method did not consider other factors such as weather and regulatory friendliness.
Author Contributions
Conceptualization, R.B. and R.J.; methodology, R.B. and R.J.; software, R.B. and R.J.; validation, R.B., R.J. and D.T.; formal analysis, R.B. and R.J.; investigation, R.B. and R.J.; resources, D.T.; data curation, R.B. and R.J.; writing—original draft preparation, R.B. and R.J.; writing—review and editing, R.B., R.J. and D.T.; visualization, R.B. and R.J.; supervision, R.B. and D.T.; project administration, D.T.; funding acquisition, D.T. All authors have read and agreed to the published version of the manuscript.
Funding
This research was funded by the United States Department of Transportation, Federal Motor Carrier Safety Administration, grant number FM-MHP-23-001.
Institutional Review Board Statement
Not applicable.
Informed Consent Statement
Not applicable.
Data Availability Statement
The data presented in this study are openly available as cited.
Conflicts of Interest
The authors declare no conflict of interest.
References
- ATA. ATA Truck Tonnage Index Increased 2.4% in May. 20 June 2023. Available online: https://www.trucking.org/news-insights/ata-truck-tonnage-index-increased-24-may (accessed on 16 July 2023).
- Kim, E.; Kim, Y.; Park, J. The Necessity of Introducing Autonomous Trucks in Logistics 4.0. Sustainability 2022, 14, 3978. [Google Scholar] [CrossRef]
- Bridgelall, R.; Patterson, D.A.; Tolliver, D.D. Policy Implications of Truck Platooning and Electrification. Energy Policy 2020, 139, 111313. [Google Scholar] [CrossRef]
- Nowak, G.; Viereckl, R.; Kauschke, P.; Starke, F. The Era of Digitized Trucking: Charting Your Transformation to a New Business Model. PWC. Strategy. 2019. Available online: https://www.strategyand.pwc.com/report/digitized-trucking (accessed on 15 May 2023).
- Chafkin, M. Even after $100 Billion, Self-Driving Cars Are Going Nowhere; Bloomberg: New York, NY, USA, 2022. [Google Scholar]
- Clevenger, S. Who’s Who in Self-Driving Truck Development. Transport Topics, 23 November 2022. [Google Scholar]
- Slowik, P.; Sharpe, B. Automation in the Long Haul: Challenges and Opportunities of Autonomous Heavy-Duty Trucking in the United States; The International Council on Clean Transportation: Washington, DC, USA, 2018. [Google Scholar]
- Mohan, A.; Vaishnav, P. Impact of automation on long haul trucking operator-hours in the United States. Humanit. Soc. Sci. Commun. 2022, 9, 82. [Google Scholar] [CrossRef]
- Makuto, N.; Kristman, V.; Bigelow, P.; Bédard, M. Factors associated with depressive symptoms in long-haul truck drivers. Transp. Res. Interdiscip. Perspect. 2023, 21, 100851. [Google Scholar] [CrossRef]
- Collie, B.; Decker, J.; Fishman, J.; Wegscheider, A.K.; Wiesinger, M.; Sridhara, R. Mapping the Future of Autonomous Trucking; Boston Consulting Group: Boston, MA, USA, 2022. [Google Scholar]
- Meldert, A.B. Introducing Autonomous Vehicles in Logistics; KU Leuven, Faculty of Business and Economics: Leuven, Belgium, 2016. [Google Scholar]
- Zhang, L.; Chen, F.; Ma, X.; Pan, X. Fuel economy in truck platooning: A literature overview and directions for future research. J. Adv. Transp. 2020, 2020, 2604012. [Google Scholar] [CrossRef]
- Danaf, M.; Hu, O.; Place, M.; Ifrach, B.; Hautefeuille, L. The Future of Self-Driving Technology in Trucking: A Roadmap for Evolving Freight Transportation with Autonomous Trucks; Uber Freight: San Francisco, CA, USA, 2021. [Google Scholar]
- Bracy, J.M.B.; Bao, K.Q.; Mundy, R.A. Highway infrastructure and safety implications of AV technology in the motor carrier industry. Res. Transp. Econ. 2019, 77, 100758. [Google Scholar] [CrossRef]
- Nevland, E.A.; Gingerich, K.; Park, P.Y. A data-driven systematic approach for identifying and classifying long-haul truck parking locations. Transp. Policy 2020, 96, 48–59. [Google Scholar] [CrossRef]
- Guerrero, S.E.; Pulikanti, S.; Wieghart, B.; Bryan, J.G.; Strow, T. Modeling Truck Parking Demand at Commercial and Industrial Establishments. Transp. Res. Rec. J. Transp. Res. Board 2023, 2677, 1157–1168. [Google Scholar] [CrossRef]
- Schuster, A.M.; Agrawal, S.; Britt, N.; Sperry, D.; Van Fossen, J.A.; Wang, S.; Mack, E.A.; Liberman, J.; Cotten, S.R. Will automated vehicles solve the truck driver shortages? Perspectives from the trucking industry. Technol. Soc. 2023, 74, 102313. [Google Scholar] [CrossRef]
- Tengilimoglu, O.; Carsten, O.; Wadud, Z. Infrastructure requirements for the safe operation of automated vehicles: Opinions from experts and stakeholders. Transp. Policy 2023, 133, 209–222. [Google Scholar] [CrossRef]
- Merhebi, G.H.; Joumblat, R.; Elkordi, A. Assessment of the Effect of Different Loading Combinations Due to Truck Platooning and Autonomous Vehicles on the Performance of Asphalt Pavement. Sustainability 2023, 15, 10805. [Google Scholar] [CrossRef]
- Zarif, R.; Starks, C.; Sussman, A.; Kukreja, A. Autonomous Trucks Lead the Way. Deloitte Insights, 17 February 2021. [Google Scholar]
- Dong, C.; Akram, A.; Andersson, D.; Arnäs, P.-O.; Stefansson, G. The impact of emerging and disruptive technologies on freight transportation in the digital era: Current state and future trends. Int. J. Logist. Manag. 2021, 32, 386–412. [Google Scholar] [CrossRef]
- Waschik, R.; Taylor, C.L.; Friedman, D.; Boatner, J. Macroeconomic Impacts of Automated Driving Systems in Long-Haul Trucking; Federal Highway Administration (FHWA): Washington, DC, USA, 2021. [Google Scholar]
- Huang, Y.; Kockelman, K.M. What will autonomous trucking do to U.S. trade flows? Application of the random-utility-based multi-regional input–output model. Transportation 2020, 47, 2529–2556. [Google Scholar] [CrossRef]
- Zhao, J.; Lee, J.Y. Effect of Connected and Autonomous Vehicles on Supply Chain Performance. Transp. Res. Rec. J. Transp. Res. Board 2023, 2677, 402–424. [Google Scholar] [CrossRef]
- Monios, J.; Bergqvist, R. Logistics and the networked society: A conceptual framework for smart network business models using electric autonomous vehicles (EAVs). Technol. Forecast. Soc. Change 2020, 151, 119824. [Google Scholar] [CrossRef]
- Fritschy, C.; Spinler, S. The Impact of Autonomous Trucks on Business Models in the Automotive and Logistics Industry—A Delphi-Based Scenario Study. Technol. Forecast. Soc. Change 2019, 148, 119736. [Google Scholar] [CrossRef]
- Sindi, S.; Woodman, R. Implementing Commercial Autonomous Road Haulage in Freight Operations: An Industry Perspective. Transp. Res. Part A Policy Pract. 2021, 152, 235–253. [Google Scholar] [CrossRef]
- Jaller, M.; Otero, C.; Pourrahmani, E.; Fulton, L. Automation, Electrification, and Shared Mobility in Freight; University of California, Institute of Transportation Studies: Berkeley, CA, USA, 2020. [Google Scholar]
- NCSL. Autonomous Vehicles. Self-Driving Vehicles Enacted Legislation. 18 February 2020. Available online: https://www.ncsl.org/transportation/autonomous-vehicles (accessed on 18 November 2023).
- Alawadhi, M.; Almazrouie, J.; Kamil, M.; Khalil, K.A. Review and Analysis of the Importance of Autonomous Vehicles Liability: A Systematic Literature Review. Int. J. Syst. Assur. Eng. Manag. 2020, 11, 1227–1249. [Google Scholar] [CrossRef]
- Kroesen, M.; Milakis, D.; van Wee, B. Automated Vehicles: Changes in expert opinions over time. Transp. Policy 2023, 136, 1–10. [Google Scholar] [CrossRef]
- Mishler, S.; Chen, J. Effect of Automation Failure Type on Trust Development in Driving Automation Systems. Appl. Ergon. 2023, 106, 103913. [Google Scholar] [CrossRef] [PubMed]
- Simpson, J.R.; Mishra, S.; Talebian, A.; Golias, M.M. An estimation of the future adoption rate of autonomous trucks by freight organizations. Res. Transp. Econ. 2019, 76, 100737. [Google Scholar] [CrossRef]
- Monios, J.; Bergqvist, R. The transport geography of electric and autonomous vehicles in road freight networks. J. Transp. Geogr. 2019, 80, 102500. [Google Scholar] [CrossRef]
- Engholm, A.; Björkman, A.; Joelsson, Y.; Kristoffersson, I.; Pernestål, A. The Emerging Technological Innovation System of Driverless Tucks. Transp. Res. Procedia 2020, 49, 145–159. [Google Scholar] [CrossRef]
- Tamakloe, R.; Park, D. Discovering latent topics and trends in autonomous vehicle-related research: A structural topic modelling approach. Transp. Policy 2023, 139, 1–20. [Google Scholar] [CrossRef]
- Wang, S.; Yu, B.; Ma, Y.; Liu, J.; Zhou, W. Impacts of different driving automation levels on highway geometric design from the perspective of trucks. J. Adv. Transp. 2021, 2021, 5541878. [Google Scholar] [CrossRef]
- Zhang, J.; Wu, K.; Cheng, M.; Yang, M.; Cheng, Y.; Li, S. Safety evaluation for connected and autonomous vehicles’ exclusive lanes considering penetrate ratios and impact of trucks using surrogate safety measures. J. Adv. Transp. 2020, 2020, 5847814. [Google Scholar] [CrossRef]
- BTS. Bureau of Transportation Statistics (BTS). United States Department of Transportation, Bureau of Transportation Statistics (BTS). 16 May 2023. Available online: https://www.bts.gov/faf (accessed on 1 July 2023).
- D.o.C.U.S. Census Bureau. DATA.GOV. 13 January 2021. Available online: https://catalog.data.gov/dataset/tiger-line-shapefile-2016-nation-u-s-primary-roads-national-shapefile (accessed on 19 July 2023).
- ArcGIS. USA Major Cities. 27 September 2022. Available online: https://www.arcgis.com/home/item.html?id=9df5e769bfe8412b8de36a2e618c7672 (accessed on 15 May 2023).
- ATRI. Top 100 Truck Bottlenecks—2023. American Transport Research Institute (ATRI). 2023. Available online: https://truckingresearch.org/2023/02/top-100-truck-bottlenecks-2023/ (accessed on 13 July 2023).
- FreightWaves. How much weight can a big rig carry? FreightWaves, 1 January 2020. [Google Scholar]
- FMCSA. Hours-of-Service Regulations. Federal Motor Carrier Safety Administration (FMCSA). 28 March 2022. Available online: https://www.fmcsa.dot.gov/regulations/hours-service/summary-hours-service-regulations (accessed on 11 July 2023).
- Phadke, A.; Khandekar, A.; Abhyankar, N.; Wooley, D.; Rajagopal, D. Why Regional and Long-Haul Trucks Are Primed for Electrification Now? Lawrence Berkeley National Lab.: Berkeley, CA, USA, 2021. [Google Scholar]
- USDOT. Driving Automation Systems in Long-Haul Trucking and Bus Transit: Preliminary Analysis of Potential Workforce Impacts; US DOT: Washington, DC, USA, 2021.
- Chandler, M.D.; Bunn, T.L.; Slavova, S. Narrative and quantitative analyses of workers’ compensation-covered injuries in short-haul vs. long-haul trucking. Int. J. Inj. Control. Saf. Promot. 2017, 24, 120–130. [Google Scholar] [CrossRef]
- ATRI. The Nation’s Top Truck Bottlenecks 2023; American Transportation Research Institute (ATRI): Arlington, VA, USA, 2023. [Google Scholar]
Disclaimer/Publisher’s Note: The statements, opinions and data contained in all publications are solely those of the individual author(s) and contributor(s) and not of MDPI and/or the editor(s). MDPI and/or the editor(s) disclaim responsibility for any injury to people or property resulting from any ideas, methods, instructions or products referred to in the content. |
© 2023 by the authors. Licensee MDPI, Basel, Switzerland. This article is an open access article distributed under the terms and conditions of the Creative Commons Attribution (CC BY) license (https://creativecommons.org/licenses/by/4.0/).