Article

A Bird’s-Eye View of Colonias Hosting Forgotten Americans and Their Community Resilience in the Rio Grande Valley

Department of Sociology, The University of Texas Rio Grande Valley, Edinburg, TX 78539, USA
Geographies 2023, 3(3), 459-476; https://doi.org/10.3390/geographies3030024
Submission received: 30 May 2023 / Revised: 15 July 2023 / Accepted: 19 July 2023 / Published: 21 July 2023
(This article belongs to the Special Issue Mapping of People and Places for Statistics)

Abstract

:
Colonia communities, which host forgotten Americans, lack essential services such as portable water, adequate wastewater and solid waste disposal, adequate drainage, and adequate paved roads. The aim of this study is to investigate five key aspects of the colonias in the Rio Grande Valley (RGV), which include the total count of colonias in the valley, their susceptibility to public health hazards, flooding occurrences, the transformations that have occurred over the past two decades, and community resilience. This research utilizes two datasets, namely the Colonia Database from the Texas Secretary of State and the community resiliency estimates from the Census Bureau. Geographical information systems (GIS) methods are employed to analyze the spatial and temporal distribution of colonia communities. The principal results reveal that colonia communities host 14% of the RGV’s total 1.37 million population. About half of the total colonia population resides in Hidalgo County, followed by Starr, Cameron, and Willacy counties. About 87% of the total colonia communities exist in census tracts characterized by low or very low community resiliency. Furthermore, 26% of the total colonia communities experiencing flooding after rainfall are in tracts with low or very low community resiliency. This study provides the major conclusion that while there have been slight improvements in the colonias’ susceptibility to public health risks within the past two decades, there still remains significant developmental work. Without tackling these challenges, achieving meaningful progress in community resilience becomes a daunting task. Applying an environmental justice lens to the issues faced by colonia communities helps shed light on the systemic inequalities and injustices they experience.

1. Introduction

“Colonias are substandard housing developments, often found along the Texas-Mexico border, where residents lack basic services such as drinking water, sewage treatment, and paved roads [1,2].” The word “colonia” is originally from the Spanish language, meaning “neighborhood” or “community” [3]. The 1950s marked the beginning of the origin of colonias, which can be traced back to the State of Texas’s adoption of centralized power [4]. At that time, areas outside the city limits were designated as “regulation free zones”, which provided the necessary conditions for colonia developers to convert agricultural lands that were of limited economic value due to flooding, poor drainage, or hilly terrain, into platted lots, which were then sold on contracts for deed where the title would be transferred only upon completion of full payment [4].
During the 1960s, numerous colonias were established in Texas. In the following decade, the colonias experienced rapid growth, largely attributed to the settlement of both legal and illegal immigrants from Mexico and Central America [5]. As of 1980, an estimated 185,000 people lived in colonias located in the four border states of Texas, New Mexico, Arizona, and California [4]. Three decades later, in 2019, the population residing in the 1854 colonia communities of Texas alone had skyrocketed to an estimated 369,482 individuals, representing approximately 1.3% of the state’s total population [4,6]. This population estimate has been substantiated by multiple sources, including colonias ombudsperson site visits [4]. According to a report by the Federal Reserve Bank of Dallas, approximately 96% of the residents in the colony are of Hispanic descent and have a median income of less than $30,000 ($51,000 being the state median); out of this population, 40% live below the poverty line, while 20% live at or just above it; two-thirds of the residents are US citizens, and 94% of the youth in the colony were born in the United States [7]. Research studies, as well as documentary films, frequently label them as “forgotten Americans,” who reside in impoverished communities in southern Texas and lead a significantly distinct lifestyle when compared to the broader population of the United States. [2,8,9].
Colonias refer to unincorporated subdivisions located in the “rural, minimally regulated areas of counties, where building codes and regulations are either non-existent or unenforceable” [10]. These communities are characterized by living conditions comparable to those in Third World countries with a lack of basic infrastructure services such as “wastewater collection and treatment, drainage, paved streets, or, in some cases, even electricity” [10,11]. The “housing is substandard with poor plumbing, heating and cooling systems.” The high incidence of viral diseases in colonias is largely attributed to the absence of fundamental infrastructure, including clean drinking water and proper sewage systems. Additionally, inadequate medical insurance coverage and a shortage of healthcare facilities contribute to the problem [4,12,13].
The health outcomes of residents in the colonias have been negatively impacted by poor living conditions and environmental factors. Chronic diseases, such as diabetes and high blood pressure, are prevalent in these communities and are intricately tied to housing conditions [7,14,15]. A lack of access to quality food, parks, and public spaces for maintaining a healthy lifestyle, inadequate insulation and kitchens, and proximity to crops exposed to harmful pesticides are contributing factors to these poor health outcomes. Additionally, limited access to healthcare facilities and providers further exacerbates these issues [7,16]. Studies have documented that residents in the colonias have limited access to water, which creates feelings of insecurity regarding water and sanitation and has further negative impacts on their physical and mental health [14]. Furthermore, the colonias are affected by high rates of chronic diseases, such as diabetes and obesity [17]. Among residents in the colonias of southern Texas, the frailty index was found to be high and is attributed to factors such as socioeconomic status, poverty, social determinants of health, and health disparities [17]. It is important to note that increased frailty has been positively linked to higher mortality rates [17].
In addition to the poor living conditions, the residents in colonias face another problem—flooding. The communities are predominantly situated in rural areas that lack proper drainage infrastructure [18]. The broader RGV region is particularly susceptible to flooding due to various factors: (1) insufficient topographic alleviation, as the terrain of the delta region is flat, making dropping water extra hard; (2) blockages created by using transportation and irrigation infrastructure, which form impediments to herbal water flows due to the flat terrain; (3) insufficient drainage structures due to governance boundaries and lack of nearby governance, which exacerbate flooding threat; and (4) low permeability of the soils, particularly the dominant clay soil composition, which prevents water from being quite simply absorbed into the ground and results in sluggish infiltration and runoff [19]. Specifically, colonia communities suffer from flooding due to the lack of adequate drainage infrastructure. Existing irrigation and drainage ditches are often insufficient to divert water away from residential areas. Moreover, the practice of using ditches as dumping grounds for solid waste obstructs the natural flow of water. Heavy rains further worsen the situation, exacerbating issues with inadequate sewage systems, including cesspools, pit privies, and malfunctioning septic tanks [18,20].
Starting in 1989, Texas legislators introduced a series of legal reforms aimed at addressing the challenges faced by colonias [21]. These reforms led to the establishment of colonia prevention laws, which varied in scope but shared a common objective of improving conditions for colonia residents, including the provision of water and sewer services. Over the period spanning 1989 to 2005, authorities allocated USD 450 million to colonia projects under the umbrella of these prevention laws. Of this total amount, USD 250 million was earmarked for water-related projects, while USD 175 million was dedicated to road paving initiatives [22]. In 2005, in order to monitor the advancement of state-funded initiatives aimed at improving colonias, the Texas Secretary of State (SOS) was tasked with three key responsibilities under Senate Bill 827 (SB 827), 79th Regular Legislative Session [23]. These included developing a system to identify colonias, establishing a classification system to gauge the public health risks associated with colonias, and generating a progress report to present to the legislature regarding state-funded infrastructure projects designed to benefit colonias [24].
Studies indicate that communities with low socioeconomic status are particularly vulnerable to disasters [25,26,27]. This vulnerability is evident among the population residing in colonias communities within the RGV, as they face multiple challenges stemming from their socioeconomic status, location in flood-prone areas, substandard housing conditions, and frequent flooding. At the global level, the United Nations [28] defines resilience as the capacity of a system, community, or society exposed to hazards to resist, absorb, accommodate, adapt to, transform, and recover from their effects in a timely and efficient manner. This includes the preservation and restoration of essential structures and functions through risk management. Similarly, at the national level, the Federal Emergency Management Agency (FEMA) defines community resilience as the ability of a community to prepare for anticipated natural hazards, adapt to changing conditions, and rapidly withstand and recover from disruptions [29]. Locally, community resilience refers to the sustained ability of a community to endure and recover from adversity [30]. In order to comprehend and address the community resilience of colonias, it is essential to measure and assess their specific circumstances. By evaluating the resilience of these communities, a better understanding can be gained of their strengths, weaknesses, and needs, ultimately aiding in the development of effective strategies for enhancing their resilience.
The aim of this paper is to investigate various aspects of colonias in the RGV with a focus on their vulnerability to public health hazards, transformations over the past two decades, community resilience, and the impact of flooding. Through a comprehensive analysis of official sources, available data, and scholarly research, this study seeks to provide a deeper understanding of the total count of colonias, their susceptibility to public health hazards, the proportion of colonias affected by flooding, significant transformations, and community resilience. The findings of this research will contribute to a more informed approach toward addressing the challenges faced by colonias in the RGV and inform policymakers aimed at improving public health and living conditions in these marginalized communities, where the forgotten Americans reside.
To achieve the aim of this study, the research will focus on answering the following five overarching research questions:
1.
What is the total count of colonias in the RGV, as documented by official sources?
2.
What is the degree of susceptibility of the colonias to public health hazards, as indicated by available data?
3.
What are the significant transformations that have taken place in terms of colonias’ vulnerability to public health hazards in the last two decades, as per scholarly research?
4.
What is the extent of community resilience in the colonias, as measured by established indicators?
5.
What is the proportion of colonias that are affected by flooding, based on available empirical evidence?
Firstly, the primary objective of this research is to ascertain the count of colonias situated in the RGV, relying on officially documented data. This information would provide a fundamental comprehension of the size and scope of the colonias in the area, serving as a valuable resource for further research and policy analysis. Secondly, the study endeavors to investigate the susceptibility of the colonias in the RGV to public health hazards, based on available data. Thirdly, the research aims to explore significant changes that have transpired in the vulnerability of the colonias in the RGV regarding public health hazards over the last two decades, as evidenced in academic studies and prior agency reports. Fourthly, the study seeks to gauge the level of community resilience in the colonias of the RGV, utilizing established indicators. Community resiliency could be viewed as disaster readiness and the ability to deal with everyday problems [31,32]. Fifth, the research aims to determine the percentage of colonias in the RGV affected by flooding, drawing on available empirical evidence. The study’s outcomes are expected to enrich the knowledge base on colonias and the proneness to public health risks and community resilience.

2. Materials and Methods
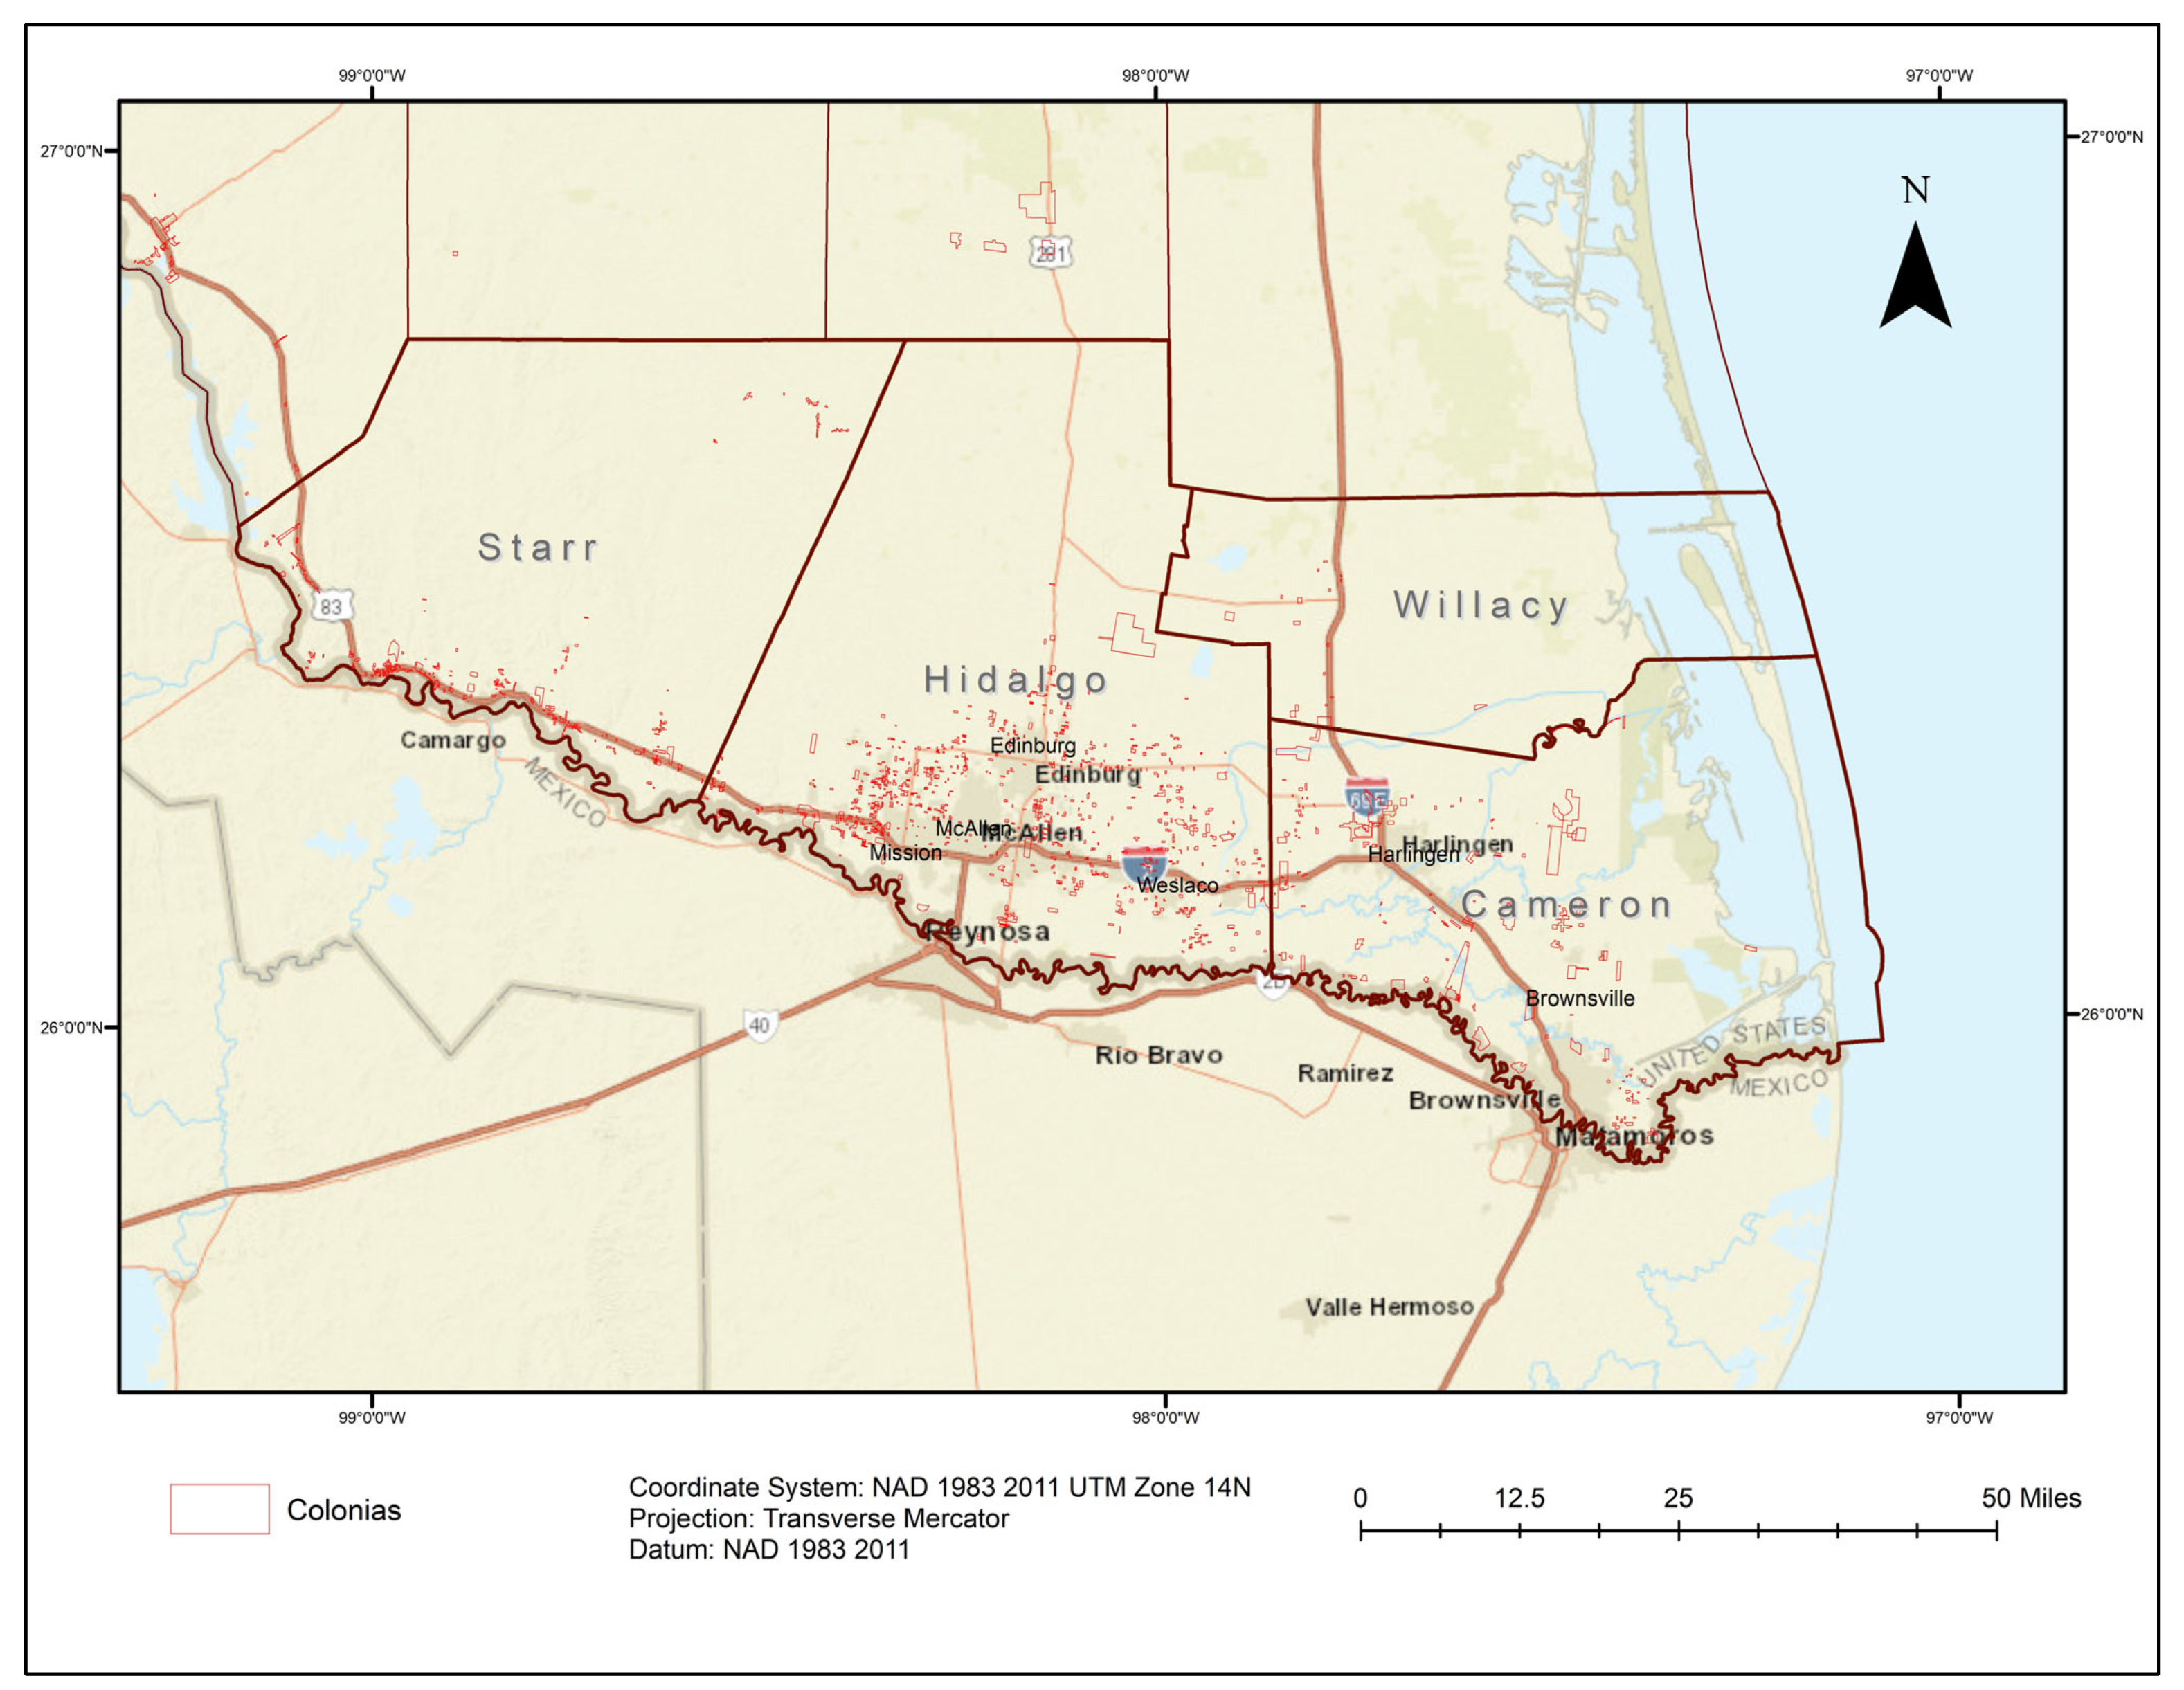
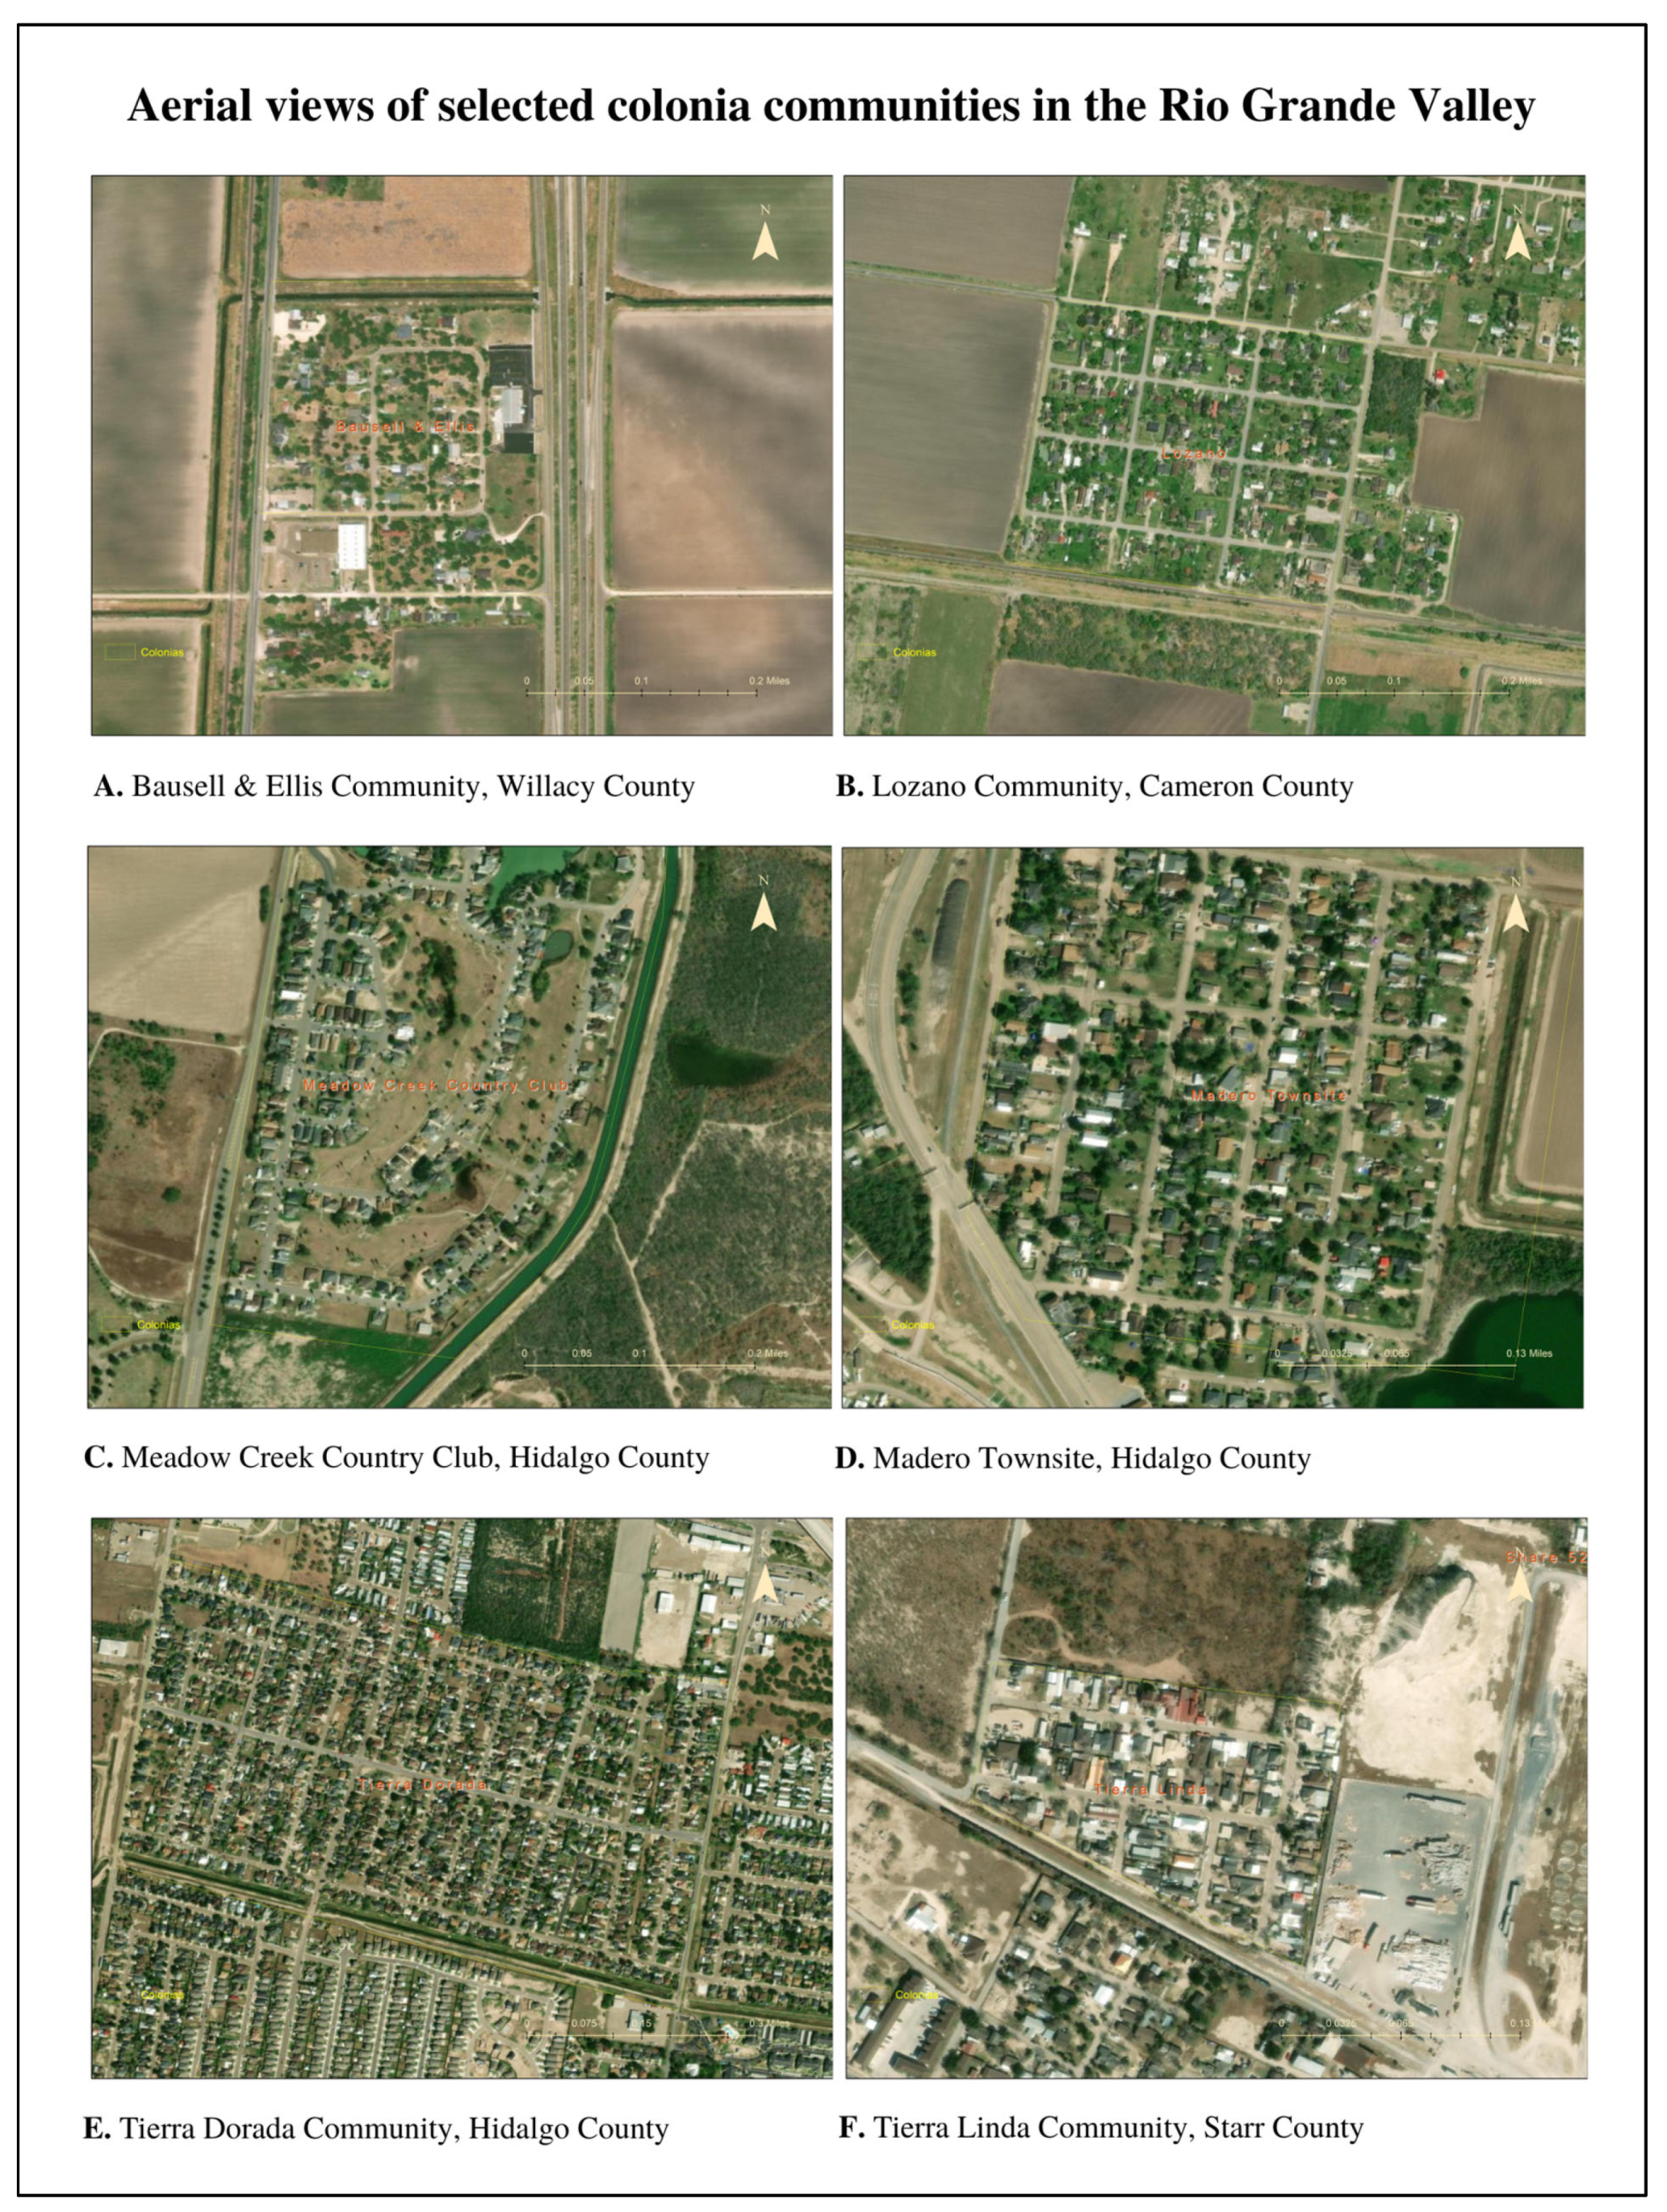
2.1. Study Area

This study focuses on the RGV, which is a region located in Southern Texas, United States, bordering Mexico to the south. The RGV consists of four counties, namely Willacy, Cameron, Starr, and Hidalgo, covering an area of approximately 4800 square miles (Figure 1). The region is characterized by a subtropical climate, fertile farmland, and a diverse population of approximately 1.3 million people, with a significant percentage of the population identifying as Hispanic/Latino. The RGV is vulnerable to a variety of natural disasters, including flooding, hurricanes, and tornadoes, due to its location along the Gulf Coast and proximity to the Rio Grande river. In particular, flooding is a major concern for the region, as heavy rainfall and storm surges from hurricanes can cause the river to overflow its banks and inundate low-lying areas. The Valley (as it is also known in the area) is also prone to flash floods, which can occur rapidly and without warning, causing significant damage to property and infrastructure. For example, the Valley experienced a devastating flood event in June 2018 following several days of heavy rainfall. The 2018 flood event highlighted the ongoing vulnerability of the RGV to flooding and the need for effective disaster preparedness and response strategies to mitigate the impact of these hazards on the region.

2.2. Data

This study includes datasets from two sources: the Census Bureau and the Texas Secretary of State office, and it utilizes the GIS methods to conduct spatial analysis. First, the study received geodata from the Texas Secretary of State’s Texas Colonia Community Database [33]. The spatial dataset consists of the geographical locations of colonia communities located in the State of Texas. In addition, the community resilience estimate dataset was also obtained from the Census Bureau [34].
Community resilience is the capacity of individuals and households within a community to absorb, endure, and recover from the impacts of a disaster. The Community Resilience Estimates (CREs) are experimental estimates produced using information on individuals and households from the 2018 American Community Survey (ACS), the Census Bureau’s Population Estimates Program (PEP), as well as publicly available health condition rates from the National Health Interview Survey (NHIS). The experimental CREs, in their current form, are specific to the current COVID-19 pandemic. Local planners, policy makers, public health officials, and community stakeholders can use the estimates as one tool to help assess the potential resiliency of communities and plan mitigation strategies. Although the CREs in their current form are specific to the current pandemic, the small area modeling techniques used to develop it are flexible and can easily be modified for a broad range of natural disasters (hurricanes, tornadoes, floods, etc.).
The Census Bureau [34] provides a similar definition of community resilience, which encompasses the ability of individuals and households to endure, recover, and absorb the impacts of disasters. This concept is reflected in the Community Resilience Estimates (CREs) derived from various data sources, including the 2018 American Community Survey, the Census Bureau’s Population Estimates Program, and the National Health Interview Survey. While primarily designed to measure resilience in the context of the COVID-19 pandemic, these data can be adapted to assess community resilience in the face of different natural disasters. Therefore, the community resilience estimates generated by the Census Bureau are applicable and suitable for evaluating the resilience of colonia communities against public health risks and disaster risks.

2.3. Data Analysis

First, to search for answers to Research Question 1, the colonia communities present in the four counties of the RGV were chosen from the Colonia Community Dataset and exported as a shapefile. This shapefile representing the colonias was then overlaid over a satellite base map to observe an aerial perspective of the selected colonia communities.
Second, to address Research Questions 2 and 3, the study utilized the COLOR_CLAS variable known as the SB827 Color Classification, which assesses the susceptibility of colonias to public health risks. This variable was measured using the Texas Colonia Health-Risk Classification System, consisting of four categories: Green, Yellow, Red, and Unknown (refer to Table 1) [23]. Green colonias indicate that residents have access to potable water, paved roads, and functional wastewater disposal systems. On the other hand, Yellow colonias lack sufficient road paving, drainage, or solid waste disposal systems, posing an intermediate level of health risk. Red colonias lack all of the services. Colonias that cannot be definitively classified as Green, Yellow, or Red are categorized as Unknown. This study examined the spatial distribution of color-coded colonias within each of the four counties in the RGV. Furthermore, a comparative analysis was conducted between the current 2023 portfolio of color-coded colonias and portfolios from previous years, specifically 2014, 2010, and 2006.
Third, in order to address Research Question 4, the study employed the community resilience estimate dataset along with ten factors (refer to Table 2) identified by the Census Bureau [34]. By utilizing thirteen proxy variables, a composite index of community resilience was created. T. L. Saaty [35,36] initially introduced the Analytic Hierarchy Process (AHP), which is a decision-making methodology that systematically analyzes and evaluates multiple criteria or factors to facilitate informed decision making. The AHP method is widely utilized for assessing hazards and community resilience [35,36,37,38]. Numerous studies have applied AHP in different contexts. For instance, researchers have developed an AHP-based evaluation system to assess habitability performance [39], urban flood management [40], corporate sustainability [41], and resilience measurement [42]. These studies demonstrate the wide-ranging applicability of AHP as an aggregation methodology. Despite its benefits, the AHP has limitations. It struggles to capture uncertainty, the subjectivity of evaluation results due to heavy reliance on decision makers’ judgments, losses of information when conflicting scores for certain criteria cancel each other out, and the computational complexity of AHP with more criteria and alternatives [42].
The application of the AHP method in community resilience assessment involves a few steps, including pair-wise comparisons, the creation of table matrices, the calculation of weighting coefficients, and the assessment of consistency ratios. These steps have been extensively discussed in published works. In this study, both the AHP method and the geographical information system (GIS) were employed to generate a community resilience assessment map for the study area. Ten factors that measure community resilience were assigned equal weights of 10% each. In cases where a factor was measured by two variables, the variables were equally assigned weights of 5% each. A matrix table outlining these weight assignments is provided in Table 2.
The construction process commenced by normalizing each proxy variable through the implementation of the min-max scaling method. Furthermore, three proxy variables, namely educational attainment, employment, and Internet access, which exhibited a positive association with community resilience, were transformed into a negative relation by subtracting each observed value from one. Ultimately, the community resilience composite index was formed by summing all the proxy variables with equal weights as depicted in Table 2. The composite index of community resilience was calculated for all census tracts across the United States. Employing the standard deviation classification method, the composite index was categorized into five groups: Very High (<−1.5 Std. Dev.), High (−0.5 and −1.5 Std. Dev.), Moderate (−0.5 and 0.5 Std. Dev.), Low (−0.5 and −1.5 Std. Dev.), and Very Low (>1.5 Std. Dev.). These classifications were determined based on the standard deviation values of the composite index.
Finally, to address Research Question 5, the study utilized two variables from the Texas Colonia Community Database. These variables are RAINFALL_F (Does Flooding Occur After Rainfall?) and IN_FLOODPL (Is the Community in a Floodplain?) [33]. An analysis of color-coded colonias against their community resilience was conducted.

3. Results

The research questions are addressed in five distinct sections, each offering insights and answers in accordance with the study’s findings.

3.1. Total Number of Colonias in the Rio Grande Valley

In the RGV, there are 1266 communities known as colonias. These colonias are distributed as follows: 172 in Cameron County, 846 in Hidalgo County, 232 in Starr County, and 16 in Willacy County (refer to Table 3, Figure 1). Notably, the majority of colonias are found in Hidalgo County, accounting for 66% of the total. The colonia communities collectively accommodate a population of 188,455 individuals, which represents 13.77% of the overall population of the RGV, estimated at 1,367,914 people. The population distribution in the respective counties is as follows: Cameron County has a population of 47,278, Hidalgo County has 106,915 residents, and Starr County has 34,262 inhabitants. However, the exact population figure for Willacy County is currently unavailable.
By utilizing satellite maps, the study closely examined randomly selected colonia communities in the RGV (Figure 2). The observation revealed that the houses are situated in patterns that were deliberately planned within a subdivision.

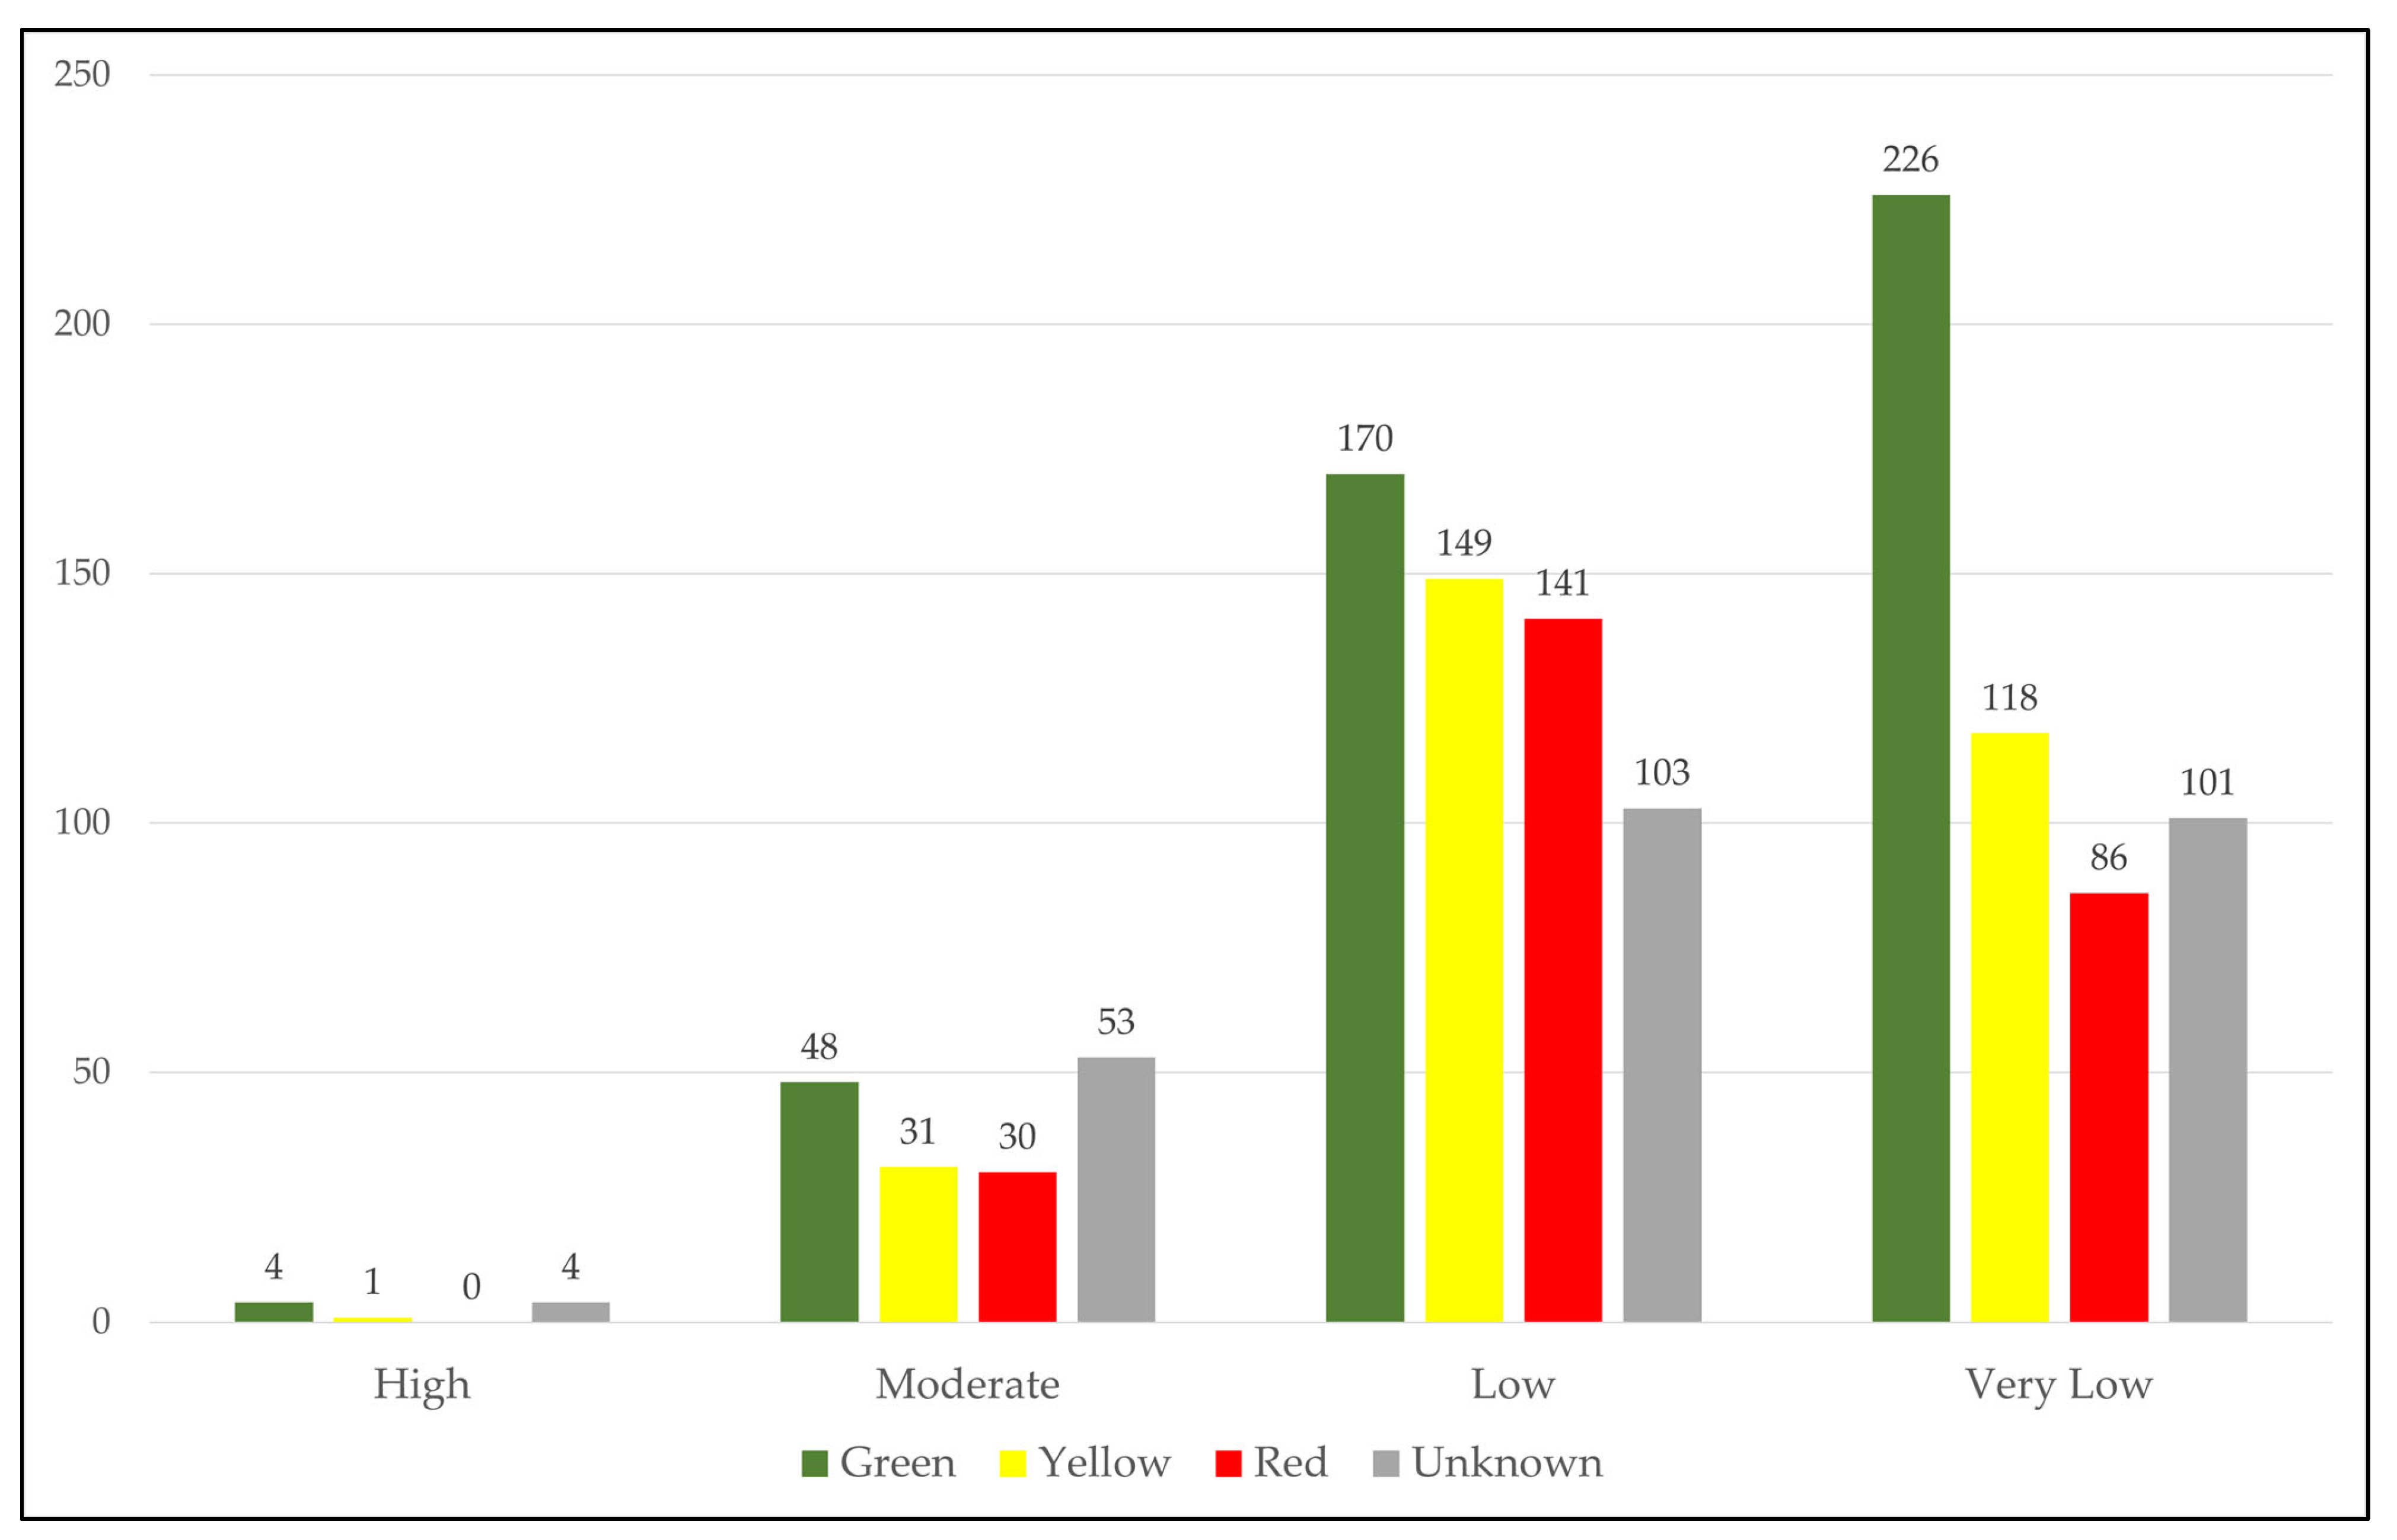
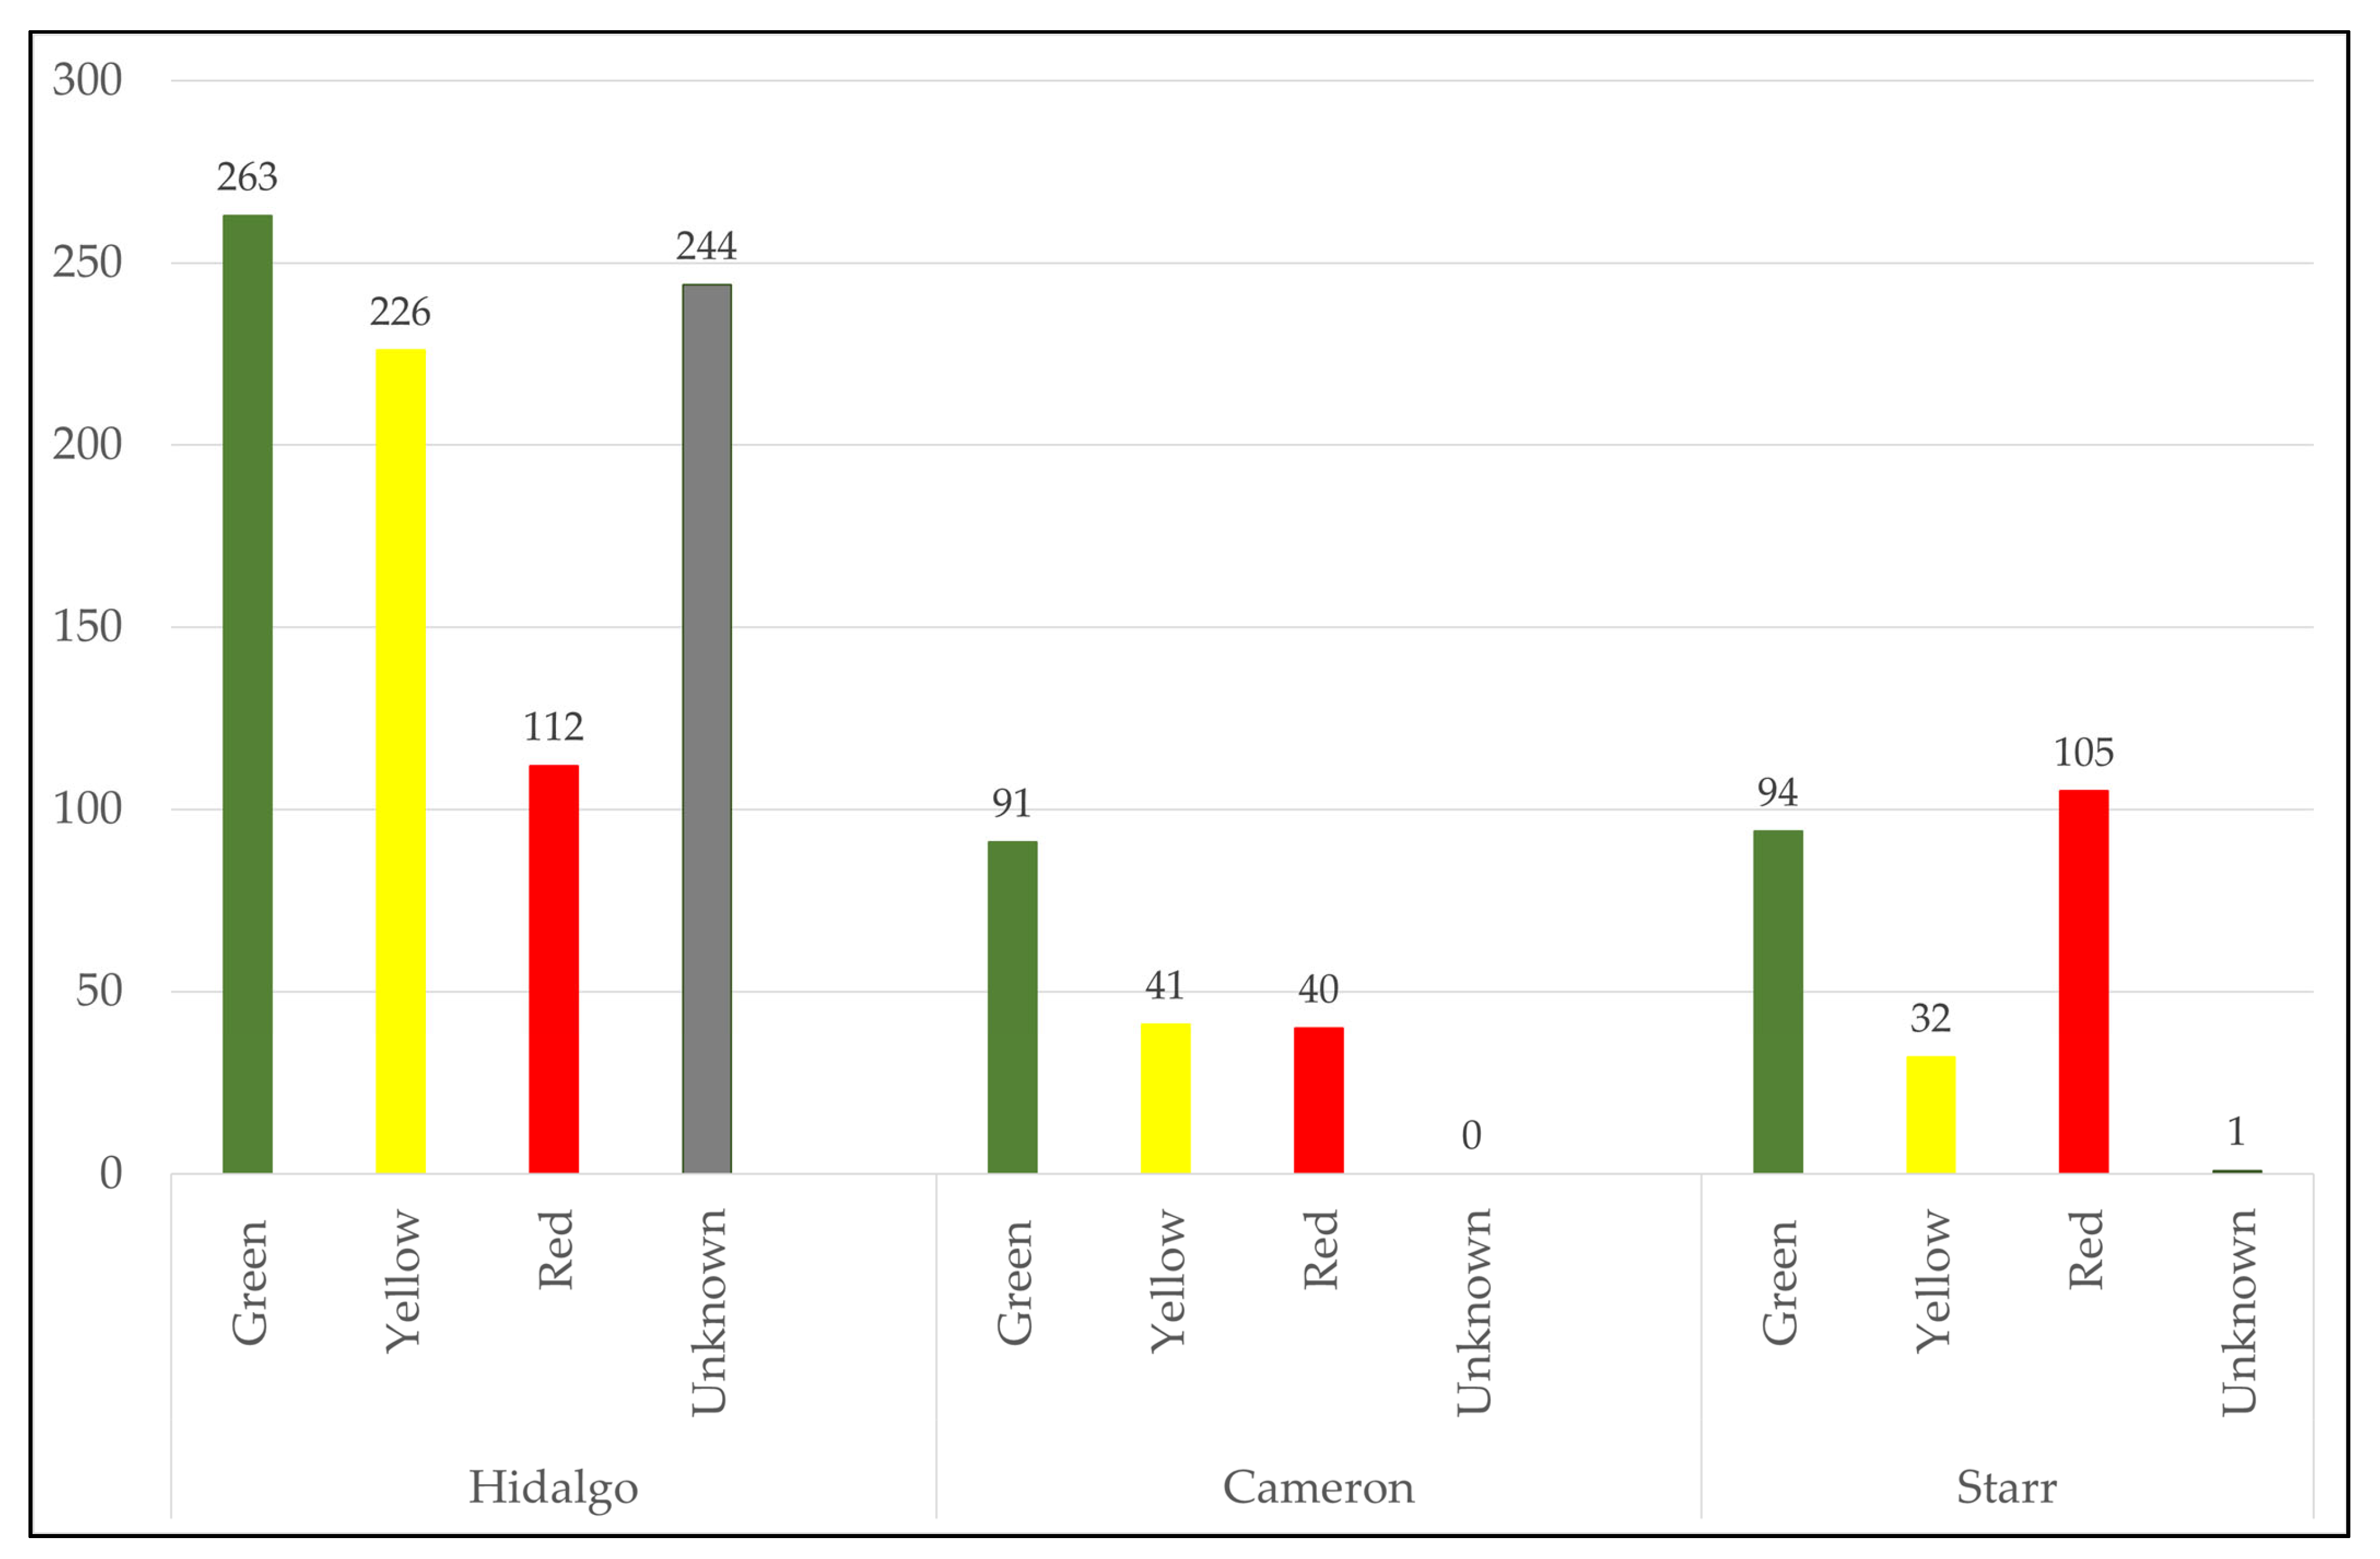
3.2. The Degree of Susceptibility of the Colonias to Public Health Hazards

The level of susceptibility of the colonias to public health hazards is indicated by a color-code system. In Hidalgo County, approximately 31% (263) of the colonias are classified as Green, 27% (226) as Yellow, 13% (112) as Red, and 29% (244) have an Unknown classification (Table 3). In Cameron County, 53% (91) of the colonias are Green, 24% (41) are Yellow, 23% (40) are Red, and none of them are classified as Unknown. Starr County has 41% (94) Green colonias, 14% (32) Yellow colonias, 45% (105) Red colonias, and one colonia community with an Unknown classification (Figure 3). As for Willacy County, there are 16 colonias, all of which are not color-coded, and their susceptibility level to public health hazards remains unknown.

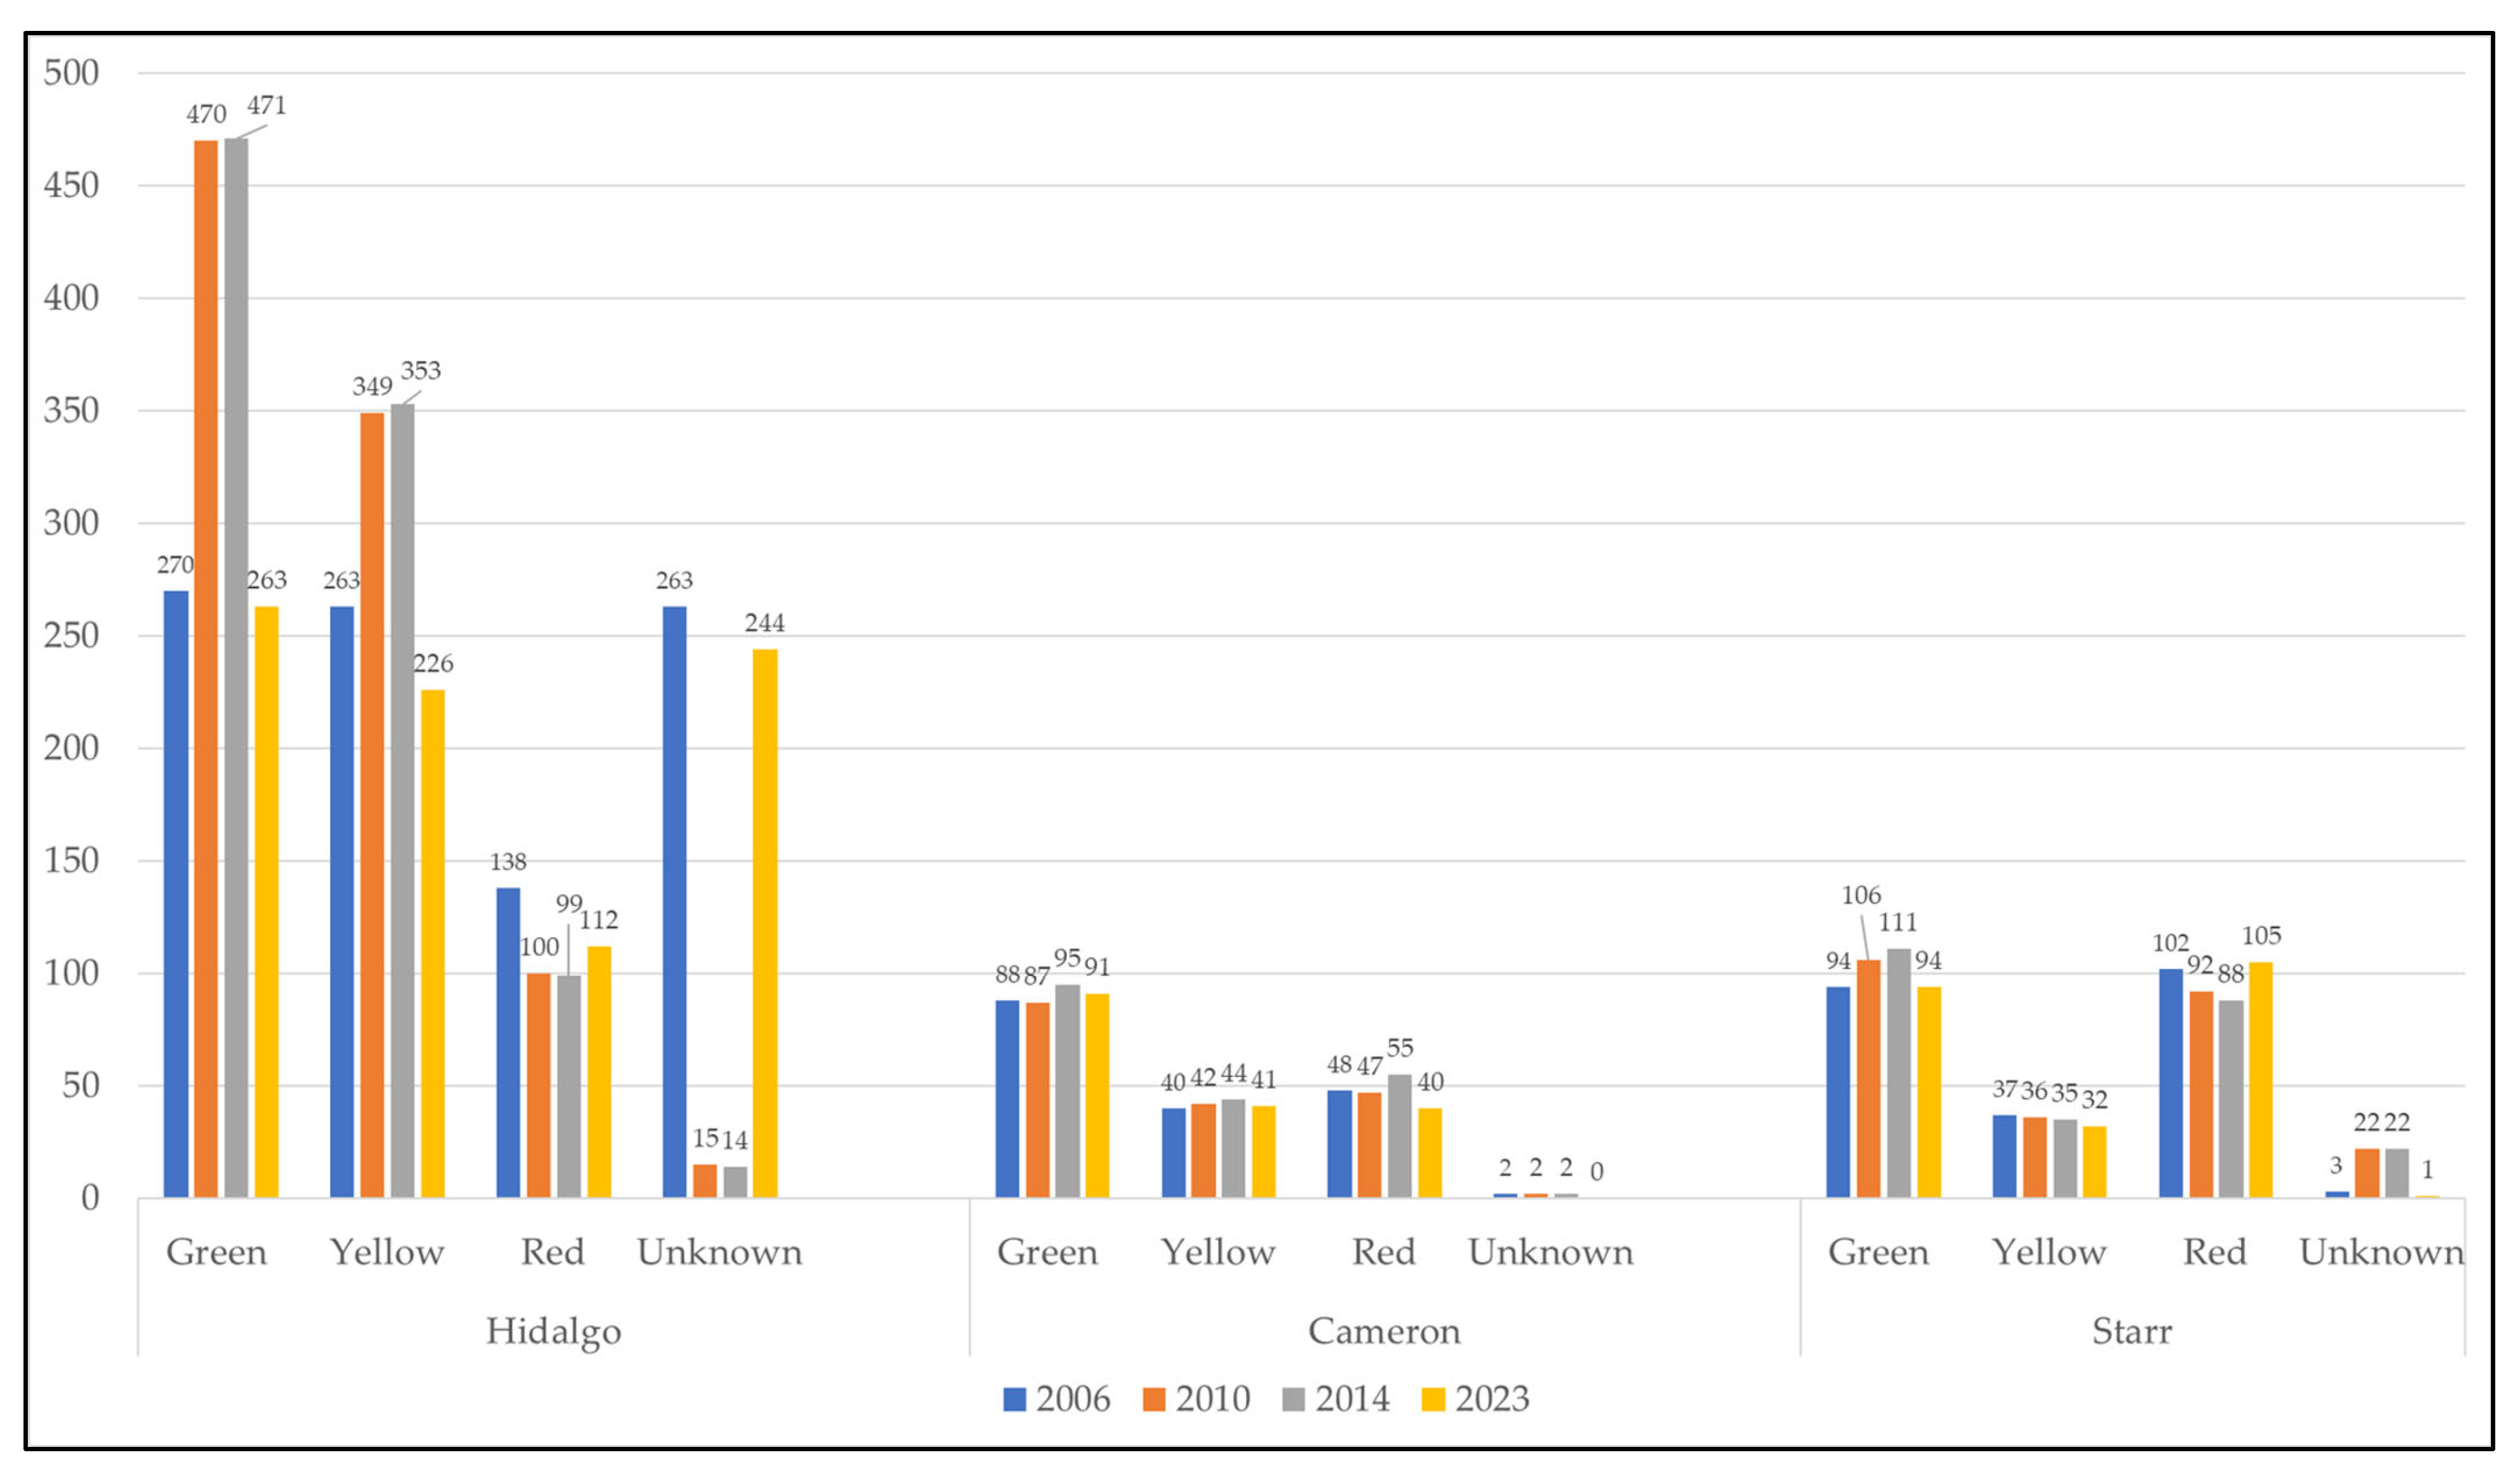
3.3. Transformations of Colonias’ Vulnerability to Public Health Hazards

Senate Bill 99 passed during the 80th Regular Session (SB 99) and was enacted into law on 15 June 2007, authored by Senator Judith Zaffirini. This legislation aimed to build upon the efforts initiated by Senate Bill 827, enacted during the 79th Regular Session (SB 827). Similar to SB 827, SB 99 assigned the SOS three primary responsibilities: (1) the development and maintenance of a colonias identification system, (2) the establishment and upkeep of a state-wide system for categorizing colonias with the most severe public health risks, and (3) the creation of a progress report for the legislature regarding state-funded infrastructure projects. The SOS prepared the SB 827 report, which was subsequently submitted on 1 December 2006. In 2006, Hidalgo County had a total of 270 colonia communities classified as Green (Table 3, Figure 4). By 2010, the number of these communities had risen to 470, representing a substantial increase of 74%. In 2014, the count of Green colonias almost remained constant, with a marginal change to 471, indicating a negligible 0% shift. However, in 2018, there was a significant decrease as the number dropped to 263, signifying a 44% decline compared to the previous count. Overall, between 2006 and 2023, there was a total decline of 2.6% in Green colonias in the county.
In the same county, there were 263 colonia communities categorized as Yellow in 2006. By 2010, the count rose to 349, indicating a 33% increase. In 2014, the number slightly grew to 353, representing a marginal 1% change. However, in 2023, there was a decrease as the count dropped to 226, reflecting a decline of 36% compared to the previous count. In total, there was a decline of 14.07% in Yellow colonias between 2006 and 2023 (Table 3, Figure 4). Similarly, there were 138 communities classified as Red in 2006. This number declined to 100 in 2010, representing a 28% decline. In 2014, the count remained at 99, indicating another 1% decline. However, in 2023, there was a 13% increase as the count rose to 112. In total, between 2006 and 2023, there was a decline of 19% in Red colonias in the county (Table 3, Figure 4).
In Cameron County, the number of Green colonias was observed to be 88 in 2006. This count slightly decreased to 87 in 2010, reflecting a 1% decrease. However, in 2014, there was an increase as the count rose to 95, indicating a 9% increase. By 2023, the number dropped to 91, resulting in a 4% decrease compared to the previous count. Overall, between 2006 and 2023, there was a total increase of 3.4% in Green colonias (Table 3, Figure 4). Similarly, the count of Yellow colonias in Cameron County was 40 in 2006. By 2010, it increased to 42, representing a 5% increase. In 2014, the count grew further to 44, indicating another 5% increase. However, in 2023, there was a decrease as the count dropped to 41, reflecting a 7% decrease compared to the previous count. In total, between 2006 and 2023, there was a 2.5% increase in Yellow colonias (Table 3, Figure 4). Regarding Red colonias, there were 48 observed in Cameron County in 2006. By 2010, the count decreased to 47, reflecting a 2% decrease. However, in 2014, there was an increase as the count rose to 55, indicating a 17% increase. By 2023, the number dropped to 40, resulting in a 27% decrease compared to the previous count. Overall, between 2006 and 2023, there was a total decrease of 17% in Red colonias (Table 3, Figure 4).
In Starr County, the count of Green colonias was 94 in 2006. By 2010, it increased to 106, representing a 13% increase. In 2014, the count further grew to 111, indicating a 5% increase. However, by 2023, the number dropped to 94, resulting in a 15% decrease compared to the previous count. From 2006 to 2023, the overall count has remained the same throughout this period. (Table 3, Figure 4). Regarding Yellow colonias, there were 37 observed in Starr County in 2006. By 2010, the count decreased to 36, reflecting a 3% decrease. In 2014, the count further declined to 35, indicating another 3% decrease. By 2023, the number dropped to 32, resulting in a 9% decrease compared to the previous count. In total, between 2006 and 2023, there was a 13.51% decrease in Yellow colonias (Table 3, Figure 4). Concerning Red colonias, there were 102 observed in Starr County in 2006. By 2010, the count decreased to 92, reflecting a 10% decrease. In 2014, the count further declined to 88, indicating a 4% decrease. By 2023, the number increased to 105, resulting in a 19% increase compared to the previous count. In total, between 2006 and 2023, there was a 2.94% increase in Red colonias (Table 3, Figure 4). Among the three counties, Hidalgo County has the highest number of Unknown colonias, with a count of 244 in 2023. In contrast, Cameron County does not have any Unknown colonias, and Starr County only has one community classified as Unknown in the same year.

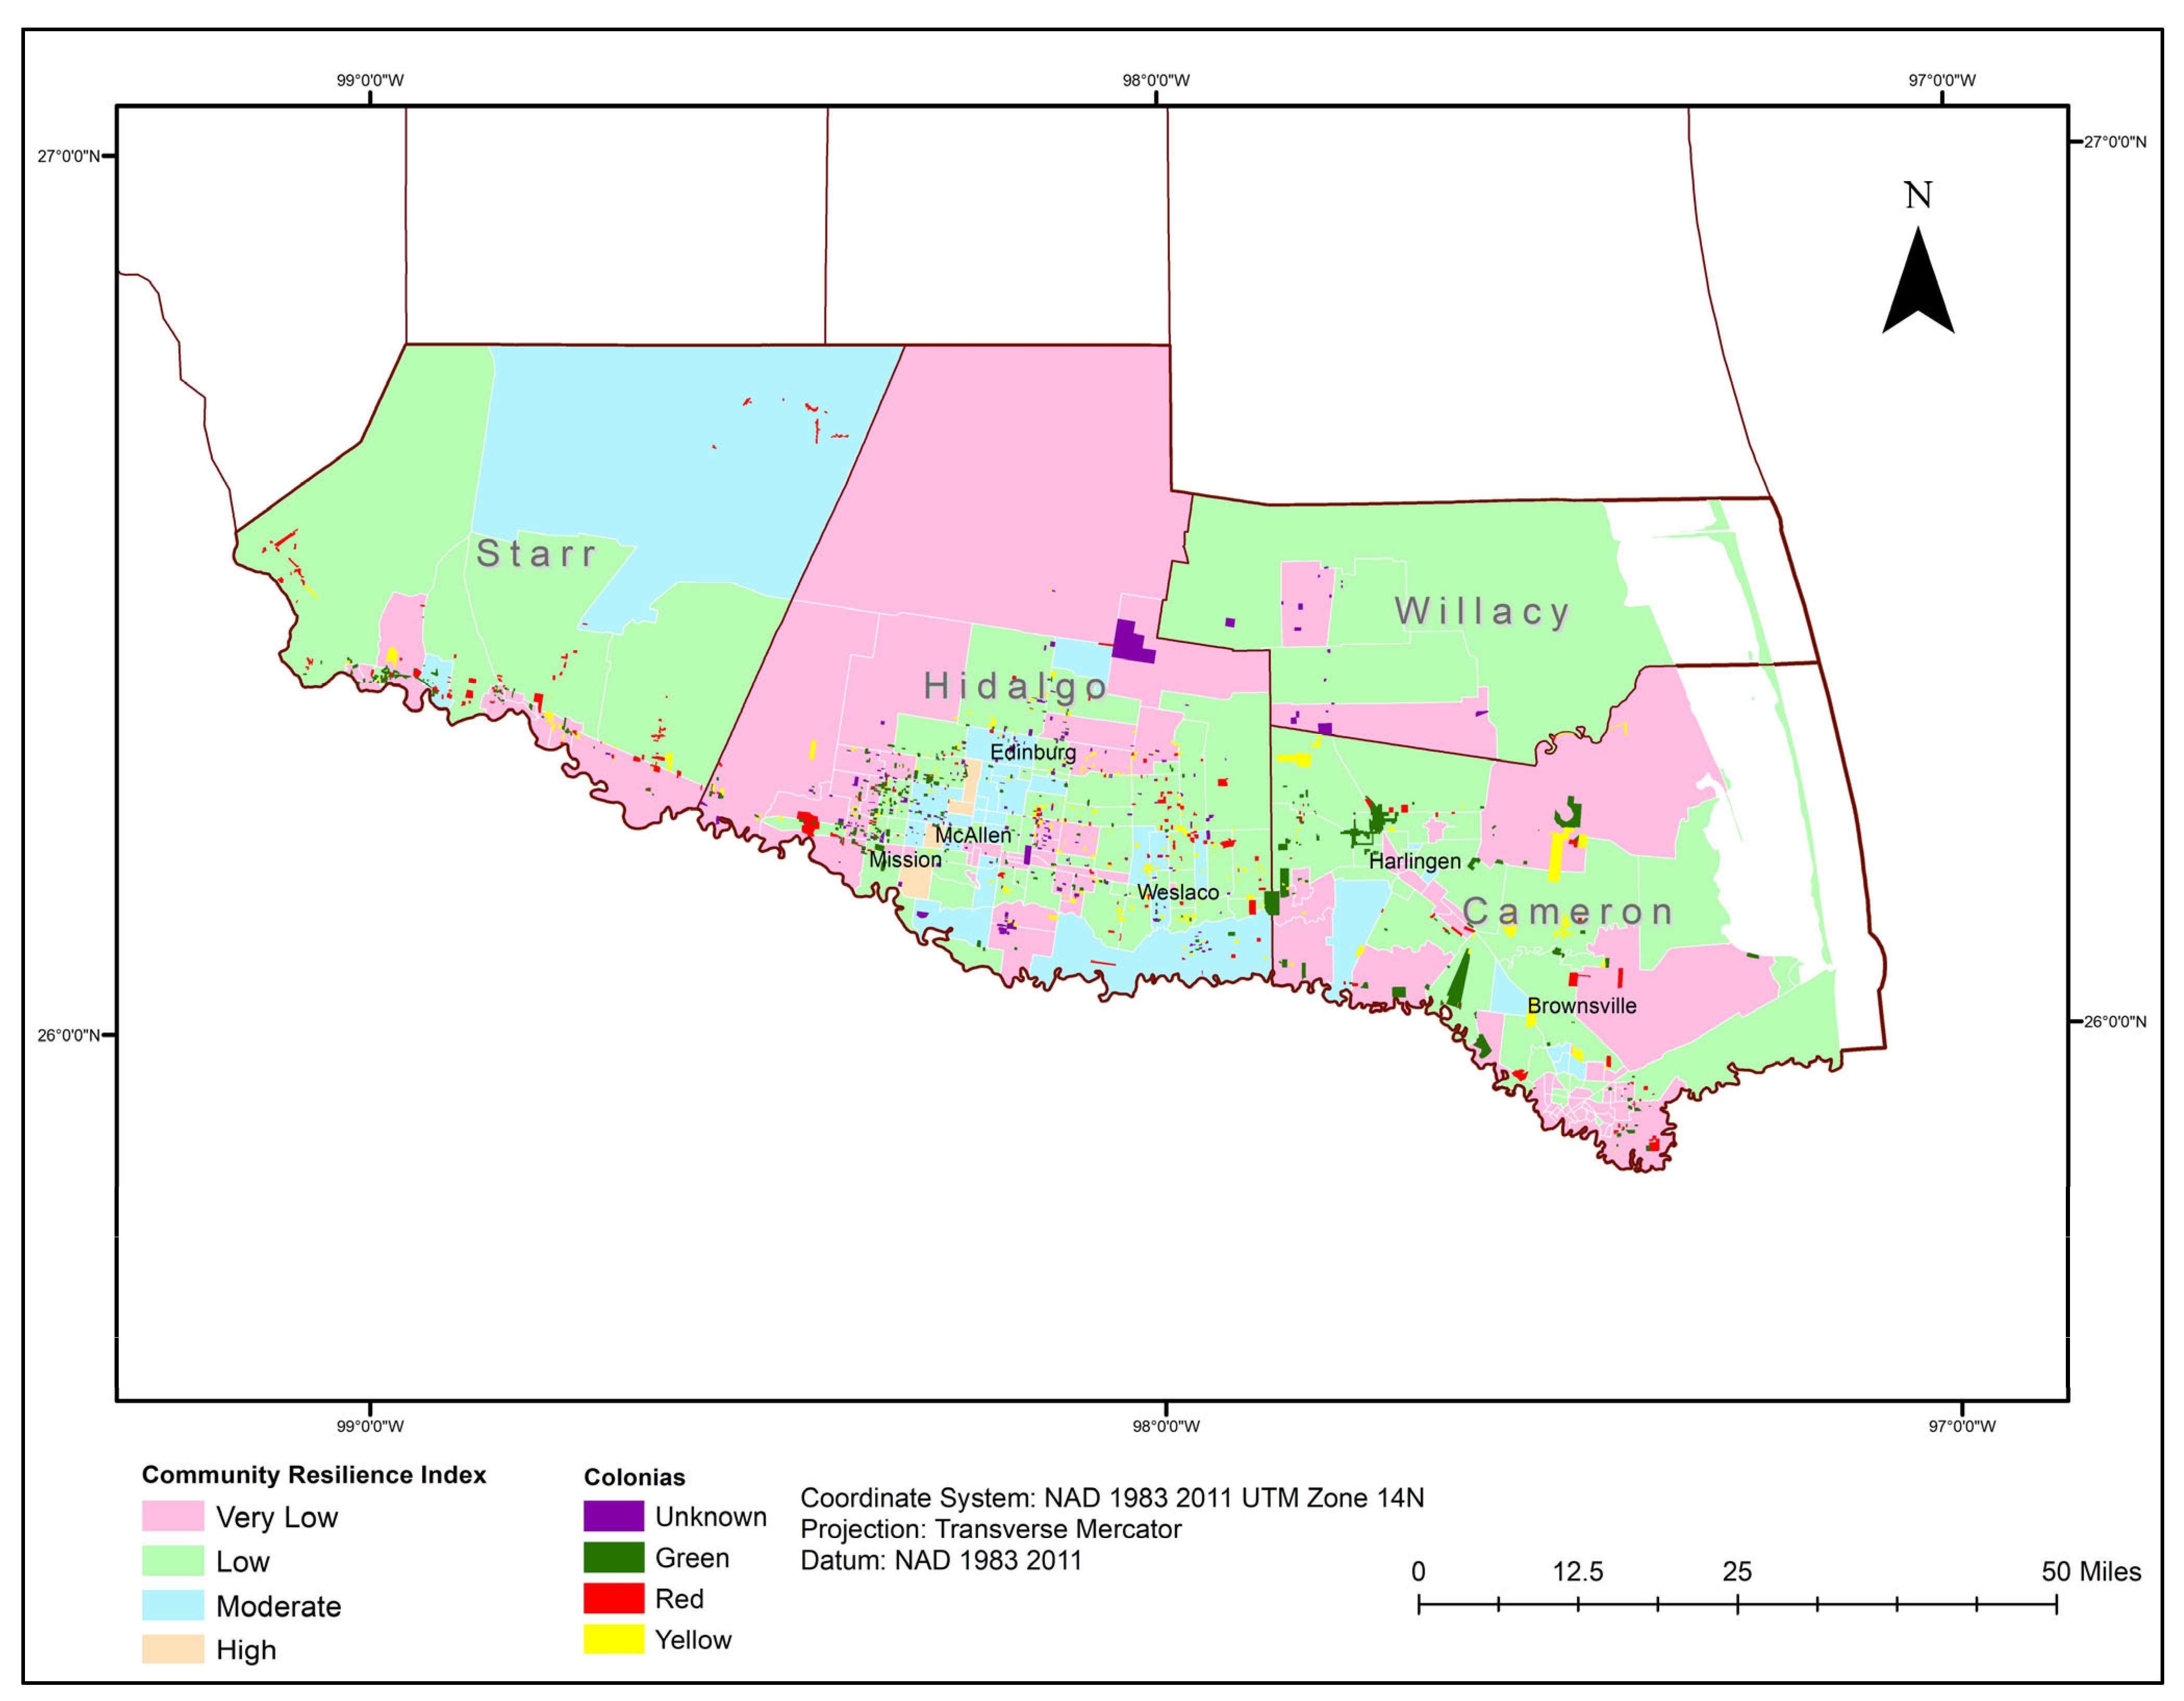
3.4. The Extent of Community Resilience in the Colonias

The community resilience index is categorized into five levels: Very High, High, Moderate, Low, and Very Low. Out of the 219 census tracts in the RGV, 4 tracts (2%) fall into the High category, 33 tracts (15%) fall into the Moderate category, 90 tracts (41%) fall into the Low category, and 92 tracts (42%) fall into the Very Low category (Table 3, Figure 5).
In terms of the presence of colonias groups inside the recognized tracts, three tracts (representing 75% of the four tracts) classified as High. Furthermore, 20 tracts (accounting for 61% of the entire 33 tracts) classified as Moderate comprise colonia communities. In the Low class, colonia groups are present in seventy tracts, which corresponds to 78% of the overall ninety tracts. Lastly, the Very Low category includes 54 tracts, representing 59% of all 92 tracts in which colonia communities are found (Table 3, Figure 5).
During the analysis of public health risk susceptibility in relation to community resilience, it was observed that several colonia communities coded as Red were situated in different census tracts based on their community resilience levels. Among the Red-coded colonias, 30 of them were in tracts categorized as having Moderate community resilience, 141 were in tracts classified as Low, and 86 were in tracts marked as Very Low. Similarly, one colonia community with a Yellow code was found in a tract categorized as High community resilience, while thirty-one were situated in Moderate resilience tracts, 149 in Low, and 118 in Very Low. A similar trend was noticed for colonia communities coded as Green, with nine located in High community resilience tracts, 162 in Moderate, 564 in Low, and 531 in Very Low levels of community resilience (Table 3, Figure 6). The Red-coded colonias were predominantly located in tracts with Low and Very Low levels of community resilience (Figure 6).

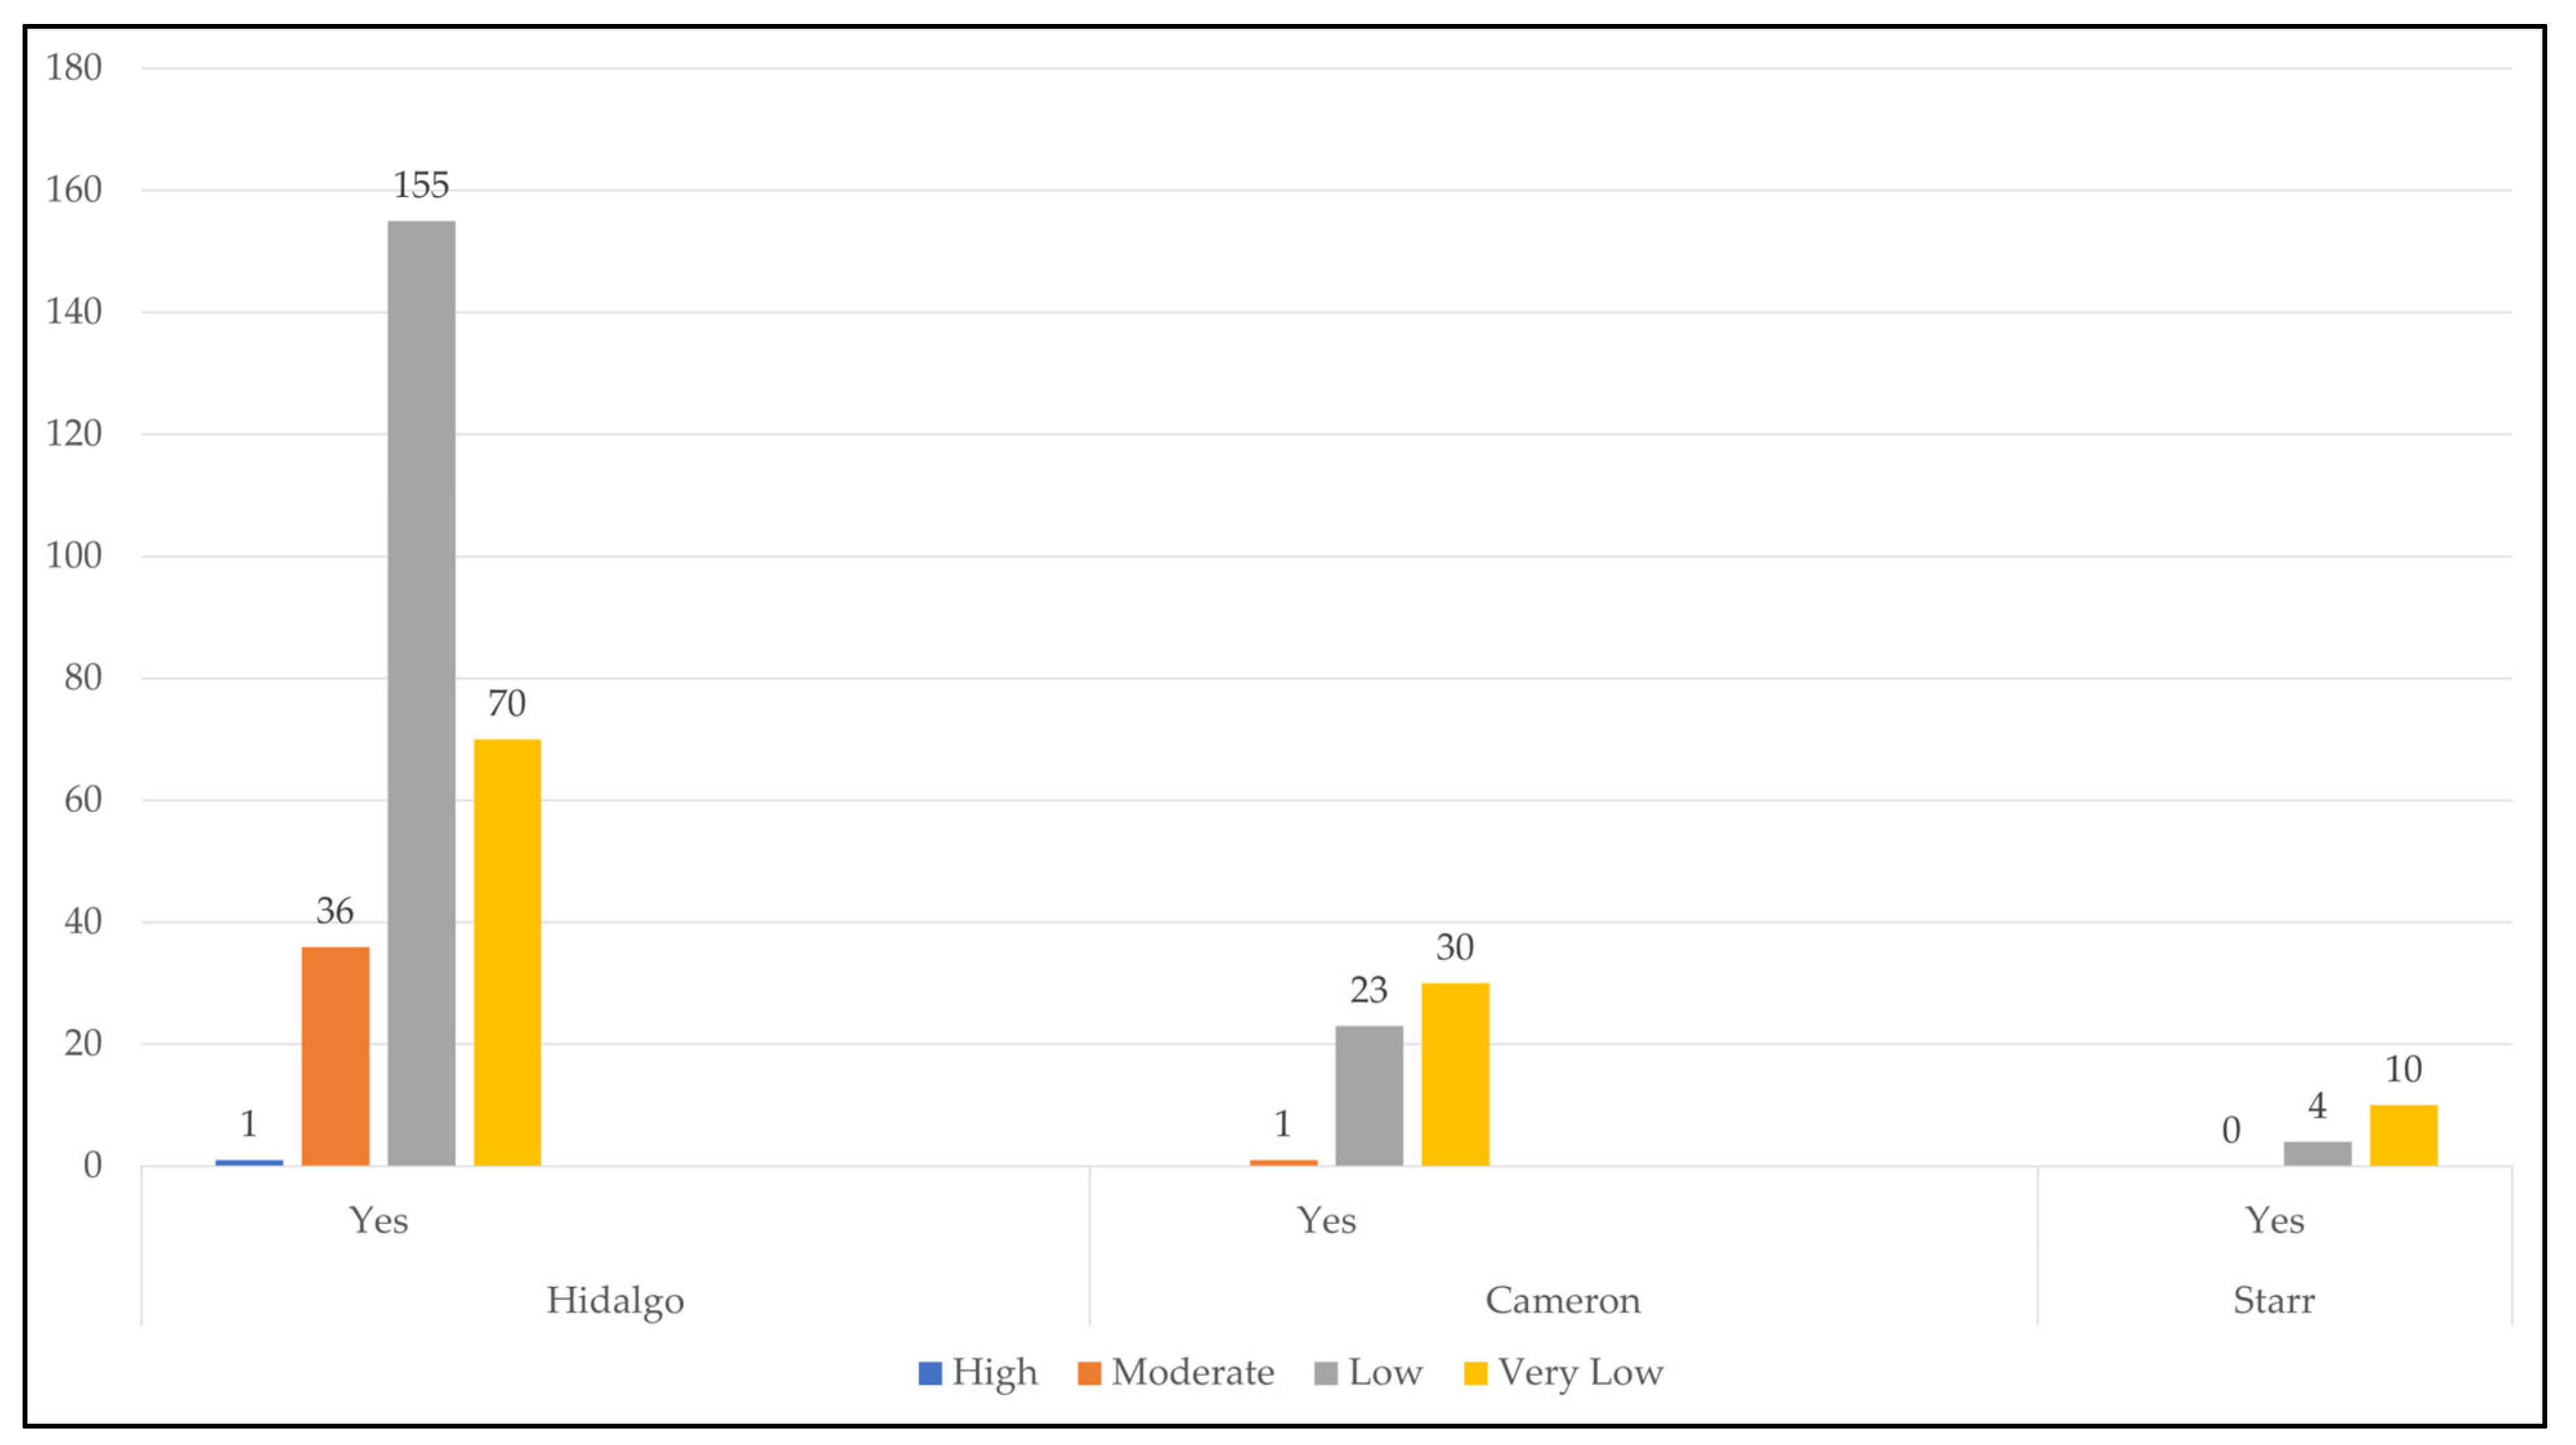
3.5. Colonias Affected by Flooding

Table 3 provides an overview of the spatial distribution of colonies, categorized by their location in floodplains and their history of flooding following rainfall events. These colonies are color-coded accordingly. The table also includes the corresponding community resilience levels, which are measured within the census tracts and categorized as Moderate, Low, and Very Low.
In the RGV, there are a total of 1266 colonias. Among them, 172 (14%) are in Cameron County, 846 (67%) are in Hidalgo County, 232 (18%) are in Starr County, and 16 (1%) are in Willacy County (Table 3). The estimated population residing in the RGV is 188,455, which accounts for approximately 14% of the total population of 1.37 million. The population distribution within the RGV is as follows: 16,582 in Cameron County, 40,439 in Hidalgo County, and 34,262 in Starr County; data for Willacy County were not available at the time of this study (Table 3). Out of the total 1226 colonias, only 30% (384) are incorporated.
Most of these communities, except for 17 colonia communities in Hidalgo County, demonstrated Low to Very Low levels of community resilience. Specifically, within Cameron County, among the 41 colonias categorized as Yellow color-coded communities, 46% (19) were in census tracts with a Low level of community resilience, while the remaining 54% (22) were situated in tracts marked with a Very Low level of community resilience (Table 3).
Similarly, within the Red color-coded communities, it was observed that 50% of the colonias were found in census tracts classified as having a Low level of community resilience, while 48% were in tracts categorized as Very Low in terms of community resilience. Comparable patterns were observed in Hidalgo County, where 63% of the Red-color-coded colonias were situated within areas characterized as having a Low level of community resilience, while 26% were in tracts classified as Very Low in terms of community resilience (Table 3).
Among the 1266 colonia communities in the RGV, a total of 249 (20%) were in flood-prone areas, as indicated by their placement within the floodplain. In Hidalgo County, out of the total 846 colonias, 201 (24%) were situated in floodplains. Similarly, in Cameron County, 33 (19%) out of 172 colonias were in flood-prone areas. In Starr County, 15 (6%) out of 232 colonias faced similar conditions, being situated in flood-prone regions (Table 3).
Additionally, out of the total 1266 colonias in the RGV, 330 (26%) had experienced flooding because of rainfall events (Table 3). In Hidalgo County, 262 (31%) out of 846 colonias had encountered flooding incidents, while in Cameron County, 54 (31%) out of 172 colonias had also experienced such events. In Starr County, 14 (6%) out of 232 colonias had observed instances of flooding (Figure 7).

4. Discussion

Firstly, the RGV hosts a total of 1266 colonia communities. The colonia communities in the RGV are inhabited by an estimated population of 188,455 residents, representing around half of the total colonia residents in the state of Texas. These individuals account for approximately 14% of the overall population in the valley, which totals 1.37 million people. Unfortunately, many of these residents, referred to as “forgotten Americans,” live in impoverished communities and face significant challenges. Despite being tax-paying American citizens, they often receive limited benefits or support from the government [22]. It is crucial to prioritize the improvement of their living conditions, as they are an integral part of the RGV community. In the pursuit of building community resiliency, it is essential to ensure that no one is left behind.
Secondly, out of the 1266 colonia communities, approximately 35% are classified as Green, 24% as Yellow, 20% as Red, and 21% as Unknown. These figures highlight that a significant portion of the colonias, constituting two-thirds of the total, continue to experience substandard living conditions, which poses significant public health risks to their residents. Moreover, when examining the distribution of these categories, it is evident that 88% of the total Green, 89% of the total Yellow, 88% of the total Red, and 78% of the total Unknown colonias are situated in tracts classified as either Low or Very Low community resiliency. Consequently, county officials cannot disregard the challenges faced by colonias while endeavoring to enhance community resiliency in the Valley.
Thirdly, from 2006 to 2023, the number of colonias categorized as Red has decreased by 19% in Hidalgo County and 17% in Cameron County. However, in Starr County, their counterpart communities have seen a 3% increase. Over the past 34 years, Texas legislators have made efforts to address these challenges through legal reforms [21]. The Texas Water Development Board (TWDB) has also invested substantial funding in infrastructure improvement projects, including over $531 million from FY2007 to FY2010 [24], $320 million from FY2011 to FY2014 [18], and $830 million in the Economically Distressed Areas Program (EDAP) [43]. However, the current evaluation highlights the need for further improvement and increased oversight and monitoring to expedite the development programs.
Fourthly, a significant observation revealed that 83% of all tracts are classified as having low or very low community resiliency. Out of the total 90 tracts categorized as having low community resiliency, 78% (70 tracts) are home to colonia communities. Similarly, out of the total 92 tracts classified as having very low community resiliency, 59% (54 tracts) host colonia communities. These data strongly suggest that neglecting the development of community resiliency in the colonia communities would hinder the overall objective of establishing community resiliency in the RGV. To strengthen community resiliency, several key tasks must be undertaken, including the development of economic resources, the reduction of risks and inequalities, and the addressing of social vulnerabilities within the community [31]. Enhancing community engagement and social infrastructure at the community level could lead to increased resilience to catastrophe [44].
Finally, in terms of the floodplain, approximately 24% of the colonia communities in Hidalgo County, 19% in Cameron County, and 6% in Starr County are located within it. Notably, one third of all colonia communities in Hidalgo and Cameron County encounter flooding incidents following rainfall. These communities are predominantly situated in census tracts characterized by low community resiliency. These findings emphasize the importance of addressing flooding issues in colonia communities as a vital step towards establishing disaster resilience in the Valley. An effective example of enhancing community resiliency is through the engagement of promotoras, who are community healthcare workers. They play a vital role in informing colonia families about health-related issues and connecting them to necessary resources, leading to the strengthening of healthcare access and the promotion of well-being within the colonias [7,45].

5. Conclusions

The study offers an overview of the colonias and their spatial distribution across the four counties that comprise the RGV. These colonia residents make up approximately 14% of the total population of 1.37 million and are distributed among 1226 colonia communities.
Among these communities, approximately 45% (Yellow and Red color-coded) lack access to essential infrastructure such as paved roads, adequate drainage, and solid waste disposal. Additionally, 21% (Red coded) face challenges in accessing basic necessities like potable water, adequate wastewater disposal, and legal plats. Furthermore, approximately 21% of the communities have unknown living conditions. Around 20% of the colonia communities are situated in flood-prone areas, and 26% of them have experienced flooding after rainfall events. Remarkably, 87% of the total colonias were observed in census tracts categorized as having either a Low or Very Low level of community resilience. Among the population residing in colonia communities, 93% (equivalent to 174,438 individuals) live in census tracts measured with a Low or Very Low community resilience, while only 1% reside in tracts with a High level of community resilience.
These individuals, estimated to be 188,455 in total, are often referred to as forgotten Americans. They are tax-paying citizens who receive limited government benefits, and a significant portion of them are veterans [22]. Due to their socioeconomic characteristics and living conditions, they are vulnerable to natural disasters common in the region as well as to communicable diseases such as cholera, diarrhea, dysentery, hepatitis A, and typhoid. Addressing the long-standing fundamental issues faced by the colonia communities is crucial for building community resilience in the RGV. Without tackling these challenges, achieving meaningful progress in community resilience becomes a daunting task. In this context, adopting an environmental justice perspective is essential. Environmental justice emphasizes the fair and equitable distribution of environmental benefits and burdens, with a particular focus on marginalized and disadvantaged communities.
This study contributes significantly to the current understanding of colonia communities in the RGV by highlighting four key aspects. Firstly, the study provides valuable geospatial data and statistics that are essential for building community resilience in the region. The geographical analyses conducted in this study offer important inputs and foundational knowledge for resilience-building efforts in the RGV. Secondly, the study presents a comprehensive portrayal of the colonias and their spatial distribution, offering valuable insights for stakeholders dedicated to improving the residents’ quality of life. By presenting statistical and geographical data, the study contributes significantly to the field of geography and sheds light on understudied regions known as colonias. Thirdly, the findings of the study evaluate the development efforts undertaken over the past decades by monitoring color-coded categories that indicate the susceptibility to public health risks. These geospatial data and statistics provide vital information for authorities and public health officials engaged in combating communicable diseases. Fourthly, this study addresses the flooding challenges faced by colonias and examines the resilience of their communities in dealing with such issues. Flooding is a major concern, particularly in the RGV, and the study’s insights contribute to a better understanding of the resilience levels and strategies implemented by colonia communities.
Overall, this study significantly enhances our knowledge of colonia communities in the RGV, provides geospatial data and insights into their spatial distribution, evaluates development efforts, and examines their resilience in the face of flooding challenges.

Funding

This research received no external funding.

Acknowledgments

The author would like to thank the Texas Secretary of State Office for providing the Colonia Geodatabase to conduct the study.

Conflicts of Interest

The author declares no conflict of interest.

References

  1. Paxton, K. Colonias. Available online: https://www.texasattorneygeneral.gov/divisions/colonias (accessed on 30 May 2023).
  2. Zoe, R.D. The Forgotten Americans: A Visual Exploration of Lower Rio Grande Valley Colonias. Mich. J. Sustain. 2014, 2, 12. [Google Scholar] [CrossRef] [Green Version]
  3. Paxton, K. Colonias Terms. Available online: https://www.texasattorneygeneral.gov/divisions/colonias-prevention/colonias-terms (accessed on 30 May 2023).
  4. TDHCA. Background on the Colonias. Available online: https://www.tdhca.state.tx.us/oci/background.htm (accessed on 30 May 2023).
  5. García, M.-C. Colonia. Available online: https://www.tshaonline.org/handbook/entries/colonia (accessed on 30 May 2023).
  6. The Housing Resource Center. State of Texas Low Income Housing Plan and Annual Report; Texas Department of Housing and Community Affairs. Available online: https://www.tdhca.state.tx.us/housing-center/docs/23-SLIHP.pdf (accessed on 30 May 2023).
  7. Barton, J.; Perlmeter, E.R.; Blum, E.S.; Marquez, R.R. Las Colonias in the 21st Century: Progress Along the Texas-Mexico Border; Community Development; Federal Reserve Bank of Dallas: Dallas, TX, USA, 2015; p. 33.
  8. Galan, H. The Forgotten Americans; Galan Productions, Inc.: Austin, TX, USA, 2000; 57 minutes. [Google Scholar]
  9. Jaime, C. The Forgotten Americans: A Voice for Colonia Residents. Child. Youth Environ. 2005, 15, 319–331. [Google Scholar]
  10. Schoolmaster, F.A. Free Trade and the Environment: A Case Study of the Texas Colonias. Great Plains Res. 1993, 3, 321–335. [Google Scholar]
  11. Parcher, J.W.; Humberson, D.G. CHIPS: A New Way to Monitor Colonias Along the United States-Mexico Border; U.S. Department of the Interior, and U.S. Geological Survey. Available online: https://pubs.usgs.gov/of/2007/1230/pdf/OFR2007-1230.pdf (accessed on 30 May 2023).
  12. Matthiesen, J. What Now for the Texas Colonias. New Mex. Law Rev. 1997, 27, 1. [Google Scholar]
  13. Wutich, A.; Jepson, W.; Velasco, C.; Roque, A.; Gu, Z.N.; Hanemann, M.; Hossain, M.J.; Landes, L.; Larson, R.; Li, W.W.; et al. Water insecurity in the Global North: A review of experiences in U.S. colonias communities along the Mexico border. Wiley Interdiscip. Rev. Water 2022, 9, e1595. [Google Scholar] [CrossRef]
  14. Zheng, M.; Wutich, A.; Brewis, A.; Kavouras, S. Health impacts of water and sanitation insecurity in the Global North: A scoping literature review for US colonias on the Mexico border. J. Water Health 2022, 20, 1329–1342. [Google Scholar] [CrossRef]
  15. Castaneda, H. The Colonias Reader: Economy, Housing, and Public Health in US-Mexico Border Colonias. J. Lat. Am. Caribb. Anthropol. 2016, 21, 203–204. [Google Scholar] [CrossRef]
  16. Mroz, R.C.; Morales, L.L.; VanDerslice, J. Health and hygiene in the Colonias: Water and disease. Fam. Community Health 1996, 19, 49–58. [Google Scholar] [CrossRef]
  17. Manusov, E.G.; De Ziegler, C.G.; Diego, V.P.; Munoz-Monaco, G.; Williams-Blangero, S. Frailty Index in the Colonias on the US-Mexico Border: A Special Report. Front. Med. 2021, 8, 650259. [Google Scholar] [CrossRef]
  18. Millikan, D.M.Y.; Falk, D.; Giberson, T.; Zaia, A.; Niemeyer, S.M.; Cabello, H.; Laing, G.; Loewe, M.; Cho, Y.; Entsminger, T.; et al. 84the Texas Legislature Regular Session: Tacing the Progress of State-Funded Projects that Benefit Colonias; Texas Office of the Secretary of State Colonia Initiatvies Program. 2014. Available online: https://www.sos.state.tx.us/border/forms/2014-progress-legislative-report.pdf (accessed on 30 May 2023).
  19. Rivera, D.Z.; Chrisafis, D.; Julien, K. Colonia Flooding: An Institutional Analysis for the Lower Rio Grande Valley; Just Environments Lab; University of California Berkeley: Berkeley, CA, USA, 2022. [Google Scholar]
  20. Belury, L. Poco a Poco: Post-Flood Survival in the Colonias of the Rio Grande Valley. Geogr. Rev. 2022, 1–18. [Google Scholar] [CrossRef]
  21. Paxton, K. Colonias Prevention Laws. Available online: https://www.texasattorneygeneral.gov/divisions/colonias-prevention/colonias-prevention-laws (accessed on 30 May 2023).
  22. Lewis, C. Texas Colonias: Injustice by Definition. Environ. Earth Law J. 2015, 5, 163–189. [Google Scholar]
  23. Williams, R. Final Report in Response to Senate Bill 827 by Senator Judith Zaffirini and Representative Ryan Guillen 79th Regular Session, Texas Legislature: Tracking the Progress of State-Funded Projects that Benefit Colonias; The Colonia Initiatives Program of the Office of Texas Secretary of State: Online, 2006. Available online: https://www.sos.state.tx.us/border/forms/sb827_111706.pdf (accessed on 30 May 2023).
  24. The Colonia Initiatives Program. Senate Bill 99, 82nd Texas Legislature, Regular Session: Tracking the Progress of State Funded Projects that Benefits Colonias. 2010. Available online: https://www.sos.state.tx.us/border/forms/reports-11/sb-99-progress.pdf (accessed on 30 May 2023).
  25. Yoon, D.K. Assessment of social vulnerability to natural disasters: A comparative study. Nat. Hazards 2012, 63, 823–843. [Google Scholar] [CrossRef]
  26. Cutter, S.L.; Boruff, B.J.; Shirley, W.L. Social Vulnerability to Environmental Hazards. Soc. Sci. Q. 2003, 84, 242–261. [Google Scholar] [CrossRef]
  27. Ruin, I.R.; League, C.; Hayden, M.; Goldsmith, B.; Estupiñán, J. Differential Social Vulnerability and Response to Hurricane Doly across the US-Mexico Border. HAL CCSD; 2008. Available online: https://www.weather.gov/media/bro/research/pdf/Hurricane_Dolly_AMSannual2009_Final.pdf (accessed on 30 May 2023).
  28. UNDRR. Sendai Framework Terminology on Disaster Risk Reduction. Available online: https://www.undrr.org/terminology/resilience (accessed on 30 May 2023).
  29. FEMA. Community Resilience. Available online: https://hazards.fema.gov/nri/community-resilience (accessed on 30 May 2023).
  30. Chandra, A.; Acosta, J.; Howard, S.; Uscher-Pines, L.; Williams, M.; Yeung, D.; Garnett, J.; Meredith, L.S. Building Community Resilience to Disasters: A Way Forward to Enhance National Health Security. Rand Health Q. 2011, 1, 6. [Google Scholar] [PubMed]
  31. Norris, F.H.; Stevens, S.P.; Pfefferbaum, B.; Wyche, K.F.; Pfefferbaum, R.L. Community resilience as a metaphor, theory, set of capacities, and strategy for disaster readiness. Am. J. Community Psychol. 2008, 41, 127–150. [Google Scholar] [CrossRef]
  32. Tavares, L.P.; Luis, S.; Henriques, J.; Marujo, H.A.; Goncalves, S.P.; Rivero, C. Responding to everyday problems and crises: Measuring community resilience. J. Community Psychol. 2023, 51, 1560–1570. [Google Scholar] [CrossRef]
  33. Paxton, K. Texas Colonia Communities; Office of the Attorney General of Texas: Austin, TX, USA, 2022; Volume 2022.
  34. U.S. Census Bureau. Community Resilience Estimates Datasets; U.S. Census Bureau: Washington, DC, USA, 2021. Available online: https://www.census.gov/programs-surveys/community-resilience-estimates.html (accessed on 30 May 2023).
  35. Saaty, T.L. The Analytic Hierarchy Process; McGraw-Hill: New York, NY, USA, 1980. [Google Scholar]
  36. Saaty, T.L. Decision making—The Analytic Hierarchy and Network Processes (AHP/ANP). J. Syst. Sci. Syst. Eng. 2004, 13, 1–35. [Google Scholar] [CrossRef]
  37. Morales, F.F.; de Vries, W.T. Establishment of Natural Hazards Mapping Criteria Using Analytic Hierarchy Process (AHP). Front. Sustain. 2021, 2, 667105. [Google Scholar] [CrossRef]
  38. Alshehri, S.A.; Rezgui, Y.; Li, H.J. Disaster community resilience assessment method: A consensus-based Delphi and AHP approach. Nat. Hazards 2015, 78, 395–416. [Google Scholar] [CrossRef]
  39. Lee, M.-H.; Cheon, D.-Y.; Han, S.-H. An AHP analysis on the habitability performance toward the modernized hanok in Korea. Buildings 2019, 9, 177. [Google Scholar] [CrossRef] [Green Version]
  40. Zhang, J.; Chen, Y. Risk assessment of flood disaster induced by typhoon rainstorms in Guangdong province, China. Sustainability 2019, 11, 2738. [Google Scholar] [CrossRef] [Green Version]
  41. Beiragh, R.G.; Alizadeh, R.; Kaleibari, S.S.; Cavallaro, F.; Zolfani, S.H.; Bausys, R.; Mardani, A. An integrated multi-criteria decision making model for sustainability performance assessment for insurance companies. Sustainability 2020, 12, 789. [Google Scholar]
  42. Hodicky, J.; Özkan, G.; Özdemir, H.; Stodola, P.; Drozd, J.; Buck, W. Analytic Hierarchy Process (AHP)-Based Aggregation Mechanism for Resilience Measurement: NATO Aggregated Resilience Decision Support Model. Entropy 2020, 22, 1037. [Google Scholar] [CrossRef] [PubMed]
  43. TWDB. Economically Distressed Areas Program 1 September 2021–31 August 2022; Texas Water Development Board: Austin, TX, USA, 2022.
  44. Aldrich, D.P.; Meyer, M.A. Social Capital and Community Resilience. Am. Behav. Sci. 2015, 59, 254–269. [Google Scholar] [CrossRef]
  45. Tillett, T. Beyond the Bench: Promoting Health in Texas Colonias. Environ. Health Perspect. 2005, 113, A454–A455. [Google Scholar] [CrossRef] [Green Version]
Figure 1. This map depicts the spatial arrangement of colonias in the RGV, with a higher concentration of these communities observed in Hidalgo County. Data source: the Texas Secretary of State’s Texas Colonia Community Database [33].
Geographies 03 00024 g001
Figure 2. This figure shows aerial views of selected colonia communities in the Rio Grande Valley.
Geographies 03 00024 g002
Figure 3. This bar chart shows the distribution of color-coded colonias in Hidalgo, Cameron, and Starr County. Note: Color coding for the colonias in Willacy County was not available.
Geographies 03 00024 g003
Figure 4. Color-coded colonias in four study periods, 2006, 2010, 2014, and 2023.
Geographies 03 00024 g004
Figure 5. Color-coded colonias (Green, Yellow, Red, and Unknown) and their host census tracts with varying levels of community resilience (High, Moderate, Low, and Very Low) in the Rio Grande Valley. (Note: There is no tract in the Very High category in the RGV).
Geographies 03 00024 g005
Figure 6. Color-coded colonias in the different levels of community resiliency.
Geographies 03 00024 g006
Figure 7. Color-coded colonias with flooding after rain in the Rio Grande Valley.
Geographies 03 00024 g007
Table 1. Texas Colonia Health-Risk Classification System.
GreenYellowRedUnknown
Portable waterYesYesNo-
Adequate wastewater disposalYesYesNo-
Legal platsYesYesNo-
Adequate paved roadsYesNo--
Adequate drainageYesNo--
Solid waste disposalYesNo--
Source: Office of the Secretary of State, 2010, 2014 [7,18].
Table 2. Community Resilience Estimate (CRE) variables and their association with community resilience and weights used to construct a composite index of community resilience.
FactorsCommunity Resilience EstimateIndicatorMeasurementAssociation with CREWeights
1aIncome
Inequality
Gini Index of income inequality0, indicating perfect equality (where everyone receives an equal share), to 1, perfect inequality (where only one recipient or group of recipients receives all the income)Negative5%
1bPovertyPopulation living under the poverty levelPercentage of the population whose income in the past 12 months is below the poverty levelNegative5%
2aSex—FemaleFemale populationPercentage of households with a female householder, no spouse/partner present, with own children of household under 18 yearsNegative5%
2bSex—MaleMale populationPercentage of households with a male householder, no spouse/partner present, with own children of household under 18 yearsNegative5%
3Housing
Occupancy
Housing occupancy ratePercentage of occupied housing units with 1.51 occupants or more per roomNegative10%
4aEducational AttainmentPopulation with high school graduatePercentage of population 25 and over—high school graduate or higherPositive5%
4bEmployment Working full time Percentage of the population 16 to 64 years who worked full time, year-round. Full-time year-round workers are defined as all people 16 years old and over who usually worked 35 h or more per week for 50 to 52 weeks in the past 12 monthsPositive5%
5English
Proficiency
Speaks English less than very wellPercentage of the population 5 years and over that speaks a language other than English and speaks English less than “very well”Negative10%
6DisabilityPeople with a disabilityPercentage of civilian noninstitutionalized population with a disabilityNegative10%
7Age65 years or olderPercentage of the population 65 years and overNegative10%
8Health
Insurance
Population with no health insurancePercentage of civilian noninstitutionalized population with no health insurance coverageNegative10%
9Vehicle
Access
Population with no vehicles availablePercentage of occupied housing units with no vehicles availableNegative10%
10Internet
Access
Population with no Internet accessPercentage of households with a broadband Internet subscriptionPositive10%
Table 3. The spatial distribution of colonias, their color-coded status based on their geographic location in floodplains, their flooding experience following rainfall events, and their corresponding color-coded status. Additionally, this table includes information about the community resiliency levels associated with these colonias.
CountyCameron Hidalgo Starr Willacy RGV
I. Community Resilience IndexMLVLTotalHMLVLTotalMLVLTotalLVLTotalTotal
1. The overall count of colonias1819017291313993078463078124232610161266
 The percentage of total colonias within the county0.6%47.1%52.3%100%1%15%47%36%100%13%34%53%100%38%63%100%
2. The total count of census tracts within the county7334686424493611325815325219
3. Total population in all census tracts in the RGV36,304192,024193,449421,77741,040188,23838,1046253,700864,024499519,36139,65764,01310,564753618,1001,367,914
4. The total tracts within the county that contain colonias115173331747279425815325147
5. Total population residing in census tracts including colonias5503108,20197,319211,02330,840153,331360,621220,049764,841499519,36139,65764,01310,564753618,1001,057,977
6. The estimated total population residing in colonias12124,14423,01347,27832910,18757,87638,523106,915338010,99719,88534,262...188,455
 The percentage of total population residing in colonias2%22%24%22%1%7%16%18%14%68%57%50%54%...14%
7. Total estimated lots in the colonias596566995716,582644474918,89416,15240,43911114272818113,564473813128671,871
 The percentage of the total lots within the county in colonias0%40%60%100%2%12%47%40%100%8%31%60%100%1%1%2%100%
8. Total number of colonias incorporated11020312841051062970173956000384
 The percentage of the total colonias that are incorporated3%32%65%100%6%271%339%342%958%0%55%126%181%0%0%0%30%
II. SB827 Color Classification
1. Green042499143610711626312216194000448
 Percentage of the county total0%46%54%100%2%14%41%44%100%13%22%65%100%0%0%0%100%
2. Yellow019224113012372226172432000299
 Percentage of the county total0%46%54%100%0%13%54%32%100%3%22%75%100%0%0%0%100%
3. Red12019400127129112175038105000257
 Percentage of the county total3%50%48%100%0%11%63%26%100%16%48%36%100%0%0%0%100%
4. Unknown00004539790244001161016261
 Percentage of the county total0%0%0%0%2%22%40%37%100%0%0%100%100%2%4%6%100%
III. In flood plain
1. Yes013203311711964201051015000249
 Percentage of the county total0%39%61%100%0%8%59%32%100%0%33%67%100%0%0%0%100%
2. No167701384591741503873073113216000741
 Percentage of the county total1%49%51%100%1%15%45%39%100%14%34%52%100%0%0%0%100%
3. Partial01010000000000001
 Percentage of the county total0%100%0%100%0%0%0%0%0%0%0%0%0%0%0%0%100%
4. Unknown0000028313000000013
 Percentage of the county total0%0%0%0%0%15%62%23%100%0%0%0%0%0%0%0%100%
IV. Flood after rainfall
1. Yes123305413615570262041014000330
 Percentage of the county total2%43%56%100%0%14%59%27%100%0%29%71%100%0%0%0%100%
2. No057591164401411423273074111215000658
 Percentage of the county total0%49%51%100%1%12%43%43%100%14%34%52%100%0%0%0%100%
3. Partial01120001100220005
 Percentage of the county total0%50%50%100%0%0%0%100%100%0%0%100%100%0%0%0%100%
4. Unknown0000025411000000011
 Percentage of the county total0%0%0%0%0%18%45%36%100%0%0%0%0%0%0%0%100%
Disclaimer/Publisher’s Note: The statements, opinions and data contained in all publications are solely those of the individual author(s) and contributor(s) and not of MDPI and/or the editor(s). MDPI and/or the editor(s) disclaim responsibility for any injury to people or property resulting from any ideas, methods, instructions or products referred to in the content.

