Article

Comparison of Different Dielectric Models to Estimate Penetration Depth of L- and S-Band SAR Signals into the Ground Surface

1
Fluvial Geomorphology and Remote Sensing Laboratory, Department of Earth and Environment Sciences, Indian Institute of Science Education and Research Bhopal, Bhopal 462066, Madhya Pradesh, India
2
Department of Photogrammetry and Remote Sensing, Indian Institute of Remote Sensing, ISRO, Dehradun 248001, Uttarakhand, India
*
Author to whom correspondence should be addressed.
Geographies 2022, 2(4), 734-742; https://doi.org/10.3390/geographies2040045
Submission received: 20 September 2022 / Revised: 14 November 2022 / Accepted: 22 November 2022 / Published: 28 November 2022
(This article belongs to the Special Issue Feature Papers of Geographies in 2022)

Abstract

:
We evaluate the penetration depth of synthetic aperture radar (SAR) signals into the ground surface at different frequencies. We applied dielectric models (Dobson empirical, Hallikainen, and Dobson semi-empirical) on the ground surface composed of different soil types (sandy, loamy, and clayey). These models result in different penetration depths for the same set of sensors and soil properties. The Dobson semi-empirical model is more sensitive to the soil properties, followed by the Hallikainen and Dobson empirical models. We used the Dobson semi-empirical model to study the penetration depth of the upcoming NASA-ISRO synthetic aperture radar (NISAR) mission operated at the L-band (1.25 GHz) and the S-band (3.22 GHz) into the ground. We observed that depending upon the soil types, the penetration depth of the SAR signals ranges between 0 to 10 cm for the S-band and 0 to 25 cm for the L-band.

1. Introduction

Penetration depth of microwave synthetic aperture radar (SAR) pulses into the ground surface depends on the sensors (i.e., wavelength, incident angle) and target properties (i.e., dielectric properties of soil, soil types) [1,2,3]. The sensor properties are fixed for a specified space mission. The target properties are dynamic and may change in response to the soil moisture content, soil types, grain size, and surface roughness. The target properties of a bare land surface include soil texture, bulk density, and soil moisture. Together, these soil parameters define the soil permittivity. To assess the interlinking between soil permitivity and the penetration depth of SAR pulses, we performed a bibliometric analysis (Figure 1). We used four metrics (i.e., items, clusters, links, and total link strength) to quantify the linkage. With items = 570, Clusters = 22, Links = 9776, and Total link strength = 10,245, we found that soil moisture estimated from microwave images emerged as an essential linkage between soil permittivity and penetration depth of SAR pulses into the soil. The moisture content determines the dielectric values and penetration depth of SAR signals into the ground.
Several empirical and semi-empirical models have been proposed to evaluate the permittivity at different microwave frequencies of the electromagnetic spectrum (EM). Dobson et al. [4] proposed an empirical relation for estimating the real and imaginary part of the complex permittivity. They established a relationship that relates complex permittivity to soil texture and moisture at two discrete frequencies (i.e., 1.4 and 5 GHz). Later, Hallikainen et al. [5] proposed a modified empirical relation to estimate the soil permittivity. Although Hallikainen model covers a large range of the radio detection and ranging system (RADAR) band (ranging from 1.4 to 18 GHz), it is valid only for nine discrete sets of frequencies. Recently, Singh et al. [6] reported that Dobson empirical and Hallikainen models produce inconsistent results with the same set of parameters. This could be due to the fact that the empirical relationships are generally site-specific and vary greatly on the local soil parameters [7]. Additionally, they have observed that the Hallikainen model is more sensitive to soil parameters and is widely used to compute permittivity [8,9,10]. The Hallikainen model involves an approximation of the frequencies that do not coincide with nine discrete frequencies [9]. This approximation introduces an error in estimating the complex permittivity of soil.
The Dobson and Hallikainen empirical models are site-specific and valid only for a certain discrete set of microwave frequencies. To overcome these limitations, Dobson et al. [11] proposed a semi-empirical dielectric model that relates complex permittivity with more soil parameters such as bulk density, specific density, soil moisture, effective conductivity, etc. This model is valid for continuous frequencies ranging from 1.4 GHz to 18 GHz. Later, Peplinski et al. [12] extended this model for a frequency range 0.3–1.3 GHz; it can be used for almost all space missions. Moreoever, this model can be used to minimise the approximation error in the estimation of complex permittivity.
NASA-ISRO synthetic aperture radar (NISAR) mission is a joint venture of the Indian Space Research Organization (ISRO) and the National Aeronautics and Space Administration (NASA); it is scheduled to be launched in January 2024. The satellite will be the first radar-imaging satellite to use dual frequencies ( L : 1.25 GHz- and S : 3.20 GHz) that will record fully polarimetric images, with a swath >240 km and an incident angle between 33 and 47 [13,14]. The synergic use of L- and S-band imaging will be useful to estimate depth-dependent soil moisture and eliminate the soil moisture phase noise [15,16,17,18,19]. The availability of L-band SAR will enable deeper penetration of microwave pulses into the ground as compared to the lower wavelength such as the C-band [20].
This study aims to investigate the impact of soil moisture content, incidence angle, and soil texture on the depth to which microwave signals can penetrate the ground surface. We employ the Dobson semi-empirical model to estimate the penetration capability of the proposed L- and S-band SAR sensors of the upcoming NISAR mission into the ground.

2. Theoretical Background and Methodology

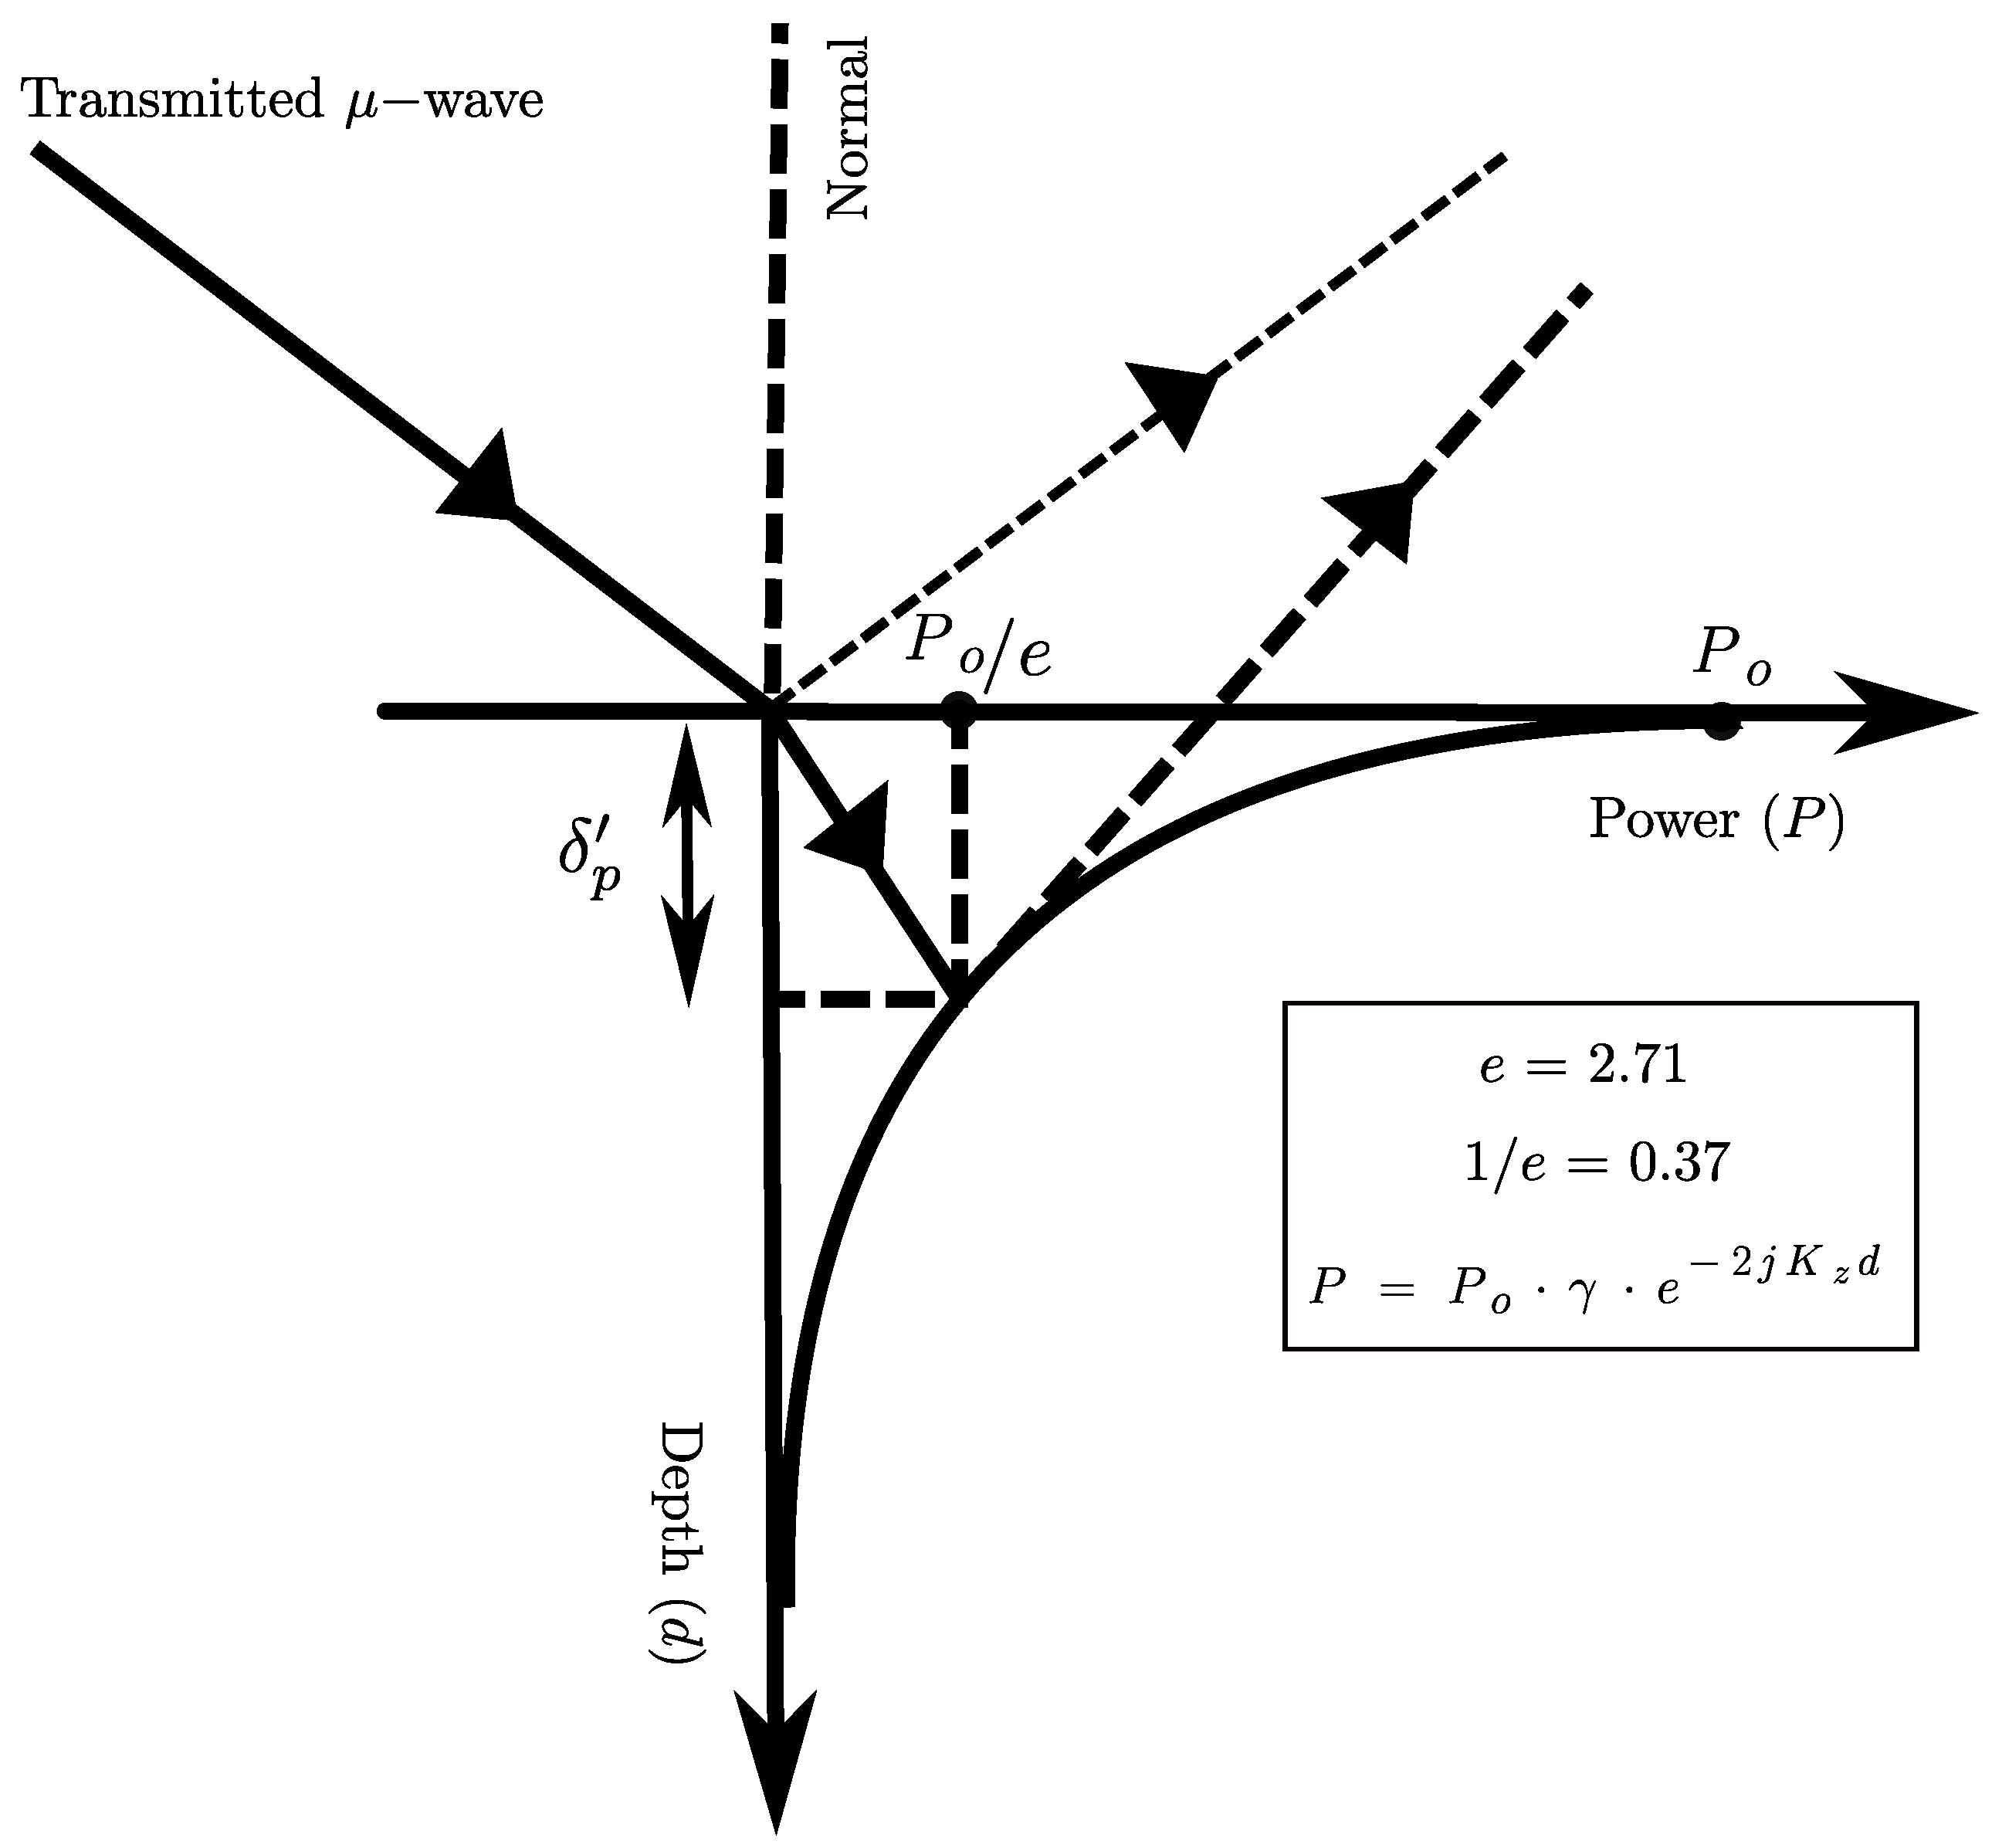
2.1. Penetration Depth and Its Dependency

Depending on the properties, soil can be broadly classified into homogeneous (uniform properties with depth) and heterogeneous (varying properties with depth). For the sake of simplicity in deriving the equation for penetration depth, we assume homogeneous soil in this study. The airborne or satellite SAR emits microwave pulses towards the Earth’s surface that interact with the surface soil. The power of the microwave pulses is represented by ( P ) and can be computed at a particular depth, d, from Equation (1);
P = P o · γ · e 2 j K z d
where j is the complex number, γ is the transitivity near the interface of air–soil, and P o is the incident power of the microwave SAR pulses. K z is the zth component of wave number, which is given by Equation (2).
K z = ω 2 μ ϵ 0 ϵ 1 K 0 2 s i n 2 θ i
where θ i is the local incident angle of the microwave SAR pulse at the interface, ω represents the angular frequency, K 0 represents the wave number (given by 2 π / λ ), ϵ 0 is the permittivity of free air, ϵ 1 is the relative dielectric constant, μ 1 = μ 0 is the magnetic permeability.
In active conditions, the penetration depth is a two-way propagation of microwave pulses, whereas in the passive condition, it is the one-way propagation of the EM signal [21]. We have considered an active situation in this study (Figure 2). In air, the transmitted microwave pulse has power P o . When a microwave pulse interacts with the air–soil interface, a portion of it gets reflected in the air before penetrating into the soil. As a result, its power starts decaying exponentially. The depth at which the power reduces to 1 / e = ( 0.37 ) (i.e., 37 % ) of the incident power that determines the penetration depth of microwave signals into the ground [22]. Thus, the penetration depth can be computed from Equation (3).
δ p δ p · c o s θ i
where δ p is given by
δ p = λ · ϵ 2 π · ϵ
where δ p and λ are both in millimeters. ϵ and ϵ are the real and imaginary part of the complex permittivity, respectively. Theoretically, the permittivity of dry soil (∼2–3) and water (∼80) [22,23]. Depending on the moisture content in soil samples, their permeability value should be between the permittivity of dry soil and water. The penetration depth of microwave pulses ( δ p ) depends on sensor parameters ( λ , θ i ) and soil parameters ( ϵ ). In the proceeding sections, we have discussed the dielectric models used to compute complex permittivity at different frequency microwave pulses.

2.2. Dobson Empirical Model

Dobson et al. [4] developed a dielectric mixing model based on the empirical equation, which is given by Equation (5), that relates the soil permittivity and the volumetric water content (VWC) of the soil.
ϵ = a 0 + ( a 1 + b 1 S + c 1 C ) w + ( a 2 + b 2 S + c 2 C ) w 2 + ( a 3 + b 3 S + c 3 C ) w 3
where S and C are the percentage of sand and clay, respectively; w is the VWC of soil in [ m 3 / m 3 ]; and a 0 , a 1 , a 2 , b 1 , b 2 , b 3 , c 1 , c 2 , and c 3 are the calibrated constants and are calibrated for the real ( ϵ ) and imaginary part ( ϵ ) of the complex permittivity at two discrete sets of frequencies (L-band (i.e., 1.4 GHz) C-band (i.e., 5 GHz)). This model is valid only for two discrete microwave frequencies.

2.3. Hallikainen Empirical Model

To overcome the limitations of Dobson’s empirical model, Hallikainen et al. [5] proposed a dielectric mixing model based on the quadratic polynomial fitting, which is given by Equation (6). This computes the complex permittivity of soil by incorporating the textural composition. The coefficients in Equation (6) are calibrated for the nine discrete set of frequencies covering the entire RADAR band ranging from (14, 16, and 18 GHz, Ku-band), (10 and 12 GHz, X-band), (6 and 8 GHz, C-band), (4 GHz, S-band), and (1.4 GHZ, L-band).
ϵ = ( a 0 + a 1 S + a 2 C ) + ( b 0 + b 1 S + b 2 C ) w + ( c 0 + c 1 S + c 2 C ) w 2
The constants ( a 0 , a 1 , a 2 , b 1 , b 2 , b 3 , c 1 , c 2 , and c 3 ) are calibrated for the real and the imaginary part of the complex permittivity at frequencies ( 1.4 GHz to 18 GHz).
This model is more generalized than the Dobson empirical model as it provides a quantitative conversion equation between the soil permittivity and soil moisture for a range of frequencies. Both the Dobson and Hallikainen empirical models are valid if the moisture content is less than 50% in the soil [24].

2.4. Dobson Semi-Empirical Model

Dobson et al. [11] proposed a semi-empirical model that provides the dielectric mixing model for a continuous set of microwave frequencies. They used permittivity measurements for five different soil types using a wave-guide dielectric constant measuring system and free-space spread technology. Their model provides a relationship between complex permittivity and volumetric moisture content that is valid for a continuous set of frequencies ranging from 1.4–18 GHz. The Dobson semi-empirical model reads according to Equations (7) and (8);
ϵ = [ 1 + ( ρ b ρ s ) ( ϵ s α ) + w β ϵ f w α w ] 1 α
ϵ = [ w β ϵ f w ] 1 ¯ α
where α = 0.65 is an empirical constant, and β and β is the soil type dependent empirical constants whose values can be obtain from Equations (9) and (10).
β = 1.2748 0.519 S 0.152 C
β = 1.33797 0.603 S 0.166 C
S and C represent the fraction of sand and clay in the soil, ρ s = 2.66 g/cm 3 is the specific density of the soil particles, ρ b is the bulk density in g / c m 3 , w is the volumetric moisture content (in %), and ϵ s = (∼3–5) is the relative permittivity of soil particles. The ϵ s can be estimated from Equation (11);
ϵ s = ( 1.01 + 0.44 ρ s ) 2 0.062
The terms ϵ f w and ϵ f w represent the real and imaginary parts of the relative complex permittivity of free water, derived from the Debye-type dispersion equation. This equation is modified later to incorporate the effective conductivity of the soil using Equations (12) and (13).
ϵ f w = ϵ w + ϵ w o ϵ w 1 + ( 2 π f τ w ) 2
ϵ f w = 2 π f τ w ( ϵ w o ϵ w ) 1 + ( 2 π f τ w ) 2 + σ e f f ( ρ s ρ b ) 2 π ϵ o f ( ρ s w )
where τ w is the relaxation time for water, and its value at room temperature is given by 2 π τ w = 0.58 × 10 10 . ϵ w o = 80.1 . ϵ o is the permittivity of free space, f is the operational frequency in hertz, ϵ w o is the static dielectric constant for water, and the high-frequency limit of ϵ f w is denoted by ϵ w = 4.9 . Equation (14) can be used to compute the effective conductivity.
σ e f f = 1.645 + 1.939 ρ b 2.25622 S + 1.594 C
As discussed before, the Dobson semi-empirical model is valid only for the frequencies range between 1.4 and 18 GHz. Further modifications in this model have been proposed by Peplinski et al. [12] to make it valid for the lower frequencies range between 0.3 and 1.3 GHz. The modifications proposed by Peplinski et al. [12] involve a linear correction to ϵ and the value of effective conductivity according to Equations (15) and (16)
ϵ 0.3 1.3 G H z = 1.156 ϵ 0.68
σ e f f = 0.0467 + 0.2204 ρ b 0.4111 S + 0.6614 C

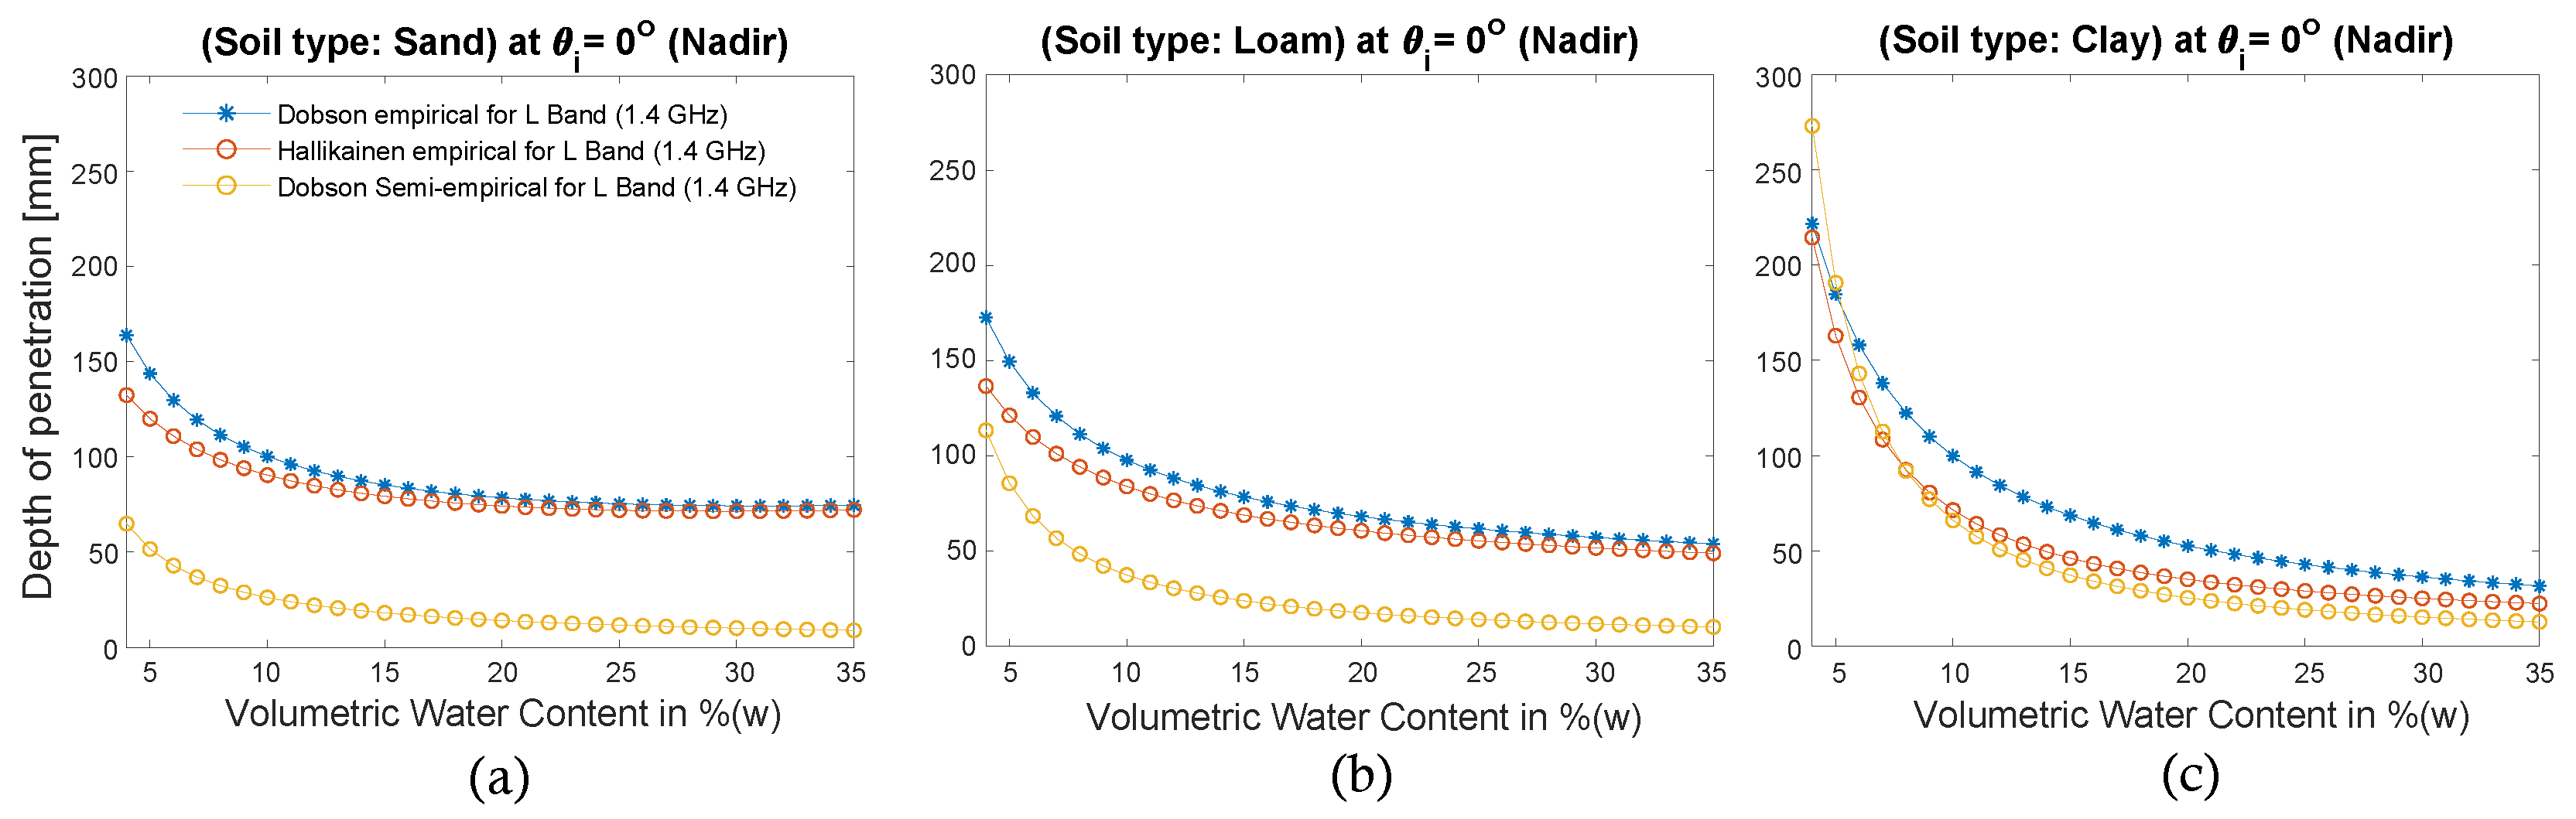
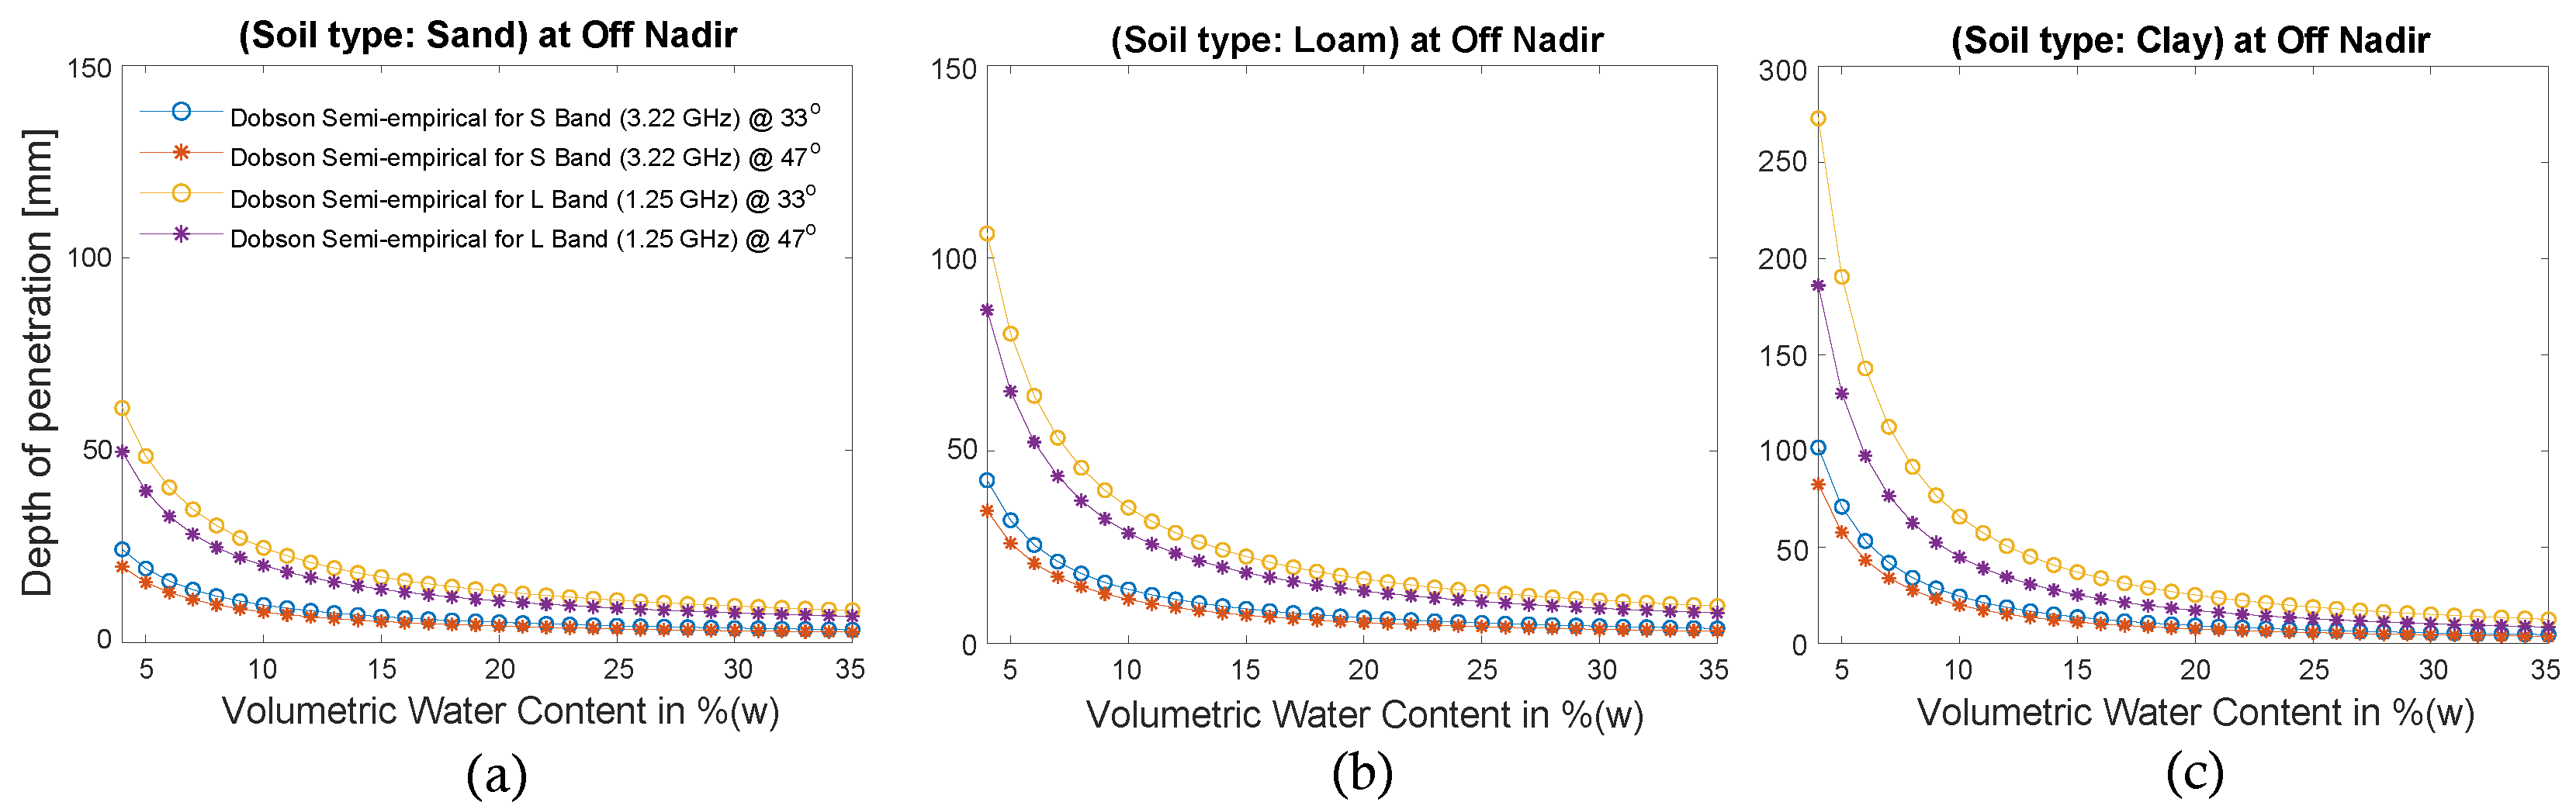
3. Results and Discussion

We compared the penetration depth of microwave pulses into the ground by using Dobson empirical, Hallikainen empirical, and Dobson semi-empirical models. We have critically analysed the limitation of these models. Finally, we used the Dobson semi-empirical model to estimate the penetration depth of L and S frequency bands of the proposed NISAR mission into the ground. We have used the in-situ soil samples from Al Minufya (sandy soil, N = 10) and Beheira (loamy and clayey soil, N = 11) Governorate, Egypt, to model the penetration depth of the NISAR mission frequency bands at different incident angles. We have selected this textural information as it contains all the possible compositions of soil samples. A delicate auger was used to collect soil samples from the soil soaking volume every 10 cm in both the horizontal and vertical directions. Table 1 reports the average physical properties of the soil samples [25].
To compare the result of all three dielectric models (Dobson empirical, semi-empirical, and Hallikainen empirical), we need to use them at a common frequency. The only common frequency at which these models are valid is 1.4 GHz [4,5,11]. Hence, we computed the penetration depth at 1.4 GHz using all three models and plotted the penetration depth as a function of volumetric moisture (%) content (Figure 3a–c). The volumetric moisture window is chosen from 4–35% because these are the typical values generally observed in the in-situ measurements [26]. We observed that all three dielectric models result in different penetration depths for the same set of sensors ( λ , θ i ) and soil parameters ( ϵ ) (Figure 3a–c).
The penetration depth in all the models is lowest for sandy soil, followed by loamy, and highest for clayey soil. The sandy soil usually has more free water in the pore spaces, which could result in high permittivity and eventually less penetration of microwave pulses into the soil. In contrast, higher clay content in the soil results in bound water dominance in the soil [27], which results in less permittivity and high penetration depth of the SAR signals into the ground. The penetration depth is higher for low soil moisture conditions and decreases significantly with an increase in soil moisture content. Among all these models, Dobson’s empirical model results in high penetration depth, followed by the Hallikainen empirical and Dobson’s semi-empirical models for sandy and loamy soils. In contrast, we observed an opposite trend in the clayey soil with low soil moisture content. We found that the Dobson’s semi-empirical is highly sensitive to soil texture compared to the Hallikainen’s and Dobson’s empirical models. This could be because the Dobson semi-empirical model relies on the physical characteristics of the soil, and the other two models are fully empirical. In addition, the sample size for calibrating coefficients in the Hallikainen model is small (N < 100). Based on these results, we can conclude that the Dobson semi-empirical model provides more reliable estimates of the penetration depth of microwave pulses into the ground and can be used for a wide range of microwave frequencies [28]. These advantages make it most widely used for soil dielectric measurements at microwave frequencies.
Further, we applied the Dobson semi-empirical model to estimate the penetration depth at the L- and S-band of the upcoming NISAR mission. We plot the penetration depth against the moisture content at θ i = 33 and θ i = 47 for all the three types of soil, namely, sandy, loamy, and clayey, as shown in Figure 4a–c. We found that the penetration depth varies significantly with the SAR wavelength, and the L-band SAR signal has high penetration capabilities compared to the S-band SAR signals. Additionally, the penetration depth decreases with an increase in the incident angle, θ i . For the first 10% increase in soil moisture, the reduction in penetration depth is considerable; beyond that, it decreases gradually.

4. Conclusions

We evaluated the dependency of penetration depth on target and sensor properties such as soil texture composition, local incidence angle, and soil moisture. We observed that the Dobson empirical, Hallikaiinen empirical, and Dobson semi-empirical models lead to different penetration depths for the same set of sensors and target parameters. In addition, all these models behave similarly for sandy and loamy soils, whereas dual behavior is observed in the case of clayey soil, depending on the soil moisture condition. We observed that Dobson’s semi-empirical model is more sensitive to soil texture variation. Finally, we use this model to estimate the penetration depth of the SAR signal of the upcoming NISAR mission. We found a significant decrease in the penetration depth for an initial increase in the soil moisture content. For the S-band SAR signals, the penetration depth varies between 0–3 cm, 0–5 cm, and 0–10 cm for sandy, loamy, and clayey soils, respectively, whereas the penetration depth of L-band SAR signals ranges between 0–6 cm, 0–10 cm, and 0–25 cm for sandy, loamy, and clayey soils, respectively, for wet to dry soil conditions.
This study can be used to get a first-order estimate of the depth at which the ground truth data for soil moisture should be collected for the validation of soil moisture estimated from microwave satellite data acquired at different frequency bands.

Author Contributions

Conceptualization, A.S. and S.K.; methodology, A.S., S.K., and K.G.; software, A.S., S.K., and K.G.; validation, A.S. and K.G.; formal analysis, A.S. and M.N.; investigation, K.G. and A.S.; resources, K.G. and S.K.; data curation, A.S., M.N., and K.G.; writing—original draft preparation, A.S.; writing—review and editing, A.S. and K.G.; visualization, K.G. and S.K.; supervision and project administration, K.G.; and funding acquisition, K.G. and S.K. All authors have read and agreed to the published version of the manuscript.

Funding

This work was funded by the Space Application Centre (ISRO), India through grant Hyd-01. The APC of this invited contribution was waived.

Data Availability Statement

Acknowledgments

We thank IISER Bhopal and IIRS Dehradun for providing all the essential institutional support. AS would like to acknowledge the Department of Science and Technology, Government of India, for providing the DST-INSPIRE fellowship for Ph.D. We appreciate the editor’s input and that of the three anonymous reviewers for constructive comments and suggestions.

Conflicts of Interest

The authors declare no conflict of interest.

References

  1. El Hajj, M.; Baghdadi, N.; Bazzi, H.; Zribi, M. Penetration analysis of SAR signals in the C and L bands for wheat, maize, and grasslands. Remote Sens. 2018, 11, 31. [Google Scholar] [CrossRef] [Green Version]
  2. Fluhrer, A.; Jagdhuber, T.; Tabatabaeenejad, A.; Alemohammad, H.; Montzka, C.; Friedl, P.; Forootan, E.; Kunstmann, H. Remote Sensing of Complex Permittivity and Penetration Depth of Soils Using P-Band SAR Polarimetry. Remote Sens. 2022, 14, 2755. [Google Scholar] [CrossRef]
  3. Fluhrer, A.; Jagdhuher, T.; Tabatabaeenejad, A.; Alemohammad, H.; Montzka, C.; Schumacher, M.; Kunstmann, H. Complex Permittivity and Penetration Depth Estimation from Airborne P-Band SAR Data Applying a Hybrid Decomposition Method. In Proceedings of the 2021 IEEE International Geoscience and Remote Sensing Symposium IGARSS, Brussels, Belgium, 11–16 July 2021; IEEE: Piscataway, NJ, USA, 2021; pp. 5884–5887. [Google Scholar]
  4. Dobson, M.C.; Kouyate, F.; Ulaby, F.T. A reexamination of soil textural effects on microwave emission and backscattering. IEEE Trans. Geosci. Remote Sens. 1984, GE-22, 530–536. [Google Scholar] [CrossRef]
  5. Hallikainen, M.T.; Ulaby, F.T.; Dobson, M.C.; El-Rayes, M.A.; Wu, L.K. Microwave dielectric behavior of wet soil-part 1: Empirical models and experimental observations. IEEE Trans. Geosci. Remote Sens. 1985, GE-23, 25–34. [Google Scholar] [CrossRef]
  6. Singh, A.; Meena, G.K.; Kumar, S.; Gaurav, K. Analysis of the effect of incidence angle and moisture content on the penetration depth of L- and S-band SAR signals into the ground surface. ISPRS Ann. Photogramm. Remote Sens. Spat. Inf. Sci. 2018, IV-5, 197–202. [Google Scholar] [CrossRef] [Green Version]
  7. Singh, A.; Meena, G.K.; Kumar, S.; Gaurav, K. Evaluation of the penetration depth of L-and S-band (NISAR mission) microwave SAR signals into ground. In Proceedings of the 2019 URSI Asia-Pacific Radio Science Conference (AP-RASC), New Delhi, India, 9–15 March 2019; IEEE: Piscataway, NJ, USA, 2019; p. 1. [Google Scholar]
  8. Baghdadi, N.; Zribi, M. Evaluation of radar backscatter models IEM, OH and Dubois using experimental observations. Int. J. Remote Sens. 2006, 27, 3831–3852. [Google Scholar] [CrossRef]
  9. Thoma, D.P.; Moran, M.S.; Bryant, R.; Rahman, M.; Holifield-Collins, C.D.; Skirvin, S.; Sano, E.E.; Slocum, K. Comparison of four models to determine surface soil moisture from C-band radar imagery in a sparsely vegetated semiarid landscape. Water Resour. Res. 2006, 42, W01418. [Google Scholar] [CrossRef] [Green Version]
  10. Baghdadi, N.; King, C.; Chanzy, A.; Wigneron, J.P. An empirical calibration of the integral equation model based on SAR data, soil moisture and surface roughness measurement over bare soils. Int. J. Remote Sens. 2002, 23, 4325–4340. [Google Scholar] [CrossRef]
  11. Dobson, M.C.; Ulaby, F.T.; Hallikainen, M.T.; El-rayes, M.A. Microwave Dielectric Behavior of Wet Soil-Part II: Dielectric Mixing Models. IEEE Trans. Geosci. Remote Sens. 1985, GE-23, 35–46. [Google Scholar] [CrossRef]
  12. Peplinski, N.R.; Ulaby, F.T.; Dobson, M.C. Dielectric properties of soils in the 0.3–1.3-GHz range. IEEE Trans. Geosci. Remote Sens. 1995, 33, 803–807. [Google Scholar] [CrossRef]
  13. Rosen, P.A.; Kumar, R. NASA-ISRO SAR (NISAR) Mission Status. In Proceedings of the 2021 IEEE Radar Conference (RadarConf21), Atlanta, GA, USA, 7–14 May 2021; IEEE: Piscataway, NJ, USA, 2021; pp. 1–6. [Google Scholar]
  14. Falk, A.; Gerald, B.; Falk, A.; Gerald, B.; Adrian, B.; Sean, B.; Susan, C.; Manab, C.; Bruce, C.; Anup, D.; et al. NASA-ISRO SAR ( NISAR ) Mission Science Users’ Handbook; Jet Propulsion Laboratory, California Institute of Technology: California, CA, USA, 2018; pp. 1–350. [Google Scholar]
  15. Narvekar, P.S.; Entekhabi, D.; Kim, S.; Njoku, E.G. Soil Moisture Retrieval Using L-Band Radar Observations. IEEE Trans. Geosci. Remote Sens. 2015, 53, 3492–3506. [Google Scholar] [CrossRef]
  16. Njoku, E.G.; Entekhabi, D. Passive microwave remote sensing of soil moisture. J. Hydrol. 1996, 184, 101–129. [Google Scholar] [CrossRef]
  17. Engman, E.T. Applications of microwave remote sensing of soil moisture for water resources and agriculture. Remote Sens. Environ. 1991, 35, 213–226. [Google Scholar] [CrossRef]
  18. Singh, A.; Gaurav, K.; Meena, G.K.; Kumar, S. Estimation of soil moisture applying modified dubois model to Sentinel-1; a regional study from central India. Remote Sens. 2020, 12, 2266. [Google Scholar] [CrossRef]
  19. Li, B.; Good, S.P. Information-based uncertainty decomposition in dual-channel microwave remote sensing of soil moisture. Hydrol. Earth Syst. Sci. 2021, 25, 5029–5045. [Google Scholar] [CrossRef]
  20. Park, J.; Bindlish, R.; Bringer, A.; Horton, D.; Johnson, J.T. Soil Moisture Retrieval using a Time-Series Ratio Algorithm for the Nisar Mission. In Proceedings of the 2021 IEEE International Geoscience and Remote Sensing Symposium IGARSS, Brussels, Belgium, 11–16 July 2021; IEEE: Piscataway, NJ, USA, 2021; pp. 5873–5876. [Google Scholar]
  21. Rao, K.S.; Chandra, G.; Narasimha Rao, P.V. Study on penetration depth and its dependence on frequency, soil moisture, texture and temperature in the context of microwave remote sensing. J. Indian Soc. Remote Sens. 1988, 16, 7–19. [Google Scholar] [CrossRef]
  22. Ulaby, F.T.; Moore, R.K.; Fung, A.K. Microwave Remote Sensing-Active and Passive-Volume I-Microwave Remote Sensing Fundamentals and Radiometry (v. 1). In Radar Remote Sensing and Surface Scattering and Emission Theory; NASA Technical Report; Kansas University: Lawrence, KS, USA, 1981; pp. 848–902. [Google Scholar]
  23. Singh, A.; Gaurav, K.; Rai, A.K.; Beg, Z. Machine learning to estimate surface roughness from satellite images. Remote Sens. 2021, 13, 3794. [Google Scholar] [CrossRef]
  24. Nolan, M.; Fatland, D.R. Penetration depth as a DInSAR observable and proxy for soil moisture. IEEE Trans. Geosci. Remote Sens. 2003, 41, 532–537. [Google Scholar] [CrossRef] [Green Version]
  25. Kamal, H. Amera, Amal Elsharkawib, A.S.H. Revising wetted soil volume under trickle source for irrigation scheduling. Misr J. Agric. Eng. 2010, 27, 1162–1183. [Google Scholar]
  26. Lacava, T.; Matgen, P.; Brocca, L.; Bittelli, M.; Pergola, N.; Moramarco, T.; Tramutoli, V. A First Assessment of the SMOS Soil Moisture Product With In Situ and Modeled Data in Italy and Luxembourg. IEEE Trans. Geosci. Remote Sens. 2012, 50, 1612–1622. [Google Scholar] [CrossRef]
  27. Owe, M.; Van de Griend, A.A. Comparison of soil moisture penetration depths for several bare soils at two microwave frequencies and implications for remote sensing. Water Resour. Res. 1998, 34, 2319–2327. [Google Scholar] [CrossRef]
  28. Quan, C.; Jiuli, L.; Zhihua, T.; Jiangyuan, Z.; Yan, L. Study on the relationship between soil moisture and its dielectric constant obtained by space-borne microwave radiometers and scatterometers. IOP Conf. Ser. Earth Environ. Sci. 2014, 17, 012143. [Google Scholar] [CrossRef]
Figure 1. Keywords co-occurrence bibliometric analysis of the words (soil, dielectric models, and penetration depth). The keywords are from more than 45 research publications (from the Scopus database indexed till 30 August 2022). There are about 570 items (i.e., words) that get clustered into 22 clusters (shown in different colors) and 9776 links (indicated in curve lines).
Geographies 02 00045 g001
Figure 2. Schematic to show the penetration depth of microwave pulses into a soil column.
Geographies 02 00045 g002
Figure 3. Penetration depth (mm) of SAR pulses (L-band) as a function of volumetric water content (in %) at nadir in different soil types: (a) sandy, (b) loamy, and (c) clayey.
Geographies 02 00045 g003
Figure 4. Penetration depth (mm) of SAR pulses (L- and S-band) as a function of volumetric water content (in %) at different incidence angle in (a) sandy, (b) loamy, and (c) clayey soils.
Geographies 02 00045 g004
Table 1. The composition of different soil samples used in this study.
SoilSoil Proportion ( % ) Bulk Density
TypeSandSiltClay(g/cm 3 )
Sand86.77.85.51.57
Loam61.323.115.61.42
Clay17.7931.1451.071.28
Publisher’s Note: MDPI stays neutral with regard to jurisdictional claims in published maps and institutional affiliations.

