Abstract
Thematic maps of land cover and use can assist in the environmental monitoring of semiarid regions, mainly due to the advent of climate change, such as drought, and pressures from anthropic activities, such as the advance of urban areas. The use of geotechnologies is key for its effectiveness and low operating cost. The objective was to evaluate and understand the spatiotemporal dynamics of the loss and gain of land cover and use in a region of the Brazilian semiarid region, and identify annual trends from changing conditions over 36 years (1985 to 2020), using cloud remote sensing techniques in Google Earth Engine (GEE). Thematic maps of land cover and land use from MapBiomas Brazil were used, evaluated by Mann–Kendall trend analysis. The Normalized Difference Vegetation Index (NDVI) was also determined from the digital processing of about 800 orbital images (1985 to 2020) from the Landsat series of satellites. The trend analysis for land cover and use detected, over time, the loss of forest areas and water bodies, followed by the advance of exposed soil areas and urban infrastructure. The modification of native vegetation directly influences water availability, and agricultural activities increase the pressure on water resources, mainly in periods of severe drought. The NDVI detected that the period from 2013 to 2020 was most affected by climatic variability conditions, with extremely low average values. Thematic maps of land cover and use and biophysical indices are essential indicators to mitigate environmental impacts in the Brazilian semiarid region.
1. Introduction
Urban growth in Brazil began mainly in the 20th century, from the 1930s and 1940s, when the urbanization was incorporated into the profound structural transformations that Brazilian society and economy were undergoing, linked to a great cycle of expansion of internal migrations, from the rural to the cities. In the following decades, this process systematically increases, even becoming a generalized urban expansion for the whole world, and in 1970, for the country as a whole, the urban population was greater than the rural one [1,2,3,4].
The participation of the rural population continues to decline, in absolute and relative terms, in the official counts of the Demographic Censuses of the Brazilian Institute of Geography and Statistics (IBGE). In 2000, the urbanization rate was 81.23%, prolonging the demographic trend that began to assert itself between the 1960 and 1970 censuses, ending in 2010 with 84.36% of the country’s population living in urban areas [5].
According to the United Nations (UN), cities will concentrate in 2050, about 70% of the world population, which will represent about 6.3 billion people [6]. This scenario, marked by high population density, often accelerated and without planning from a disorderly development, presents itself as one of the great challenges for public power administrators, due to insufficient infrastructure, extreme poverty, unemployment, and environmental problems, such as climatic factors; floods; soil waterproofing; loss of vegetation cover; overload in the drainage system; pollution and silting of water in rivers and reservoirs; and accumulation of solid waste [7,8,9,10].
In addition, there are problems related to the urban climate, such as the generation of heat islands, impacts from precipitation events, and atmospheric pollution. These events are more visible in large urban agglomerations; however, in small and medium-sized cities, there are also changes in the natural landscape, materialized in air, water, soil, and groundwater pollution. Rivers and streams are channeled or have their courses altered, landfills and constructions modify morphology, and vegetation is removed [9,11,12,13].
In the case of the Brazilian Semiarid Region, research indicates that the region is considered one of the most populous in the world, with an estimated population of over 27 million inhabitants and a population density of 23.05 inhabitants per km2, revealing that this population density is mainly reflected by the urbanized areas, exerts greater pressure on water and natural resources, and energy, causing greater human interference and changes in land use and land cover [14,15].
Therefore, it is necessary to understand the alterations and/or environmental changes of the semiarid climate and also the possible impacts generated by human actions in these regions, such as deforestation, soil erosion, fires, intensive farming practices, inadequate management of agriculture, and disordered urbanization, which contribute to the worsening of degradation processes and consequent soil desertification [9,16,17,18,19].
This study presents, in a simple way, the characterization and diagnosis of land use and occupation in the Brazilian semiarid region, aiming to expand the environmental monitoring of biophysical conditions in semiarid regions. In the need for advances in this direction, especially in the Brazilian Northeast, it is essential to seek new tools, methods, and practical and efficient technologies to meet demands such as the absence of large-scale environmental and climate data in space and time.
In this context, geotechnologies associated with Geographic Information Systems (GIS), which consist of tools for spatial analysis and data storage, have been increasingly disseminated to quantify and analyze changes in the landscape over time, building accurate and reliable databases. These technologies are extremely important instruments to assist in the mapping of land use and land cover, explaining processes of urban expansion and environmental impacts, simulating future scenarios, and serving as guidance for possible public policies modern, decentralized, and participatory [20,21,22].
Recent studies with GIS, using satellite images, in the last four decades, have been providing valuable scientific information, facilitating the understanding of the spatial and temporal dynamics of land use [1,12,19,21,23], mainly in areas of high urban growth, comprehending the changes imposed by man on the physical environment and its geomorphological implications, in ecosystem habitats, and in municipal-scale deforestation in Batticaloa, Eastern Province of Sri Lanka [24], in Panchkula District in Haryana, one of the fastest growing urban centers in India [25], and the Sele River Basin in Southern Italy [26].
Ref. [23] highlighted that the change in land cover and use in municipalities in rural China is the result of the interaction between anthropic activities and biophysical processes, where socio-economic development was the main driver of the expansion of the built-up area, and geographic differentiation is the dominant factor in the conversion of cultivated land, forests, and pastures. Ref. [27] also highlighted that anthropic activities are the main source of modification of the land surface, for example, the needs of urban development. This mainly highlights that human activities alter the biophysical attributes of the Earth’s land surface, especially the modification of native ecosystems.
Refs. [17,19,28] highlight that the worsening of soil degradation in semiarid regions is one of the most catastrophic results of drought events and anthropic activities. Through the assessment of climate/environmental impacts, induced mainly by the action of man in the natural environment, essential information can be obtained for decision makers to mitigate and understand the levels of environmental degradation in the Brazilian semiarid region.
The study of land use and land cover becomes highly viable when evaluated in space-time practically and effectively, at a low operational cost. This environmental monitoring over time is carried out through the use of geoprocessing and its geotechnologies, such as orbital remote sensing, a tool that, through a set of geospatial techniques, evaluates the plant biomass and the landscape pattern through indicators, such as vegetation indices and maps of land use and land cover that quantitatively characterize changing conditions and their relationships. The applications allow forecasting climate change, agroecological planning, and urban infrastructure conditions, to assess and monitor the risk of environmental degradation, especially in semiarid regions [1,27,29].
Because of the above, the objective was to understand the spatiotemporal dynamics of the loss and gain conditions of land use and land cover, especially in the urban area, and to identify annual trends in the conditions of change in the Brazilian semiarid region, to relate the vegetation suppression process over 36 years (1985 to 2020), using remote sensing techniques and digital cloud processing in Google Earth Engine (GEE).
2. Materials and Methods
2.1. Study Area
The study area, the municipality of Campina Grande, is located in the state of Paraiba, in the Brazilian semiarid region, located more specifically between the parallels of 07°8′ S and 07°28′ S, and between the meridians of 35°44′ W and 36°8′ W, at an average altitude of 555 m (Figure 1).
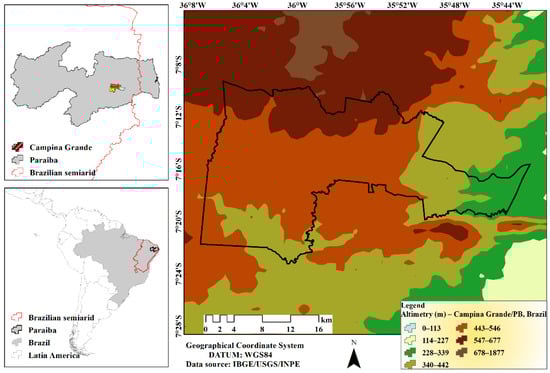
Figure 1.
The spatial location of the study area is the municipality of Campina Grande, Paraiba, Brazil.
The municipality has an absolute surface of 591,658 km2, and an estimated population of 413,830 inhabitants [30]. It is characterized by a predominant vegetation cover of the Caatinga biome and has a tropical climate of altitude with a rainy season starting in March and ending in August, with a total annual rainfall of 773.5 mm (from 1911 to 2011), and maximum temperatures throughout the year between 30 °C (summer) and 25 °C (winter), and minimum temperatures between 20 °C (summer) and 18 °C (winter) [31].
2.2. Orbital Data from Satellites
The research was developed from a robust analysis, using orbital images from the Landsat-5 sensor Thematic Mapper (TM), Landsat-7 sensor Enhanced Thematic Mapper (ETM+), and Landsat-8 sensor Operational Land Imager (OLI), between 1 January 1985 to 31 December 2020.
The images were made available by the National Aeronautics and Space Administration (NASA) via the United States Geological Survey (USGS) (https://www.usgs.gov/landsat-missions/landsat-satellite-missions—accessed on 29 August 2022); processed digitally in Google Earth Engine (GEE) software (https://earthengine.google.com/—accessed on 2 September 2022). The GEE provides a library with multiple mathematical analysis functions, highlighting computational modeling and statistical analysis, with machine learning operations based on specific algorithms, efficient in processing satellite images and calculating different biophysical parameters at the surface [32].
Specifically, Google Earth Engine provides a range of processing methods/algorithms for the Landsat series of satellites. From methods to calculate the radiance in sensors, as well as the reflectance at the top of the atmosphere (TOA), and also, as used in the present study, the surface reflectance (SR). Furthermore, the platform especially highlights models for scoring clouds and cloud-free composites.
In this study, a digital processing script was used in the GEE, with the following datasets/collections—GEE ID: Landsat-5 TM (“LANDSAT/LT05/C02/T1_L2”); Landsat-7 ETM+ (“LANDSAT/LE07/C02/T1_L2”); and Landsat-8 OLI (“LANDSAT/LC08/C02/T1_L2”), with the availability of geospatial data from the year 1985 to the present. Over 36 years (1985–2020), at least 800 satellite images were digitally processed.
Regarding cloud problems, one of the criteria adopted for Landsat image processing was to develop a digital processing script for cloud mask and their shadows from a specific band for both satellites/sensors. The script was adapted according to the indications of the rudimentary GEE ID algorithm: (for example: https://code.earthengine.google.com/54aabb24979858b32a59aaebe8ba125c?noload=true—accessed on 2 September 2022). Indications of these processing methods/algorithms as a function of Landsat sensors can be found in the following GEE repository (https://developers.google.com/earth-engine/guides/landsat—accessed on 2 September 2022).
For the proper application and effective use of Landsat images on the GEE platform, atmospheric correction/calibration factors, multiplier (0.0000275), and additive factors (−0.2) were applied for each multispectral band used of the surface reflectance product, collection two [33]. The surface reflectance product for the Landsat-5/TM, 7/ETM+, and 8/OLI satellites/sensors, presents temporal resolution between 14 and 16 days; spatial resolution of 30 m and radiometric resolution of 16 bits [34].
From the multispectral reflective bands of the satellite images, the Normalized Difference Vegetation Index (NDVI) was determined, which is able to characterize, in addition to the conditions of green vegetation and agricultural areas, other land uses, such as urban infrastructure and exposed soil areas. The NDVI is estimated as a function of the ratio between the difference between the multispectral bands of the near-infrared reflectance (rNIR1) and the red band (rRED) by their sum [35,36,37], according to Equation (1).
where, rNIR1 and rRED correspond to the reflectances of the multispectral bands of the TM and ETM+ sensors in the wavelengths (0.77–0.90 μm) and (0.63–0.69 μm), and OLI sensor (0.851–0.879 μm) and (0.636–0.673 μm).
2.3. Coverage Trend Analysis and Land Use
2.3.1. Satellite-Derived Data (MapBiomas Brazil)
The MapBiomas Brazil project is based on geospatial data, derived from the Landsat series of satellites, for the development of thematic maps of land use and land cover. The spatiotemporal monitoring of the natural environment of Brazilian biomes was driven by the implementation of a low-cost, open-access methodology. It is worth noting that annual thematic maps contain up to 105 layers of information. Thus, to generate a single land cover and land use map for each year, so-called prevalence rules apply. In this case, it is when the same pixel is classified in two maps of different classes, in order to define which class it belongs to in the final map. Additionally, at the end of all digital processing, these are carefully evaluated/validated as to their statistical quality through accuracy analysis, with estimates of the general accuracy rates and also of accuracy and error for each of the cross-sectional themes mapped [38,39].
The public availability and consistency of these data had a high impact on Earth science studies and promoted the development of even more detailed research on the changing conditions of land uses over time. The studies mainly cover the monitoring of areas of native vegetation (mapping of the loss and/or resilience of the natural vegetation cover of the biomes), pasture (quality and degradation), agriculture (evolution of irrigation and mapping of different cultures), water resources (condition water supply of rivers, streams, lakes, ponds, and strategic reservoirs), urban infrastructure, among other cross-cutting themes (for example, [40,41,42,43,44,45,46]).
2.3.2. Mann–Kendall Test and SEN Slope Estimator
Trend analysis is responsible for quantifying the patterns of changes and trends of different land uses and land cover over the 36-year time series (1985–2020).
Information on annual trends of loss and gain brings significant benefits to understanding the dimensions of the climate variability framework and pressures from anthropic activities, generating results for adequate planning and management of adaptation of water and natural resources in semiarid regions (for example, [47,48]).
From the 6.0 collection of thematic classifications of the annual maps of the land use and land cover of MapBiomas Brazil, a trend analysis of land uses for the study area was carried out, using the Mann–Kendall nonparametric statistical test, highlighting areas with forest cover, non-forest natural formation, agriculture, urban infrastructure, and water bodies [49,50]. The Mann–Kendall (S) test statistic is described by Equation (2):
where, n corresponds to the number of data points; xi and xj are given in the time series i and j (j > i), respectively, and Sgn (xj−xi) is defined by Equation (3).
Since the data set is distributed identically and independently, the mean of S is zero and the variance of S is given according to Equation (4):
where, n—dataset number; ti—number of values in the i-th group; q—number of groups containing repeated values.
During the time series of 36 years of data, the statistical value S can be transformed into ZS, according to the following conditions given by Equation (5):
where, the ZS value characterizes if there is a tendency in the Mann–Kendall test. Positive ZS values indicate an increasing trend, whereas negative ZS values indicate a downward trend, and if the ZS value is 0, there is no trend. The trend is significant at the 90% confidence level if |Z| > 1.64, at the 95% confidence level if |Z| > 1.96, and at the 99% confidence level if |Z| > 2.58.
So, right after identifying trends by the Mann–Kendall (ZS) test for different land uses, an analysis of the magnitude of the trend was performed using the Sen (Q) slope test [51], aiming to estimate the true slope of the given annual trend (ZS), by a linear trend estimation model, according to Equation (6):
where, xj and xk—are the values given at times j and k (j > k), respectively. If there are n values of x in the time series, N = n (n − 1)/2 slope estimates Qi are obtained. The N values of Qi are ranked from smallest to largest, and the slope estimator of Sen is the median of N values of Qi (for example, [47,48]).
2.4. Statistical Analysis of Data
The Mann–Kendall statistical tests [49,50] and Sen’s slope estimator [51] were used to compute the sloping trend of the land cover and land use time series, between 1985 and 2020. Trend analyzes were performed using the R software, version 3.6.1 [52].
The main results of the NDVI thematic maps were evaluated in terms of descriptive statistics, through measures of central tendency (average) and measures of dispersion (minimum; maximum; standard deviation—SD; and coefficient of variation—CV). The NDVI maps were also evaluated for their spatiotemporal variability through CV values (%), according to the classification criteria of [53]: CV < 12%—low variability; 12% < CV < 60%—medium variability; and CV > 60%—high variability.
3. Results and Discussion
Figure 2 represents the spatiotemporal map of land use and land cover of the study area, municipality of Campina Grande, in the Brazilian semiarid region, between 1985 and 2020. This monitoring based on thematic classifications was developed using data geospatial from the Landsat series of satellites, made available by the annual mapping project of land cover and use in Brazil [39].
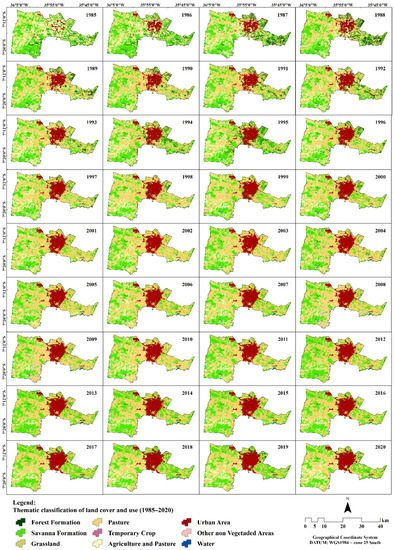
Figure 2.
Annual spatiotemporal monitoring of land cover and use in the semiarid region of Campina Grande−PB, between 1985 and 2020. Data source: MapBiomas Brazil—Collection 6.0.
The semiarid region of study presents different uses and occupations of the soil, with areas directed to agricultural activities, as well as water resources, areas of vegetation of the Caatinga biome, highlighting areas of natural and unnatural forest formation, in addition to the predominance of a savanna formation and, also, mainly, the highlight of the conditions of exposed soil areas and urban infrastructure (Figure 2).
Over time, a reduction in forest areas is observed, highlighted by the spectral condition of the vegetation cover of the Caatinga. The significant reduction in natural vegetation in the semiarid environment is evidenced by the increase in agricultural areas (agriculture and pasture) and urban infrastructure over the last three decades. Such ones were strengthened mainly by livestock, with an expansion of pasture areas in all regions of the municipality, as well as by the boosting of civil construction in the central region, mainly in the midwest and southwest regions (Figure 2).
The municipality of Campina Grande in the Brazilian semiarid region, the object of this study, is considered a growing urban area, according to the IBGE, between 1996 and 2010 the population increased from 343,196 to 385,213 inhabitants. In 2021, the estimated population is 413,830 inhabitants, an increase of 28.617 inhabitants compared to 2010. However, research shows that this urban growth has been occurring without adequate planning. During rainy periods, failures in the drainage system were observed in some neighborhoods with high population density, causing frequent flooding [10].
Table 1 presents the total annual amount of land cover and use specifically for the years 1985 and 2020, highlighting the loss and gain conditions of the study area. Additionally, Table 1 presents the statistical data of accuracy by classes and general accuracy.

Table 1.
Annual quantification of the different uses and land cover in the years of 1985 and 2020 for the semiarid region of Campina Grande−PB, Brazil.
Between 1985 and 2020, the municipality of Campina Grande−PB, in the Brazilian semiarid region, highlighted the loss of native vegetation, around 20% (115 km2), among the forest areas (specifically in thematic classes of forest formation and savanna formation), with a statistical accuracy of 90% (1985) and 88.05% (2020), and non-forest natural formation (specifically in thematic class of grassland), with an accuracy of 17.89% (1985) and 19.48% (2020), with this being a class of low statistical precision; however, it is worth mentioning that its representativeness in the sample is only 1% (Table 1).
On the other hand, the farming (specifically in thematic classes of agriculture and pasture), with an accuracy of 67.16% (1985) and 82.27% (2020), and non-vegetated area (specifically in thematic classes of urban area and other non-vegetated areas), with an accuracy of 80.63% (1985) and 86.08% (2020), showed a percentage gain over time, around 12% and 8%, respectively (Table 1).
The water area of the semiarid region of study also highlighted the loss of water availability over time, with a significant accuracy of 93.59% (1985) and 93.68% (2020). Thus, it was observed through the thematic classes, in the period from 1985 to 2020, a general accuracy of 81.80% (Table 1).
Figure 3 shows the trend analysis of the annual amount of land cover and land use in the semiarid region of Campina Grande−PB, based on the thematic classifications of land uses, between 1985 and 2020, according to the Mann–Kendall (Zs) test and the Sen (Q) slope estimator. As a function of the Zs and Q statistical parameters, highlighting the probability values (p-value), with a trend significance at the level of 1% (p < 0.01), 5% (p < 0.05), and 10% (p < 0.10), helps identify increasing or decreasing trends in the time series.
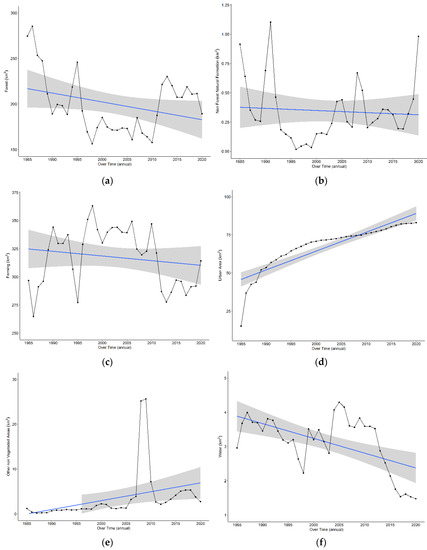
Figure 3.
Mann–Kendall trend analysis and Sen estimator for the total annual amount of land cover and land use in the study area (1985–2020). Forest (a), non-forest natural formation (b), farming (c), urban area (d), other non-vegetated areas (e), and water (f). Area shaded in gray corresponds to 95% confidence intervals of the linear trend line.
In the forest area (Figure 3a), it is noteworthy that 92.79% of the vegetation cover is savannah while only 7.21% has a dense forest formation [39]. In view of this, it is worth noting that the vegetation of the Caatinga biome is characterized by its high resilience power, which favors the rapid formation of plant biomass soon after the rainy events, rain being a dominant and controlling factor in this semiarid environment. This helps to explain some vegetation resilience peaks such as, for example, the significant increase in vegetation cover in 1995. This year presented an annual rainfall of around 984.1 mm, and the previous year, 1994, was also very rainy, 1028.5 mm [54]. That is, both presenting rainfall above the annual historical average (773.5 mm) of the study area.
On the other hand, as this ecosystem is highly dynamic, it is also highlighted that from the events of severe drought (accentuated water deficit), a drastic reduction in the vegetation of the Caatinga is observed from the loss of the leaf canopy and the condition of the plant biomass, which is a physiological defense characteristic of this biome [55,56].
Statistically, the time series of the forest area does not present a statistically significant trend, according to the negative Zs value = −1.51; however, it highlights a decrease, as a function of the true magnitude of the trend, by the Q test, which estimated an annual loss of these areas around 1.08 km2, mainly alerting to the increase in deforestation (Figure 3a).
The time series of the area of non-forest natural formation (grassland) also did not show a statistically significant trend, according to the characterization of the statistical values of positive Zs = 0.45. The true magnitude of the trend, by the Q test, only estimated an annual gain of 0.00193 km2 (Figure 3b).
The farming area (agriculture and pasture) also did not show a statistically significant trend, with negative Zs = −1.08. However, it is observed that the true magnitude of the trend, by the Q test, detected an annual loss of 0.45 km2 (Figure 3c). Here, it is worth noting that within this area, agriculture lost strength and/or a reduction was observed over time. Especially between 2011 and 2020, which did not show recovery power due to the severe effects of drought in this period (Figure 3c). The pasture, predominant in the study area, remained stable, however, in this period, it also highlighted the loss. In this sense, it is highlighted that the drought and the pressures of anthropic activities are promoting intensified vulnerabilities to the natural environment in the study area.
The time series for the urban area highlighted a significant increasing trend, with positive Zs = 8.57. The true magnitude of the trend, by the Q test, estimated an annual gain of 0.91 km2, with trend significance at the level of 1% (p < 0.01) (Figure 3d). The rise of the urban area over time directly affected the condition of reservoirs in the central region of the study area.
Other non-vegetated areas highlighted a significant upward trend in the time series, with positive Zs = 6.03. The Q test estimated an annual gain of 0.12 km2, at a level of 1% (p < 0.01) (Figure 3e). This behavior is linked to the behavior pattern of farming (agriculture and pasture). Ref. [49] observed that undisciplined anthropic activities also contribute to the increase in exposed soil areas in the semiarid region, because deforestation and the burning of Caatinga vegetation for agricultural purposes is common.
The water coverage area highlights a decreasing trend, with negative Zs = −3.04. The magnitude of the trend by the Q test estimated a quantitative annual loss of −0.04 km2 at the 1% level (p < 0.01) (Figure 3f). So that, in addition to the effects of climate change such as severe drought events, rainfall variability in space and time affects water availability in rivers, lakes, and reservoirs in the study area.
In Panchkula District, Haryana, India, between 1980 and 2020, agricultural land classes increased by 73.71%, built-up areas by 84.66%, and forest by 4.07%, whereas river beds reduced by 50.86%, in spatial extent. Additionally, all these changes are strongly associated with industrial activities and buildings [25]. In Batticaloa Municipality, Eastern Province of Sri Lanka, between 1990–2020, there was a decrease in agricultural land use from 26.9% to 21.9% [24].
Figure 4 shows the spatiotemporal distribution of the NDVI vegetation index, from surface thematic maps, in the period 1985 and 2020. NDVI map results range from −1.00 to 1.00.
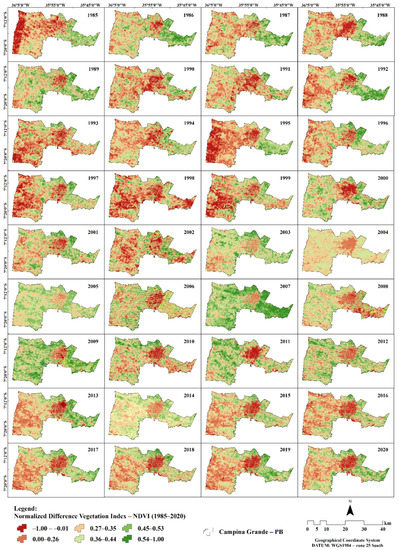
Figure 4.
Spatiotemporal distribution of the NDVI in the semiarid region of Campina Grande−PB, between 1985 and 2020. Class 1: −1.00 and −0.01; Class 2: 0.00 and 0.26; Class 3: 0.27 and 0.35; Class 4: 0.36 and 0.44; Class 5: 0.45 and 0.53; and Class 6: 0.54 and 1.00.
The NDVI thematic maps showed a quantitative and spatiotemporal behavior of medium variability, according to the criteria proposed by [53], confirmed by the CV values between 19.05% and 41.94%.
The NDVI effectively detected the spatiotemporal variability of the vegetation cover of the Caatinga, among other land uses, detecting the changing conditions and climatic variability in the semiarid region. It is also worth mentioning that the urban area was characterized in the range of NDVI values, between −1.00 and −0.01. Over the years, one can notice the spectral behavior of urban infrastructure in the central region of the surface thematic maps (Figure 4).
Class 1 (−1.00 and −0.01) corresponds to the spatiotemporal distribution of urban infrastructure areas, especially in the central region of the thematic maps, which highlights the city of Campina Grande-PE. It is worth mentioning in this sense that some pixels in other regions of the study area, with the same characteristics of values, are over clouds (Figure 4).
Classes 2 (0.00 and 0.26) and 3 (0.27 and 0.35) highlight the spatiotemporal distribution of regions that have areas of exposed soil and sparse Caatinga vegetation. These values are present in most of the analysis (Figure 4). This pattern of spectral behavior is linked to the variation of water availability, which is mainly related to a long dry season (up to 8 months), a time that has a high water deficit, that is, low soil moisture over semiarid regions, causing changes and a decrease in leaf canopy and vegetation biomass condition [49].
On the other hand, classes 4 (0.36 and 0.44) and 5 (0.45 and 0.53) highlight areas of Caatinga that have a greater capacity to recover vegetative vigor due to rain events. Class 6 (0.54 and 1.00) highlights the spatiotemporal distribution of areas with dense vegetation cover (Figure 4). For the most part, this pattern of behavior prevails mainly when rainfall amounts are above the historical average for the region.
The spatiotemporal distribution of the NDVI, together with the quantification and characterization of the results for the semiarid region of Campina Grande−PB, show to be an effective part of an important environmental monitoring for planning and management in decision-making on the assessment of environmental impacts, which may extend to the entire Brazilian semiarid region.
Ref. [57] also studied environmental changes by remote sensing in semiarid regions in Senegal and Mali, and highlighted that climate change and anthropic activities caused changes in the natural environment. The authors highlighted mainly drought events, from low rainfall regimes and high temperatures, driven by increased pressures from human actions in dry seasons, favoring the acceleration of environmental degradation processes over time.
The statistical parameter of the average pixel of the NDVI is presented in Figure 5, varying between 0.18 and 0.53, spectral distribution behavior related to several factors, such as the dry period, which favors the accentuation of water deficit conditions in semiarid regions, especially in the study area, thus promoting leaf canopy loss [55]. This behavior can be observed practically in the entire region, and more emphatically in the regions with the ranges of values between 0.00–0.26 and 0.27–0.35 (Figure 3).
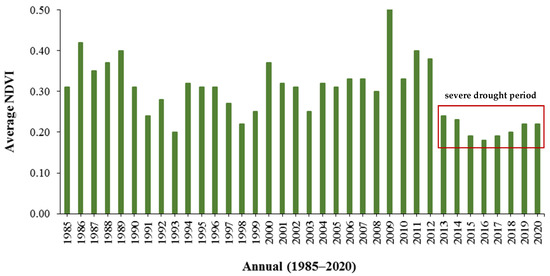
Figure 5.
Annual mean time series of the NDVI index, for the semiarid region of Campina Grande–PE, Brazil.
Ref. [58] highlighted that during the rainy season, the NDVI reached a maximum value of 0.80 due to the increase in plant biomass productivity. However, in the dry season, when leaves fall and leaf canopy loss occurs, a remarkable defense mechanism of the Caatinga vegetation, the NDVI reduced to the value of 0.30, in response to the accentuated water deficit in the region, which favors the reduction in photosynthetic activities. This condition of low NDVI values was detected between the years 2013 and 2020 of this study.
Figure 5 presents the time series with the annual mean pixel value of the NDVI, for the semiarid region, between the years 1985 and 2020.
However, it is worth noting that in addition to climate variability events, the decrease in NDVI values, especially in the period from 2013 to 2020, is also linked to the pressures of anthropic activities on land use in the study region, mainly due to deforestation, disorderly civil construction, favoring the increase in exposed soil areas and waterproofed areas, which directly affect hydrological conditions and soil properties, resulting in the general loss of ecosystem services. In this regard, threats to sustainable livelihoods in the semiarid region are highlighted from the processes of soil degradation and desertification over time [13,28,59].
Studies in Brazil and around the world warn of the worsening of soil degradation in semiarid regions, highlighting this process as one of the most catastrophic results of long-term drought events and anthropic activities. These researches highlight that through the assessment of climate impacts, induced mainly by the action of man in the semiarid environment, essential information can be obtained for decision makers, essentially the public power, aiming to fundamentally mitigate environmental degradation in the semiarid environment [17,18,19,28].
4. Conclusions
Environmental monitoring based on the characterization of thematic maps of land use and land cover and biophysical indicators at the surface is a significant instrument for prior planning and management in decision-making in an appropriate manner.
From the significant growth of the urban area in recent decades, studies of the characterization of the land uses need to be updated, aiming at mitigating environmental impacts on the natural environment and the population. In this sense, we must highlight the use of these indicators in the form of maps.
For 36 years, the advance of exposed soil and urban areas in the semiarid region of Campina Grande−PB showed an increasing annual trend, highlighting an expansion of about 10%. The average NDVI highlighted a reduction in vegetation cover mainly in the period from 2013 to 2020. Highlighting the low resilience capacity of vegetation over time, which can favor environmental degradation and soil desertification.
Water resources highlighted a decreasing annual trend, due to the high climatic variability of the semiarid environment. However, it is worth noting that the changing conditions of native vegetation influence water availability, in addition to the pressures exerted by anthropic activities, especially in periods of a long drought and severe drought.
The spatiotemporal monitoring of the Caatinga vegetation through the NDVI, in the development of surface thematic maps, also originated responses of the behavior pattern of the different land uses in the semiarid region, in addition to the conditions of loss and gain of vegetation cover, mainly highlighting the changing conditions of the spectral condition of the urban area over time.
The use of geoprocessing and sets of orbital remote sensing techniques, based on the standardization of a technical and scientific methodology, with a digital cloud processing script in Google Earth Engine, allowed for the identification of patterns of changes in space and time of land cover and climate variability in the semiarid region of Campina Grande−PB.
Author Contributions
Conceptualization, J.L.B.d.S. and D.C.R.; methodology, J.L.B.d.S., M.V.d.S. and A.A.d.C.; software, J.L.B.d.S., M.V.d.S. and A.A.d.C.; validation, J.L.B.d.S. and M.V.d.S.; investigation, J.L.B.d.S. and R.d.C.C.L.; data curation, J.L.B.d.S., M.V.d.S. and A.A.d.C.; writing—original draft preparation, J.L.B.d.S. and D.C.R.; writing—review and editing, D.C.R., M.B.F., M.V.d.S. and R.d.C.C.L.; visualization, M.B.F., H.P. and R.d.C.C.L.; supervision, R.d.C.C.L.; project administration, R.d.C.C.L.; funding acquisition, R.d.C.C.L. and H.P. All authors have read and agreed to the published version of the manuscript.
Funding
This research received no external funding.
Data Availability Statement
Not applicable.
Acknowledgments
To the Instituto Nacional do Semiárido (INSA) for supporting the development of this research. Additionally, to the Programa de Pós-Graduação em Engenharia Agrícola (PGEA) and the Grupo de Pesquisa em Ambiência (GPESA) of the Universidade Federal Rural de Pernambuco (UFRPE) for supporting the development of this research. The Coordenação de Aperfeiçoamento de Pessoal de Nível Superior, and Conselho Nacional de Desenvolvimento Científico e Tecnológico (CNPq).
Conflicts of Interest
The authors declare no conflict of interest.
References
- Abrantes, P.; Rocha, J.; Costa, E.M.d.; Gomes, E.; Morgado, P.; Costa, N. Modelling urban form: A multidimensional typology of urban occupation for spatial analysis. Environ. Plan. B Urban Anal. City Sci. 2019, 46, 47–65. [Google Scholar] [CrossRef]
- Chauvin, J.P.; Glaeser, E.; Ma, Y.; Tobio, K. What is different about urbanization in rich and poor countries? Cities in Brazil, China, India and the United States. J. Urban Econ. 2017, 98, 17–49. [Google Scholar] [CrossRef]
- Coy, P.D.M.; Sandholz, D.S.; Töpfer, D.T.; Zirkl, D.F. Metropolitan Regions: Challenges for Sustainability and Governance of Periurban Areas in Brazil. Confin. Rev. Fr.-Brésilienne De Géographie/Rev. Fr. -Bras. De Geogr. 2018, 38, 1–15. [Google Scholar] [CrossRef]
- Kühner, T.; Pinto, C.V.D.S.; Amorim, C.N.D. International urban agendas and sustainable integrated urban development in developing countries. The case of Brazil. Cid. Comunidades E Territ. 2021, Sp21, 120–138. [Google Scholar] [CrossRef]
- IPEA. O Gigante Invisível: Território e População Rural Para Além Das Convenções Oficiais; Instituto de Pesquisa Econômica Aplicada: Rio de Janeiro, Brazil, 2014. [Google Scholar]
- Organização das Nações Unidas (ONU). World Population Prospects: The 2017 Revision, Key Findings and Advance Tables; United Nations: New York, NY, USA, 2017. [Google Scholar]
- Talukder, S.; Capon, A.; Nath, D.; Kolb, A.; Jahan, S.; Boufford, J. Urban health in the post-2015 agenda. Lancet 2015, 385, 769. [Google Scholar] [CrossRef]
- Silva, C.V.F.; Schardong, A.; Garcia, J.I.B.; Oliveira, C.D.P.M. Climate change impacts and flood control measures for highly developed urban watersheds. Water 2018, 10, 829. [Google Scholar] [CrossRef]
- Kalantari, Z.; Ferreira, C.S.S.; Page, J.; Goldenberg, R.; Olsson, J.; Destouni, G. Meeting sustainable development challenges in growing cities: Coupled social-ecological systems modeling of land use and water changes. J. Environ. Manag. 2019, 245, 471–480. [Google Scholar] [CrossRef]
- Alves, P.B.R.; Djordjević, S.; Javadi, A.A. An integrated socio-environmental framework for mapping hazard-specific vulnerability and exposure in urban areas. Urban Water J. 2021, 18, 530–543. [Google Scholar] [CrossRef]
- Du, H.; Wang, D.; Wang, Y.; Zhao, X.; Qin, F.; Jiang, H.; Cai, Y. Influences of land cover types, meteorological conditions, anthropogenic heat and urban area on surface urban heat island in the Yangtze River Delta Urban Agglomeration. Sci. Total Environ. 2016, 571, 461–470. [Google Scholar] [CrossRef]
- Heaviside, C.; Macintyre, H.; Vardoulakis, S. The urban heat island: Implications for health in a changing environment. Curr. Environ. Health Rep. 2017, 4, 296–305. [Google Scholar] [CrossRef]
- Oliver, S.; Corburn, J.; Ribeiro, H. Challenges regarding water quality of eutrophic reservoirs in urban landscapes: A mapping literature review. Int. J. Environ. Res. Public Health 2019, 16, 40. [Google Scholar] [CrossRef] [PubMed]
- Ledru, M.P.; Jeske-Pieruschka, V.; Bremond, L.; Develle, A.L.; Sabatier, P.; Martins, E.S.; de Freitas Filho, M.R.; Fontenele, D.P.; Arnaud, F.; Favier, C.; et al. When archives are missing, deciphering the effects of public policies and climate variability on the Brazilian semi-arid region using sediment core studies. Sci. Total Environ. 2020, 723, 137989. [Google Scholar] [CrossRef]
- MI/SUDENE. Ministério da Integração Nacional/Superintendência do Desenvolvimento do Nordeste. Nova Delimitação da Região Semiárida do Brasil/Resolução nº 115, de 23 de Novembro de 2017. Available online: https://www.gov.br/sudene/pt-br (accessed on 4 July 2022).
- Palácio, H.A.Q.; Andrade, E.M.d.; Santos, J.C.N.; Araújo Neto, J.R.; Brasil, P.P. Emergy evaluation of semi-arid watersheds under different management strategies. Trans. ASABE 2013, 56, 1357–1363. [Google Scholar] [CrossRef]
- Gutiérrez, A.P.A.; Engle, N.L.; De Nys, E.; Molejón, C.; Martins, E.S. Drought preparedness in Brazil. Weather. Clim. Extrem. 2014, 3, 95–106. [Google Scholar] [CrossRef]
- Marengo, J.A.; Alves, L.M.; Alvala, R.; Cunha, A.P.; Brito, S.; Moraes, O.L. Climatic characteristics of the 2010–2016 drought in the semiarid Northeast Brazil region. An. Da Acad. Bras. De Ciências 2018, 90 (Suppl. 1), 1973–1985. [Google Scholar] [CrossRef] [PubMed]
- Mariano, D.A.; Santos, C.A.; Wardlow, B.D.; Anderson, M.C.; Schiltmeyer, A.V.; Tadesse, T.; Svoboda, M.D. Use of remote sensing indicators to assess effects of drought and human-induced land degradation on ecosystem health in Northeastern Brazil. Remote Sens. Environ. 2018, 213, 129–143. [Google Scholar] [CrossRef]
- Novais, J.J.; Lacerda, M.P.; Sano, E.E.; Demattê, J.A.; Oliveira Jr, M.P. Digital soil mapping using multispectral modeling with landsat time series cloud computing based. Remote Sens. 2021, 13, 1181. [Google Scholar] [CrossRef]
- Mesquita, M.R.; Agarwal, S.; Morais Lima, L.H.G.d.; Soares, M.R.A.; Silva, V.C.; Werneck, G.L.; Costa, C.H.N. The use of geotechnologies for the identification of the urban flora in the city of Teresina, Brazil. Urban Ecosyst 2022, 25, 523–534. [Google Scholar] [CrossRef]
- Nascimento, D.M.d.; Sales, A.T.; Souza, R.; Silva, A.S.A.d.; Sampaio, E.V.d.S.B.; Menezes, R.S.C. Development of a methodological approach to estimate vegetation biomass using remote sensing in the Brazilian semiarid NE region. Remote Sens. Appl. Soc. Environ. 2022, 27, 100771. [Google Scholar] [CrossRef]
- Zhou, Y.; Li, X.; Liu, Y. Land use change and driving factors in rural China during the period 1995-2015. Land Use Policy 2020, 99, 105048. [Google Scholar] [CrossRef]
- Zahir, I.L.M.; Thennakoon, S.; Sangasumana, R.P.; Herath, J.; Madurapperuma, B.; Iyoob, A.L. Spatiotemporal Land-Use Changes of Batticaloa Municipal Council in Sri Lanka from 1990 to 2030 Using Land Change Modeler. Geographies 2021, 1, 166–177. [Google Scholar] [CrossRef]
- Kanga, S.; Singh, S.K.; Meraj, G.; Kumar, A.; Parveen, R.; Kranjčić, N.; Đurin, B. Assessment of the Impact of Urbanization on Geoenvironmental Settings Using Geospatial Techniques: A Study of Panchkula District, Haryana. Geographies 2022, 2, 1–10. [Google Scholar] [CrossRef]
- Magliulo, P.; Cusano, A.; Russo, F. Land-Use Changes in the Sele River Basin Landscape (Southern Italy) between 1960 and 2012: Comparisons and Implications for Soil Erosion Assessment. Geographies 2021, 1, 315–332. [Google Scholar] [CrossRef]
- Becker, W.R.; Ló, T.B.; Johann, J.A.; Mercante, E. Statistical features for land use and land cover classification in Google Earth Engine. Remote Sens. Appl. Soc. Environ. 2021, 21, 100459. [Google Scholar] [CrossRef]
- D’Odorico, P.; Bhattachan, A.; Davis, K.F.; Ravi, S.; Runyan, C.W. Global desertification: Drivers and feedbacks. Adv. Water Resour. 2013, 51, 326–344. [Google Scholar] [CrossRef]
- Vorovencii, I. Assessing and monitoring the risk of desertification in Dobrogea, Romania, using Landsat data and decision tree classifier. Environ. Monit. Assess. 2015, 187, 204. [Google Scholar] [CrossRef]
- Instituto Brasileiro de Geografia e Estatística (IBGE). Diretoria de Pesquisas—DPE—Coordenação de População e Indicadores Sociais—COPIS; Estimativas da população: 2021: Nota metodológica n. 01: Estimativas da população residente para os municípios e para as unidades da federação brasileiros, com data de referência em 1º de julho de 2021; IBGE: Rio de Janeiro, Brazil, 2022; 119p.
- Ávila, P.L.R.; Brito, J.I.B. Relação entre a Oscilação Decadal do Pacífico e a variabilidade de precipitação de Campina Grande, PB. Ciência E Nat. 2015, 37, 159–162. [Google Scholar] [CrossRef]
- Gorelick, N.; Hancher, M.; Dixon, M.; Ilyushchenko, S.; Thau, D.; Moore, R. Google Earth Engine: Plane-tary-scale geospatial analysis for everyone. Remote Sens. Environ. 2017, 202, 18–27. [Google Scholar] [CrossRef]
- Chander, G.; Markham, B.L.; Helder, D.L. Summary of current radiometric calibration coefficients for Landsat MSS, TM, ETM+, and EO-1 ALI sensors. Remote Sens. Environ. 2009, 113, 893–903. [Google Scholar] [CrossRef]
- USGS/NASA. United States Geological Survey/National Aeronautics and Space Administration. Landsat Satellite Missions. Available online: https://www.usgs.gov/land-resources/nli/landsat/landsat-satellite-missions (accessed on 2 August 2022).
- Huete, A.R. A soil adjusted vegetation index (SAVI). Remote Sens. Environ. 1988, 25, 295–309. [Google Scholar] [CrossRef]
- Huete, A.R.; Didan, K.; Miura, T.; Rodriguez, E.P.; Gao, X.; Ferreira, L.G. Overview of the radiometric and bi-ophysical performance of the MODIS vegetation indices. Remote Sens. Environ. 2002, 83, 195–213. [Google Scholar] [CrossRef]
- Barbosa, H.A.; Huete, A.R.; Baethgen, W.E. A 20-year study of NDVI variability over the Northeast Region of Brazil. J. Arid Environ. 2006, 67, 288–307. [Google Scholar] [CrossRef]
- Pontius Jr, R.G.; Millones, M. Death to Kappa: Birth of quantity disagreement and allocation disagreement for accuracy assessment. Int. J. Remote Sens. 2011, 32, 4407–4429. [Google Scholar] [CrossRef]
- MapBiomas Brazil Project—Collection [6.0] of the Annual Series of Land Use and Land Cover Maps of Brazil. Available online: http://mapbiomas.org/colecoes-mapbiomas-1?cama_set_language=pt-BR (accessed on 2 August 2022).
- Alencar, A.; Shimbo, J.Z.; Lenti, F.; Balzani Marques, C.; Zimbres, B.; Rosa, M.; Arruda, V.; Castro, I.; Fernandes Márcico Ribeiro, J.P.; Varela, V.; et al. Mapping Three Decades of Changes in the Brazilian Savanna Native Vegetation Using Landsat Data Processed in the Google Earth Engine Platform. Remote Sens. 2020, 12, 924. [Google Scholar] [CrossRef]
- Fendrich, A.N.; Barretto, A.; Faria, V.G.d.; Bastiani, F.d.; Tenneson, K.; Pinto, L.F.G.; Sparovek, G. Disclosing contrasting scenarios for future land cover in Brazil: Results from a high-resolution spatiotemporal model. Sci. Total Environ. 2020, 742, 140477. [Google Scholar] [CrossRef]
- Saraiva, M.; Protas, É.; Salgado, M.; Souza Jr, C. Automatic mapping of center pivot irrigation systems from satellite images using deep learning. Remote Sens. 2020, 12, 558. [Google Scholar] [CrossRef]
- Souza, C.M., Jr.; Shimbo, J.Z.; Rosa, M.R.; Parente, L.L.; Alencar, A.A.; Rudorff, B.F.T.; Hasenack, H.; Matsumoto, M.; Ferreira, L.G.; Souza-Filho, P.W.M.; et al. Reconstructing Three Decades of Land Use and Land Cover Changes in Brazilian Biomes with Landsat Archive and Earth Engine. Remote Sens. 2020, 12, 2735. [Google Scholar] [CrossRef]
- Arruda, V.L.; Piontekowski, V.J.; Alencar, A.; Pereira, R.S.; Matricardi, E.A. An alternative approach for mapping burn scars using Landsat imagery, Google Earth Engine, and Deep Learning in the Brazilian Savanna. Remote Sens. Appl. Soc. Environ. 2021, 22, 100472. [Google Scholar] [CrossRef]
- Diniz, C.; Cortinhas, L.; Pinheiro, M.L.; Sadeck, L.; Fernandes Filho, A.; Baumann, L.R.F.; Adami, M.; Souza-Filho, P.W.M. A Large-Scale Deep-Learning Approach for Multi-Temporal Aqua and Salt-Culture Mapping. Remote Sens. 2021, 13, 1415. [Google Scholar] [CrossRef]
- Rosa, M.R.; Brancalion, P.H.; Crouzeilles, R.; Tambosi, L.R.; Piffer, P.R.; Lenti, F.E.; Hirota, M.; Santiami, E.; Metzger, J.P. Hidden destruction of older forests threatens Brazil’s Atlantic Forest and challenges restoration programs. Sci. Adv. 2021, 7, eabc4547. [Google Scholar] [CrossRef]
- Silva, R.M.; Santos, C.A.; Moreira, M.; Corte-Real, J.; Silva, V.C.; Medeiros, I.C. Rainfall and river flow trends using Mann–Kendall and Sen’s slope estimator statistical tests in the Cobres River basin. Nat. Hazards 2015, 77, 1205–1221. [Google Scholar] [CrossRef]
- Santos, C.A.; do Nascimento, T.V.; da Silva, R.M. Analysis of forest cover changes and trends in the Brazilian semiarid region between 2000 and 2018. Environ. Earth Sci. 2020, 79, 418. [Google Scholar] [CrossRef]
- Mann, H.B. Non-parametric test against trend. Econom. J. Econom. Soc. 1945, 13, 245–259. [Google Scholar]
- Kendall, M.G. Rank Correlation Methods; Charles Griffin: London, UK, 1975; 199p. [Google Scholar]
- Sen, P.K. Estimates of the Regression Coefficient based on Kendall’s Tau. J. Am. Stat. Assoc. 1968, 63, 1379–1389. [Google Scholar] [CrossRef]
- R Core Team. R: A Language and Environment for Statistical Computing; R Foundation for Statistical Computing: Vienna, Austria, 2019. [Google Scholar]
- Warrick, A.W.; Nielsen, D.R. Spatial variability of soil physical properties in the field. In Applications of Soil Physics; Hillel, D., Ed.; Academic Press: Cambridge, MA, USA, 1980; 350p. [Google Scholar]
- ANA. Agência Nacional das Águas e Saneamento Básico. HidroWeb Portal: Collection of Hydrological Data. Historical Series of Seasons. 2022. Available online: https://www.snirh.gov.br/hidroweb/serieshistoricas (accessed on 2 August 2022).
- da Silva, J.L.; de Albuquerque Moura, G.B.; de França, Ê.F.; Lopes, P.M.; da Silva, T.T.; Lins, F.A.; de Oliveira Silva, D.A.; Ortiz, P.F. Spatial-temporal dynamics of the Caatinga vegetation cover by remote sensing in municipality of the Brazilian semi-arid. Rev. Bras. De Ciências Agrárias 2019, 14, 1–10. [Google Scholar] [CrossRef]
- da Silva, J.L.; de Albuquerque Moura, G.B.; da Silva, M.V.; Lopes, P.M.; de Souza Guedes, R.V.; e Silva, Ê.F.; Ortiz, P.F.; de Moraes Rodrigues, J.A. Changes in the water resources, soil use and spatial dynamics of Caatinga vegetation cover over semiarid region of the Brazilian Northeast. Remote Sens. Appl. Soc. Environ. 2020, 20, 100372. [Google Scholar] [CrossRef]
- Brandt, M.; Romankiewicz, C.; Spiekermann, R.; Samimi, C. Environmental change in time series–An inter-disciplinary study in the Sahel of Mali and Senegal. J. Arid Environ. 2014, 105, 52–63. [Google Scholar] [CrossRef]
- Campos, S.; Mendes, K.R.; Da Silva, L.L.; Mutti, P.R.; Medeiros, S.S.; Amorim, L.B.; Dos Santos, C.A.; Perez-Marin, A.M.; Ramos, T.M.; Marques, T.V.; et al. Closure and partitioning of the energy balance in a preserved area of a Brazilian seasonally dry tropical forest. Agric. For. Meteorol. 2019, 271, 398–412. [Google Scholar] [CrossRef]
- Coulibaly, B.; Li, S. Impact of agricultural land loss on rural livelihoods in peri-urban areas: Empirical evidence from Sebougou, Mali. Land 2020, 9, 470. [Google Scholar] [CrossRef]


Publisher’s Note: MDPI stays neutral with regard to jurisdictional claims in published maps and institutional affiliations. |
© 2022 by the authors. Licensee MDPI, Basel, Switzerland. This article is an open access article distributed under the terms and conditions of the Creative Commons Attribution (CC BY) license (https://creativecommons.org/licenses/by/4.0/).