Article

Toward Sustainable Urban Drainage Planning? Geospatial Assessment of Urban Vegetation Density under Socioeconomic Factors for Quito, Ecuador

by
René Ulloa-Espíndola
1,2,3,*,
Elisa Lalama-Noboa
4 and
Jenny Cuyo-Cuyo
1,4
1
Investigación, Desarrollo e Innovación, Empresa Pública Metropolitana de Agua Potable y Saneamiento de Quito, EPMAPS Agua de Quito, Quito 170519, Ecuador
2
ETSI Agronómica, Alimentaria y de Biosistemas, Universidad Politécnica de Madrid, Ciudad Universitaria sn, 28040 Madrid, Spain
3
Departament de Geografia, Universitat Rovira i Virgili, 43480 Tarragona, Spain
4
WorldGeo, Estudios Geoespaciales, Quito 170501, Ecuador
*
Author to whom correspondence should be addressed.
Geographies 2022, 2(3), 397-418; https://doi.org/10.3390/geographies2030025
Submission received: 1 May 2022 / Revised: 8 June 2022 / Accepted: 27 June 2022 / Published: 7 July 2022
(This article belongs to the Special Issue A GIS Spatial Analysis Model for Land Use Change (Volume II))

Abstract

:
Natural or anthropogenic urban vegetation is an important resource for urban planning, risk assessment, and sustainable development of a city. Quito is a megadiverse city due to its location and topography, but the socioeconomic diversity generates more contrasting conditions of certain behaviors and habits related to urban infrastructure. The contrasts of vegetation and green spaces in the different sectors of Quito also reflect the diversity of the city. This study examines the effects of socioeconomic conditions on the loss or increase of urban vegetation. The exploratory regression method (spatial) and logit model (non-spatial) were used to explain the socioeconomic effects on urban vegetation density at the level of urban parishes. On the one hand, the Normalized Difference Vegetation Index (NDVI) was calculated as the dependent variable based on the 2021 sentinel images. On the other hand, the independent variables were structured based on the socioeconomic level, the land valuation areas of Quito (AIVAS), and the quality of life index. This article contributes to establishing baseline information that helps structure the conditions, strategies, and investments to design and implement plans and programs for urban drainage, ecosystem benefits, and sustainable development in the city of Quito.

1. Introduction

The most sustainable cities in the world are characterized by having a high proportion of natural and anthropic green spaces, as well as diverse habitats with urban vegetation and biodiversity [1].
The traditional approach to urban planning, originally aimed to improve sanitary conditions in cities, has changed to a paradigm of sustainability that incorporates urban green spaces into the city to create a more attractive environment for the inhabitants themselves.
According to [2], approximately 80% of residents of urban areas worldwide are exposed to air pollution levels above those established in the World Health Organization’s air quality guidelines (WHO). In addition, rapid and unsustainable urbanization has significant environmental and social consequences, when urban infrastructure is abruptly introduced without preserving sufficient green spaces in the city and the recreation of its inhabitants. The impact of vegetation in the city is of great concern to decision-makers and planners of public policies, mainly due to urban expansion.
Planning and integrating vegetation into the urban system brings systematic benefits on three interrelated axes: (1) the social axis, which improves citizens’ quality of life through comfortable environments for coexistence and recreation; (2) the ecological axis, vegetation mitigates urban impacts that negatively affect the environment, such as e.g., temperature, noise, cityscape, but mainly as a complement to prevent flooding, landslides, and alluvial deposits; and (3) the economic axis, the acquired social benefits, by increasing the quality of life, directly increases the value of the land and consequently acquires an added value [3].
Parks, green spaces, streams with natural vegetation, and watercourses located within the city are generally public spaces that need to be studied as part of a strategic interest to combat threats such as climate change, which is defined in the Sustainable Development Goals (SDGs), including sustainable cities, public health, and conservation. Several studies also demonstrate the impact of incorporating urban green spaces on community health. Among the most important are mental health, depression, and reductions in mortality from cardiovascular disease, obesity, and diabetes [4].
Refs. [5,6] agree that cities need trees and water to be habitable. They also articulate the public perception and impact of failed urban planning leading to the loss of urban vegetation.
One oft-repeated phrase that has become an “unconfirmed truth” is the one that establishes a minimum of 9 m2 of green space per inhabitant, purportedly from the World Health Organization (WHO). However, there is no source that confirms these values. Ref. [7] compiles the analysis of 386 European cities with population densities comparable to Latin American cities and gives values between 15 m2 and 50 m2 of green space per inhabitant. Similarly, [8] identifies the range between 3 m2 and 12 m2 per inhabitant.
Latin American cities are generally lower than the average issued by WHO and much lower than the European average. In this way, a relationship can be established between the level of economic development of Latin American countries and public green spaces [9]. This, interpolated to the city of Quito and complemented by the observation of the different urban sectors of the city, allows us to assume that, in general, the maintenance of the richness of urban vegetation in general depends largely on the socioeconomic level and development of the different sector.
In addition, cities will increasingly need to increase their resilience to cope with the impacts of climate change and natural disasters within them. Urban heat islands and unexpected flooding are expected to increase as cities grow [10]. Urban vegetation and green spaces established throughout the city are directly related to sustainable urban drainage practices (SUD), which provide environmental and social benefits; they also help manage the complications caused by rainwater and stormwater (runoff) [11].
Classical approaches to the study and planning of Green Infrastructure (GI) focus only on social benefits related to recreation and landscape; strongly associated with the concept of the “garden”, which has led to GI urban planning being underestimated in recent decades and appearing as a low priority in public policy [12,13]. GI appears strongly in the design and planning of urban and peri-urban environments only in the last two decades [14].
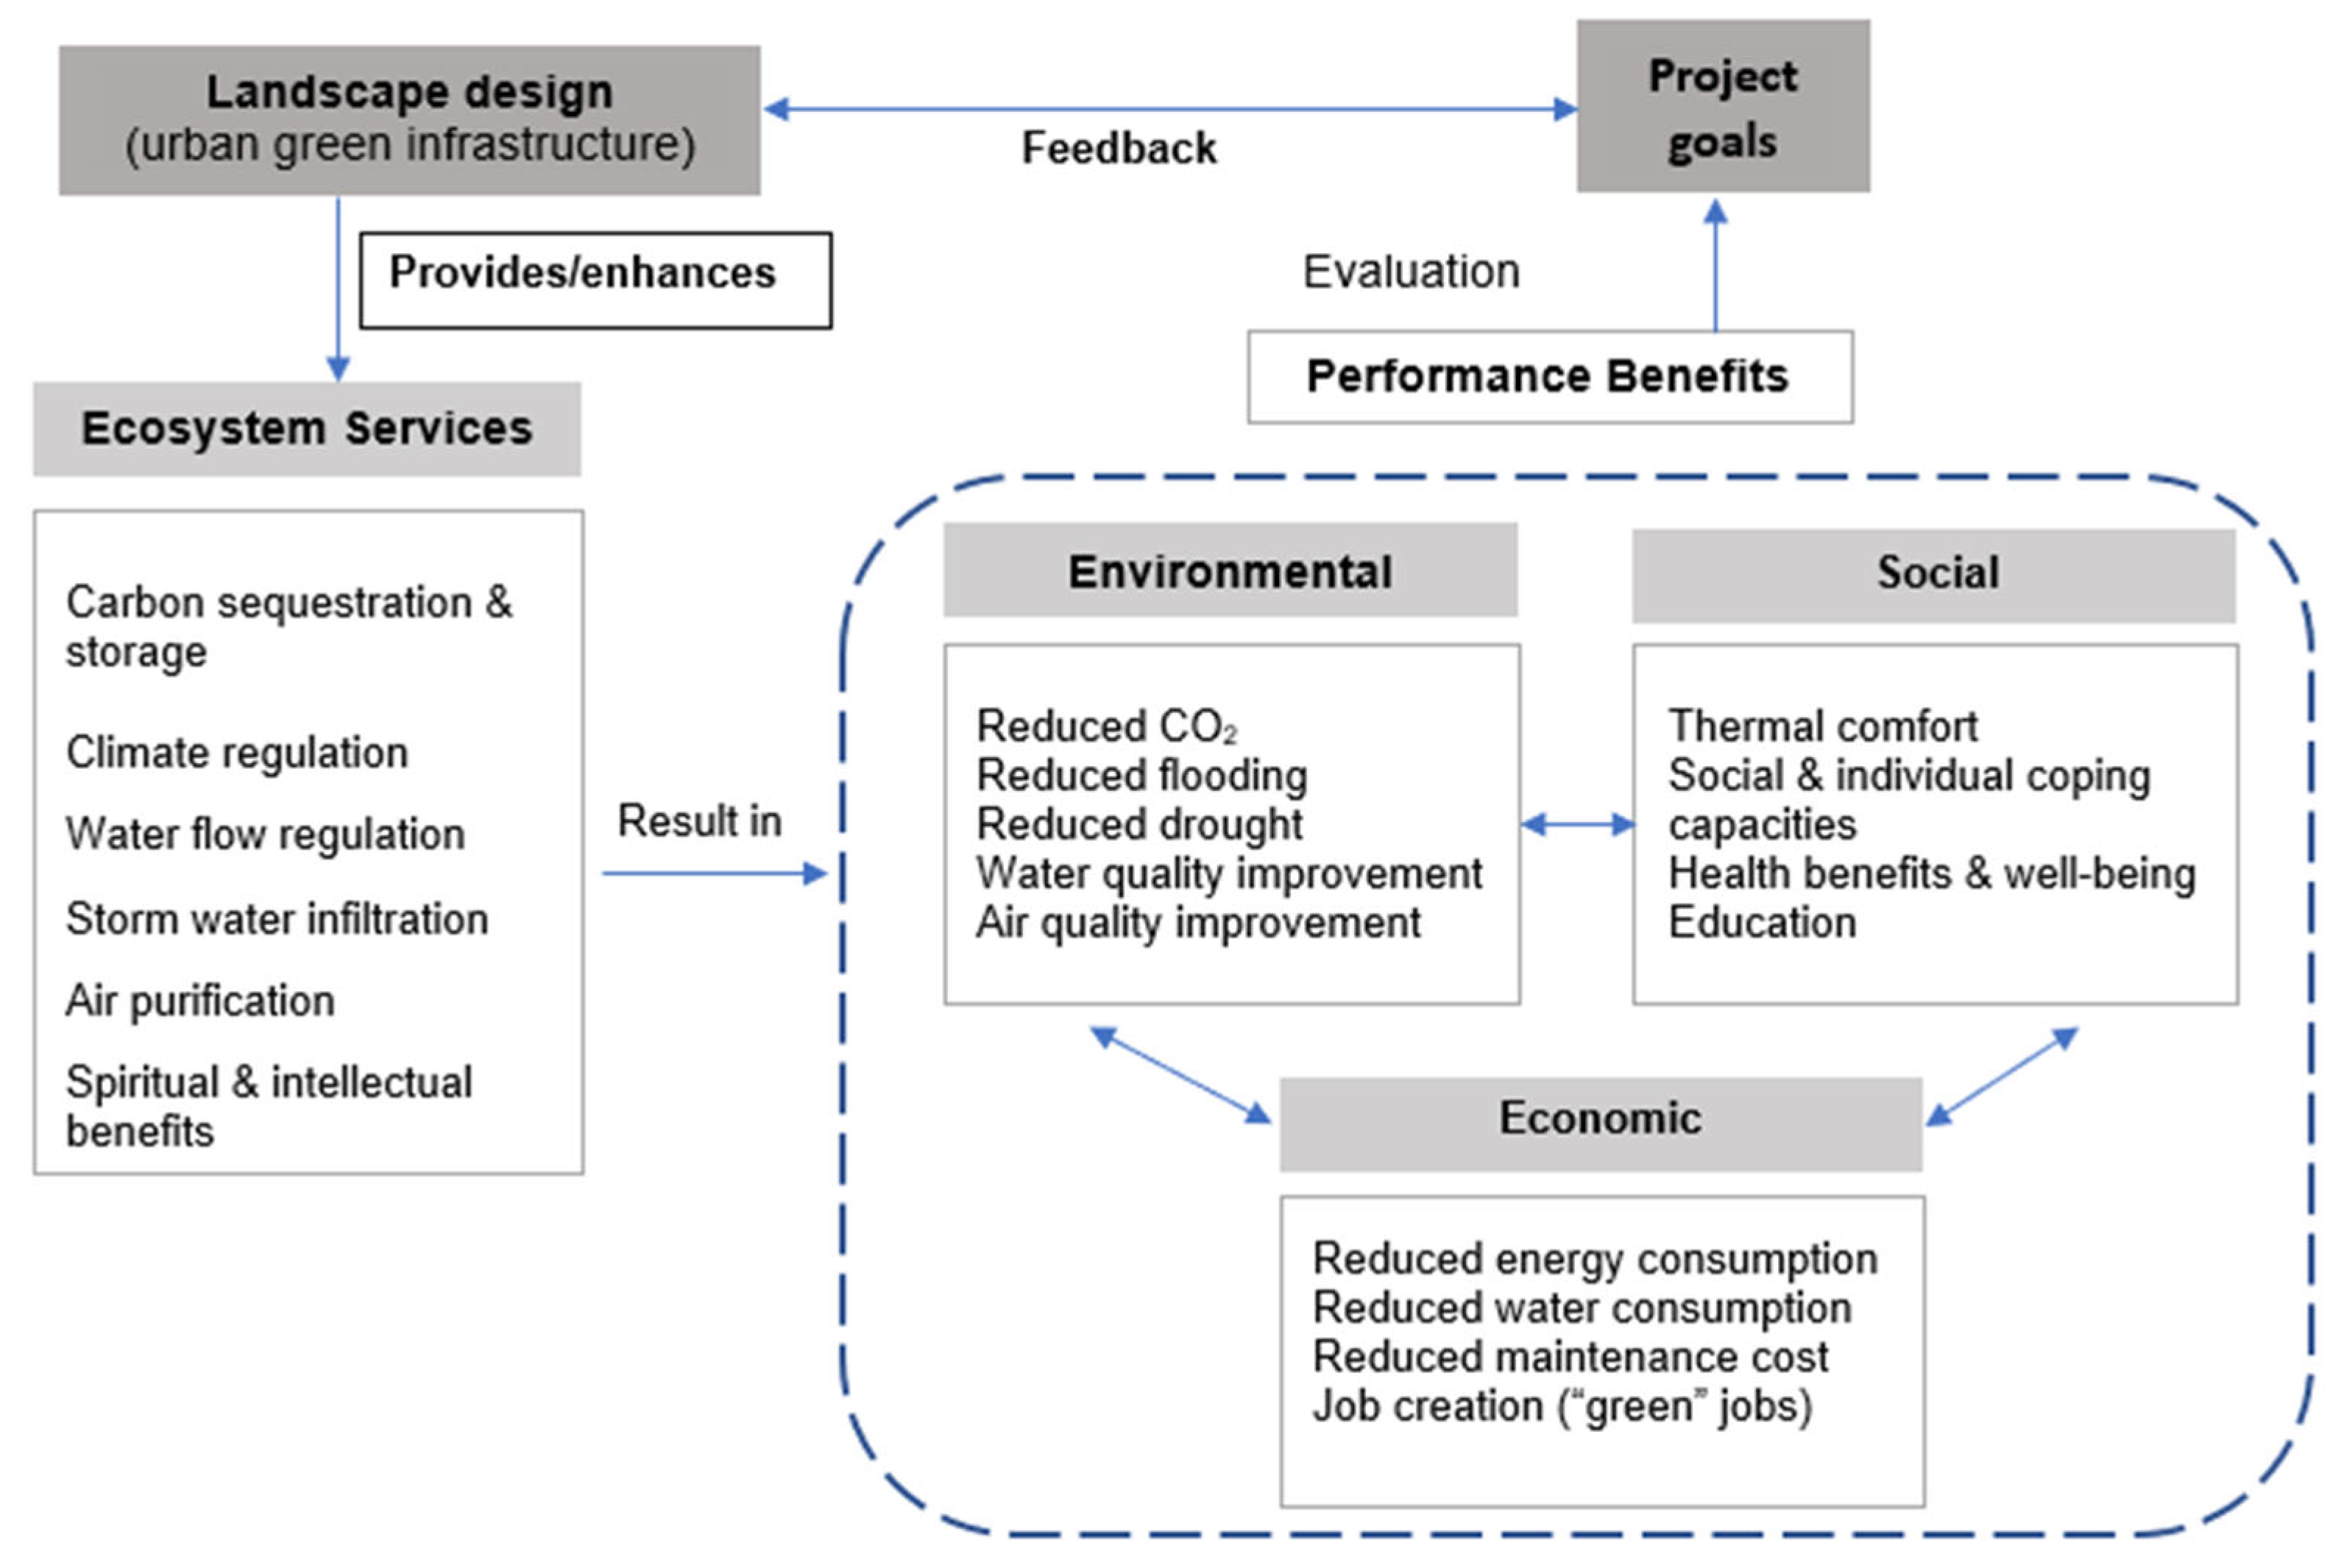
For [15], urban GI is a system of green spaces that maintain the value of natural ecosystems [16,17,18], which states that urban green spaces have biophysical properties that help cities adapt to climate change. Figure 1 shows the cycle of benefits and the evolution of ecosystem services provided by GI.
According to [19], GI can be defined as “an interconnected network of green spaces that preserves the functions and values of natural ecosystems and provides corresponding benefits to human populations”. In this way, what [20,21] say about understanding cities as sustainable ecological-sociological-economic systems is confirmed. Urban green space refers to a variety of green open spaces, for example, public parks, residential gardens, green roofs, and street trees [22].
Apart from an absolute definition of urban GI, it is built by its origin and concepts related to scientific and technical approaches to urban growth, environmental protection, quality of life, socio-economic realities, links between urban environments, and natural urban drainage, among others, which form the link between theoretical bodies and practice in the context of urban planning. However, the gap in technical and methodological frameworks linking the city to ecosystem services and GI is still large, especially in regions such as Latin America and the Caribbean (LAC) [23].
According to [24,25], the elements of GI at different levels that maximize social benefits and ecosystem health can be classified as follows: (1) Neighborhood level: squares, green roofs, and walls, tree-lined streets, private gardens, institutional open spaces, ponds and streams, right-of-way, pedestrian and bicycle paths, cemeteries, sports fields, small forests, streams, orchards, wastelands; (2) City level: rivers and floodplains, intermunicipal parks, urban canals, lagoons, urban forests, natural parks, contiguous water areas, urban plazas, hills, large recreation areas, estuaries, wastelands, community forests, agricultural lands, landfills, and; (3) regional level: Protected wilderness areas, national parks, coasts and beaches, strategic and long-distance trails, forests, shelterbelts in power lines, road and rail networks, designated greenbelts, agricultural lands, rivers and floodplains, canals, mountain ranges, aqueducts, fault lines, and lakes.
The importance of maintaining urban GI becomes more relevant in situations of high globalized uncertainty, especially those related to climate change and the associated impacts of global warming [26]. For example, one of the most prominent and consistent benefits of urban vegetation is the reduction and control of urban surface temperature by providing shade while absorbing solar radiation (transpiration and photosynthesis) [27].
The systematic implementation of GI leads to the transformation of cities into so-called eco-cities, which are characterized by the maintenance of an ecological approach to urban design. That is, cities are understood as ecosystems where technologies to protect the environment, economic activities, and waste are efficiently managed to protect the environment. Reducing urban heat islands and promoting the use of GI are also components that stand out in this concept [28]. Similarly, eco-neighborhoods and eco-communities are derivatives of eco-city trends due to the need to create green spaces at the residential level and ensure ecosystem services within cities.
GI-based planning and design approaches have become best practice for achieving the concept of urban resilience because of their multifunctionality. They also support urban policies to address environmental issues, including stormwater regulation, air quality, urban heat islands, and landscape connectivity [29].
The presence of natural or anthropogenic urban vegetation in the city plays a key role in different approaches and dimensions in the territories, e.g., SUDs are part of GI and their functionality can be compared to traditional urban stormwater management systems (including unified networks and stormwater and wastewater disposal) [30].
The approach of SUD can be traced back to the “Clean Water Act” and the National Pollution Discharge Elimination System of the United States of America, which introduce these techniques as Best Management Practices (BMPs) and complement conventional stormwater treatment. Since then, SUDs have been viewed as more flexible and efficient drainage systems to manage the risks associated with runoff and urban flooding (stormwater quality and quantity) and to improve the landscape of the city [31,32].
According to the ICLEI European Secretariat (2011), SUDs are considered management and planning techniques that attempt to replicate hydrologic processes such as infiltration, filtration, storage, lamination, evapotranspiration, and others, but primarily techniques for controlling runoff and integrative resources of the urban landscape. Ref. [33] argues that SUDs as a whole mimic the behavior of a hydrographic basin in its natural state, helping to improve the condition of water masses, protect against floods and droughts, adapt and mitigate climate change (CO2 sinks), reduce solids entrainment, provide ecosystem services, and enhance green spaces.
Over the past three decades, the growing need in LAC cities to improve stormwater and runoff management to mitigate the impacts of urban flooding has motivated the application of BMPs through regulations and ordinances that encourage their use and application. For example, European, North American, and Australian countries have their own SUD regulations, manuals, and drafts [34]. According to [35], the reduction in water treatment costs when using SUD techniques is generally between 18% and 50%.
The drastic change in land use in cities and their sphere of influence, due to economic development and population growth, primarily results in natural ecosystems being altered and replaced by buildings and roads (grey infrastructure), which inevitably changes the quality of life of residents, for better or worse [36]. As a result, the provision of ecosystem services provided by urban vegetation is becoming increasingly complex, especially in regions such as LAC [37].
Currently (2022), the ecosystem benefits of urban vegetation are recognized worldwide. However, many cities around the world do not provide adequate conditions for access and use of this resource [38,39]. According to [39,40], socioeconomic factors have proven to be one of the limiting factors in the provision and public amenities of urban green spaces and elements in quality and quantity; resulting in the most disadvantaged socioeconomic groups lacking urban IG.
In LAC cities, where 80% of the population lives in cities with marked social inequality [41,42,43]. The authors [42,43,44] found that citizens with better economic income in Santiago de Chile have better access to green spaces and tree species. In the case of Bogotá, a lower occurrence of GI was found in the poorest areas of the city [45].
The objective of this study is to establish the relationship between the density of urban vegetation and the socioeconomic conditions of urban areas in the city of Quito, Ecuador, using Geographic Information Systems (GIS), spatial analysis, and remote sensing. In this way, the conservation, maintenance, and inclusion of vegetation areas in 2021 are evaluated under the influence of socioeconomic factors. The specific question underlying this study is: to what extent do the socioeconomic situation and the quality of life of the inhabitants of Quito influence the conservation and maintenance of anthropogenic and natural urban vegetation?

2. Materials and Methods

There are two parts to this investigation:
  • determine the relationship between socioeconomic conditions and urban vegetation density. Exclude areas of urban expansion, large parks (emblematic parks and metropolitan parks), and streams located within the Hyperconsolidated Longitudinal Urban Core (HLUC).
  • determine the density of vegetation at the parish level in the HLUC.

2.1. Study Area

The study area (Figure 2) includes the 32 urban parishes of the city of Quito in the Metropolitan District of Quito (Quito Canton), Pichincha Province, Ecuador. The city of Quito is located in the eastern Andes, on the slopes of the active volcano Pichincha, forming a closed landscape. The average altitude is 2850 m above sea level. Quito is the capital of Ecuador. The city is bounded on the north by the Casitagua volcano, on the east by the geological fault “Falla de Quito”, on the east by the eastern slopes of Pichincha, and on the south by the Atacazo volcano. The city is 50 km long (south-north) and 4 km wide (east-west).
The prevailing climate corresponds to the temperate mountain climate, characterized by two distinct seasons, a prolonged rainy season (October–May) and a four-month dry season (June–September). Despite the city’s altitude, Quito experiences spring-like weather most of the year, as the city is located in the middle of the world. According to the official website [46], Quito’s Green Urban Index (GUI) reached 21.6 m2 of green space per inhabitant in 2018. In addition, in 2020, the city was recognized as one of the Tree Cities of the world by the “Tree Cities of the world” program of the Food and Agriculture Organization of the United Nations (FAO). Quito also has a public policy to expand green spaces as part of the Metropolitan Territorial Planning Plan [47]. However, some areas of the city still lack vegetation, especially in the interior of the city.
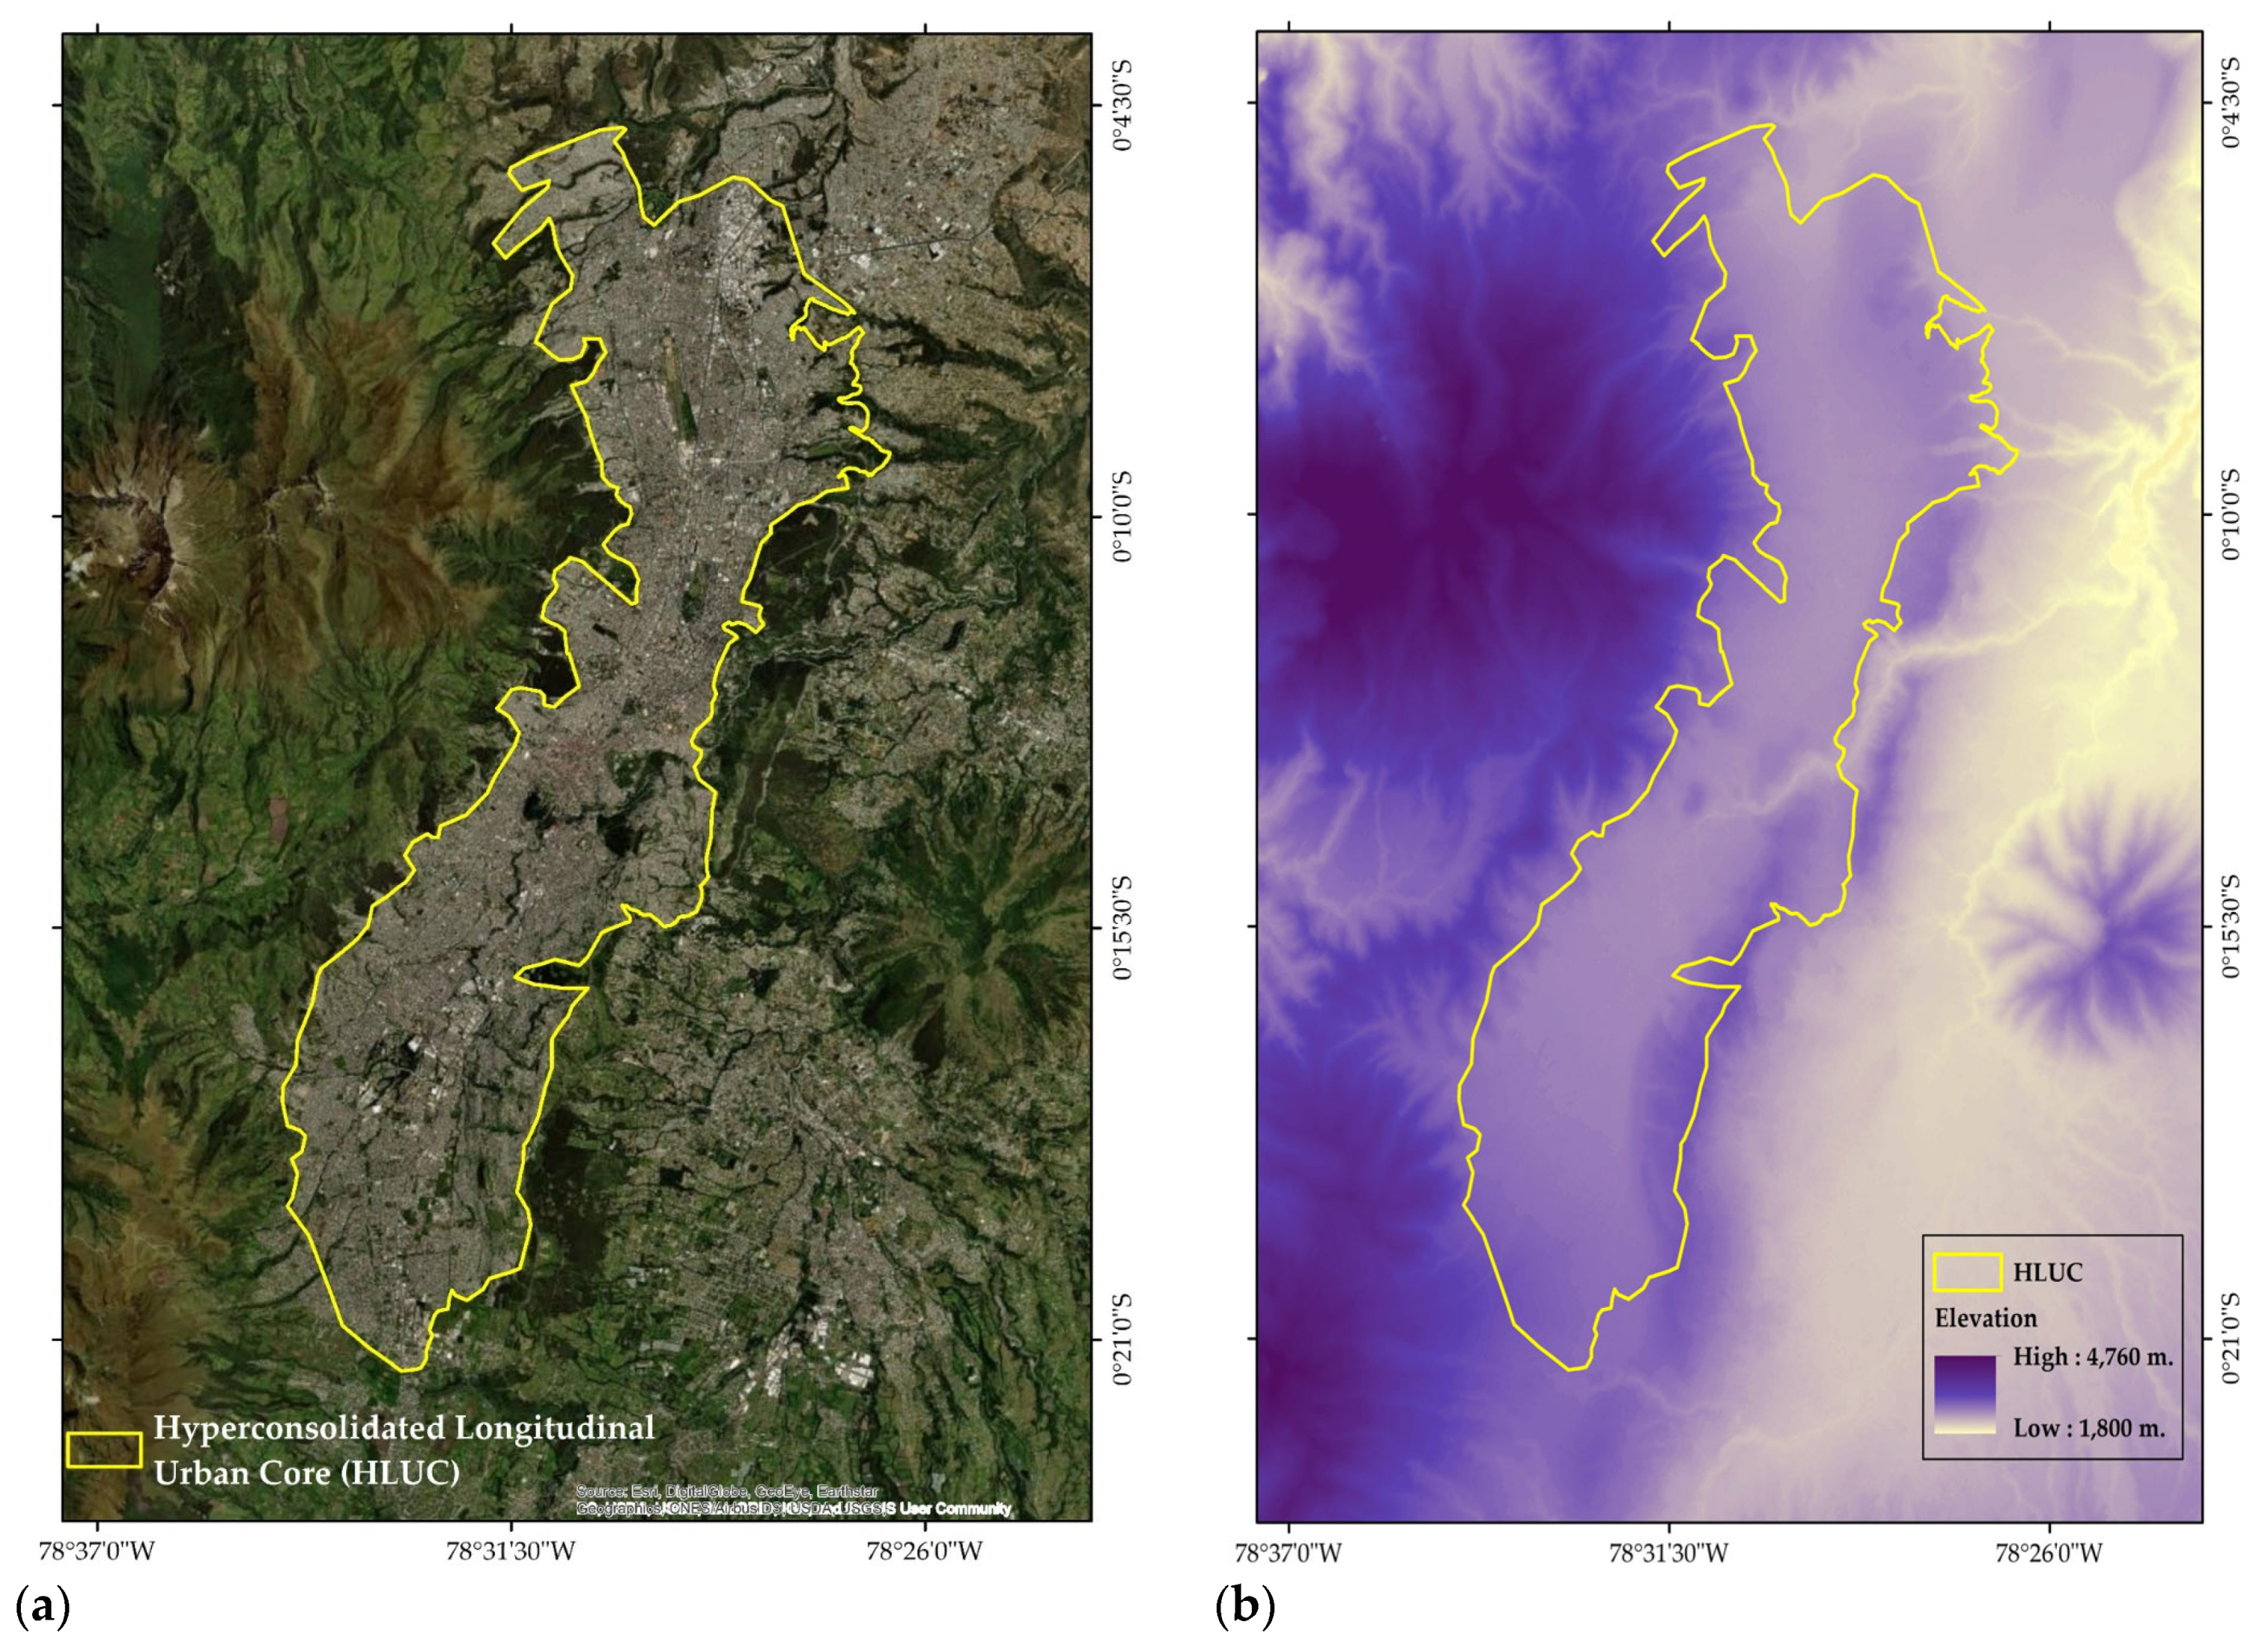
The analyzes of this study are carried out in the “hyperconsolidated longitudinal urban core” (HLUC) of the city of Quito (Figure 3a), that is, in the consolidated urban areas where urban infrastructure (grey infrastructure) is predominant so that it can be assessed whether the city has a friendly green behavior, i.e., whether it preserves natural vegetation and green infrastructure. HLUC is a relatively flat area (Figure 3b) where the natural vegetation has been virtually completely altered by urbanization. Moreover, it is the area where the social, economic, and environmental dynamics typical of the city take place; most importantly, HLUC is at high risk of flooding at certain times of the year, due to its location and topography. The HLUC represents the predominant grey infrastructure patch in the city, this area is extracted to perform subsequent analyzes.

2.2. Resources for Information and Preparation

The information considered in this work is geographical information collected by different institutions between international platforms, the national government of Ecuador, and the local government of the city of Quito (Table 1) (see details below):
I1. The image of the Sentinel-2 satellite was downloaded from the EO Browser platform (https://apps.sentinel-hub.com/eo-browser/, accessed on 21 October 2021) and is dated 4 August 2021 (identifier: S2A_MSIL2A_20210804T153621_N0301_R068_T17MQV_20210804T211530). The sentinel image acquired has processing level 2A (L2A), meaning it includes scene classification and upper atmosphere correction, the main output of level 2A is an orthoimage with reflectance corrected. Bands 8 (near infrared, VNIR) and 4 (red, R) of the images allowed the calculation of the Normalized Difference Vegetation Index (NDVI) using the Formula (1). This index normalizes green leaf scattering in Near Infra-red wavelengths with chlorophyll absorption in red wavelengths. In this way, the vegetation in the study area was quantified [48,49].
NDVI = (VNIR − R)/(VNIR + R)
Then, the values above 0.2 to 1 of the index corresponding to shrubs, grass, trees, and forests are extracted from the resulting coverage (NDVI).
They are then vectorized into polygons in shapefile format and the density of vegetation in each territorial unit (AIVAS and parishes) is calculated (Figure 4).
The process and analyses were performed using ArcGIS Pro® version 2.9 software.
I2. The AIVAS are areas that preserve homogeneous physical and economic characteristics and behaviors. The basic criteria for the delimitation of the AIVAS are administrative, urban (land use, services, and infrastructure construction category), market, and economic-social conditions, the main data of this resource is the value of land ($/m2). The HLUC considered in this study consists of 1054 AIVAS. AIVAS is a cartographic product in geospatial shapefile format (polygon). The AIVAS are managed and updated every two years by the local government of Quito (Figure 5a).
I3. The cartographic products of the socioeconomic level are based on the Census of Population and Housing 2010, produced by the National Institute of Statistic and Censuses of Ecuador, and are spatialized considering the “census sector” as the minimum unit of analysis (subdivision of parishes for statistical purposes and data collection). This resource provides an attribute that combines four dimensions: housing characteristics, basic services, educational level, and economic sectors. It represents the ability to have access to a set of goods and lifestyles [50,51]. This resource is classified into five levels: high, middle high, middle, middle low, and low [52] (Figure 5b) (product in geospatial shapefile format (polygon).
I4. The Quality of Life index cartographic resource is a multidisciplinary statistical indicator that allows the comprehensive and comparative identification of the quality of life at the level of the Metropolitan District of Quito. This is based on objective and subjective dimensions such as security, services, land and housing, mobility, environment, green spaces, health, education, integration, well-being, cohesion, and leisure [53]. This index is presented as a percentage (%) (Figure 5c) (product in geospatial shapefile format (polygon).
I5. Urban park resources are registered in the system of the open government system of Quito. They were calculated at the AIVAS level.
In this way, the dependent variable is the percentage of vegetation (vegetation density—I1) calculated in relation to the total area of each AIVAS and each parish. The independent variables (explanatory variables) are I2, I3, I4 & I5. The explanatory variables are presented at the AIVA and parish levels.

2.3. Relationship between Urban Vegetation Density and Socioeconomic Factors in HLUC of Quito, AIVAS Level

2.3.1. Spatial Statistical Analysis

The analysis of the relationship is based on: (1) measuring the spatial autocorrelation (global Moran’s I) of the vegetation density variable, based on the location of each AIVA and the attribute of the variable (I1). The analysis evaluates whether the expressed pattern is clustered, dispersed, or random. It also reports the z and p-values, which allow the evaluation of significance [54]. (2) Evaluation of all possible combinations of the exploratory variables by exploratory regression. This tool explores each combination of the explanatory variables to find the best one. That is, it tries to find the Ordinary Least Squares (OLS) model that passes all diagnoses: coefficient p-value, VIF (Max Variance Inflation Factor), Jarque Bera minimum p-value, and spatial autocorrelation p-value. acceptable minimum [55]. Therefore, the most favorable combination of explanatory variables is expected to be an OLS model that maintains the following:
  • the coefficients of the explanatory variables are statistically significant
  • the coefficients reflect the expected or at least a defensible relationship between each explanatory variable and the dependent variable
  • the explanatory variables are not redundant, the VIF values are smaller than 7.5
  • normally distributed residuals indicate that the model is free of bias (the Jarque-Bera p-value is not statistically significant)
  • randomly distributed above and below predictions, indicating that the model residuals are normally distributed (the p-value for spatial autocorrelation is not statistically significant) [56].
The analyzes were performed using ArcGIS Pro® version 2.9 software (Esri, Quito, Ecuador).

2.3.2. Non-Spatial Statistical Analysis, Logit Model

Logistic regression is a binary classifier that uses a function to predict the probability of a categorical dependent variable (I1) containing data coded as features of interest [57,58]. The hypothesis of this paper assumes that each AIVAS must maintain at least 30% of vegetation (natural or anthropogenic) to provide ecosystem services that promote the general well-being of its inhabitants. Therefore, the AIVAS with a vegetation density of less than 30% are coded “1” as a feature of interest, while AIVAS with a vegetation density of more than 30% are coded “0” (I1-1: vegetation density ≤ 30%; I1-0: vegetation density > 30%) (Table 2). With this consideration, the probability of the presence of vegetation explained by the independent variables (I2, I3, I4 & I5) is estimated using Formula (2).
E ( y ) = ρ = e X β 1 + e X β = e β 0 + β 1 X 1 + β n X n 1 + e β 0 + β 1 X 1 + β n X n
β0, β1, …, βn: intercept and constants; X1, X2, …, Xn: explanatory variables.
After testing various logistic models, it was determined that variables I3 and I4 were not statistically significant in their original form. Therefore, these variables were categorized based on their statistical frequency for inclusion in the logit model, as follows (Table 2):
To determine and evaluate the predictive capacity of the logistic model, a Receiver Operating Characteristic Curve (ROC) was constructed and the area under the curve (AUC) was calculated. Furthermore, the goodness of fit of the logistic model is evaluated by the omnibus statistic
The logit model was executed with the R version 4.2.0 (The R Foundation) (free software environment for statistical computing and graphics).

2.4. Parish-Level Analysis of the HLUC

For the analysis, only the areas of the parishes that are within the HLUC are considered, and based on this, the percentage of existing vegetation is calculated. In the first instance, the level of vegetation in each HLUC parish is analyzed, then the relationship between the percentage of vegetation in each parish and the quality-of-life index is evaluated. They are analyzed under a spatial autocorrelation on the vegetation density variable and the OLS method. At the parish level, the ability to cope with heavy precipitation events and flooding in HLUC areas is analyzed.

3. Results

3.1. Spatial Statistical Analysis

Table 3 shows the results of the statistical analysis of the spatial autocorrelation of vegetation density (I1) under the following settings: Conceptualization of spatial relationship = inverse distance, distance method = Euclidean and standardization = the spatial weighs are standardized; each weight is divided by its row sum (the sum of the weights of all neighboring features). Figure 6 shows that given the z-score of 29.696007, there is less than a 1% probability that this clustered pattern is the result of random chance, and Figure 7 shows vegetation density and AIVAS level.
Table 4, Table 5, Table 6, Table 7, Table 8 and Table 9 show the intercept of the models and the regression coefficients for the predictors, as well as the results of the exploratory regression related to the relationship between urban vegetation density and socioeconomic conditions, also including variable I5. Independent variable (I1), explanatory variables (I2, I3, I4, I5).
AdjR2 values are considered a measure of the performance of the model derived from the regression equation [59]. In Table 5, Table 7 and Table 9, it can be observed that the models can explain only up to 11% of the variation in the dependent variable in each combination of variables. Moreover, the SA values are equal to 0 in all cases, which means that they do not contribute to the prediction or modeling of the dependent variable. The AICc values, which can be used to compare the different models (meaning that the lowest value is an indicator of the best model), are very high and similar to each other. It should be noted that the VIF values, which measure the redundancy between the explanatory variables, are low and the explanatory variables are obviously not redundant (Table 10).
Table 11 shows that variables I2 and I3, which correspond to socioeconomic factors, are significant but explain little of the dependent variable I1.

3.2. Non-Spatial Analysis, Logit Model

There were 614 AIVAS identified with vegetation density less than 30% (I1-1) and 440 AIVAS greater than 30% (I1-0). Table 12 shows the results of the regression with the logit model.
The intercept is statistically significant, p-value < 0.05 and z > |2|, that is, if it explains the model.
The categories of variable I3 (I3-1, I3-2), are statistically significant, with p-value < 0.05 and z > |2|, i.e., that the middle, middle-high, and high socioeconomic levels have a greater probability of affecting the vegetation density of I1-1 (≤30%) than the middle low and low socioeconomic levels. This is justified by the fact that the middle-low and low levels have higher vegetation density.
Category “1” of variable I4 (I4-1) is statistically significant, p-value < 0.05 and z > |2|. I4-1 has a greater probability of affecting the vegetation index of I1-1 (≤30%) compared to I4-0. The category I4-2 is not statistically significant, p-value > 0.05 and z < |2|.
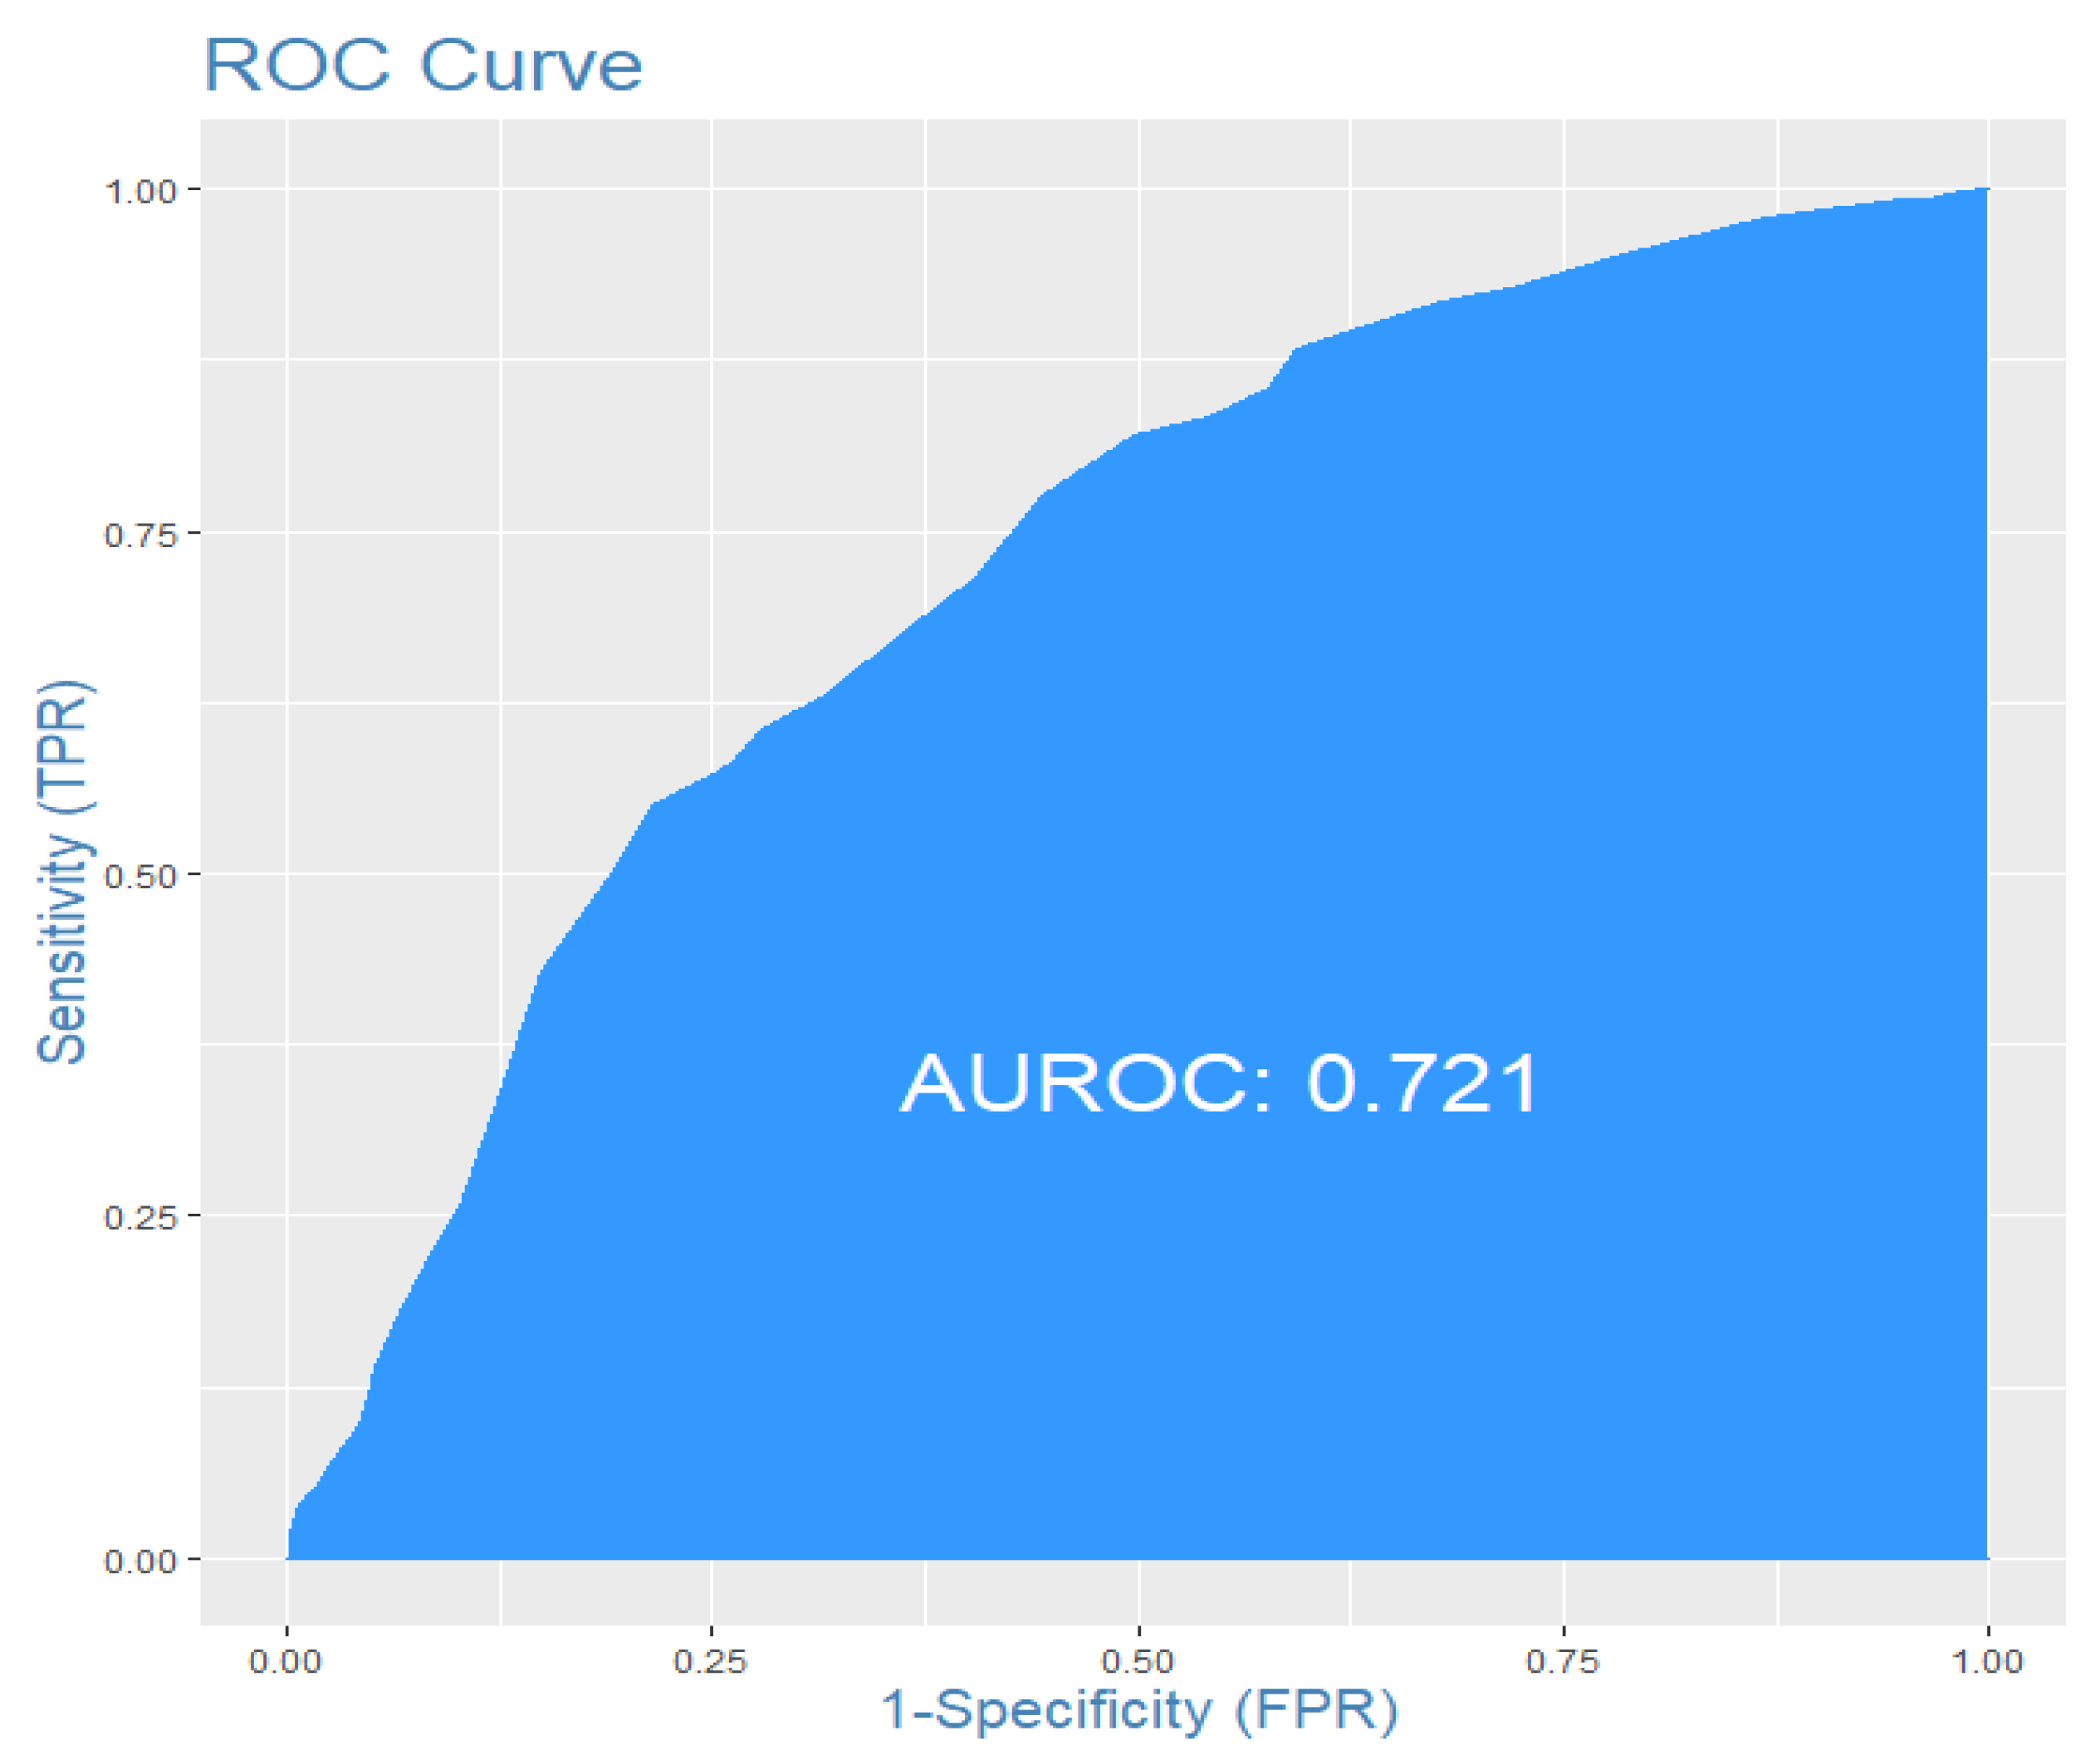
Figure 8 shows the accuracy of the model using the AUC of ROC, which in this case is 0.72, i.e., the prediction of the model is quite acceptable, being close to 1. Table 13 shows the global measures of fit associated with the estimated Logit model of explanatory variables related to vegetation density.

3.3. Analysis at Parish Level

Table 14 shows the results of the statistical analysis of the spatial autocorrelation of vegetation density at parish level (I1) under the following settings: conceptualization of spatial relationship = inverse distance, distance method = Euclidean, and standardization = the spatial weighs are standardized; each weight is divided by its row sum (the sum of the weights of all neighboring features). Figure 9 shows that given the z-score of 0.228154883913, the pattern does not appear to be significantly different than random, and Figure 10 shows the density of vegetation in the HLCU at the parish Level.
Table 15 and Table 16 show the only model run at the parish level. It shows a higher AdjR2 value than at AIVAS level, but it is still low, the model manages to reach 20%. Variable I4 (Figure 5c) turns out to be significant, although not very explanatory.

4. Discussion

Refs. [45,60] analyze tree inequality in Bogotá in relation to socioeconomic strata. Ref. [61] similarly refers to socioeconomic characteristics as predictors of GI. This study analyzes the distribution of natural and anthropogenic vegetation, including trees in the HLUC of Quito, and its relationship with socioeconomic factors.
The accuracy of the analysis of this work is based on the AIVAS, which is a more accurate territorial approximation than the urban parishes (much larger areas than the AIVAS), and it is also analyzed at the parish level. Ref. [37] analyzes the distribution of public GI based on the zonal planning units of the city of Bogotá, which are units with similar land use and urban development, analogous to the AIVAS. These approximations make it possible to better relate socioeconomic conditions to vegetation density and also assess the resilience, sustainability, habitability, and ecosystem services of the AIVAS.
The importance of calculating NDVI within cities has become increasingly important to create indicators for planning and design. Ref. [62] evaluates the greening and activities that take place in the neighborhoods of Warrnambool, Australia, using the NDVI, Ref. [37] estimates forest cover in urban areas at the level of the planning area of Bogotá (larger than a neighborhood). Therefore, the calculation of the NDVI to quantify the green areas at the level of AIVAS is practical in this work.
The modeling of urban vegetation is countless and serves different purposes, for example, modeling thermal and energy regulation (urban microclimate) as shown in the work of [63], evaluating the relationship between GI and SUDs [64] or studies on hydrological modeling with the work of [65]. In this case, the relationship between socioeconomic factors and urban vegetation density is evaluated by a spatial and non-spatial statistical study combined with remote sensing (NDVI). However, it should be taken into account that the calculation or approximation of socioeconomic factors is complex since it is not an observable variable in itself [66]. and therefore, there is no specific formula to determine the phenomenon, but methods that take into account variables that allow differentiation of layers and grouping of areas with similar characteristics. This can be demonstrated in the study of [37,42,45].
Refs. [6,67] comment on the negative socio-environmental impacts and consequences of replacing green spaces with grey infrastructure. Ref. [68] also assesses vegetation changes associated with urbanization processes. In addition to assessing vegetation density in sectors where grey infrastructure is prevalent, this study proposes basic analyzes and studies to characterize issues related to city surface temperature (heat islands), urban drainage, green space restoration, and the creation of more GI in the HLUC.

5. Conclusions

Satellite resources that have the elements (sensors-bands) to calculate NDVI are an indispensable tool for this type of study. Sentinel L2 imagery provides spatial resolution up to 10 m., which means that up-to-date information is available to analyze vegetation density in a space-time approach.
Because of the multiple social, environmental, and economic interactions among residents in the HLUC of Quito, parish-level socioeconomic analyzes prove to be highly generalized, making it imprecise to establish a relationship between vegetation density and socioeconomic conditions at this territorial scale. Therefore, urban vegetation analyses at the AIVAS level are more appropriate in cases involving socioeconomic variables.
The AIVAS are a very useful tool for the city of Quito. The information they provide allows the carrying out of accurate studies on territorial assessment and socioeconomic conditions since they are constantly maintained and updated. This source of information is the most important factor for the evaluation of vegetation density in the study area. However, the results of the two levels of analysis (AIVAS level and parishes level) suggest that socioeconomic factors contribute to understanding the density of urban vegetation, but they are not decisive by themselves.
It can be concluded that unlike other cities in the region, such as Santiago de Chile and Bogota, where several authors confirm that the sectors with low socioeconomic conditions have a lack of public, ornamental, and private urban vegetation, while the sectors with medium-high and high socioeconomic conditions enjoy and maintain a higher density of vegetation, establishing a direct and general relationship in the city. In the HLUC of Quito, the relationship is neither direct nor proportional. In fact, most AIVAS with vegetation index above 30% are concentrated in the low and medium socioeconomic sectors, while in the medium, medium-high, and high socioeconomic sectors, AIVAS have vegetation indices below 30%. Therefore, it is indicated that complementary explanatory variables should be included and that analyzes should be developed using nonlinear mathematical-statistical approaches.
Application of the logistic model in areas with a vegetation index of less than 30% revealed that factors related to green spaces and green infrastructure (I5) in combination with socioeconomic factors (I2, I3, and I4) largely explain the vegetation index in these areas. Moreover, it is confirmed that the medium, medium-high, and high socioeconomic levels tend to affect areas with a low vegetation index (<30%).
Historically and geographically, the HLUC of Quito concentrates the richest areas (high socioeconomic conditions) in the north center, which at the same time results in a concentration of AIVAS with low vegetation indices, i.e., confirming the results of this work. Therefore, more attention needs to be paid to these areas to preserve and promote urban GI and green spaces to counteract the effects of high urban surface temperatures and polluted air and to create natural urban drainage areas.
Finally, the city of Quito is vulnerable to natural risks, it has fewer and fewer green areas in the HLUC, and there is no public policy with an ecosystem approach. Therefore, the results of the analyses conducted in this paper contribute as research and fundamental studies to the planning, design, and implementation of techniques and methods for sustainable urban drainage systems. In addition, this type of study supports the characterization of urban vegetation density and SUDs to strengthen the resilience, sustainability, and habitability of the city.
Author Contributions

Conceptualization, R.U.-E. and E.L.-N.; methodology, R.U.-E., E.L.-N. and J.C.-C.; software, R.U.-E., E.L.-N. and J.C.-C.; formal analysis, R.U.-E., E.L.-N. and J.C.-C.; investigation, R.U.-E.; data curation, R.U.-E., E.L.-N. and J.C.-C.; writing—original draft preparation, R.U.-E. and E.L.-N.; writing—review and editing, R.U.-E. and E.L.-N.; project administration, R.U.-E. All authors have read and agreed to the published version of the manuscript.

Funding

This research received no external funding.

Data Availability Statement

Not applicable.

Acknowledgments

Authors are grateful to EPMAPS Agua de Quito and anonymous reviewers, whose comments greatly improved the readability and the scientific rigor of the manuscript.

Conflicts of Interest

The authors declare no conflict of interest.

References

  1. Li, F.; Wang, R.; Paulussen, J.; Liu, X. Comprehensive concept planning of urban greening based on ecological principles: A case study in Beijing, China. Landsc Urban Plan. 2005, 72, 325–336. [Google Scholar] [CrossRef]
  2. World Health Organization. Air Quality Guidelines; Global Update 2005; WHO: Geneva, Switzerland, 2006; p. 484.
  3. Galindo-Bianconi, A.; Victoria-Uribe, R. La vegetación como parte de la sustentabilidad urbana: Beneficios, problemáticos y soluciones para el Valle de Toluca. Quivera 2012, 14, 98–108. Available online: http://www.redalyc.org/articulo.oa?id=40123894006 (accessed on 8 March 2022).
  4. Gascon, M.; Triguero-Mas, M.; Martínez, D.; Dadvand, P.; Rojas-Rueda, D.; Plasència, A.; Nieuwenhuijsen, M.J. Residential green spaces and mortality: A systematic review. Environ. Int. 2016, 86, 60–67. [Google Scholar] [CrossRef] [Green Version]
  5. Williams, N.; Coutts, A.; Livesley, S. Our cities need more trees and water, not less, to stay liveable. ECOS 2014. [Google Scholar] [CrossRef]
  6. Shirazi, S.A.; Kazmi, J.H. Analysis of socio-environmental impacts of the loss of urban trees and vegetation in Lahore, Pakistan: A review of public perception. Ecol. Process. 2016, 5, 5. [Google Scholar] [CrossRef] [Green Version]
  7. Fuller, R.A.; Gaston, K.J. The scaling of green space coverage in European cities. Biol. Lett. 2009, 5, 352–355. [Google Scholar] [CrossRef] [Green Version]
  8. Baycan, T.; Levent, T.B.; Vreeker, R.; Nijkamp, P. Multidimensional Evaluation of Urban Green Spaces: A Comparative Study on European Cities Sustainable City and Creativity View Project Multidimensional Evaluation of Urban Green Spaces: A Comparative Study on European Cities. 2004. Available online: https://www.researchgate.net/publication/4795787 (accessed on 5 January 2022).
  9. Terraza, H. Las Ciudades Latinoamericanas Poseen Suficiente Espacio Verde Público? Qué es Suficiente, Existe un Mínimo? Ciudades Sostenibles Blog. 2012. Available online: https://blogs.iadb.org/ciudades-sostenibles/es/la-ciudades-latinoamericanas-poseen-suficiente-espacio-verde-publico-que-es-suficiente-existe-un-minimo/%0Ahttps://blogs.iadb.org/ciudadessostenibles/2012/06/28/la-ciudades-latinoamericanas-poseen-suficiente- (accessed on 17 November 2021).
  10. Kerle, N.; Müller, A. Megacities and natural hazards. In Encyclopedia of Natural Hazards; Springer: Berlin/Heidelberg, Germany, 2013; pp. 660–664. [Google Scholar]
  11. Chan, N.W.; Tan, M.L.; Ghani, A.A.; Zakaria, N.A. Sustainable urban drainage as a viable measure of coping with heat and floods due to climate change. IOP Conf. Ser. Earth Environ. Sci. 2019, 257, 012013. [Google Scholar] [CrossRef]
  12. Sukkopp, H.; Werner, P.; Sukopp, H.; Werner, P. Naturaleza en Las Ciudades; Desarrollo de Flora Y Fauna en Áreas Urbanas; Ministerio de Obras Públicas y Transportes: Madrid, Spain, 1991; p. 222. ISBN 84-7433-781-X. [Google Scholar]
  13. Dunnett, N.; Swanwick, C.; Woolley, H.; Government, L. Improving Urban Parks, Play Areas and Green Spaces; Off Deputy Prime Minist; Department for Transport, Local Government and the Regions: London, UK, 2002. [Google Scholar]
  14. Tzoulas, K.; Korpela, K.; Venn, S.; Yli-Pelkonen, V.; Kaźmierczak, A.; Niemela, J.; James, P. Promoting ecosystem and human health in urban areas using Green Infrastructure: A literature review. Landsc. Urban Plan. 2007, 81, 167–178. [Google Scholar] [CrossRef] [Green Version]
  15. Benedict, M.A.; McMahon, E. Green Infrastructure; Smart Conservation for the 21st Century; Sprawl Watch Clearinghouse Monograph Series; The Conservation Fund: Washington, DC, USA, 2001. [Google Scholar]
  16. Gill, S.E.; Handley, J.F.; Ennos, A.R.; Pauleit, S. Adapting Cities for Climate Change: The Role of the Green Infrastructure. In Planning for Climate Change; A Read Green Infrastruct Sustain Des Resilient Cities; Routledge: Abingdon, UK, 2018; pp. 195–205. [Google Scholar] [CrossRef] [Green Version]
  17. Demuzere, M.; Orru, K.; Heidrich, O.; Olazabal, E.; Geneletti, D.; Orru, H.; Bhave, A.G.; Mittal, N.; Feliu, E.; Faehnle, M. Mitigating and adapting to climate change: Multi-functional and multi-scale assessment of green urban infrastructure. J. Environ. Manag. 2014, 146, 107–115. [Google Scholar] [CrossRef]
  18. Norton, B.A.; Coutts, A.M.; Livesley, S.J.; Harris, R.J.; Hunter, A.M.; Williams, N.S. Planning for cooler cities: A framework to prioritise green infrastructure to mitigate high temperatures in urban landscapes. In Planning for Climate Change; A Read Green Infrastruct Sustain Des Resilient Cities; Routledge: Abingdon, UK, 2018; pp. 233–249. [Google Scholar]
  19. McMahon, E.; Benedict, M. Green infrastructure. Plan. Comm. J. 2000, 37, 4–7. [Google Scholar]
  20. Pickett, S.T.A.; McGrath, B.; Cadenasso, M.L.; Felson, A.J. Ecological resilience and resilient cities. Build Res. Inf. 2014, 42, 143–157. [Google Scholar] [CrossRef]
  21. Alberti, M. Eco-evolutionary dynamics in an urbanizing planet. Trends Ecol. Evol. 2015, 30, 114–126. [Google Scholar] [CrossRef]
  22. Nouri, H.; Beecham, S.; Anderson, S.; Hassanli, A.; Kazemi, F. Remote sensing techniques for predicting evapotranspiration from mixed vegetated surfaces. Urban Water J. 2014, 12, 380–393. [Google Scholar] [CrossRef]
  23. Hansen, R.; Pauleit, S. From multifunctionality to multiple ecosystem services? A conceptual framework for multifunctionality in green infrastructure planning for Urban Areas. Ambio 2014, 43, 516–529. [Google Scholar] [CrossRef] [Green Version]
  24. European Union. Mapping Guide for a European Urban. 2011. Available online: http://www.eea.europa.eu/data-and-maps/data/urban-atlas#tab-methodology (accessed on 2 February 2022).
  25. Landscape Institute. Green Infrastructure; Connected and Multifunctional Landscapes; Landscape Institute: London, UK, 2009; p. 30. [Google Scholar]
  26. Infield, E.M.H.; Gurran, N. Urban form and climate change: Balancing adaptation and mitigation in the U.S. and Australia. In Planning for Climate Change; A Read Green Infrastruct Sustain Des Resilient Cities; Routledge: Abingdon, UK, 2018; pp. 332–339. [Google Scholar]
  27. Bowler, D.E.; Buyung-Ali, L.; Knight, T.M.; Pullin, A.S. Urban greening to cool towns and cities: A systematic review of the empirical evidence. Landsc. Urban Plan. 2010, 97, 147–155. [Google Scholar] [CrossRef]
  28. Wong, T.-C.; Yuen, B. Understanding the Origins and Evolution of Eco-city Development: An Introduction. In Eco-City Planning; Springer: Dordrecht, The Netherlands, 2011; pp. 1–14. [Google Scholar]
  29. La Rosa, D.; Pappalardo, V. Policies and Planning of Urban Green Infrastructure and Sustainable Urban Drainage Systems. In Urban Services to Ecosystems; Springer: Cham, Switzerland, 2021; pp. 297–316. [Google Scholar]
  30. ICLEI European Secretariat. SWITCH Training Kit—Integrated Urban Water Management in the City of the Future; ICLEI European Secretariat: Freiburg, Germany, 2011; p. 15. [Google Scholar]
  31. Woods-Ballard, B.; Kellagher, R.; Martin, P.; Jefferies, C.; Bray, R.; Shaffer, P. The SuDS Manual; Ciria C697; Ciria: London, UK, 2011; pp. 1–599. [Google Scholar]
  32. Woods Ballard, B.; Dimova, G.; Weisgerber, A.; Kellagher, R.; Abbot, C.; Maneiro, E.; Smith, H.; Stovin, V. Benefits and Performance of Sustainable Drainage Systems; HR Wallingford: Wallingford, UK, 2005. [Google Scholar]
  33. Hatt, B.E.; Fletcher, T.D.; Walsh, C.J.; Taylor, S.L. The influence of urban density and drainage infrastructure on the concentrations and loads of pollutants in small streams. Environ. Manag. 2004, 34, 112–124. [Google Scholar] [CrossRef]
  34. Perales Momparler, S.; Doménech, I.A. Los sistemas urbanos de drenaje sostenible: Una alternativa a la gestión del agua de lluvia. Equip. Y Serv. Munic. 2007, 24, 66–77. [Google Scholar]
  35. Nascimento, N.O.; Ellis, J.B.; Baptista, M.B.; Deutsch, J.-C. Using detention basins: Operational experience and lessons. Urban Water 1999, 1, 113–124. [Google Scholar] [CrossRef]
  36. Ellis, E.C.; Ramankutty, N. Putting people in the map: Anthropogenic biomes of the world. Front. Ecol. Environ. 2008, 6, 439–447. [Google Scholar] [CrossRef] [Green Version]
  37. Rubiano, K. Distribution of the green infrastructure and its thermal regulation capacity in Bogotá, Colombia. Colomb. For. 2019, 22, 83–100. [Google Scholar]
  38. Nesbitt, L.; Meitner, M.J. Exploring relationships between socioeconomic background and Urban greenery in Portland, OR. Forests 2016, 7, 162. [Google Scholar] [CrossRef] [Green Version]
  39. Schwarz, K.; Fragkias, M.; Boone, C.G.; Zhou, W.; McHale, M.; Grove, J.M.; O’Neil-Dunne, J.; McFadden, J.P.; Buckley, G.L.; Childers, D.; et al. Trees grow on money: Urban tree canopy cover and environmental justice. PLoS ONE 2015, 10, e0122051. [Google Scholar] [CrossRef] [Green Version]
  40. Mitchell, R.; Popham, F. Effect of exposure to natural environment on health inequalities: An observational population study. Lancet 2008, 372, 1655–1660. [Google Scholar] [CrossRef] [Green Version]
  41. United Nations. World Urbanization Prospects. The 2018 Revision. Methodology [Internet]. Department of Ecnoomic and Social Affairs—Population Division. 2018. Available online: https://population.un.org/wup/Publications/Files/WUP2018-Methodology.pdf (accessed on 30 October 2021).
  42. Luz de la Maza, C.; Hernández, J.; Bown, H.; Rodríguez, M.; Escobedo, F. Vegetation Diversity in the Santiago De Chile Urban Ecosystem. Arboric J. 2002, 26, 347–357. [Google Scholar] [CrossRef]
  43. Pedlowski, M.A.; Da Silva, V.A.C.; Adell, J.J.C.; Heynen, N.C. Urban forest and environmental inequality in Campos dos Goytacazes, Rio de Janeiro, Brazil. Urban Ecosyst. 2002, 6, 9–20. Available online: http://link.springer.com/article/10.1023/A:1025910528583 (accessed on 18 March 2022). [CrossRef]
  44. Escobedo, F.J.; Palmas, S.; Dobbs, C.; Gezan, S.; Hernández, J. Spatio-temporal changes in structure for a mediterranean urban forest: Santiago, Chile 2002 to 2014. Forests 2016, 7, 121. [Google Scholar] [CrossRef] [Green Version]
  45. Escobedo, F.J.; Clerici, N.; Staudhammer, C.L.; Corzo, G.T. Socio-ecological dynamics and inequality in Bogotá, Colombia’s public urban forests and their ecosystem services. Urban For Urban Green. 2015, 14, 1040–1053. [Google Scholar] [CrossRef]
  46. Quito M, de. Quito es la Ciudad Con Más Espacios Verdes por Habitante—Quito Informa. 2018. Available online: http://www.quitoinforma.gob.ec/2018/02/08/quito-es-la-ciudad-con-mas-espacios-verdes-por-habitante/ (accessed on 12 May 2022).
  47. MDMQ. Plan Metropolitano de Ordenamiento Territorial; MDMQ: Quito, Ecuador, 2012. [Google Scholar]
  48. Rouse, J.W.; Hass, R.H.; Schell, J.A.; Deering, D.W. Monitoring vegetation systems in the Great Plains with ERTS. In Proceedings of the 3rd ERTS Symposium, NASA, Washington, DC, USA; 1973; pp. 309–313. Available online: https://books.google.com.br/books?hl=pt-BR&lr=&id=e00CAAAAIAAJ&oi=fnd&pg=PA309&dq=related:7O0hXbvln8cJ:scholar.google.com/&ots=JTOBiUzm-9&sig=LGzI8o8qfg0E5N4vmIbQpDWyHF4#v=onepage&q&f=false (accessed on 10 January 2022).
  49. Kundu, A.; Denis, D.M.; Patel, N.R.; Dutta, D. A Geo-spatial study for analysing temporal responses of NDVI to rainfall. Singap. J. Trop. Geogr. 2017, 39, 107–116. [Google Scholar] [CrossRef]
  50. Vera, O.; Vera, F. Evaluación del nivel socioeconómico: Presentación de una escala adaptada en una población de Lambayeque. Rev. Cuerpo Méd. 2013, 6, 41–45. [Google Scholar]
  51. Granados Vallejos, E.T.; Calderón Dávila, K.; Valencia Orrillo, E. Nivel socioeconómico y estilo de vida de los adultos intermedios de la Asociación de Viviendas del “Vallecito” de La Era. Lurigancho—Chosica, Lima. Rev. Investig. Univ. 2017, 4. [Google Scholar] [CrossRef]
  52. Instituto Espacial Ecuatoriano. Generación de Información Geoespacial a Escala 1:5.000 para la Determinación de la Aptitud Física del Territorio Y Desarrollo Urbano Mediante el uso de Geotecnologías. 2018. Available online: http://www.geoportaligm.gob.ec/geoinformacion/index-alt3.html (accessed on 12 January 2022).
  53. DMQ. Instituto de la Ciudad, Boletin 21 [Internet]. Índice de Calidad de Vida. 2014. Available online: http://www.institutodelaciudad.com.ec (accessed on 24 October 2021).
  54. Chen, Y. New Approaches for Calculating Moran’s Index of Spatial Autocorrelation. PLoS ONE 2013, 8, e68336. [Google Scholar] [CrossRef] [Green Version]
  55. Guthery, F.S.; Burnham, K.P.; Anderson, D.R. Model Selection and Multimodel Inference: A Practical Information-Theoretic Approach. J. Wildl. Manag. 2003, 67, 655. [Google Scholar] [CrossRef]
  56. ESRI. How Exploratory Regression Works—ArcMap|Documentation. Modelado de Relaciones Espaciales. 2020. Available online: https://desktop.arcgis.com/en/arcmap/latest/tools/spatial-statistics-toolbox/how-exploratory-regression-works.htm (accessed on 20 October 2021).
  57. Bierens, H. The Logit Model: Estimation, Testing and Interpretation; Department of Economics, The Pennsylvania State University: State College, PA, USA, 2008; Volume 1, pp. 1–12. Available online: https://www.tol-project.org/export/3681/tolp/OfficialTolArchiveNetwork/QltvRespModel/doc/ML_LOGIT.pdf (accessed on 11 March 2022).
  58. Williams, R. Understanding and interpreting generalized ordered logit models. J. Math. Sociol. 2016, 40, 7–20. [Google Scholar] [CrossRef]
  59. Miles, J. Encyclopedia of Statistics in Behavioral Science; John Wiley and Sons: Hoboken, NJ, USA, 2005. [Google Scholar]
  60. Brown, M. The Bogotá Green Divide: Inequality in Street Tree Coverage Across Estratos. 2012. Available online: http://www.citinature.org/uploads/4/7/4/0/4740372/citinature_report_bogota_green_divide.pdf (accessed on 5 February 2022).
  61. Zhou, W.; Troy, A.; Morgan Grove, J.M.; Jenkins, J.C. Can money buy green? demographic and socioeconomic predictors of lawn-care expenditures and lawn greenness in urban residential areas. Soc. Nat. Resour. 2009, 22, 744–760. [Google Scholar] [CrossRef]
  62. Leslie, E.; Sugiyama, T.; Ierodiaconou, D.; Kremer, P. Perceived and objectively measured greenness of neighbourhoods: Are they measuring the same thing? Landsc. Urban Plan. 2010, 95, 28–33. [Google Scholar] [CrossRef]
  63. Balter, J.; Alchapar, N.; Correa, E.; Ganem, C. Urban microclimatic modeling for apartment’s thermo-energy simulation in high-rise buildings in Mendoza-Argentina. ENVI-met and EnergyPlus software integration. Inf. Constr. 2021, 73, e382. [Google Scholar] [CrossRef]
  64. Hoang, L.; Fenner, R.A. System interactions of stormwater management using sustainable urban drainage systems and green infrastructure. Urban Water J. 2016, 13, 739–758. [Google Scholar] [CrossRef] [Green Version]
  65. Sanders, R.A. Urban vegetation impacts on the hydrology of Dayton, Ohio. Urban Ecol. 1986, 9, 361–376. [Google Scholar] [CrossRef]
  66. Díaz-Acosta, R.; Shiba-Matsumoto, A.R.; Gutiérrez, J.P. Simplified indicator of socioeconomic status in short surveys: A proposal based on assets and services. Salud Publica Mex. 2015, 57, 298–303. [Google Scholar]
  67. Noresah, M.S. Emerging trend of urban green space research and the implications for safeguarding biodiversity: A viewpoint. Nat. Sci. 2010, 8, 43–49. [Google Scholar]
  68. Arboit, M.E. Estimación del índice de vegetación, en entornos urbanos forestados consolidados de baja densidad del área Metropolitana de Mendoza, Argentina. Cuad Urbano 2018, 23, 33. [Google Scholar] [CrossRef]
Figure 1. Cycle of ecosystem services.
Geographies 02 00025 g001
Figure 2. Study area.
Geographies 02 00025 g002
Figure 3. (a) Hyperconsolidated Longitudinal Urban Core (HLUC), (b) Elevation map of HLUC.
Geographies 02 00025 g003
Figure 4. Green areas from NDVI, includes grass, shrubs, and trees. I1.
Geographies 02 00025 g004
Figure 5. Explanatory variables, (a) I2, (b) I3, (c) I4.
Geographies 02 00025 g005
Figure 6. Global Moran’s I Summary AIVAS level (I1).
Geographies 02 00025 g006
Figure 7. Vegetation Density of HLUC, AIVAS level.
Geographies 02 00025 g007
Figure 8. ROC curve.
Geographies 02 00025 g008
Figure 9. Global Moran’s I Summary parish level (I1).
Geographies 02 00025 g009
Figure 10. Density of vegetation in the HLCU at the parish Level. 1 Guamaní, 2 Turubamba, 3 La Ecuatoriana, 4 Quitumbe, 5 Chillogallo, 6 La Mena, 7 San Bartolo, 8 Solanda, 9 La Argelia, 10 La Ferroviaria, 11 Chilibulo, 12 La Magdalena, 13 Chimbacalle, 14 Puengasí, 15 La Libertad, 16 Centro Histórico, 17 San Juan, 18 Belisario Quevedo, 19 Mariscal Sucre, 20 Iñaquito, 21 Rumipamba, 22 Kennedy, 23 Concepción, 24 Cochapamba, 25 Cotocollao, 26 Ponceano, 27 Comité del Pueblo, 28 San Isidro del Inca, 29 Carcelén, 30 Calderón, 31 El Condado, 32 Jipijapa, 33 Itchimbia.
Geographies 02 00025 g010
Table 1. Geographical Information Collected.
IDDataFile
Extension
AgencyAccuracy/Scale/Territory LevelDate
I1Satellite imagery SENTINELRaster (.img)Sentinel Hub EO BrowserSpatial resolution of 10 m2021
I2Value intervention areas of Quito (AIVAS)Polygons (.SHP)Gobierno Abierto de QuitoCadastral level2022
I3Socioeconomic Level of Quito PolygonsPolygons (.SHP)Geoportal Military Geographic Institute of EcuadorScale 1:5.0002014
I4Quality of Life Index Polygons (QLI)Polygons (.SHP)Quito City InstituteParish Level2017
I5Urban parksPolygons (.SHP)Open Government of QuitoCadastral Level2022
Table 2. Variables categorized for inclusion in the logit mode.
I1I1-0: Vegetation Density > 30%
I1-1: Vegetation Density ≤ 30%
I3I3-0: low and middle low
I3-1: middle
I3-2: middle high and high
I4I4-0: from 64% to 67%
I4-1: from 68% to 70%
I4-2: from 71% to 73%
Variables I2 & I5 were not categorized.
Table 3. Global Moran’s I Summary, AIVAS level (I1).
Moran’s Index0.402745
Expected Index−0.00095
Variance0.000185
z-score29.696007
p-value0
Table 4. Intercepts and regression coefficients for the predictors, combination of 2 variables.
ModelCoefficientStdErrort-StatisticProbability
Intercept93.62596810.4936448.922160.000000 *
I2−0.0166230.003946−4.2127610.000032 *
I3−0.8795490.162199−5.4226670.000000 *
Intercept119.9875618.71286413.7713110.000000 *
I3−1.3194080.127418−10.3549940.000000 *
I5−0.2349880.201792−1.164510.24448
Intercept125.74387821.0823545.9644130.000000 *
I3−1.2535140.202367−6.1942530.000000 *
I4−0.1524640.431426−0.3533970.723876
* An asterisk next to a number indicates a statistically significant p-value (p < 0.01).
Table 5. Highest adjusted R-squared results, combination of 2 variables.
AdjR2AICcVIFSAModel
0.19555.771.650−I2 ***−I3 ***
0.099572.0610−I3 ***−I5 *
0.099573.292.530−I3 ***−I4
AdjR2 Adjusted R-Squared, AICc Akaike’s Information Criterion, VIF Max Variance Inflation Factor, SA Global Moran’s I p-value, Model Variable sign (±), Model Variable significance (* = 0.10; *** = 0.01).
Table 6. Intercepts and regression coefficients for the predictors, combination of 3 variables.
ModelCoefficientStdErrort-StatisticProbability
Intercept94.26601310.4961488.9810110.000000 *
I2−0.0170720.003955−4.3165410.000021 *
I3−0.8810940.162106−5.4352940.000000 *
I5−0.3005760.200696−1.497670.134534
Intercept80.27932123.4975443.4164980.000674 *
I2−0.0172190.004057−4.2442220.000028 *
I3−0.966050.211867−4.5597010.000008 *
I40.2792770.4398990.6348670.525654
Intercept128.77269521.2289736.0658940.000000 *
I3−1.2480690.202376−6.1670670.000000 *
I4−0.1964680.432896−0.4538450.650048
I5−0.2427880.202598−1.1983710.231044
* An asterisk next to a number indicates a statistically significant p-value (p < 0.01).
Table 7. Highest adjusted R-squared results for the combination of 3 variables.
AdjR2AICcVIFSAModel
0.119555.541.660−I2 ***−I3 ***−I5 **
0.19557.382.820−I2 ***−I3 ***−I4
0.099573.872.550−I3 ***−I4−I5 *
AdjR2 Adjusted R-Squared, AICc Akaike’s Information Criterion, VIF Max Variance Inflation Factor, SA Global Moran’s I p-value, Model Variable sign (±), Model Variable significance (* = 0.10; ** = 0.05; *** = 0.01).
Table 8. Intercepts and regression coefficients for the predictors, combination of 4 variables.
ModelCoefficientStdErrort-StatisticProbability
Intercept83.03235223.5609353.5241530.000458 *
I2−0.0175610.004062−4.3236590.000021 *
I3−0.953760.211922−4.5005230.000010 *
I40.2347320.4407270.5326020.594431
I5−0.2931380.201249−1.4565930.145542
* An asterisk next to a number indicates a statistically significant p-value (p < 0.01).
Table 9. Highest adjusted R-squared results, combination of 4 variables.
AdjR2AICcVIFSAModel
0.119557.282.820−I2 ***−I3 ***+I4−I5 *
AdjR2 Adjusted R-Squared, AICc Akaike’s Information Criterion, VIF Max Variance Inflation Factor, SA Global Moran’s I p-value, Model Variable sign (±), Model Variable significance (* = 0.10; *** = 0.01).
Table 10. The summary of multicollinearity is shown.
VariableVIF
I21.75
I32.82
I42.69
I51.02
Table 11. Summary of Variable Significance.
Variable% Significant% Negative% Positive
I21001000
I31001000
I442.8671.4328.57
I542.861000
Table 12. Logistic regression models—explanatory variables associated with vegetation index.
CoefficientsEstimateStd. ErrorZ ValuePr (>|z|)
(Intercept)−0.9010.193−4.6543.25 ×10−6 ***
I20.0530.0003.8480.00011 ***
I3-10.7450.2243.3270.0008 ***
I3-21.0030.2464.0774.56 × 10−5 ***
I4-1−0.8220.191−4.3001.70 × 10−5 ***
I4-20.2790.2081.3390.180634
I50.0530.0242.1950.028195 *
Variables marked with (*) indicate statistical significance and must meet the statistical criteria: * p < 0.1 or *** p < 0.01 and z > |2|.
Table 13. Show Global fit measures associated with the LOGIT model.
Global Fit MeasuresLogit Model
Omnibus tests7.21 × 10−12
Pseudo R2 de McFadden0.10
Accuracy of the model in the graph0.72
Error percentage0.31
Accuracy0.68
Area under the ROC curve-cutoff point0.50
Akaike information criterion1298.17
Table 14. Global Moran’s I Summary, parish level (I1).
Moran’s Index0.001174
Expected Index−0.031250
Variance0.020196
z-score0.228155
p-value0.819526
Table 15. The highest adjusted R-squared results.
AdjR2AICcVIFSAModel
0.19263.0710.96−I4 ***
AdjR2 Adjusted R-Squared, AICc Akaike’s Information Criterion, VIF Max Variance Inflation Factor, SA Global Moran’s I p-value, Model Variable sign (±), Model Variable significance (*** = 0.01).
Table 16. Summary of Variable Significance.
Variable% Significant% Negative% Positive
I41001000
Publisher’s Note: MDPI stays neutral with regard to jurisdictional claims in published maps and institutional affiliations.