Article

Personalized Prediction of Total Knee Arthroplasty Mechanics Based on Sparse Input Data—Model Validation Using In Vivo Force Data

by
Sonja Ehreiser
1,*,†,
Malte Asseln
1,2,† and
Klaus Radermacher
1
1
Chair of Medical Engineering, Helmholtz Institute for Biomedical Engineering, RWTH Aachen University, 52074 Aachen, Germany
2
Department of Biomechanical Engineering, Faculty of Engineering Technologies, University of Twente, 7522 NB Enschede, The Netherlands
*
Author to whom correspondence should be addressed.
These authors contributed equally to this work.
Biomechanics 2025, 5(1), 8; https://doi.org/10.3390/biomechanics5010008
Submission received: 9 September 2024 / Revised: 30 December 2024 / Accepted: 31 December 2024 / Published: 2 February 2025
(This article belongs to the Special Issue Personalized Biomechanics and Orthopedics of the Lower Extremity)

Abstract

:
Background/Objectives: Computational models are increasingly used in orthopedic research, such as in the context of total knee arthroplasty (TKA). However, the models’ actual integration in clinical practice is far from routine. Major limitations include the amount of input data, effort, and time required for personalization and simulation. In this paper, we present and validate a patient-specific multi-body musculoskeletal TKA model based on sparse input data to address these limitations. Methods: The simulation model was individualized based on the patients’ bone and knee implant 3D geometries, predicted bony landmarks, and soft tissue attachments using annotated statistical shape models, a statistical squat motion pattern, and a statistically based load case. For the validation, we used publicly accessible in vivo knee contact forces during squatting from four patients of the Grand Challenge Competitions (GCCs). Results: The prediction accuracy was quantified using several error metrics, including the root mean square error (RSME). For GCC3 and GCC5, both the range and trend of the mean in vivo contact forces were well matched by the simulation (RMSE lateral: 8.2–26.1% of body weight (BW); RMSE medial: 15.9–42.7 %BW). In contrast, there were relevant deviations between the experiment and simulation in the trend of contact forces for patient GCC2, as well as in the range of medial contact forces for patient GCC6 (RMSE medial: 52.6 %BW). The model setup time was at the magnitude of 15 min per patient, and the simulation was completed in less than 4 min. Conclusions: When comparing our results with the literature, we found similar accuracy to state-of-the-art models in predicting knee contact forces. While remaining deviations between in vivo and simulation data still warrant investigation and evaluation for clinical significance, the model has already successfully addressed important limitations of these previous models, which represent significant barriers to clinical application.

1. Introduction

The application of computational biomechanical models to orthopedic research questions has increased substantially in recent years [1,2]. An often-seen application is total knee arthroplasty (TKA), for which many biomechanical models have been presented in the literature. In this context, multi-body dynamics is a frequently used method for gaining insights into joint and muscle forces [3,4,5,6]. The underlying approach to calculate those forces is called inverse dynamics, where experimentally measured kinematics and external forces, such as ground reaction forces, are used in a rigid-body-linked segment model. During preoperative planning of TKA, the potential of using respective individualized multi-body simulation models includes a prediction of the functional postoperative outcome. However, an actual integration of computational models in preoperative planning is far from clinical practice.
The main reasons for the lack of patient-specific model integration in the clinical routine are the amount of input data, effort, and time required for personalization and simulation. Soft tissue information, such as ligament and muscle attachments, is available only with additional magnetic resonance imaging (MRI) and following difficult (manual) segmentation, which is time-consuming and, thus, cost-intensive. Motion and force input data, which are the needed input for inverse dynamic simulations [7,8], are conventionally acquired in gait lab analysis, requiring special facilities, costly equipment, and long setup times. The limited time and technical expertise of typical clinical users to process data for model customization as well as for simulation configuration is another major barrier to clinical integration. It must be considered that a typical X-ray-based preoperative planning session for TKA in a clinical routine takes less than 5 min per case [9]. While some authors have reported substantial benefits of, e.g., optimizing implant positioning to reproduce physiological knee kinematics and ligament strain by means of multi-body simulation [10], related substantially longer planning sessions are difficult to integrate into clinical practice. This is also due to the fact that even the preoperative work currently invested, including the limited time for preoperative planning, is neither available in daily clinical routine nor adequately reimbursed [9,11,12]. The simulation times of previously presented models exceed the corresponding planning time spans considerably, with an exemplary simulation time of 4.5 h reported for the model by Marra et al. [3]. Hence, to enable the simulation of, for example, different alignment options or different implant systems during preoperative planning, the simulation time and individualization effort would need to be reduced substantially.
To overcome these limitations, the purpose of this study was to develop a new patient-specific multi-body musculoskeletal simulation model for TKA using computationally efficient rigid-body dynamics and leveraging a substantial amount of a priori knowledge. We validated the model’s joint load predictions against publicly accessible in vivo knee contact forces from squat trials of four patients.

2. Materials and Methods

2.1. In Vivo Validation Data

As part of the Grand Challenge Competitions (GCCs), a comprehensive dataset of in vivo joint contact forces and motion capture data was compiled [13]. The GCC dataset documents the functional assessment of patients who underwent TKA with an instrumented tibial implant component, enabling in vivo joint force measurements during various activities [13,14]. For our model validation, we used imaging data, 3D implant models, force data of the medial and lateral compartments, as well as synchronized knee flexion angles of the instrumented implant (Table 1). For consistency reasons, we chose to focus on the GCC studies with the second-generation instrumented implant, which include GCC2, GCC3, GCC5, and GCC6. Although the first-generation implant data have not been considered, this is still the largest number of patients included in a single validation study to date. Due to the general scarcity of validation data available, no a priori sample size calculations have been performed. The flexion angles were calculated by the provided motion capture data of relevant landmarks, including “Thigh Superior”, “Patella”, and “Shank Inferior”, according to the following formula:
θ = v 1 v 2 v 1 v 2
  • v 1 = vector   Shank   Inferior   to   Patella .
  • v 2 = vector   Patellato   Thigh   Superior .
Table 1. Overview of the patient information of the Grand Challenge Competition [13].
PatientHeight [cm]Weight [kg]Age [Years]GenderSide
GCC21726783MaleRight
GCC316778.468FemaleLeft
GCC51807586MaleLeft
GCC617270~86MaleRight

2.2. Multi-Body Simulation Model

A musculoskeletal patient-specific multi-body simulation model was developed in the AnyBody Modelling SystemTM (version 7.3.1, Anybody Technology A/S, Aalborg, Denmark). This simulation model of the lower extremity includes the bony structures of the femur, tibia, and patella; the main ligaments, including the cruciate, collateral, and patellar ligaments; and the main flexor muscles, including the musculus vastus mediales, musculus vastus lateralis, and the musculus rectus femoris constituting the musculus quadriceps femoris. In addition, the model comprises the main extensor muscles, including the musculus biceps femoris and the musculus semimembranosus. An external force proportional to the body weight is applied to the hip joint. During the squat movement, the center of the hip joint is moved posteriorly and distally, according to the measurements and resulting formula of Wong et al. [15].

2.3. Biomechanical Modeling Using a Priori Knowledge

The input and output information of the biomechanical simulation model is visualized in Figure 1. The amount of input data required, and thus the individualization effort, was reduced by the following three approaches:
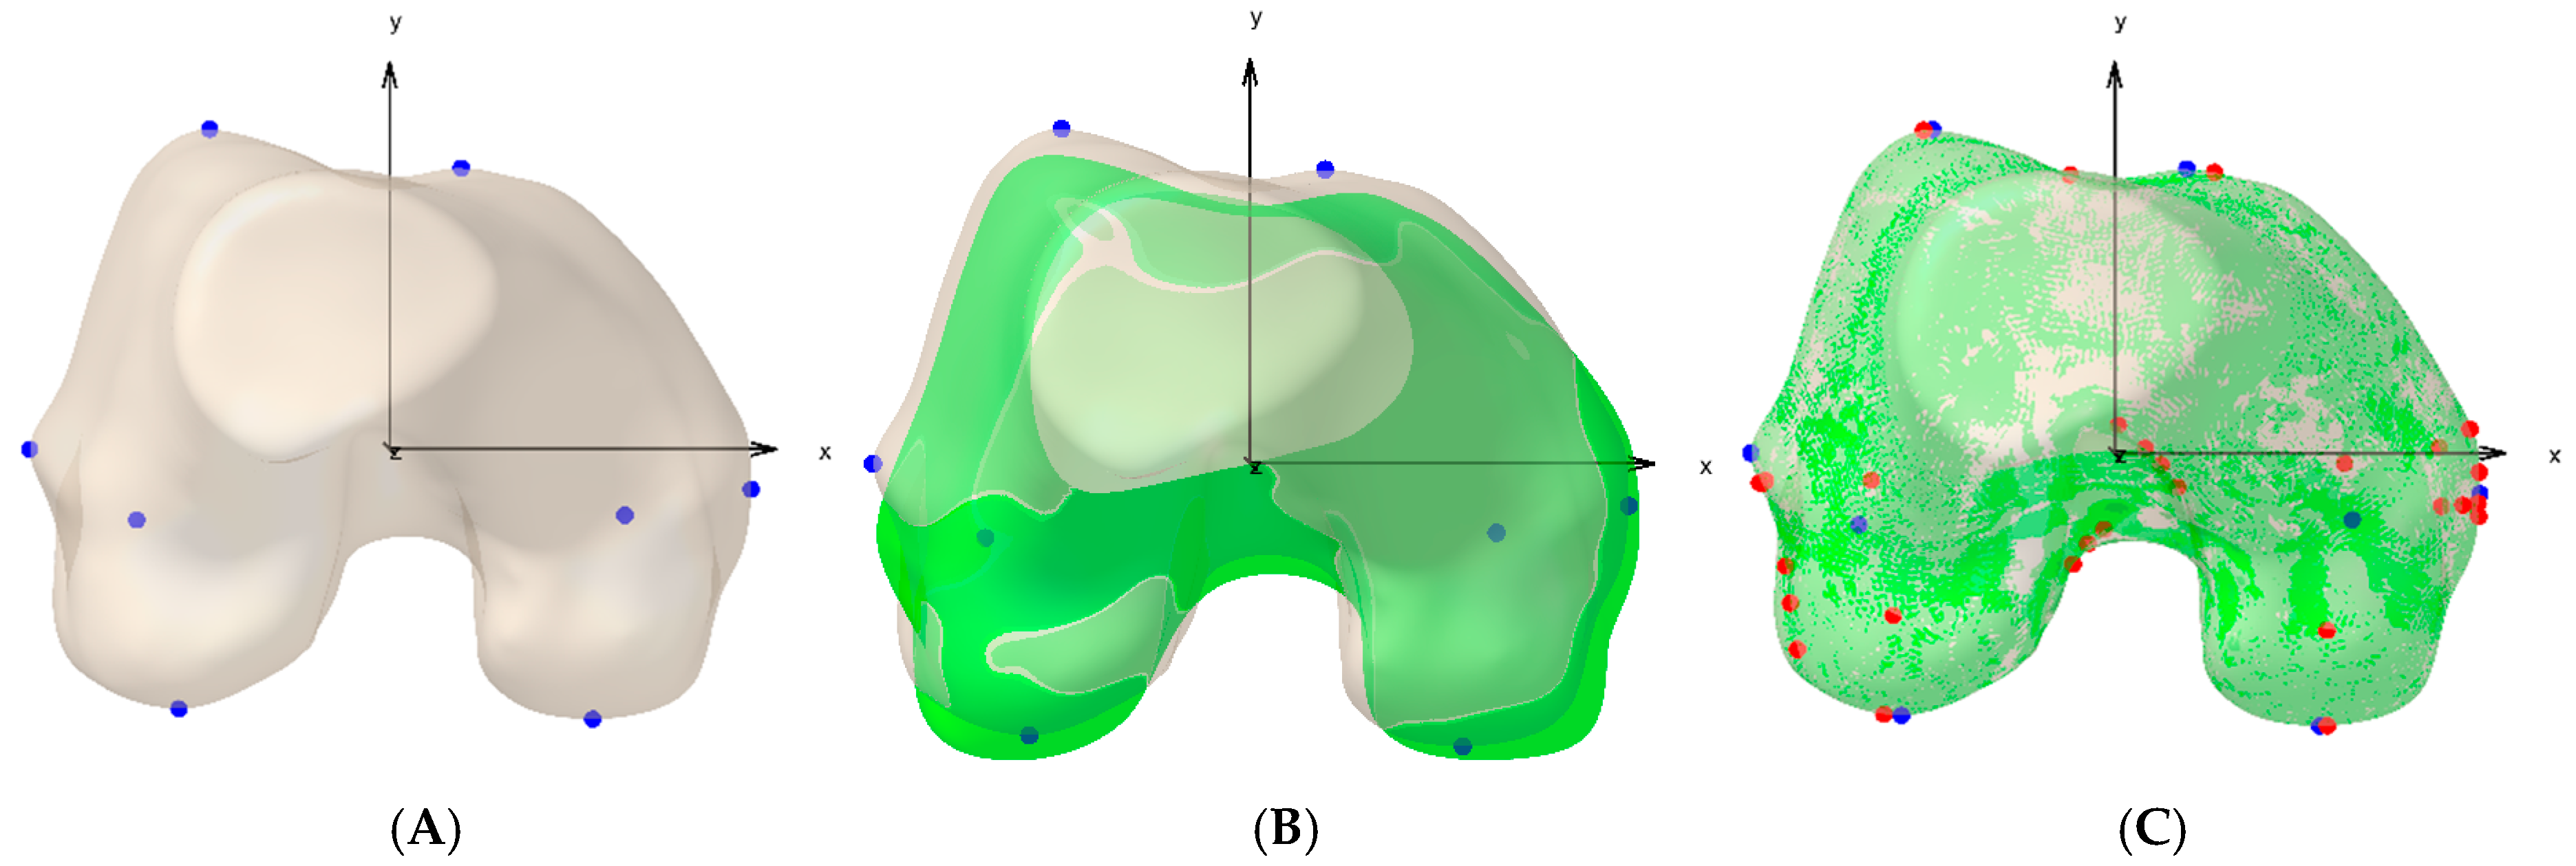
(1) Bone reference points are required to determine bone-specific coordinate systems and, based on these, the patient-specific knee kinematics. In addition, patient-specific soft tissue attachment sites must be determined to define ligament and tendon paths in an individualized model. In our model, respective reference points and soft-tissue attachment points were estimated by morphing an annotated mean shape of a statistical shape model (SSM) onto segmented CT images [16]. Details about the self-developed morphing process and its validation are described in a previous work by our group [16]. In short, the process is illustrated in Figure 2, using the femoral reference points and soft tissue attachment points as examples to propagate them onto the patient’s anatomy. For the morphing process, an in-house implementation of the non-rigid iterative closest point algorithm developed by Amberg et al. [17] was used. After the morphing process, the patient-specific reference points and soft-tissue attachment points were determined by searching for the respective nearest vertex on the patient’s bone surface model (Figure 2A,B). The full process is semi-automated, as a small set of manually defined landmarks is required for the rough pre-registration of the 3D surface models. In case of the femur, those included the medial and lateral epicondyle and the hip joint center. For the tibia, the medial and lateral plateau centers and the ankle joint center were required. The approach has been previously described and validated by our group [16]. With this step, the need for additional MRI imaging and cumbersome soft-tissue segmentation was circumvented.
(2) Motion capture data of the individual patient are usually required for inverse dynamic analyses. Instead, we used statistical motion patterns as kinematic constraints based on the study of Wong et al. [15]. They reported on dynamic squat kinematics recorded for 17 subjects, with the goal of providing realistic input to knee kinematic studies. We used the provided formula, describing the relationship between anterior/posterior and medial/lateral hip joint displacement, with the femur and tibia length and the knee flexion angle as input. Consequently, in our model, the motion was primarily driven by the knee flexion angle. This approach circumvents the challenges associated with acquiring motion capture data.
(3) For inverse dynamic simulation, environmental reaction forces from a gait laboratory are usually required, e.g., measured using force plates. To avoid this measurement effort, environmental reaction forces and the ground reaction forces were estimated by applying a simplified load case to the hip joint, following the setup of a conventional experimental testing rig [18]. Thus, the ground reaction forces were obtained directly from the Newton–Euler equations of motion, and no additional ground reaction force data were required.
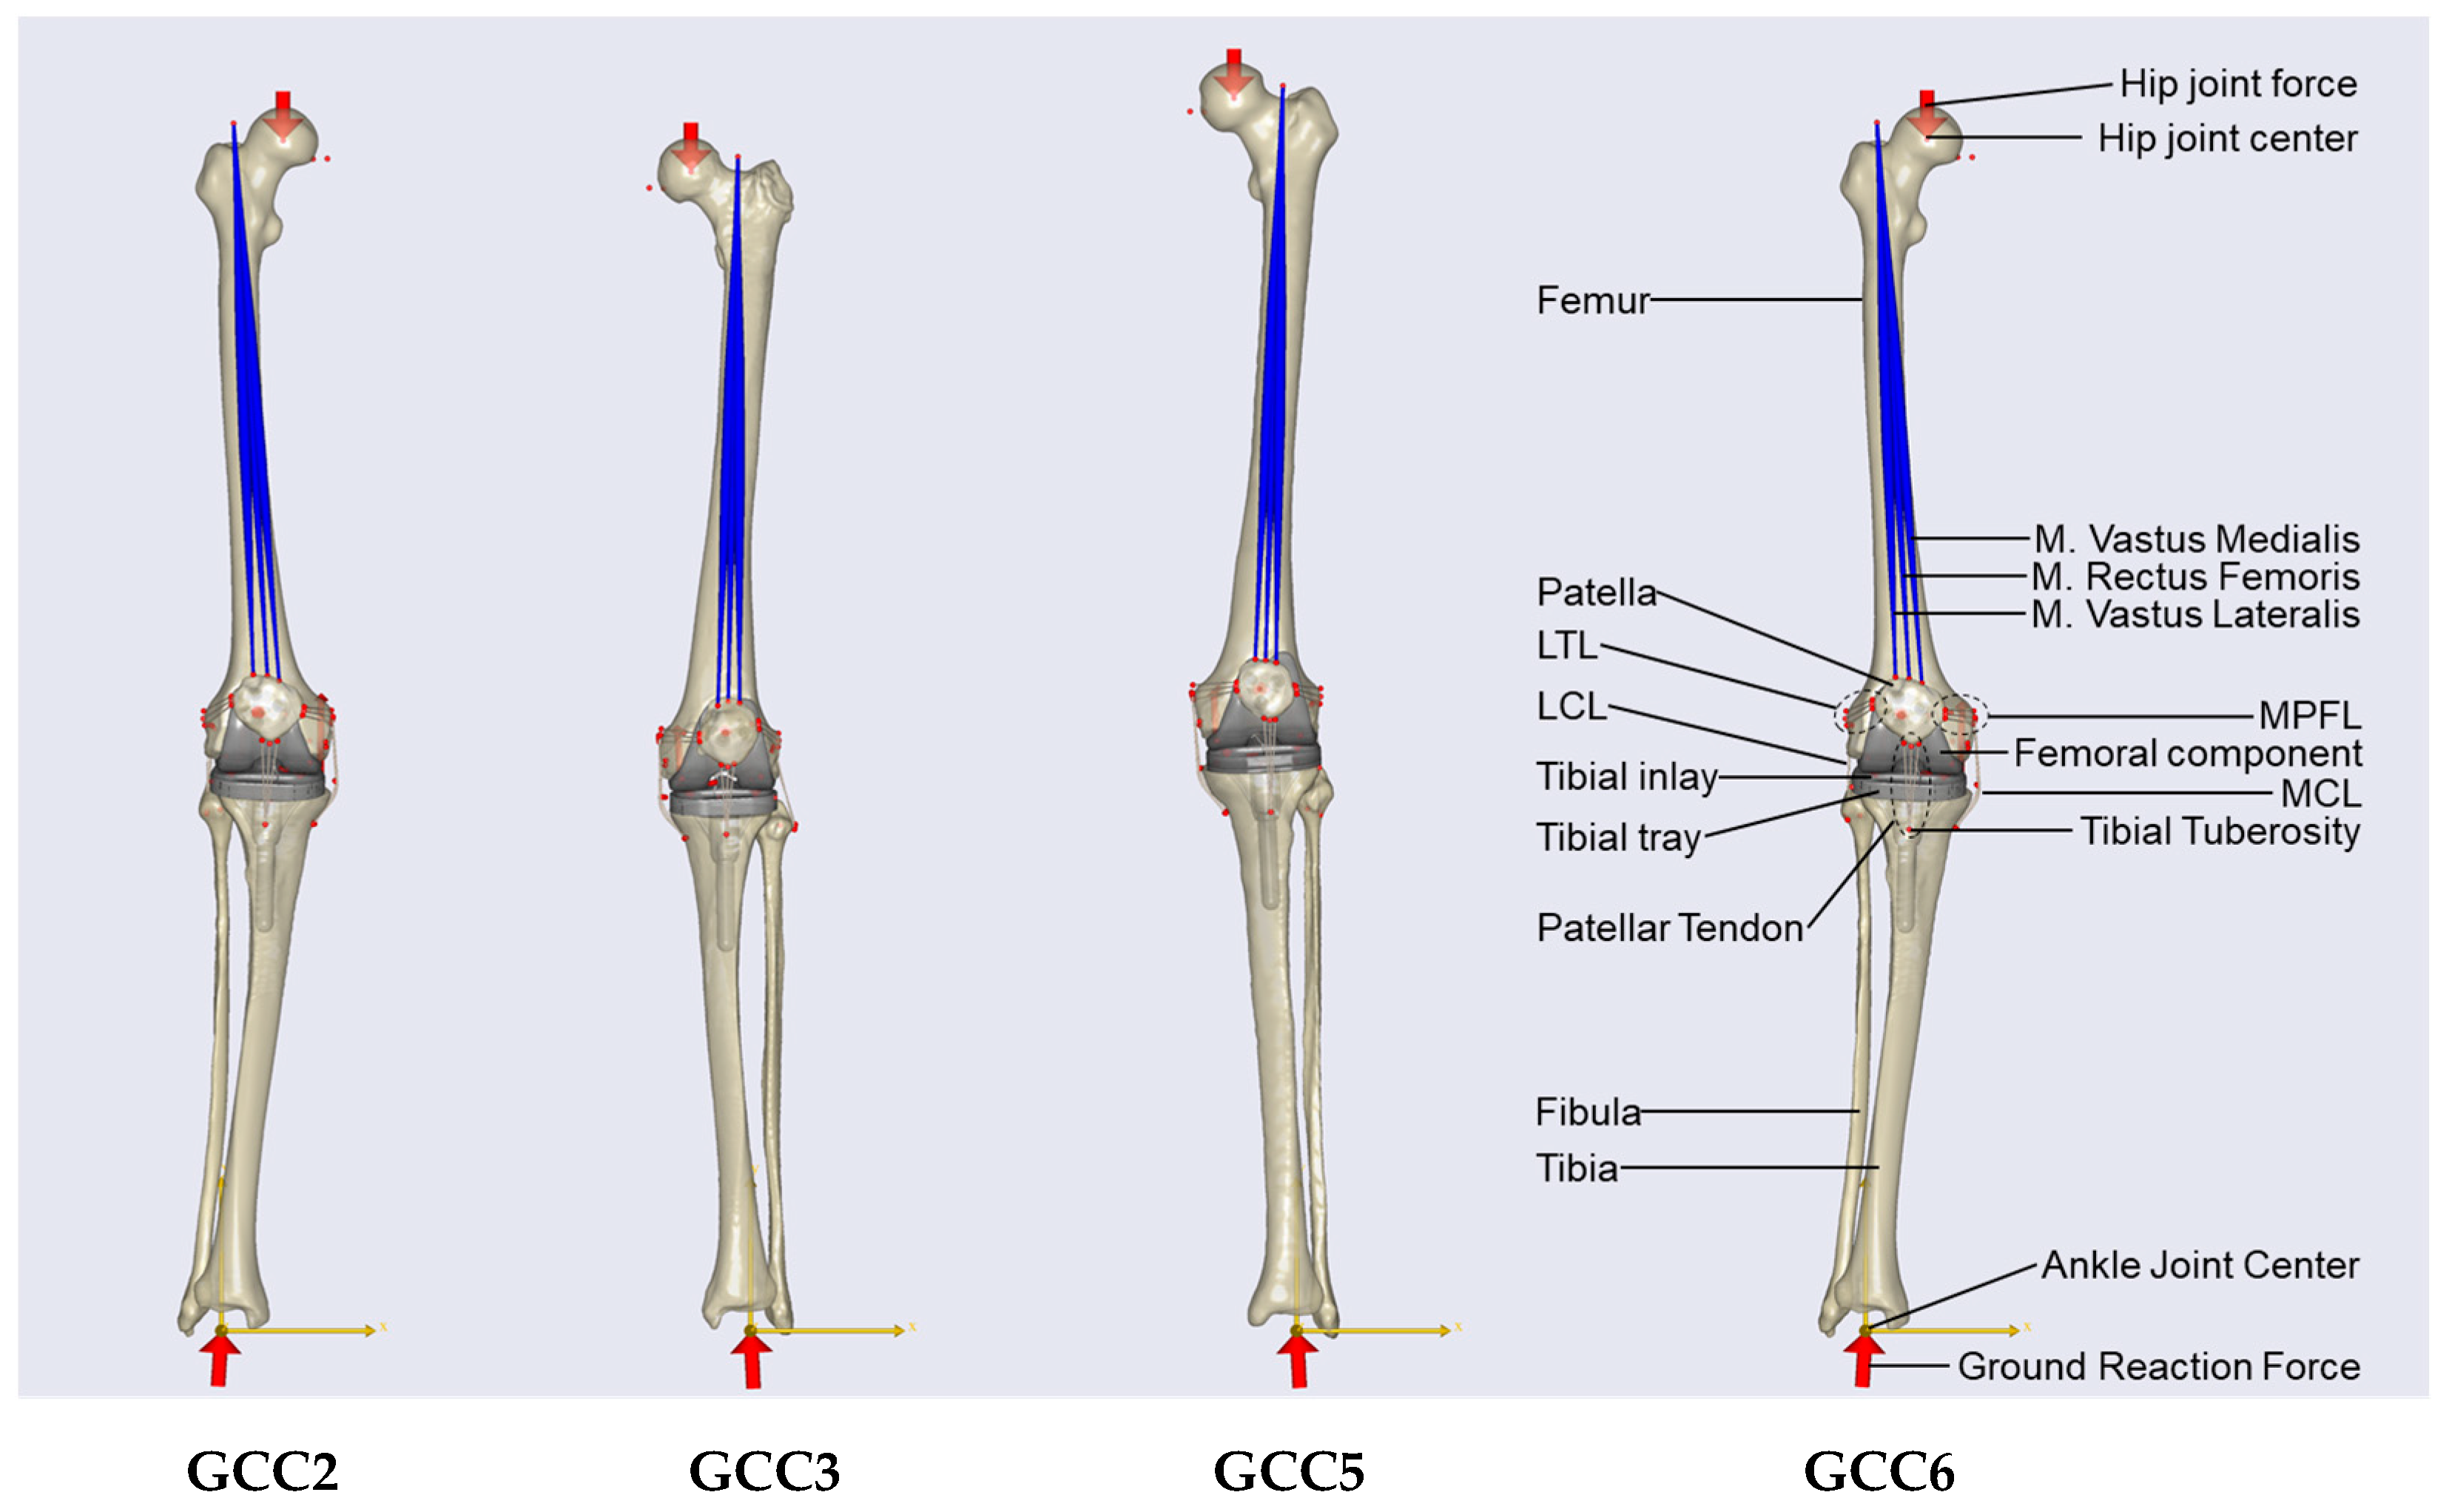
For each patient, an individualized model was built in a semi-automated workflow, which is depicted in Figure 1. Input information included the weight of the patient as well as the individual 3D surface models of bones and implant components. Patient-specific bony landmarks and ligament, as well as tendon attachments, were estimated from the patient-specific 3D surface models, as described above (Section 1). Exemplary visualizations for femoral landmark derivation are given in Figure 2. Each individualized simulation model is comprised of bones (segments), ligaments, muscles, and tendons. The respective models are depicted in Figure 3. With each model, a two-legged squat was simulated, representing a weight-bearing knee flexion motion (Section 2). The simulations were performed on a computer with the following specifications: Processor Intel(R) Core(TM) i7-8700 CPU @ 3.20GHz, 3192 MHz, 6 cores, 12 logical processors.

2.4. Statistical Analysis and Evaluation

The resulting simulated contact forces were compared against the measured in vivo contact forces. The pre-processing of the respective kinematic output curves included sampling, synchronization, and trimming of the curves prior to the calculation of error metrics. For a quantitative evaluation, the following error metrics were calculated, according to the study presented by Chen et al. [19]: mean absolute deviation (MAD); root mean squared error (RMSE); Pearson’s correlation coefficient (r); and the Sprague and Geers metrics of magnitude (M), phase (P), and combined error (C). Furthermore, the curves were plotted for a graphical interpretation.

3. Results

With adequate TKA planning data available, including the segmented 3D surfaces of the femur, tibia, and patella, the data preparation step, including landmark definition and individual file preparation, took an average of approximately 15 min per case. The simulation time for the models ranged from 83 s to 221 s (all below 4 min), with a mean value of 136 s.
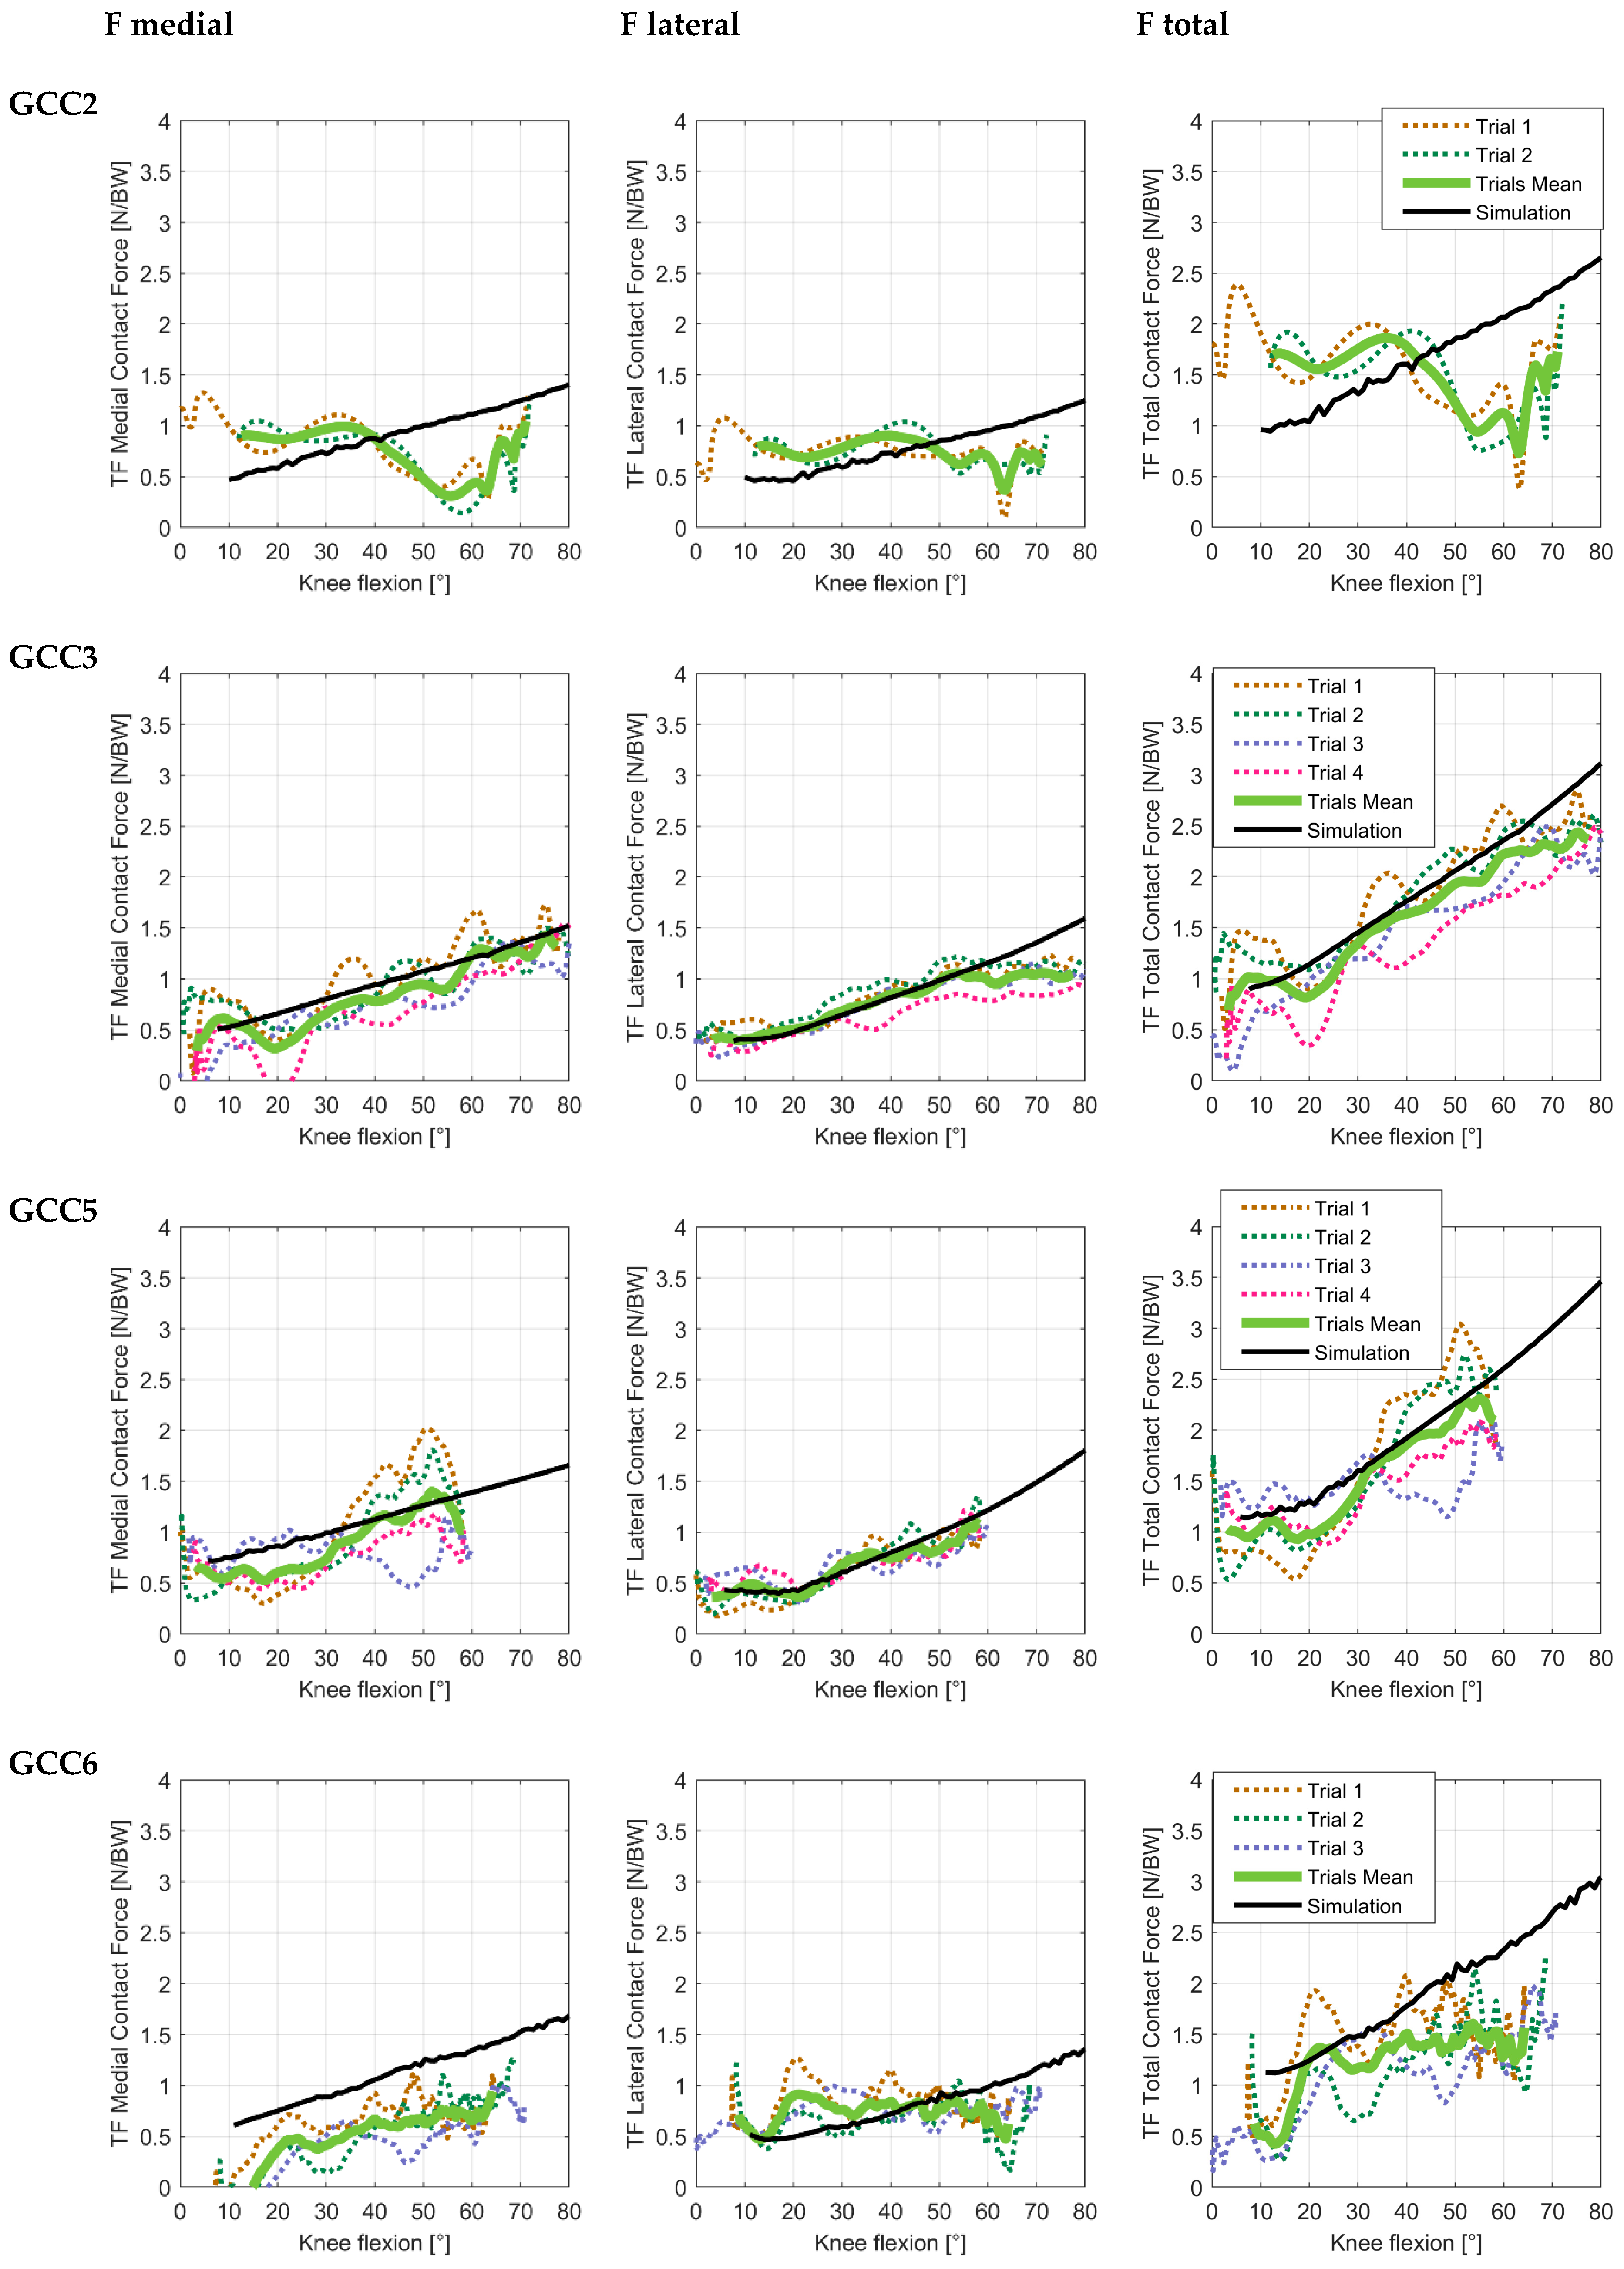
The simulated knee contact forces and the measured in vivo contact forces over knee flexion are given in Figure 4. Quantitative results of the respective comparison are presented in Table 2. For patients GCC3 and GCC5, both the trend and absolute value of the in vivo contact forces were well matched by the simulation (RMSE: 8.15 %BW–39.83 %BW). A strong correlation between measurements and simulation results was found for the mean curves (r: 0.94–0.96). For the patient GCC6, the range of the medial contact force was overestimated (RMSE: 40.6 %BW–66.25 %BW), and the trend of the lateral contact force was not matched (r: 0.01–0.20). Also, for the patient GCC2, the in vivo curve trends were not matched by the simulation (r: 0.30–0.66), and especially the medial contact forces were overestimated in higher degrees of knee flexion (RMSE: 39.49 %BW–48.52 %BW).

4. Discussion

Biomechanical simulation models play a crucial role in orthopedic research and are increasingly showing their potential benefits for clinical application. However, there are still several technical challenges that need to be solved before practical implementation [2]. Some of the main limitations relate to the amount of input data, effort, and time required for personalization and simulation. In our study, we aimed to address these limitations with a new multi-body musculoskeletal simulation model. This model incorporates the relevant advantages of minimal input data required and a significantly reduced data preparation and simulation time compared to previously presented simulation models. For the model validation, four patients with instrumented knee implants were modeled, and the corresponding in vivo measurements during squatting were compared with the simulation model’s predictions.
The mean simulation time was considerably shorter, by a factor of 25 to 135, than reported in the literature so far (Table 3). Fluctuations between patients in the range of approximately 60 s were observed, which may be attributed to the iterative nature of the solver. In AnyBody, using inverse dynamics and the concept of force-dependent kinematics, a gradient sensing optimizer is used to iteratively test joint deformations and muscle forces to satisfy the equilibrium criteria. As a result, solutions can be found faster or slower depending on the patient and respective anatomy.
For GCC3 and GCC5, both the range and the trend of the mean in vivo contact forces were well-matched by the simulation (M = 0.05–0.13, r = 0.94–0.96). In contrast, significant deviations were found with GCC2, for which higher simulated forces were observed at higher degrees of knee flexion, resulting in low correlation coefficients (r = 0.42–0.61). Significant deviations were also found with GCC6, where there was minimal correlation for the mean lateral contact forces (r = 0.01), and, especially, the medial contact forces were overestimated by the simulation (M = 0.90). A possible explanation for the overestimation of contact forces may lie in a general tendency of multi-body simulation models to overestimate contact forces, potentially due to inaccurate modeling of muscles. Factors that may alter muscle recruitment include differences in joint axis locations in muscle moment arms as well as muscle-tendon properties [20]. Smith et al. [21] reported a high relevance of the quadriceps moment arm for tibiofemoral contact forces. Therefore, focusing and optimizing the relevant landmarks and muscle wrapping surfaces may reduce the overestimation of contact forces in the future. However, it is also important to recognize inconsistencies in the in vivo data: the measured in vivo contact forces of GCC2 and the mean lateral contact force of GCC6 decrease over knee flexion, which is implausible. Higher degrees of knee flexion require higher muscle activation and forces for stabilization [22], which would also result in higher contact forces. This positive correlation between knee flexion and contact forces during a squat movement (“deep knee bend”) was confirmed in all patients in the Orthoload database. In contrast, the described implausibility of the GCC2 and GCC6 datasets has not been reported by other groups who used the gait analysis data of the GCC for their validation studies [3,4,6]. Hence, the overestimation of contact forces in higher knee flexion for GCC2 may instead be attributed to measurement artifacts.
In our study, a mean RMSE of 32.4 %BW for the medial and 18.1 %BW for the lateral contact force was found (mean curves). Similar RMSEs were reported in the literature. Stylianou et al. [5] reported an RMSE of 42.3 %BW for the superior/inferior force during squat activity. Ding et al. [8] reported RMSE for the medial contact force of 25.2 %BW to 66.0 %BW and for the lateral contact force of 22.0 %BW to 74.1 %BW during the squat motion. The RMSE for the medial and lateral contact forces during gait were 26 %BW and 42 %BW with the model of Thelen et al. [23], 28.0 %BW and 23.3 %BW with the model of Chen et al. [4], 26 %BW and 35 %BW with the model of Marra et al. [3], 29.0 %BW and 27.3 %BW with the model of Chen et al. [19], and 10 %BW and 35 %BW with the model of Kebbach et al. [6]. This information is also summarized in Table 3.
Table 3. Overview of present and previous validation studies of multi-body simulation models of total knee arthroplasty. RMSE = root mean squared error. BW = body weight. n.a. = not available.
StudyYearActivityNo. of PatientsRMSE Total [%BW], Mean (Range)RMSE Medial [%BW], Mean (Range)RMSE Lateral [%BW],
Mean (Range)
Simulation Time [min]
Stylianou et al. [5]2013Squat142.3 (only superior-inferior)//n.a.
Thelen et al. [23]2014Gait151.02642100
Chen et al. [4]2014Gait144.7 28.0 23.3 n.a.
Marra et al. [3]2015Gait126.0 26.0 35.0 540
Chen et al. [19]2016Gait336.3 (29–44)29.0 (26–34)27.3 (18–36)n.a.
Ding et al. [8]2016Squat377.8 (46.3–101.0)50.2 (25.2–66.0)45.8 (22.0–74.1)n.a.
Kebbach et al. [6]2020Gait139.0 35.0 10.0 n.a.
Present study2024Squat441.7 (19.9–66.1)32.4 (15.9–52.6)18.1 (8.2–26.1)<4

4.1. Limitations

Although our modeling framework has overcome several of the limitations of previous modeling frameworks, including the large amount of input data required and the long simulation times incompatible with the clinical workflow, there are still limitations. First, our workflow requires segmented 3D imaging, which is not always available in clinical routines. However, with the increasing availability of automated artificial intelligence-based segmentation tools, the availability of 3D imaging in TKA planning is expected to increase. Second, there is relevant variability in the prediction accuracy between the different simulations (GCC3 and GCC5 vs. GCC2 and GCC6). While the simulations with lower prediction accuracy include inconsistencies in the experimental in vivo data (decreasing contact forces with increasing knee flexion), this variability still needs to be evaluated further in the future when additional validation datasets are available. This is especially the case due to the small sample size of only four in vivo datasets analyzed. In addition, the in vivo data inconsistencies identified emphasize the need for high-quality, standardized clinical data for validation purposes. Third, although the remaining errors in joint force estimation are similar to those reported in the literature, an increase in accuracy should be targeted to allow in-depth evaluation of the absolute measures of joint contact forces in such preoperative simulations. While remaining absolute errors may not hinder the study of relative comparisons of different treatment options for the individual patient (e.g., different implantation parameters), the clinical significance of respective errors still needs to be evaluated for other applications. This is especially the case for investigations with specific cut-off values, e.g., investigations regarding implant material properties. Fourth, the workflow has been evaluated in isolation from preoperative planning software. Integration with orthopedic preoperative planning software and routines is still required to enable optimization studies, e.g., regarding implant selection and positioning.

4.2. Outlook

Due to its short simulation time, the now validated model allows extensive sensitivity studies on implant design and positioning, providing a first basis for design optimization and definition of generic alignment target ranges. With the reduced preparation and simulation time, the modeling framework shows potential for clinical integration. After further optimization (e.g., of important landmarks in the SSM, wrapping surfaces, and resulting moment lever arms) and larger validation studies (e.g., additionally considering data of the force plates or other activities such as walking or running), integration with orthopedic planning software could be considered. This could provide surgeons with predictions of the effects of different planning variants, e.g., different implant alignments, on the resulting joint contact forces. By defining target conditions, optimal variants could be identified individually for each patient in the future.

5. Conclusions

In this study, a multi-body simulation model able to predict TKA mechanics using sparse input data was validated using in vivo force measurements. The model’s prediction accuracy varied between the different GCCs, with accurate predictions for GCC3 and GCC5 and larger deviations for GCC2 and GCC6. Nevertheless, the overall mean errors were all within the range of errors reported for previous simulation models. The input data for the newly presented simulation model included patient weight and 3D imaging data, hence data that are routinely available when using patient-specific implants and/or instrumentation [24]. Furthermore, with advances in 3D imaging, such as the use of Cone-Beam-CT in imaging of the extremities [25], the availability of 3D imaging is expected to increase. In contrast to several previously presented TKA simulation models, the presented model does not require additional medical imaging data, such as MRI, or motion and force data from motion capture analysis. Statistical motion patterns were used instead of actual motion-capturing data. In addition, the simulation time was significantly reduced compared to previous models [3]. In conclusion, the model showed a comparable accuracy in the estimation of in vivo knee contact forces as previously published multi-body models, but with a minimum of input data and reduced individualization effort.

Author Contributions

Conceptualization, M.A. and K.R.; methodology, M.A. and S.E.; software, M.A. and S.E.; validation, M.A. and S.E.; formal analysis, M.A. and S.E.; investigation, M.A. and S.E.; data curation, M.A. and S.E.; writing—original draft preparation, S.E.; writing—review and editing, M.A. and K.R.; visualization, S.E.; supervision, K.R.; project administration, K.R.; funding acquisition, K.R. All authors have read and agreed to the published version of the manuscript.

Funding

This research received no external funding.

Institutional Review Board Statement

Not applicable.

Informed Consent Statement

Not applicable.

Data Availability Statement

Publicly available datasets were analyzed in this study. These data can be found here: https://simtk.org/projects/kneeloads (accessed on 30 December 2024).

Conflicts of Interest

The authors declare no conflicts of interest.

References

  1. Mehta, S.; Tyler, A.; Hast, M. Understanding the Basics of Computational Models in Orthopaedics: A Nonnumeric Review for Surgeons. J. Am. Acad. Orthop. Surg. 2017, 25, 684–692. [Google Scholar] [CrossRef]
  2. Innocenti, B.; Bori, E.; Armaroli, F.; Schlager, B.; Jonas, R.; Wilke, H.-J.; Galbusera, F. The use of computational models in orthopedic biomechanical research. In Human Orthopaedic Biomechanics; Elsevier: Amsterdam, The Netherlands, 2022; pp. 681–712. ISBN 9780128244814. [Google Scholar]
  3. Marra, M.A.; Vanheule, V.; Fluit, R.; Koopman, B.H.; Rasmussen, J.; Verdonschot, N.; Andersen, M.S. A subject-specific musculoskeletal modeling framework to predict in vivo mechanics of total knee arthroplasty. J. Biomech. Eng. 2015, 137, 20904. [Google Scholar] [CrossRef]
  4. Chen, Z.; Zhang, X.; Ardestani, M.M.; Wang, L.; Liu, Y.; Lian, Q.; He, J.; Li, D.; Jin, Z. Prediction of in vivo joint mechanics of an artificial knee implant using rigid multi-body dynamics with elastic contacts. Proc. Inst. Mech. Eng. H 2014, 228, 564–575. [Google Scholar] [CrossRef]
  5. Stylianou, A.P.; Guess, T.M.; Kia, M. Multibody muscle driven model of an instrumented prosthetic knee during squat and toe rise motions. J. Biomech. Eng. 2013, 135, 41008. [Google Scholar] [CrossRef]
  6. Kebbach, M.; Darowski, M.; Krueger, S.; Schilling, C.; Grupp, T.M.; Bader, R.; Geier, A. Musculoskeletal Multibody Simulation Analysis on the Impact of Patellar Component Design and Positioning on Joint Dynamics after Unconstrained Total Knee Arthroplasty. Materials 2020, 13, 2365. [Google Scholar] [CrossRef]
  7. Otten, E. Inverse and forward dynamics: Models of multi-body systems. Philos. Trans. R. Soc. Lond. B Biol. Sci. 2003, 358, 1493–1500. [Google Scholar] [CrossRef]
  8. Ding, Z.; Nolte, D.; Kit Tsang, C.; Cleather, D.J.; Kedgley, A.E.; Bull, A.M.J. In Vivo Knee Contact Force Prediction Using Patient-Specific Musculoskeletal Geometry in a Segment-Based Computational Model. J. Biomech. Eng. 2016, 138, 21018. [Google Scholar] [CrossRef]
  9. Krueger, C.A.; Austin, M.S.; Levicoff, E.A.; Saxena, A.; Nazarian, D.G.; Courtney, P.M. Substantial Preoperative Work Is Unaccounted for in Total Hip and Knee Arthroplasty. J. Arthroplast. 2020, 35, 2318–2322. [Google Scholar] [CrossRef]
  10. Tzanetis, P.; Fluit, R.; de Souza, K.; Robertson, S.; Koopman, B.; Verdonschot, N. Pre-Planning the Surgical Target for Optimal Implant Positioning in Robotic-Assisted Total Knee Arthroplasty. Bioengineering 2023, 10, 543. [Google Scholar] [CrossRef]
  11. Grosso, M.J.; Courtney, P.M.; Kerr, J.M.; Della Valle, C.J.; Huddleston, J.I. Surgeons’ Preoperative Work Burden Has Increased Before Total Joint Arthroplasty: A Survey of AAHKS Members. J. Arthroplast. 2020, 35, 1453–1457. [Google Scholar] [CrossRef]
  12. Wasterlain, A.S.; Courtney, P.M.; Yayac, M.F.; Nazarian, D.G.; Austin, M.S. Quantifying the Perioperative Work Associated with Total Hip and Knee Arthroplasty: The Burden Has Increased with Contemporary Care Pathways. J. Arthroplast. 2019, 34, 2528–2531. [Google Scholar] [CrossRef] [PubMed]
  13. Fregly, B.J.; Besier, T.F.; Lloyd, D.G.; Delp, S.L.; Banks, S.A.; Pandy, M.G.; D’Lima, D.D. Grand challenge competition to predict in vivo knee loads. J. Orthop. Res. 2012, 30, 503–513. [Google Scholar] [CrossRef]
  14. D’Lima, D.D.; Patil, S.; Steklov, N.; Slamin, J.E.; Colwell, C.W. Tibial forces measured in vivo after total knee arthroplasty. J. Arthroplast. 2006, 21, 255–262. [Google Scholar] [CrossRef] [PubMed]
  15. Wong, P.D.; Callewaert, B.; Desloovere, K.; Labey, L.; Innocenti, B. Determination of In Vivo Three-Dimensional Lower Limb Kinematics for Simulation of High-Flexion Squats. In XII Mediterranean Conference on Medical and Biological Engineering and Computing 2010, Chalkidiki, Greece, 27–30 May 2010; Magjarevic, R., Bamidis, P.D., Pallikarakis, N., Eds.; Springer: Berlin/Heidelberg, Germany, 2010; pp. 483–486. ISBN 978-3-642-13038-0. [Google Scholar]
  16. Asseln, M.; Hänisch, C.; Quack, V.; Radermacher, K. A Mesh Morphing Based Method to Estimate Cruciate Ligament Attachments Based on CT-Data. In Proceedings of the 15th Annual Meeting of the International Society for Computer Assisted Orthopaedic Surgery, Vancouver, BC, Canada, 17–20 June 2015. [Google Scholar]
  17. Amberg, B.; Romdhani, S.; Vetter, T. Optimal Step Nonrigid ICP Algorithms for Surface Registration. In Proceedings of the 2007 IEEE Conference on Computer Vision and Pattern Recognition, Minneapolis, MN, USA, 17–22 June 2007; IEEE: Piscataway, NJ, USA, 2007; pp. 1–8, ISBN 1-4244-1179-3. [Google Scholar]
  18. Zavatsky, A.B. A kinematic-freedom analysis of a flexed-knee-stance testing rig. J. Biomech. 1997, 30, 277–280. [Google Scholar] [CrossRef]
  19. Chen, Z.; Zhang, Z.; Wang, L.; Li, D.; Zhang, Y.; Jin, Z. Evaluation of a subject-specific musculoskeletal modelling framework for load prediction in total knee arthroplasty. Med. Eng. Phys. 2016, 38, 708–716. [Google Scholar] [CrossRef]
  20. Raikova, R.T.; Prilutsky, B.I. Sensitivity of predicted muscle forces to parameters of the optimization-based human leg model revealed by analytical and numerical analyses. J. Biomech. 2001, 34, 1243–1255. [Google Scholar] [CrossRef] [PubMed]
  21. Smith, S.M.; Cockburn, R.A.; Hemmerich, A.; Li, R.M.; Wyss, U.P. Tibiofemoral joint contact forces and knee kinematics during squatting. Gait Posture 2008, 27, 376–386. [Google Scholar] [CrossRef]
  22. Hsu, A.T.; Perry, J.; Gronley, J.K.; Hislop, H.J. Quadriceps force and myoelectric activity during flexed knee stance. Clin. Orthop. Relat. Res. 1993, 288, 254–262. [Google Scholar] [CrossRef]
  23. Thelen, D.G.; Won Choi, K.; Schmitz, A.M. Co-simulation of neuromuscular dynamics and knee mechanics during human walking. J. Biomech. Eng. 2014, 136, 21033. [Google Scholar] [CrossRef] [PubMed]
  24. Lachiewicz, P.F.; Henderson, R.A. Patient-specific instruments for total knee arthroplasty. J. Am. Acad. Orthop. Surg. 2013, 21, 513–518. [Google Scholar] [CrossRef]
  25. Dartus, J.; Jacques, T.; Martinot, P.; Pasquier, G.; Cotten, A.; Migaud, H.; Morel, V.; Putman, S. The advantages of cone-beam computerised tomography (CT) in pain management following total knee arthroplasty, in comparison with conventional multi-detector CT. Orthop. Traumatol. Surg. Res. 2021, 107, 102874. [Google Scholar] [CrossRef]
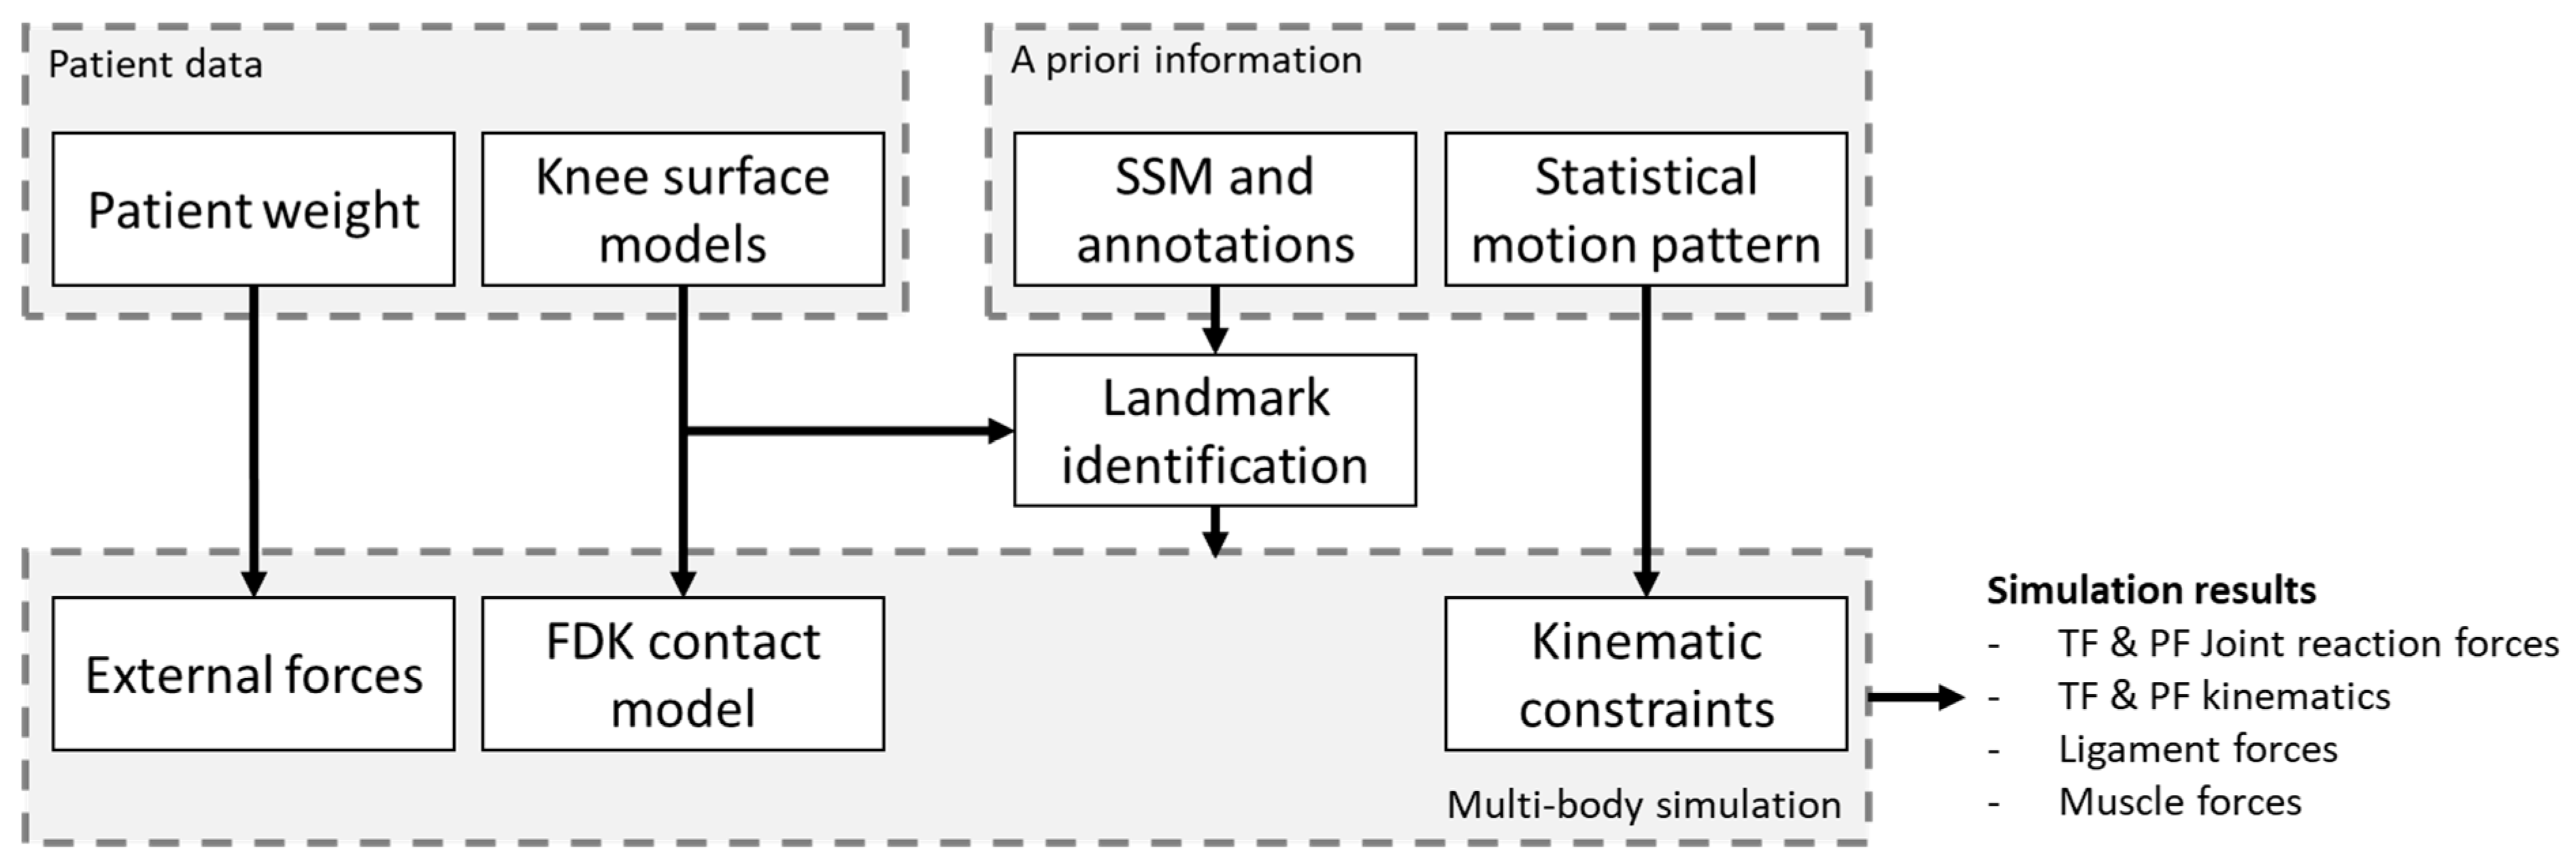
Figure 1. Input and output information for the biomechanical simulation framework presented. Abbreviations: SSM = statistical shape model. FDK = force-dependent kinematics. TF = tibiofemoral. PF = patellofemoral.
Biomechanics 05 00008 g001
Figure 2. Process for landmark identification of the distal femur. (A) The distal femoral 3D surface model of patient GCC3 in the bone-specific coordinate system based on three manually defined landmarks for initial registration, with calculated references (blue). (B) Individual femoral 3D surface model with mean shape (green) prior to morphing. (C) The mean shape of the SSM morphed into the individual 3D surface model, which is shown together with the respective annotations (red).
Biomechanics 05 00008 g002
Figure 3. Patient-specific simulation models of the GCC patients analyzed. During the simulation, a squat motion is performed. A legend of the model components is given with the model of patient GCC6. GCC = Grand Challenge Competition. LTL = lateral patellofemoral ligament. LCL = lateral collateral ligament. MPFL = medial patellofemoral ligament. MCL = medial collateral ligament.
Biomechanics 05 00008 g003
Figure 4. Qualitative comparison of the simulated contact forces with the GCC in vivo contact forces. GCC = Grand Challenge Competition.
Biomechanics 05 00008 g004
Table 2. Quantitative comparison of the simulated contact forces with the GCC in vivo contact forces in terms of mean absolute deviation (MAD); root mean squared error (RMSE); Pearson’s correlation coefficient (r); and metrics by Sprague and Geers, including the magnitude (M), phase (P), and combined error (C). GCC = Grand Challenge Competition. BW = body weight.
SubjectTrial/MeanMedial Contact ForceLateral Contact Force
MAD
[%BW]
RMSE
[%BW]
rMPCMAD
[%BW]
RMSE
[%BW]
rMPC
GCC2Trial 135.1339.490.350.110.140.1824.0828.250.370.010.120.12
Trial 239.0748.520.660.190.180.2625.3128.200.300.010.120.12
Mean36.8942.730.610.180.150.2423.2026.090.420.030.110.11
GCC3Trial 116.6820.090.84−0.060.060.0911.4114.500.940.060.050.08
Trial 216.3819.310.850.040.060.0716.6120.970.850.050.070.08
Trial 320.5823.430.930.190.050.2014.2022.040.920.200.050.20
Trial 425.8531.940.920.210.090.2325.6333.130.940.420.050.43
Mean13.6815.940.950.120.040.129.9716.440.940.130.050.14
GCC5Trial 135.8239.830.90−0.120.110.1611.1713.400.900.060.060.09
Trial 224.7126.440.920.010.080.088.8810.070.940.010.040.04
Trial 327.5636.670.140.300.100.3115.1516.910.770.080.070.11
Trial 428.4830.980.840.350.050.3610.8913.100.850.030.060.07
Mean15.6518.500.950.130.050.146.808.150.960.050.030.06
GCC6Trial 136.4940.600.690.530.070.5325.5332.420.20−0.150.120.19
Trial 253.3154.960.930.760.120.7717.1126.450.120.160.110.19
Trial 363.5666.250.801.080.151.0920.7223.620.120.010.100.10
Mean51.6152.610.910.900.080.9017.3821.870.01−0.030.090.10
The bold font is the central values for the study.
Disclaimer/Publisher’s Note: The statements, opinions and data contained in all publications are solely those of the individual author(s) and contributor(s) and not of MDPI and/or the editor(s). MDPI and/or the editor(s) disclaim responsibility for any injury to people or property resulting from any ideas, methods, instructions or products referred to in the content.