


Gait Kinematics and Asymmetries Affecting Fall Risk in People with Chronic Stroke: A Retrospective Study
Abstract
1. Introduction
2. Method
2.1. Participants
2.2. Experimental Setup
2.3. Retrospective Fall History
2.4. Data Analysis
2.5. Statistical Analysis
3. Results
4. Discussion
5. Conclusions
Author Contributions
Funding
Institutional Review Board Statement
Informed Consent Statement
Data Availability Statement
Acknowledgments
Conflicts of Interest
References
- Czernuszenko, A. Risk factors for falls in post-stroke patients treated in a neurorehabilitation ward. Neurol. Neurochir. Pol. 2007, 41, 28–35. [Google Scholar] [PubMed]
- Langhorne, P.; Stott, D.J.; Robertson, L.; MacDonald, J.; Jones, L.; McAlpine, C.; Dick, F.; Taylor, G.S.; Murray, G. Medical complications after stroke: A multicenter study. Stroke 2000, 31, 1223–1229. [Google Scholar] [CrossRef] [PubMed]
- Mackintosh, S.F.; Goldie, P.; Hill, K. Falls incidence and factors associated with falling in older, community-dwelling, chronic stroke survivors (>1 year after stroke) and matched controls. Aging Clin. Exp. Res. 2005, 17, 74–81. [Google Scholar] [CrossRef] [PubMed]
- Grant, J.S.; Hamilton, S. Falls in a rehabilitation center: A retrospective and comparative analysis. Rehabil. Nurs. 1987, 12, 74–76. [Google Scholar] [CrossRef] [PubMed]
- Hyndman, D.; Ashburn, A.; Stack, E. Fall events among people with stroke living in the community: Circumstances of falls and characteristics of fallers. Arch. Phys. Med. Rehab. 2002, 83, 165–170. [Google Scholar] [CrossRef]
- Lamb, S.E.; Ferrucci, L.; Volapto, S.; Fried, L.; Guralnik, J.M. Risk factors for falling in home-dwelling older women with stroke: The Women’s Health and Aging Study. Stroke 2003, 34, 494–501. [Google Scholar] [CrossRef]
- Campbell, G.B.; Matthews, J.T. An integrative review of factors associated with falls during post-stroke rehabilitation. J. Nurs. Scholarsh. 2010, 42, 395–404. [Google Scholar] [CrossRef]
- Punt, M.; Bruijn, S.M.; van Schooten, K.S.; Pijnappels, M.; van de Port, I.G.; Wittink, H.; van Dieen, J.H. Characteristics of daily life gait in fall and non fall-prone stroke survivors and controls. J. Neuroeng. Rehabil. 2016, 13, 67. [Google Scholar] [CrossRef]
- Cham, R.; Redfern, M.S. Changes in gait when anticipating slippery floors. Gait Posture 2002, 15, 159–171. [Google Scholar] [CrossRef]
- Burpee, J.L.; Lewek, M.D. Biomechanical gait characteristics of naturally occurring unsuccessful foot clearance during swing in individuals with chronic stroke. Clin. Biomech. 2015, 30, 1102–1107. [Google Scholar] [CrossRef]
- Kavanagh, J.J.; Menz, H.B. Accelerometry: A technique for quantifying movement patterns during walking. Gait Posture 2008, 28, 1–15. [Google Scholar] [CrossRef]
- Steinberg, N.; Nemet, D.; Pantanowitz, M.; Eliakim, A. Gait Pattern, Impact to the Skeleton and Postural Balance in Overweight and Obese Children: A Review. Sports 2018, 6, 75. [Google Scholar] [CrossRef]
- Martinikorena, I.; Martinez-Ramirez, A.; Gomez, M.; Lecumberri, P.; Casas-Herrero, A.; Cadore, E.L.; Millor, N.; Zambom-Ferraresi, F.; Idoate, F.; Izquierdo, M. Gait Variability Related to Muscle Quality and Muscle Power Output in Frail Nonagenarian Older Adults. J. Am. Med. Dir. Assoc. 2016, 17, 162–167. [Google Scholar] [CrossRef]
- Kulkarni, S.; Nagarkar, A. Basic gait pattern and impact of fall risk factors on gait among older adults in India. Gait Posture 2021, 88, 16–21. [Google Scholar] [CrossRef]
- Bhatt, T.; Wening, J.D.; Pai, Y.C. Influence of gait speed on stability: Recovery from anterior slips and compensatory stepping. Gait Posture 2005, 21, 146–156. [Google Scholar] [CrossRef]
- Cheuy, V.A.; Hastings, M.K.; Commean, P.K.; Ward, S.R.; Mueller, M.J. Intrinsic foot muscle deterioration is associated with metatarsophalangeal joint angle in people with diabetes and neuropathy. Clin. Biomech. 2013, 28, 1055–1060. [Google Scholar] [CrossRef]
- Brach, J.S.; Berlin, J.; VanSwearingen, J.; Newman, A.; Studenski, S. Too much or too little step width variability is associated with a fall history only in older persons who walk at or near normal gait speed. J. Am. Geriatr. Soc. 2005, 53, S133–S134. [Google Scholar]
- Toebes, M.J.P.; Hoozemans, M.J.M.; Furrer, R.; Dekker, J.; van Dieen, J.H. Local dynamic stability and variability of gait are associated with fall history in elderly subjects. Gait Posture 2012, 36, 527–531. [Google Scholar] [CrossRef] [PubMed]
- Verghese, J.; Robbins, M.; Holtzer, R.; Zimmerman, M.; Wang, C.; Xue, X.N.; Lipton, R.B. Gait dysfunction in mild cognitive impairment syndromes. J. Am. Geriatr. Soc. 2008, 56, 1244–1251. [Google Scholar] [CrossRef]
- Montero-Odasso, M.; Casas, A.; Hansen, K.T.; Bilski, P.; Gutmanis, I.; Wells, J.L.; Borrie, M.J. Quantitative gait analysis under dual-task in older people with mild cognitive impairment: A reliability study. J. Neuroeng. Rehabil. 2009, 6, 35. [Google Scholar] [CrossRef]
- Espy, D.D.; Yang, F.; Bhatt, T.; Pai, Y.C. Independent influence of gait speed and step length on stability and fall risk. Gait Posture 2010, 32, 378–382. [Google Scholar] [CrossRef] [PubMed]
- Scott, V.; Votova, K.; Scanlan, A.; Close, J. Multifactorial and functional mobility assessment tools for fall risk among older adults in community, home-support, long-term and acute care settings. Age Ageing 2007, 36, 130–139. [Google Scholar] [CrossRef] [PubMed]
- van Schooten, K.S.; Pijnappels, M.; Rispens, S.M.; Elders, P.J.M.; Lips, P.; van Dieen, J.H. Ambulatory Fall-Risk Assessment: Amount and Quality of Daily-Life Gait Predict Falls in Older Adults. J. Gerontol. Biol. 2015, 70, 608–615. [Google Scholar] [CrossRef]
- Wang, S.; Varas-Diaz, G.; Dusane, S.; Wang, Y.; Bhatt, T. Slip-induced fall-risk assessment based on regular gait pattern in older adults. J. Biomech. 2019, 96, 109334. [Google Scholar] [CrossRef]
- Malone, L.A.; Bastian, A.J. Spatial and Temporal Asymmetries in Gait Predict Split-Belt Adaptation Behavior in Stroke. Neurorehab. Neural Res. 2014, 28, 230–240. [Google Scholar] [CrossRef]
- Wei, T.S.; Liu, P.T.; Chang, L.W.; Liu, S.Y. Gait asymmetry, ankle spasticity, and depression as independent predictors of falls in ambulatory stroke patients. PLoS ONE 2017, 12, e0177136. [Google Scholar] [CrossRef]
- Yogev, G.; Plotnik, M.; Peretz, C.; Giladi, N.; Hausdorff, J.M. Gait asymmetry in patients with Parkinson’s disease and elderly fallers: When does the bilateral coordination of gait require attention? Exp. Brain Res. 2007, 177, 336–346. [Google Scholar] [CrossRef]
- Lewek, M.D.; Bradley, C.E.; Wutzke, C.J.; Zinder, S.M. The relationship between spatiotemporal gait asymmetry and balance in individuals with chronic stroke. J. Appl. Biomech. 2014, 30, 31–36. [Google Scholar] [CrossRef]
- Patterson, K.K.; Parafianowicz, I.; Danells, C.J.; Closson, V.; Verrier, M.C.; Staines, W.R.; Black, S.E.; McIlroy, W.E. Gait asymmetry in community-ambulating stroke survivors. Arch. Phys. Med. Rehabil. 2008, 89, 304–310. [Google Scholar] [CrossRef]
- Awad, L.N.; Palmer, J.A.; Pohlig, R.T.; Binder-Macleod, S.A.; Reisman, D.S. Walking speed and step length asymmetry modify the energy cost of walking after stroke. Neurorehabil. Neural Repair. 2015, 29, 416–423. [Google Scholar] [CrossRef]
- Allen, J.L.; Kautz, S.A.; Neptune, R.R. Step length asymmetry is representative of compensatory mechanisms used in post-stroke hemiparetic walking. Gait Posture 2011, 33, 538–543. [Google Scholar] [CrossRef] [PubMed]
- Scholz, J.P. Dynamic Pattern Theory—Some Implications for Therapeutics. Phys. Ther. 1990, 70, 827–843. [Google Scholar] [CrossRef] [PubMed]
- Sadeghi, H.; Shojaedin, S.S.; Abbasi, A.; Alijanpour, E.; Vieira, M.F.; Svoboda, Z.; Nazarpour, K. Lower-Extremity Intra-Joint Coordination and Its Variability between Fallers and Non-Fallers during Gait. Appl. Sci. 2021, 11, 2840. [Google Scholar] [CrossRef]
- Ko, S.U.; Gunter, K.B.; Costello, M.; Aurm, H.; MacDonald, S.; White, K.N.; Snow, C.M.; Hayes, W.C. Stride width discriminates gait of side-fallers compared to other-directed fallers during overground walking. J. Aging Health 2007, 19, 200–212. [Google Scholar] [CrossRef]
- Kangas, M.; Vikman, I.; Nyberg, L.; Korpelainen, R.; Lindblom, J.; Jamsa, T. Comparison of real-life accidental falls in older people with experimental falls in middle-aged test subjects. Gait Posture 2012, 35, 500–505. [Google Scholar] [CrossRef]
- Smeesters, C.; Hayes, W.C.; McMahon, T.A. Determining fall direction and impact location for various disturbances and gait speeds using the articulated total body model. J. Biomech. Eng. 2007, 129, 393–399. [Google Scholar] [CrossRef]
- Smeesters, C.; Hayes, W.C.; McMahon, T.A. Disturbance type and gait speed affect fall direction and impact location. J. Biomech. 2001, 34, 309–317. [Google Scholar] [CrossRef]
- Baetens, T.; De Kegel, A.; Palmans, T.; Oostra, K.; Vanderstraeten, G.; Cambier, D. Gait analysis with cognitive-motor dual tasks to distinguish fallers from nonfallers among rehabilitating stroke patients. Arch. Phys. Med. Rehabil. 2013, 94, 680–686. [Google Scholar] [CrossRef][Green Version]
- Punt, M.; Bruijn, S.M.; Wittink, H.; van de Port, I.G.; Van Dieën, J.H. Do clinical assessments, steady-state or daily-life gait characteristics predict falls in ambulatory chronic stroke survivors? J. Rehabil. Med. 2017, 49, 402–409. [Google Scholar] [CrossRef]
- Hale, W.A.; Delaney, M.J.; Cable, T. Accuracy of patient recall and chart documentation of falls. J. Am. Board Fam. Pract. 1993, 6, 239–242. [Google Scholar]
- Alexander, L.D.; Black, S.E.; Patterson, K.K.; Gao, F.Q.; Danells, C.J.; McIlroy, W.E. Association Between Gait Asymmetry and Brain Lesion Location in Stroke Patients. Stroke 2009, 40, 537–544. [Google Scholar] [CrossRef] [PubMed]
- Milovanovic, I.; Popovic, D.B. Principal component analysis of gait kinematics data in acute and chronic stroke patients. Comput. Math. Methods Med. 2012, 2012, 649743. [Google Scholar] [CrossRef] [PubMed]
- Bhatt, T.; Wang, Y.R.; Wang, S.J.; Kannan, L. Perturbation Training for Fall-Risk Reduction in Healthy Older Adults: Interference and Generalization to Opposing Novel Perturbations Post Intervention. Front. Sports Act. Living 2021, 3, 697169. [Google Scholar] [CrossRef] [PubMed]
- Karamanidis, K.; Epro, G.; McCrum, C.; Konig, M. Improving Trip- and Slip-Resisting Skills in Older People: Perturbation Dose Matters. Exerc. Sport Sci. Rev. 2020, 48, 40–47. [Google Scholar] [CrossRef]
- Little, V.L.; McGuirk, T.E.; Patten, C. Impaired Limb Shortening following Stroke: What’s in a Name? PLoS ONE 2014, 9, e110140. [Google Scholar] [CrossRef]
- Eng, J.J.; Winter, D.A.; Patla, A.E. Strategies for recovery from a trip in early and late swing during human walking. Exp. Brain Res. 1994, 102, 339–349. [Google Scholar] [CrossRef]
- Dusane, S.; Gangwani, R.; Patel, P.; Bhatt, T. Does stroke-induced sensorimotor impairment and perturbation intensity affect gait-slip outcomes? J. Biomech. 2021, 118, 110255. [Google Scholar] [CrossRef]
- Yang, F.; Espy, D.; Bhatt, T.; Pai, Y.C. Two types of slip-induced falls among community dwelling older adults. J. Biomech. 2012, 45, 1259–1264. [Google Scholar] [CrossRef]
- Marsden, J.; Stevenson, V.; McFadden, C.; Swain, I.; Taylor, P. The effects of functional electrical stimulation on walking in hereditary and spontaneous spastic paraparesis. Neuromodulation 2013, 16, 256–260, discussion 260. [Google Scholar] [CrossRef]
- Chou, L.S.; Draganich, L.F. Placing the trailing foot closer to an obstacle reduces flexion of the hip, knee, and ankle to increase the risk of tripping. J. Biomech. 1998, 31, 685–691. [Google Scholar] [CrossRef]
- Van Der Kruk, E.; Silverman, A.K.; Reilly, P.; Bull, A.M. Compensation due to age-related decline in sit-to-stand and sit-to-walk. J. Biomech. 2021, 122, 110411. [Google Scholar] [CrossRef] [PubMed]
- Qu, X.; Hu, X.; Lew, F.L. Differences in lower extremity muscular responses between successful and failed balance recovery after slips. Int. J. Ind. Ergon. 2012, 42, 499–504. [Google Scholar] [CrossRef]
- Verheyden, G.; Vereeck, L.; Truijen, S.; Troch, M.; Herregodts, I.; Lafosse, C.; Nieuwboer, A.; De Weerdt, W. Trunk performance after stroke and the relationship with balance, gait and functional ability. Clin. Rehabil. 2006, 20, 451–458. [Google Scholar] [CrossRef] [PubMed]
- Yang, F.; Pai, C. Alteration in community-dwelling older adults level walking following perturbation training. J. Biomech. 2013, 46, 2463–2468. [Google Scholar] [CrossRef]
- Karthikbabu, S.; Chakrapani, M.; Ganesan, S.; Ellajosyla, R. Pelvic alignment in standing, and its relationship with trunk control and motor recovery of lower limb after stroke. Neurol. Clin. Neurosci. 2017, 5, 22–28. [Google Scholar] [CrossRef]
- Milosevic, M.; Masani, K.; Kuipers, M.J.; Rahouni, H.; Verrier, M.C.; McConville, K.M.; Popovic, M.R. Trunk control impairment is responsible for postural instability during quiet sitting in individuals with cervical spinal cord injury. Clin. Biomech. 2015, 30, 507–512. [Google Scholar] [CrossRef]
- Azuma, Y.; Chin, T.; Miura, Y. The relationship between balance ability and walking ability using the Berg Balance Scale in people with transfemoral amputation. Prosthet. Orthot. Int. 2019, 43, 396–401. [Google Scholar] [CrossRef]
- Varas-Diaz, G.; Cordo, P.; Dusane, S.; Bhatt, T. Effect of robotic-assisted ankle training on gait in stroke participants: A case series study. Physiother. Theory Pract. 2021; online ahead of print. [Google Scholar] [CrossRef]
- Meder, K.G.; LoJacono, C.T.; Rhea, C.K. A Systematic Review of Non-Pharmacological Interventions to Improve Gait Asymmetries in Neurological Populations. Symmetry 2022, 14, 281. [Google Scholar] [CrossRef]
- Melzer, I.; Benjuya, N.; Kaplanski, J. Postural stability in the elderly: A comparison between fallers and non-fallers. Age Ageing 2004, 33, 602–607. [Google Scholar] [CrossRef]


| Variable | Fall (n = 21) | Non-Fall (n = 15) | p-Value |
|---|---|---|---|
| Height (cm) | 173.3 (10.1) | 169.3 (11) | 0.27 |
| Weight (kg) | 82.4 (16.4) | 74.9 (12.3) | 0.15 |
| Age (years) | 58.1 (7.8) | 60.3 (12.3) | 0.52 |
| Gender | 14 males | 9 males | 0.69 |
| Foot length (cm) | 30.2 (2.3) | 28.8 (2.8) | 0.11 |
| Foot-to-hip height (cm) | 87.3 (5.1) | 84.4 (4.6) | 0.09 |
| Leg length (cm) | 93.6 (5.1) | 90.9 (5) | 0.14 |
| Femur length (cm) | 47.6 (3.8) | 46.5 (2.7) | 0.38 |
| Variables | Non-Paretic Side | |||
|---|---|---|---|---|
| All-Fall (n = 21) | Slip-Fall (n = 11) | Trip-Fall (n = 7) | Non-Fall (n = 15) | |
| Step length/BH | 0.26 (0.07) | 0.25 (0.08) | 0.24 (0.07) | 0.27 (0.09) |
| Stride length/BH | 0.54 (0.16) | 0.53 (0.18) | 0.46 (0.16) * | 0.57 (0.18) |
| Stance time (s) | 117.09 (20.03) | 117.5 (23.33) | 119.5 (24.22) | 121.88 (41.24) |
| Swing time (s) | 43.59 (11.66) | 44.76 (13.49) | 40.81 (10.75) | 46.16 (10.75) |
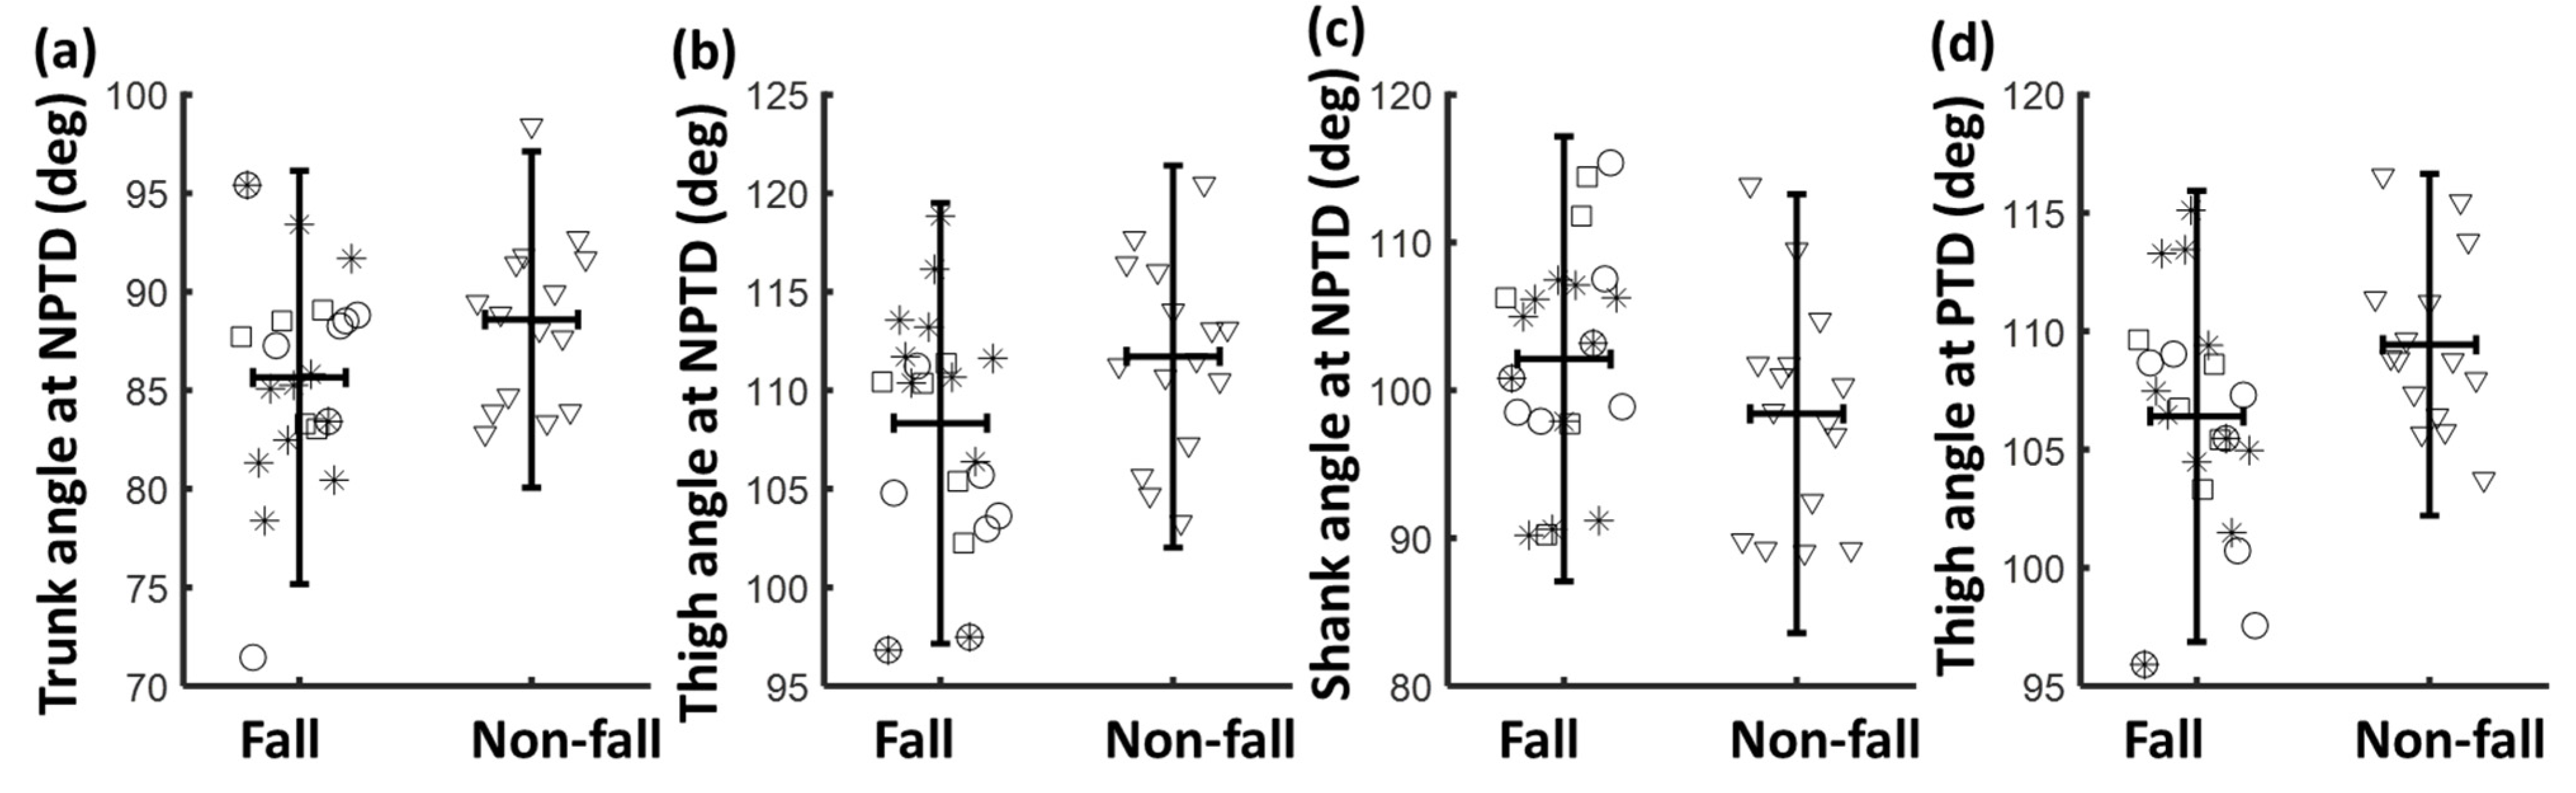
| Trunk (deg) | 85.65 (5.36) ** | 85.7 (5.42) * | 86.17 (7.04) | 88.59 (4.36) |
| Thigh (deg) | 108.33 (5.68) ** | 109.71 (6.79) | 103.24 (4.79) *** | 111.72 (4.88) |
| Shank (deg) | 102.12 (7.81) * | 100.53 (7.02) | 103.18 (6.34) * | 98.42 (7.56) |
| Foot (deg) | 75.84 (8.88) | 76.82 (9.26) | 75.59 (7.63) | 73.65 (8.02) |
| COMx | 0.4 (0.06) | 0.39 (0.07) | 0.39 (0.06) | 0.41 (0.04) |
| Paretic side | ||||
| Step length/BH | 0.27 (0.08) | 0.27 (0.1) | 0.22 (0.08) * | 0.27 (0.08) |
| Stride length/BH | 0.53 (0.14) | 0.52 (0.16) | 0.46 (0.13) * | 0.56 (0.17) |
| Stance time (s) | 103.49 (26.28) | 107.24 (34.16) | 108.62 (37.51) | 110.09 (31.1) |
| Swing time (s) | 55.37 (12.44) | 53.39 (13.73) | 48.48 (12.93) ** | 59.51 (14.75) |
| Trunk (deg) | 88.28 (4.96) | 86.68 (4.99) | 89.09 (5.27) | 88.12 (7.42) |
| Thigh (deg) | 106.4 (4.99) ** | 107.04 (5.63) * | 103.52 (5.3) *** | 109.43 (4.43) |
| Shank (deg) | 101.77 (6.58) | 102.01 (6.45) | 99.97 (7.09) | 99.87 (9.24) |
| Foot (deg) | 75.88 (7.89) | 74.91 (8.94) | 78.58 (8.02) * | 73.93 (8.75) |
| COMx | 0.37 (0.04) | 0.37 (0.05) | 0.36 (0.04) | 0.38 (0.05) |
| Variables | Symmetry Ratio | |||
|---|---|---|---|---|
| All Fall (n = 21) | Slip-Fall (n = 11) | Trip-Fall (n = 7) | Non-Fall (n = 15) | |
| Step length | 1.13 (0.51) | 1.21 (0.67) | 0.96 (0.37) | 1.04 (0.27) |
| Stride length | 1.01 (0.18) | 1.02(0.23) | 1.06 (0.28) | 1.01 (0.11) |
| Stance time | 0.88 (0.13) | 0.91 (0.16) | 0.89 (0.13) | 0.93 (0.14) |
| Swing time | 1.36 (0.45) | 1.3 (0.52) | 1.27 (0.48) | 1.41 (0.68) |
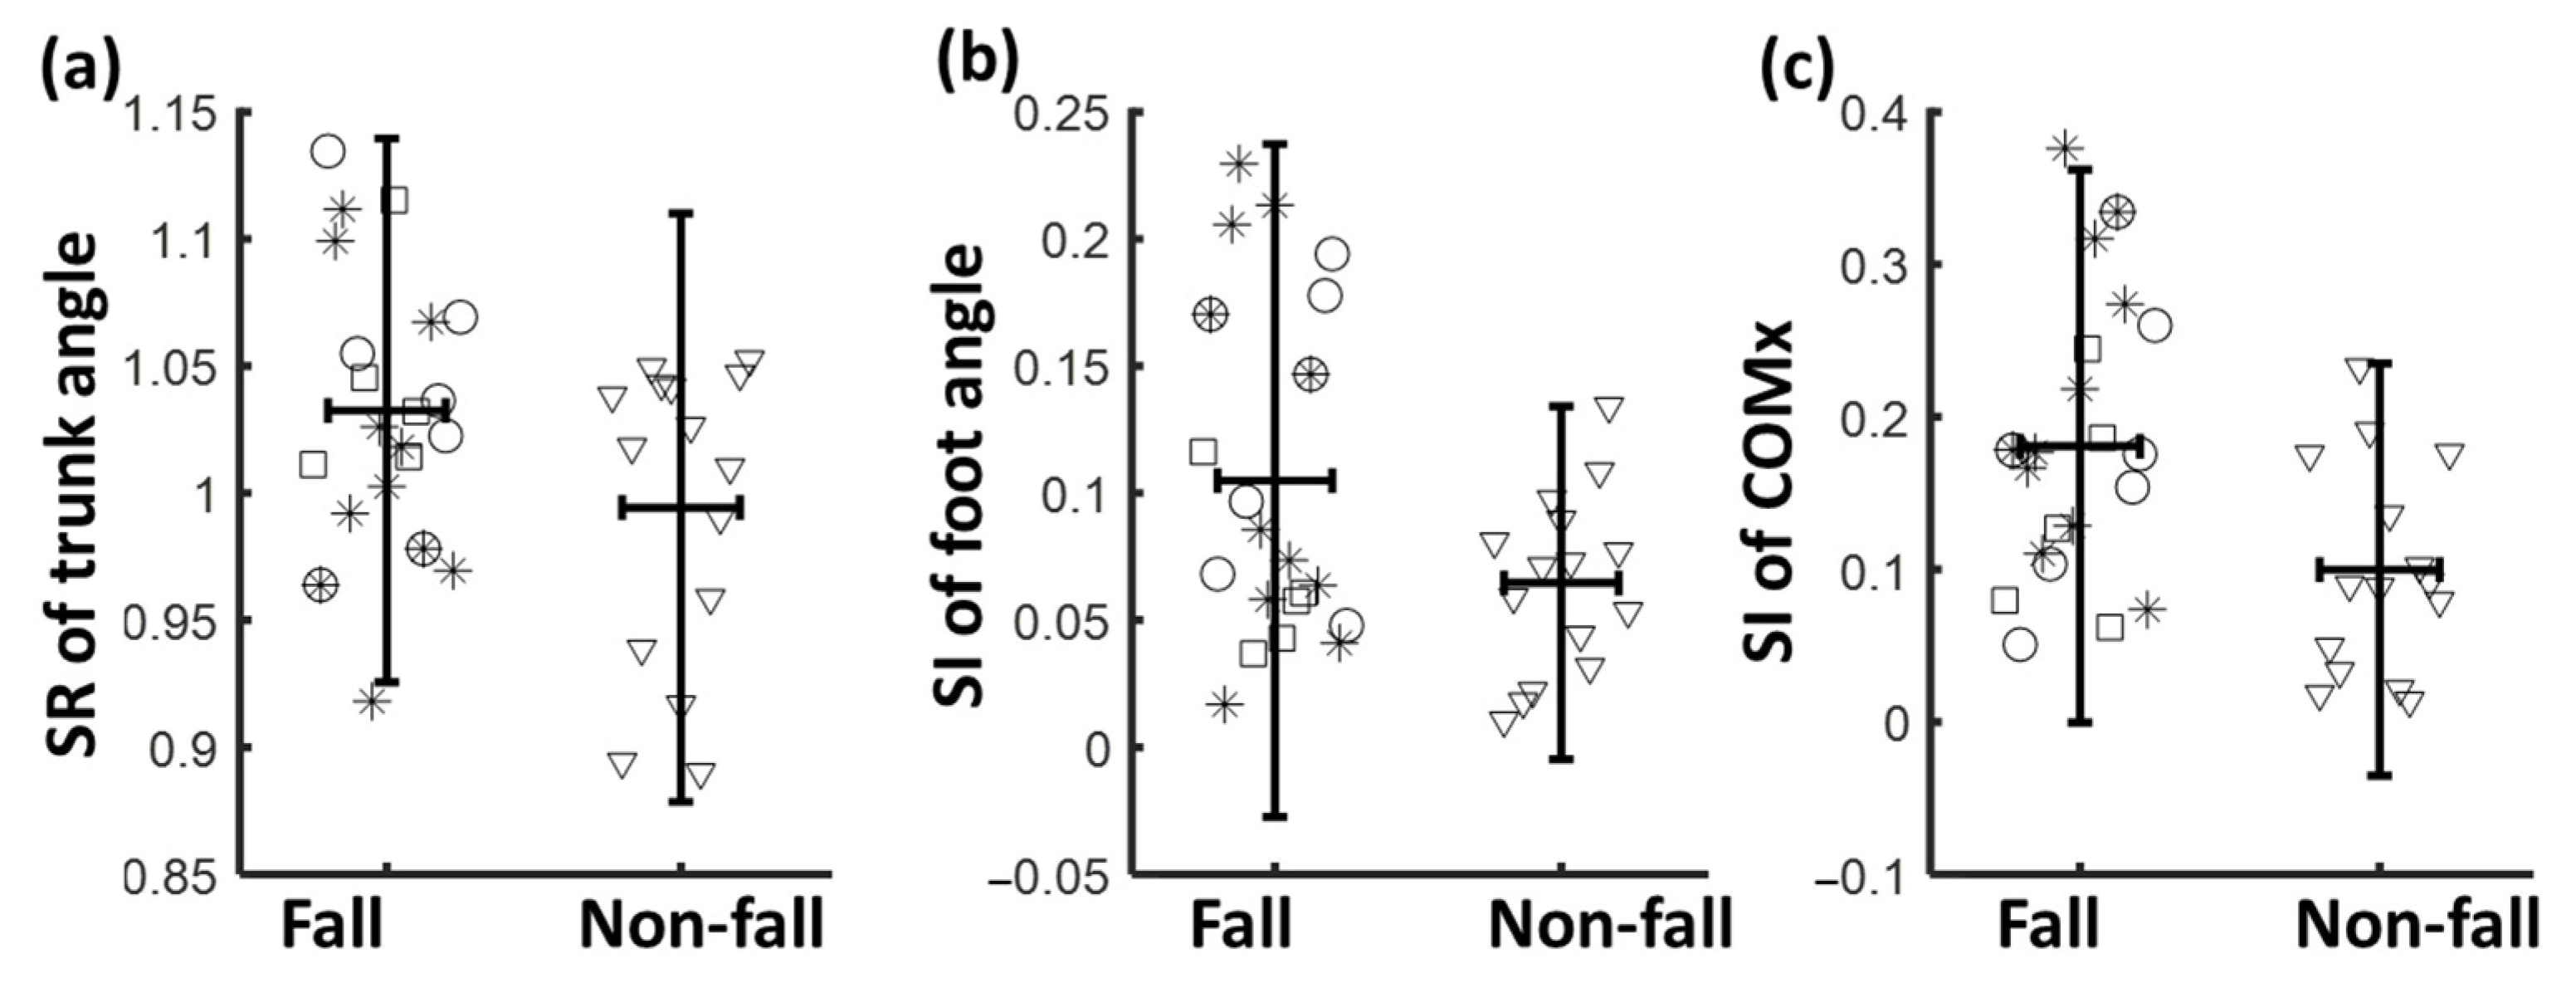
| Trunk | 1.03 (0.06) ** | 1.01 (0.06) | 1.04 (0.06) ** | 0.99 (0.06) |
| Thigh | 0.98 (0.05) | 0.98 (0.05) | 1 (0.05) | 0.98 (0.05) |
| Shank | 1 (0.08) | 1.02 (0.07) | 0.97 (0.09) * | 1.02 (0.07) |
| Foot | 1.01 (0.13) | 0.98 (0.14) | 1.05 (0.15) | 1.01 (0.08) |
| COMx | 0.94 (±0.21) | 0.97 (0.26) | 0.95 (0.22) | 0.93 (0.1) |
| Symmetry Index | ||||
| Step length | 0.25 (0.26) | 0.32 (0.33) * | 0.3 (0.32) * | 0.17 (0.16) |
| Stride length | 0.08 (0.12) | 0.1 (0.15) | 0.12 (0.18) | 0.07 (0.08) |
| Stance time | 0.17 (0.1) | 0.17 (0.1) | 0.16 (0.09) | 0.14 (0.09) |
| Swing time | 0.35 (0.24) | 0.36 (0.26) | 0.35 (0.24) | 0.36 (0.28) |
| Trunk | 0.05 (0.04) | 0.05 (0.04) | 0.05 (0.04) | 0.05 (0.04) |
| Thigh | 0.04 (0.03) | 0.04 (0.04) | 0.04 (0.03) | 0.04 (0.03) |
| Shank | 0.06 (0.04) | 0.06 (0.05) | 0.08 (0.06) | 0.05 (0.04) |
| Foot | 0.1 (0.08) ** | 0.12 (0.08) *** | 0.13 (0.06) *** | 0.06 (0.05) |
| COMx | 0.18 (0.13) *** | 0.21 (0.13) *** | 0.18 (0.12) ** | 0.1 (0.09) |
| Variable | Actual Effect Size | Actual Power | Sample Size Required > 80% Power |
|---|---|---|---|
| Trunk at NPTD | 0.65 | 74% | 42 |
| Thigh at NPTD | 0.67 | 76% | 40 |
| Thigh at PTD | 0.67 | 77% | 39 |
| SR for Trunk | 0.66 | 76% | 40 |
| SI for Foot | 0.63 | 72% | 44 |
| SI for COMx | 0.72 | 83% | 34 |
Publisher’s Note: MDPI stays neutral with regard to jurisdictional claims in published maps and institutional affiliations. |
© 2022 by the authors. Licensee MDPI, Basel, Switzerland. This article is an open access article distributed under the terms and conditions of the Creative Commons Attribution (CC BY) license (https://creativecommons.org/licenses/by/4.0/).
Share and Cite
Wang, S.; Bhatt, T. Gait Kinematics and Asymmetries Affecting Fall Risk in People with Chronic Stroke: A Retrospective Study. Biomechanics 2022, 2, 453-465. https://doi.org/10.3390/biomechanics2030035
Wang S, Bhatt T. Gait Kinematics and Asymmetries Affecting Fall Risk in People with Chronic Stroke: A Retrospective Study. Biomechanics. 2022; 2(3):453-465. https://doi.org/10.3390/biomechanics2030035
Chicago/Turabian StyleWang, Shuaijie, and Tanvi Bhatt. 2022. "Gait Kinematics and Asymmetries Affecting Fall Risk in People with Chronic Stroke: A Retrospective Study" Biomechanics 2, no. 3: 453-465. https://doi.org/10.3390/biomechanics2030035
APA StyleWang, S., & Bhatt, T. (2022). Gait Kinematics and Asymmetries Affecting Fall Risk in People with Chronic Stroke: A Retrospective Study. Biomechanics, 2(3), 453-465. https://doi.org/10.3390/biomechanics2030035