The 10/5 Repeated Jumps Test: Are 10 Repetitions and Three Trials Necessary?
Abstract
:1. Introduction
2. Materials and Methods
2.1. Subjects
2.2. Design
2.3. Methodology
2.4. Statistical Analysis
3. Results
4. Discussion
5. Conclusions
Author Contributions
Funding
Institutional Review Board Statement
Informed Consent Statement
Data Availability Statement
Conflicts of Interest
References
- Harper, D.; Hobbs, S.; Moore, J. The 10 to 5 repeated jump test. A new test for evaluating reactive strength. In Proceedings of the British Association of Sports and Exercises Sciences Student Conference, Chester, UK, 12–13 April 2011. [Google Scholar]
- Beattie, K.; Carson, B.P.; Lyons, M.; Kenny, I.C. The Relationship between Maximal Strength and Reactive Strength. Int. J. Sports Physiol. Perform. 2017, 12, 548–553. [Google Scholar] [CrossRef]
- Makaruk, H.; Winchester, J.B.; Czaplicki, A.; Sacewicz, T.; Zieliński, J.; Sadowski, J. Effects of Assisted and Traditional Drop Jumps on Jumping Performance. Int. J. Sports Sci. Coach. 2014, 9, 1217–1225. [Google Scholar] [CrossRef]
- Beattie, K.; Flanagan, E. Establishing the reliability & meaningful change of the drop-jump reactive strength index. J. Aust. Strength Cond. 2015, 23, 12–18. [Google Scholar]
- Makaruk, H.; Sacewicz, T. The Effect of Drop Height and Body Mass on Drop Jump Intensity. Biol. Sport 2011, 28, 63–67. [Google Scholar] [CrossRef] [Green Version]
- Markwick, W.J.; Bird, S.P.; Tufano, J.J.; Seitz, L.B.; Haff, G.G. The intraday reliability of the Reactive Strength Index calculated from a drop jump in professional men’s basketball. Int. J. Sports Physiol. Perform. 2015, 10, 482–488. [Google Scholar] [CrossRef]
- Comyns, T.M.; Flanagan, E.; Harper, D.; Fleming, S.; Fitzgerald, E. Interday reliability and usefulness of reactive strength index derived from the ten to five repeated jumps test. J. Sports Sci. 2017, 35, S80. [Google Scholar]
- Comyns, T.M.; Flanagan, E.P.; Fleming, S.; Fitzgerald, E.; Harper, D.J. Inter-Day Reliability and Usefulness of Reactive Strength Index Derived From Two Maximal Rebound Jump Tests. Int. J. Sports Physiol. Perform. 2019, 14, 1200–1204. [Google Scholar] [CrossRef]
- Lloyd, R.S.; Oliver, J.L.; Hughes, M.G.; Williams, C.A. Reliability and validity of field-based measures of leg stiffness and reactive strength index in youths. J. Sports Sci. 2009, 27, 1565–1573. [Google Scholar] [CrossRef]
- Browne, D.; Flanagan, E. Reactive Strength Endurance: Part 1 The response of reactive strength to fast stretch-shortening cycle fatigue. Sportperfsci 2018, 1, 1–3. [Google Scholar]
- Nagahara, R.; Naito, H.; Miyashiro, K.; Morin, J.B.; Zushi, K. Traditional and ankle-specific vertical jumps as strength-power indicators for maximal sprint acceleration. J. Sports Med. Phys. Fitness 2014, 54, 691–699. [Google Scholar]
- Lockie, R.G.; Murphy, A.J.; Knight, T.J.; Janse de Jonge, X.A. Factors That Differentiate Acceleration Ability in Field Sport Athletes. J. Strength Cond. Res. 2011, 25, 2704–2714. [Google Scholar] [CrossRef]
- Young, W.B.; James, R.; Montgomery, I. Is muscle power related to running speed with changes of direction? J. Sports Med. Phys. Fitness 2002, 42, 282–288. [Google Scholar]
- Nicol, C.; Avela, J.; Komi, P.V. The Stretch-Shortening Cycle A Model to Study Naturally Occurring Neuromuscular Fatigue. J. Biomech. 2000, 33, 1197–1206. [Google Scholar]
- Patterson, M.; Caulfield, B. A method for monitoring reactive strength index. Procedia Eng. 2010, 2, 3115–3120. [Google Scholar] [CrossRef]
- Schmidtbleicher, D. Training for Power Events. In Encyclopaedia of Sports Medicine, 3rd ed.; John Wiley & Sons: Oxford, UK, 1992. [Google Scholar]
- Ramirez-Campillo, R.; Alvarez, C.; García-Pinillos, F.; Sanchez-Sanchez, J.; Yanci, J.; Castillo, D.; Loturco, I.; Chaabene, H.; Moran, J.; Izquierdo, M. Optimal Reactive Strength Index: Is it an Accurate Variable to Optimize Plyometric Training Effects on Measures of Physical Fitness in Young Soccer Players? J. Strength Cond. Res. 2018, 1, 885–893. [Google Scholar] [CrossRef] [Green Version]
- Stratford, C.; Dos’Santos, T.; McMahon, J.J. A Comparison Between the Drop Jump and 10/5 Repeated Jumps Test to Measure the Reactive Strength Index. Prof. Strength Cond. 2020, 57, 23–28. [Google Scholar]
- Klavora, P. Vertical-jump tests: A critical review. Strength Cond. J. 2000, 22, 70–75. [Google Scholar] [CrossRef]
- Pérez-Castilla, A.; McMahon, J.J.; Comfort, P.; García-Ramos, A. Assessment of loaded squat jump height with a free-weight barbell and Smith machine. J. Strength Cond. Res. 2020, 34, 671–677. [Google Scholar] [CrossRef]
- Koo, T.K.; Li, M.Y. A Guideline of Selecting and Reporting Intraclass Correlation Coefficients for Reliability Research. J. Chiropr. Med. 2016, 15, 155–163. [Google Scholar] [CrossRef] [Green Version]
- Cohen, J. Statistical Analysis for the Behavioural Sciences; Lawrence Erlbaum: Hillsdale, NJ, USA, 1988. [Google Scholar]
- Cohen, J. Statistical Power Analysis for the Behavioural Sciences; Lawrence Erlbaum: Hillsdale, NJ, USA, 1977. [Google Scholar]
- Hopkins, W. A Scale of Magnitudes for Effect Statistics. Available online: http://www.sportsci.org/resource/stats/effectmag.html (accessed on 18 February 2020).
- Racic, V.; Pavic, A.; Brownjohn, J.M.W. Number of successive cycles necessary to achieve stability of selected ground reaction force variables during continuous jumping. J. Sport Sci. Med. 2009, 8, 639–647. [Google Scholar]
- Gore, S.J.; Marshall, B.M.; Franklyn-Miller, A.D.; Falvey, E.C.; Moran, K.A. The number of trials required to obtain a representative movement pattern during a hurdle hop exercise. J. Appl. Biomech. 2016, 32, 295–300. [Google Scholar] [CrossRef]
- James, C.R.; Herman, J.A.; Dufek, J.S.; Bates, B.T. Number of trials necessary to achieve performance stability of selected ground reaction force variables during landing. J. Sport Sci. Med. 2007, 6, 126–134. [Google Scholar]
- Rodano, R.; Squadrone, R. Stability of selected lower limb joint kinetic parameters during vertical jump. J. Appl. Biomech. 2002, 18, 83–89. [Google Scholar] [CrossRef]
- Makaruk, H.; Czaplicki, A.; Sacewicz, T.; Sadowski, J. The effects of single versus repeated plyometrics on landing biomechanics and jumping performance in men. Biol. Sport 2014, 31, 9–14. [Google Scholar] [CrossRef] [Green Version]
- De Vita, P.; Skelly, W.A. Effect of landing stiffness on joint kinetics and energetics in the lower extremity. Med. Sci. Sports Exerc. 1992, 24, 108–115. [Google Scholar]
- Hatze, H. Motion variability—Its definition, quantification, and origin. J. Mot. Behav. 1986, 18, 5–16. [Google Scholar] [CrossRef]
- Louder, T.; Thompson, B.J.; Banks, N.; Bressel, E. A mixed-methods approach to evaluating the internal validity of the reactive strength index. Sports 2019, 7, 157. [Google Scholar] [CrossRef] [Green Version]
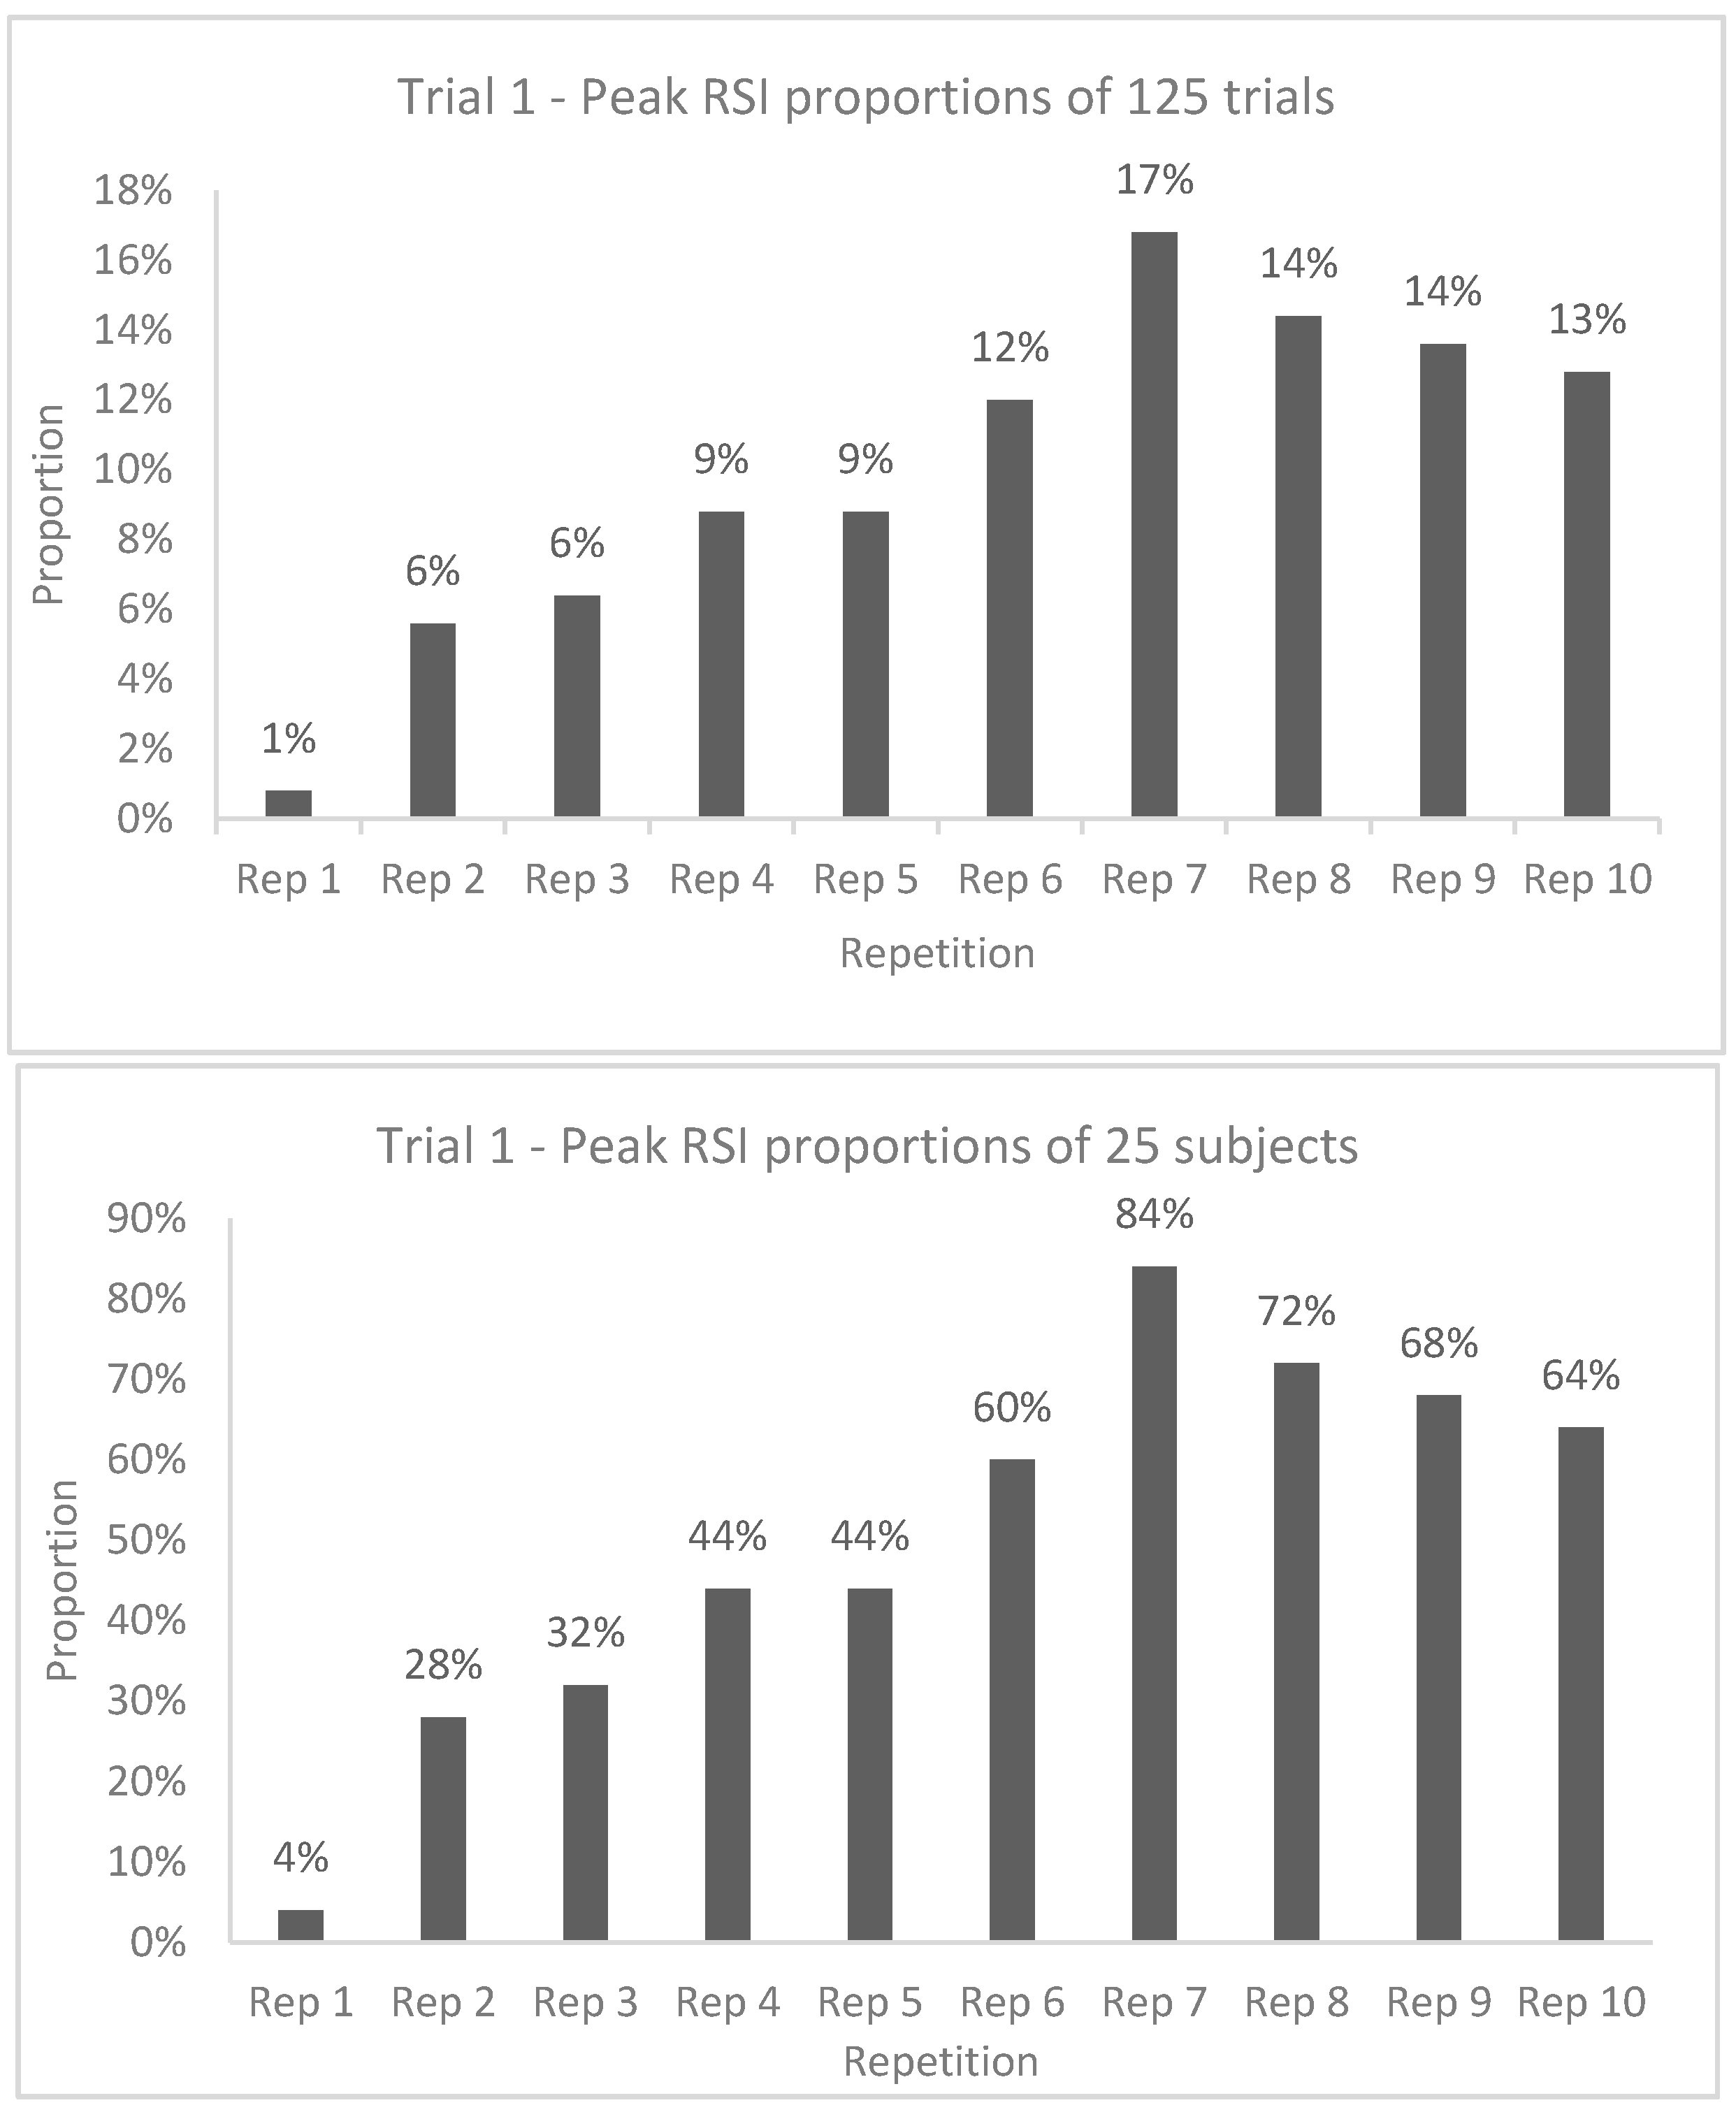
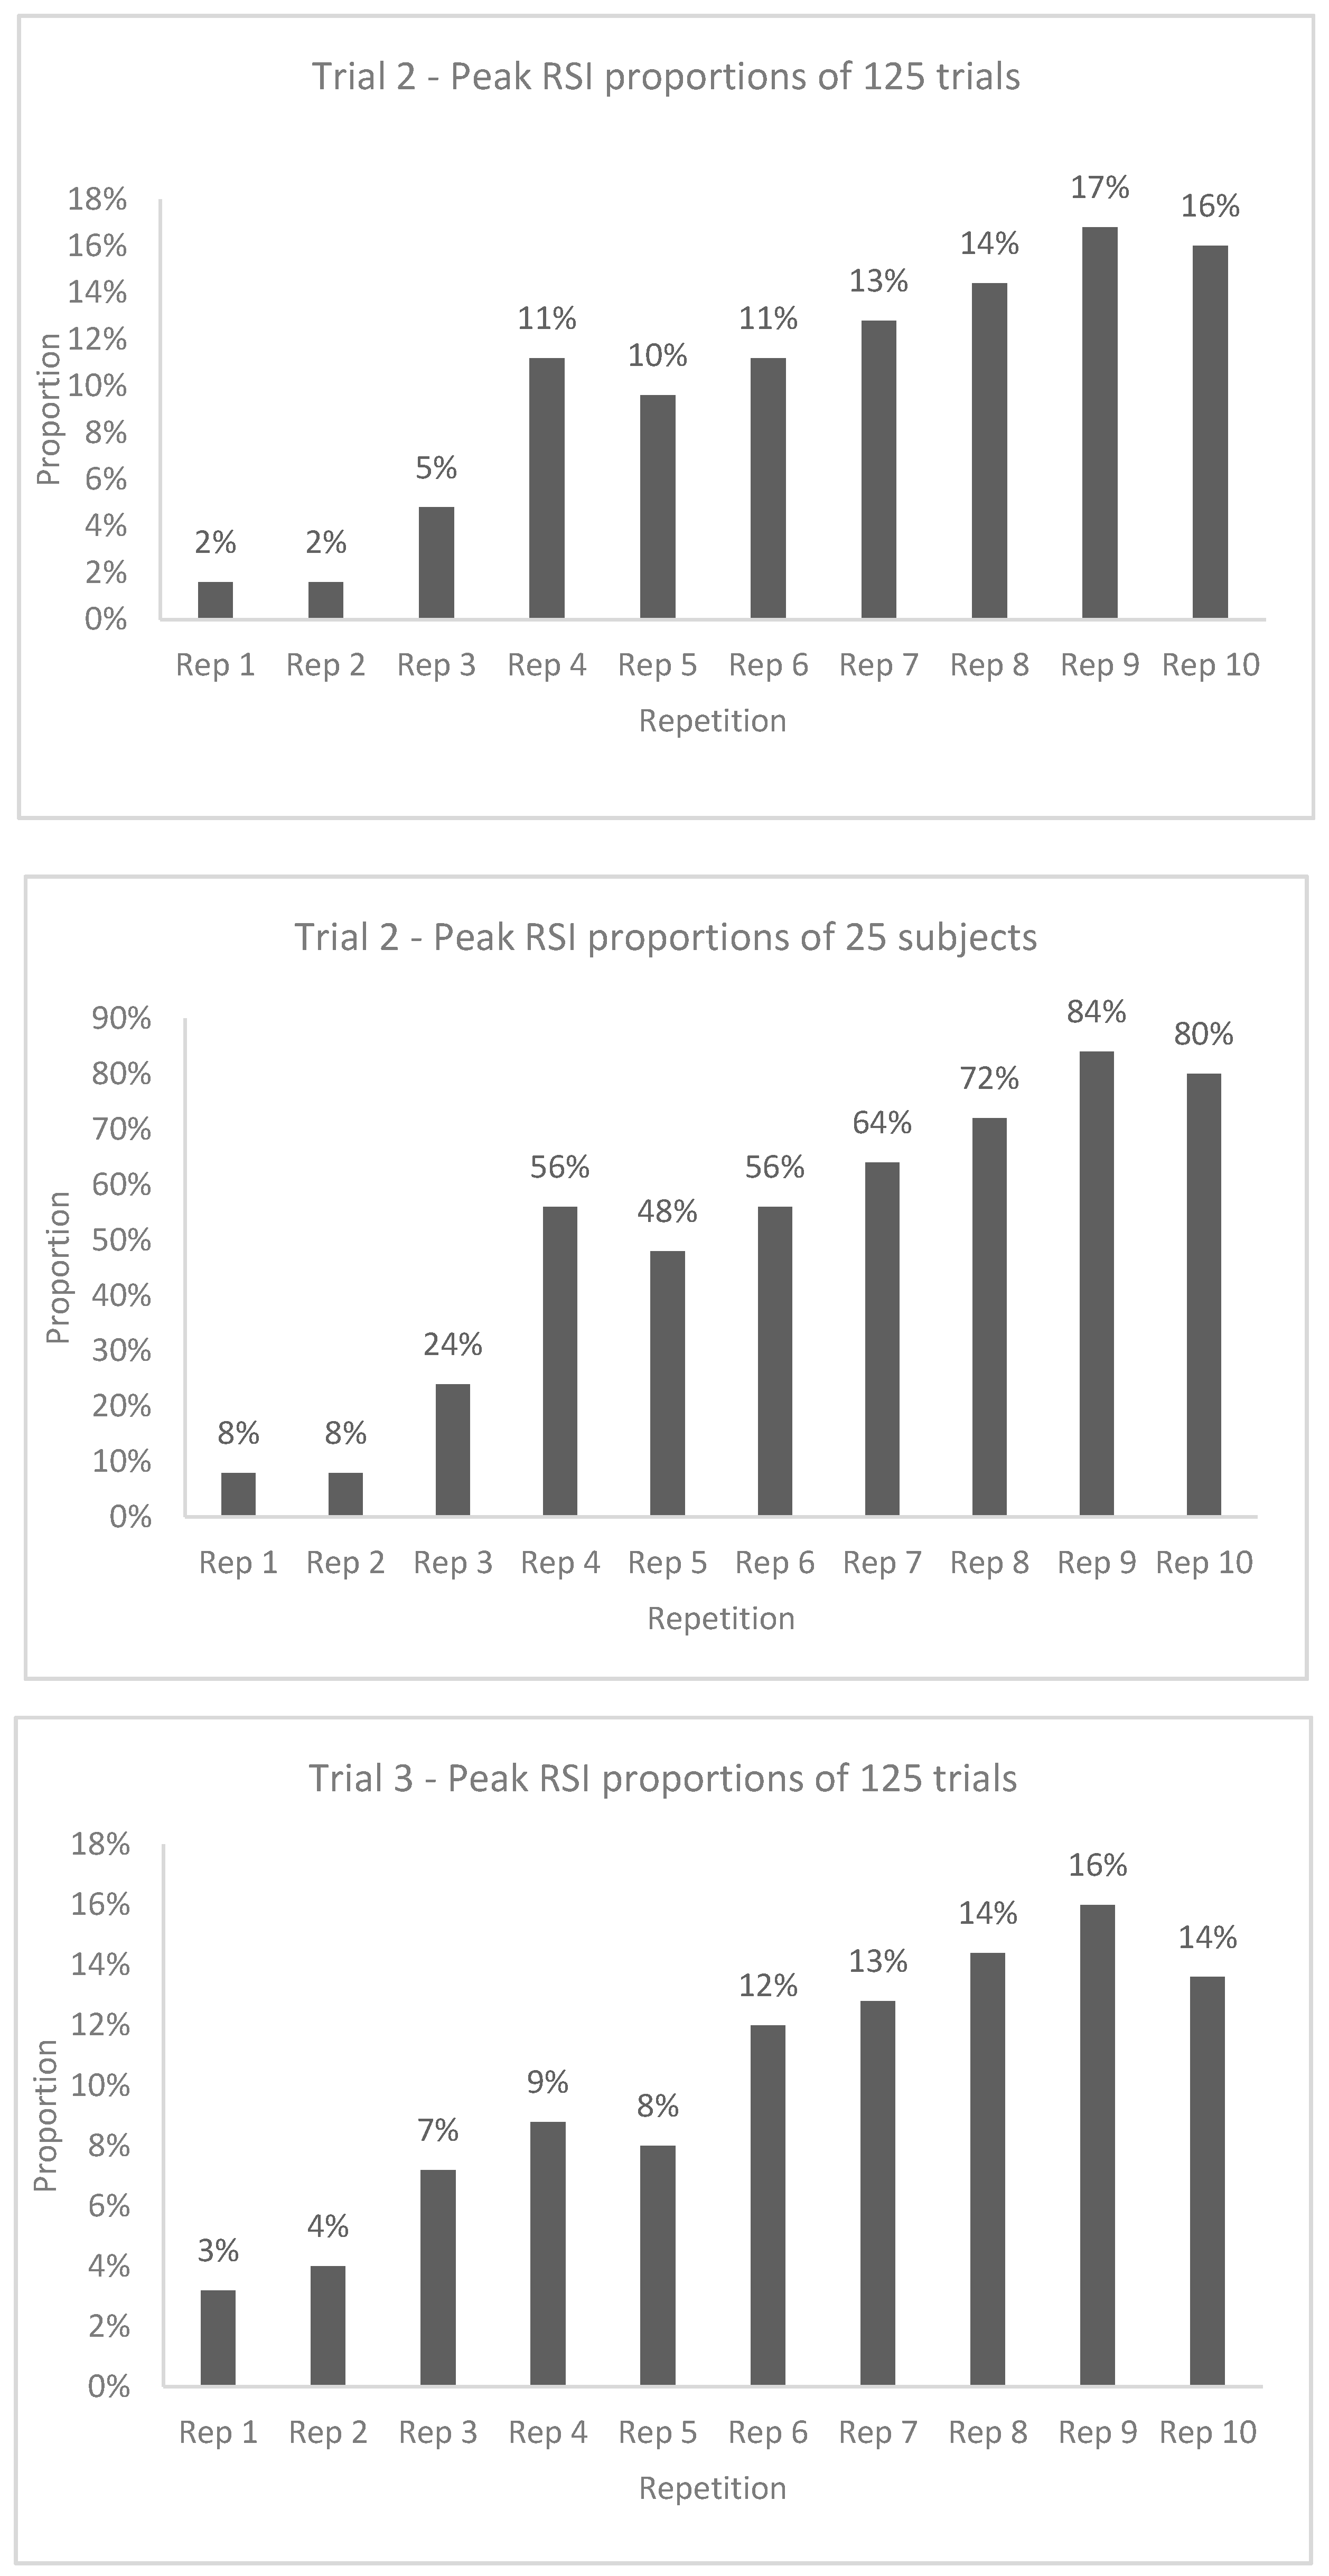
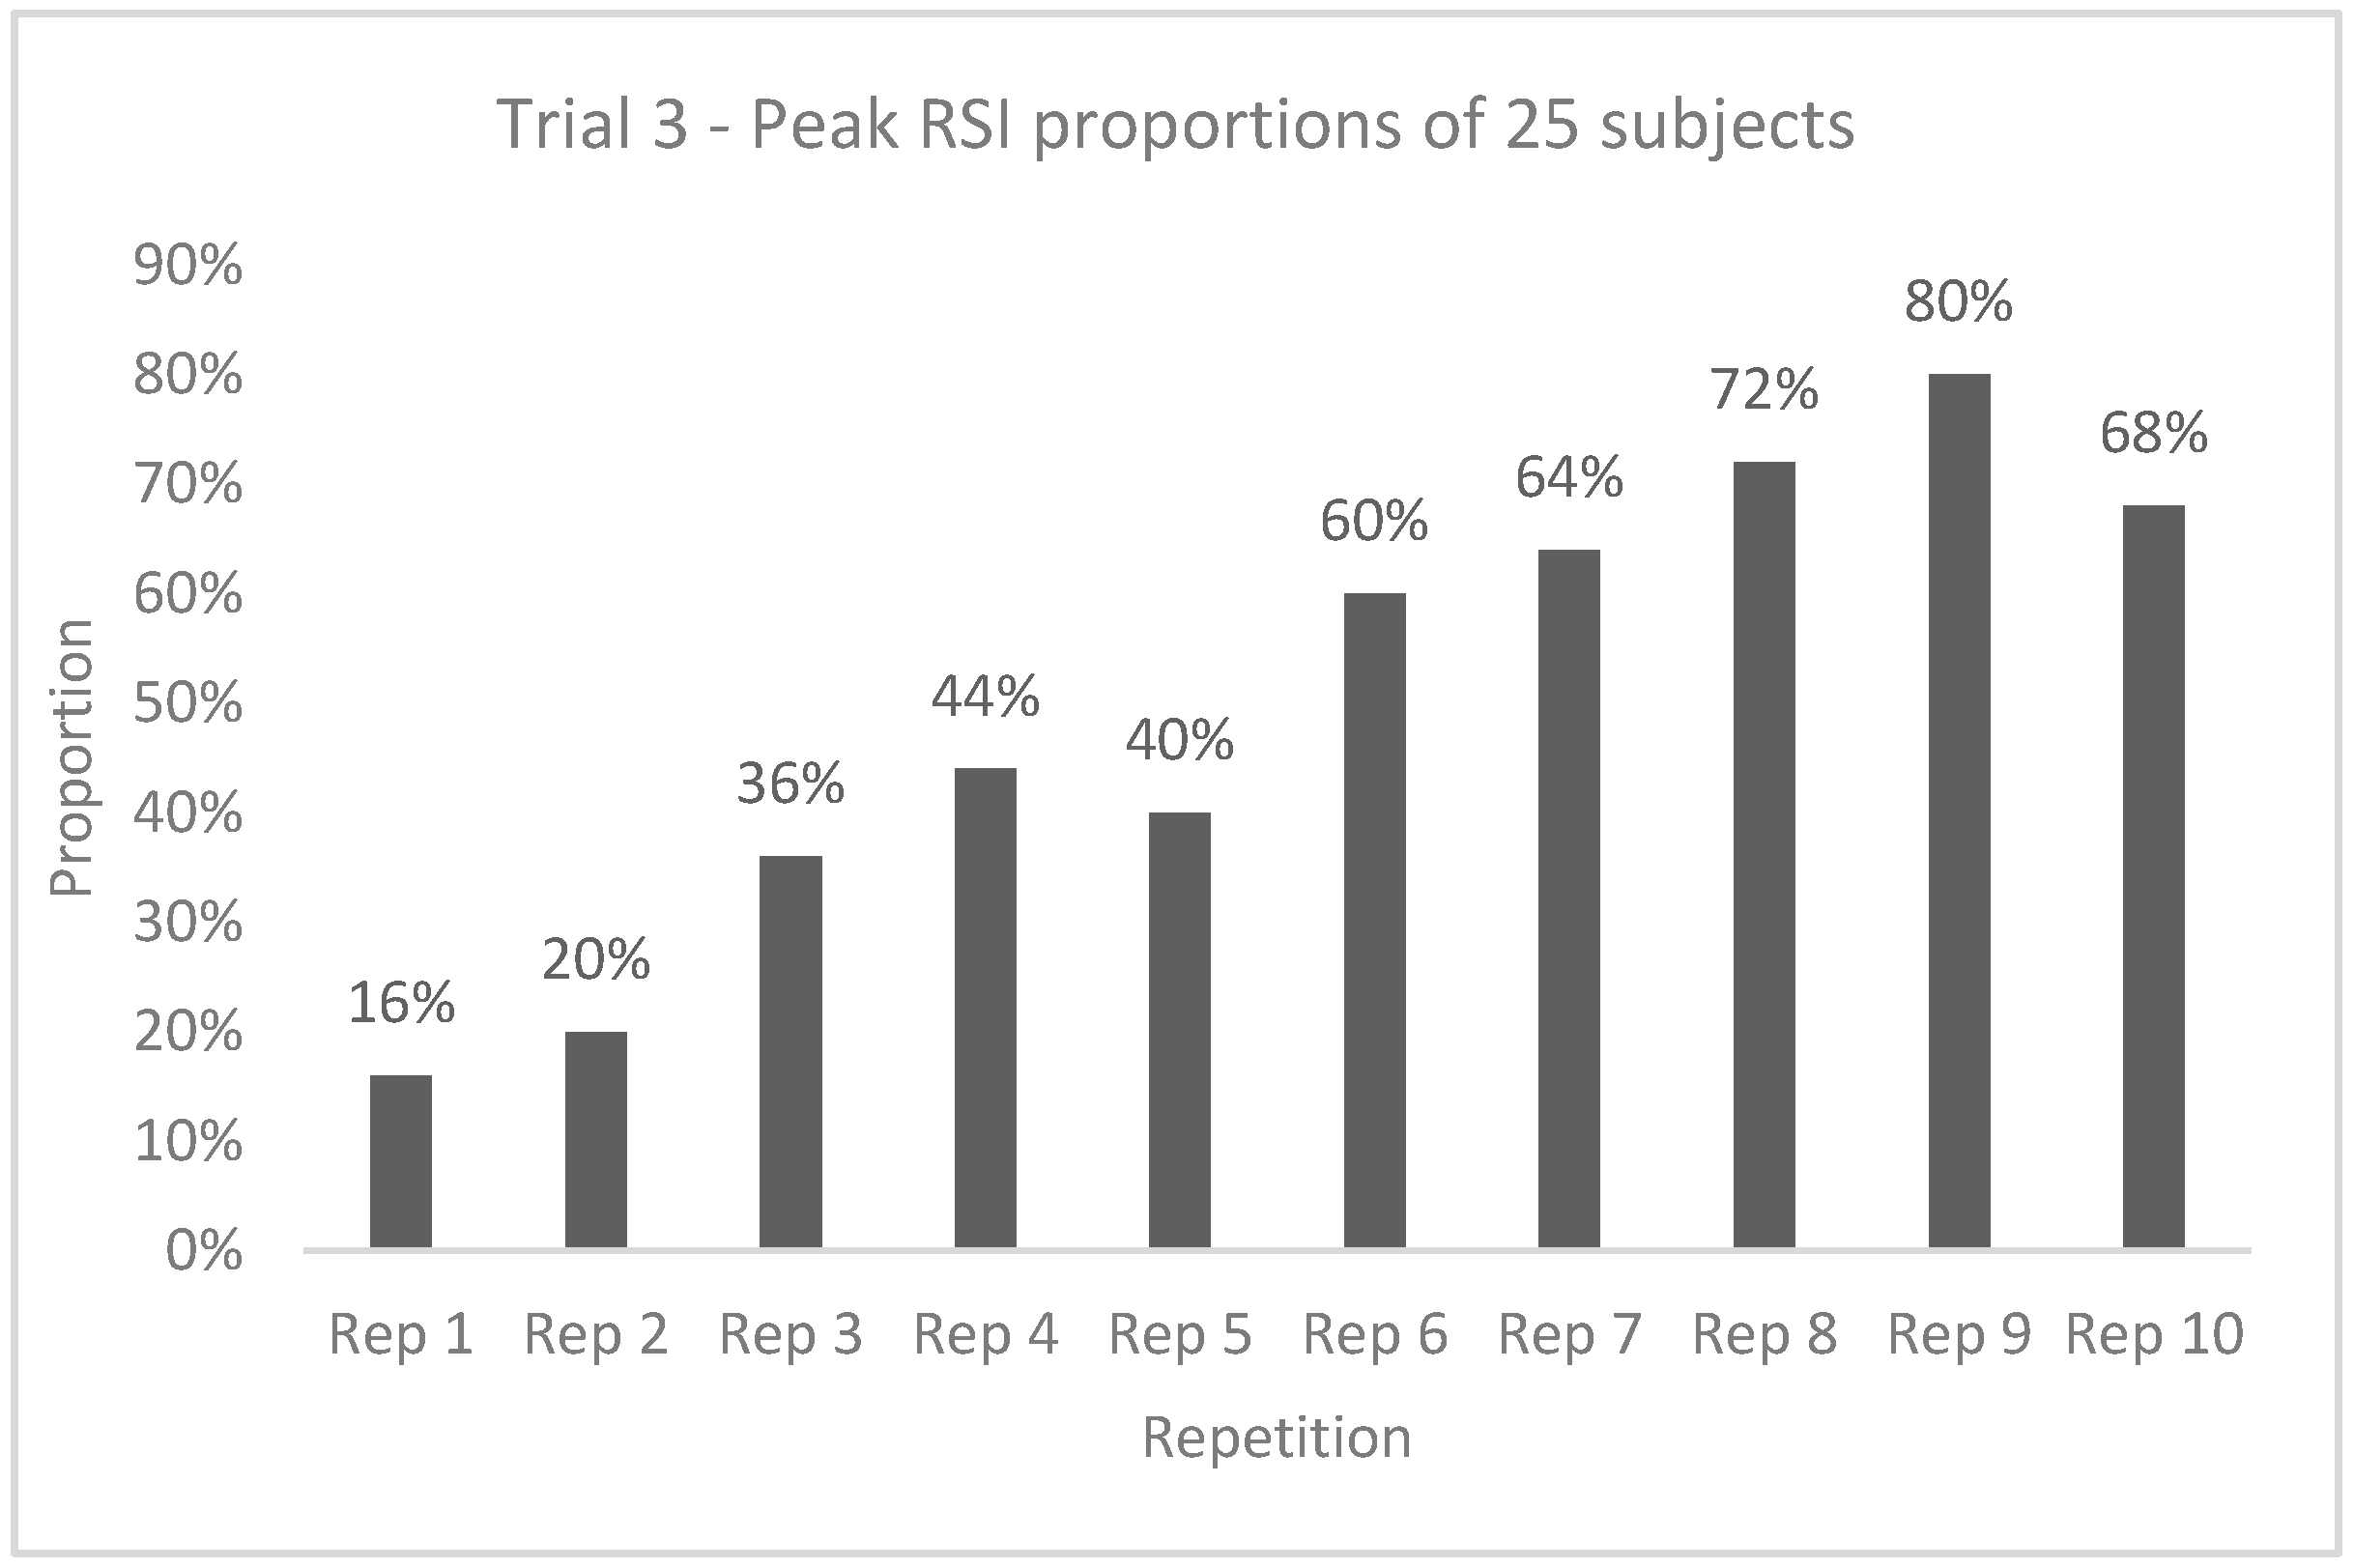
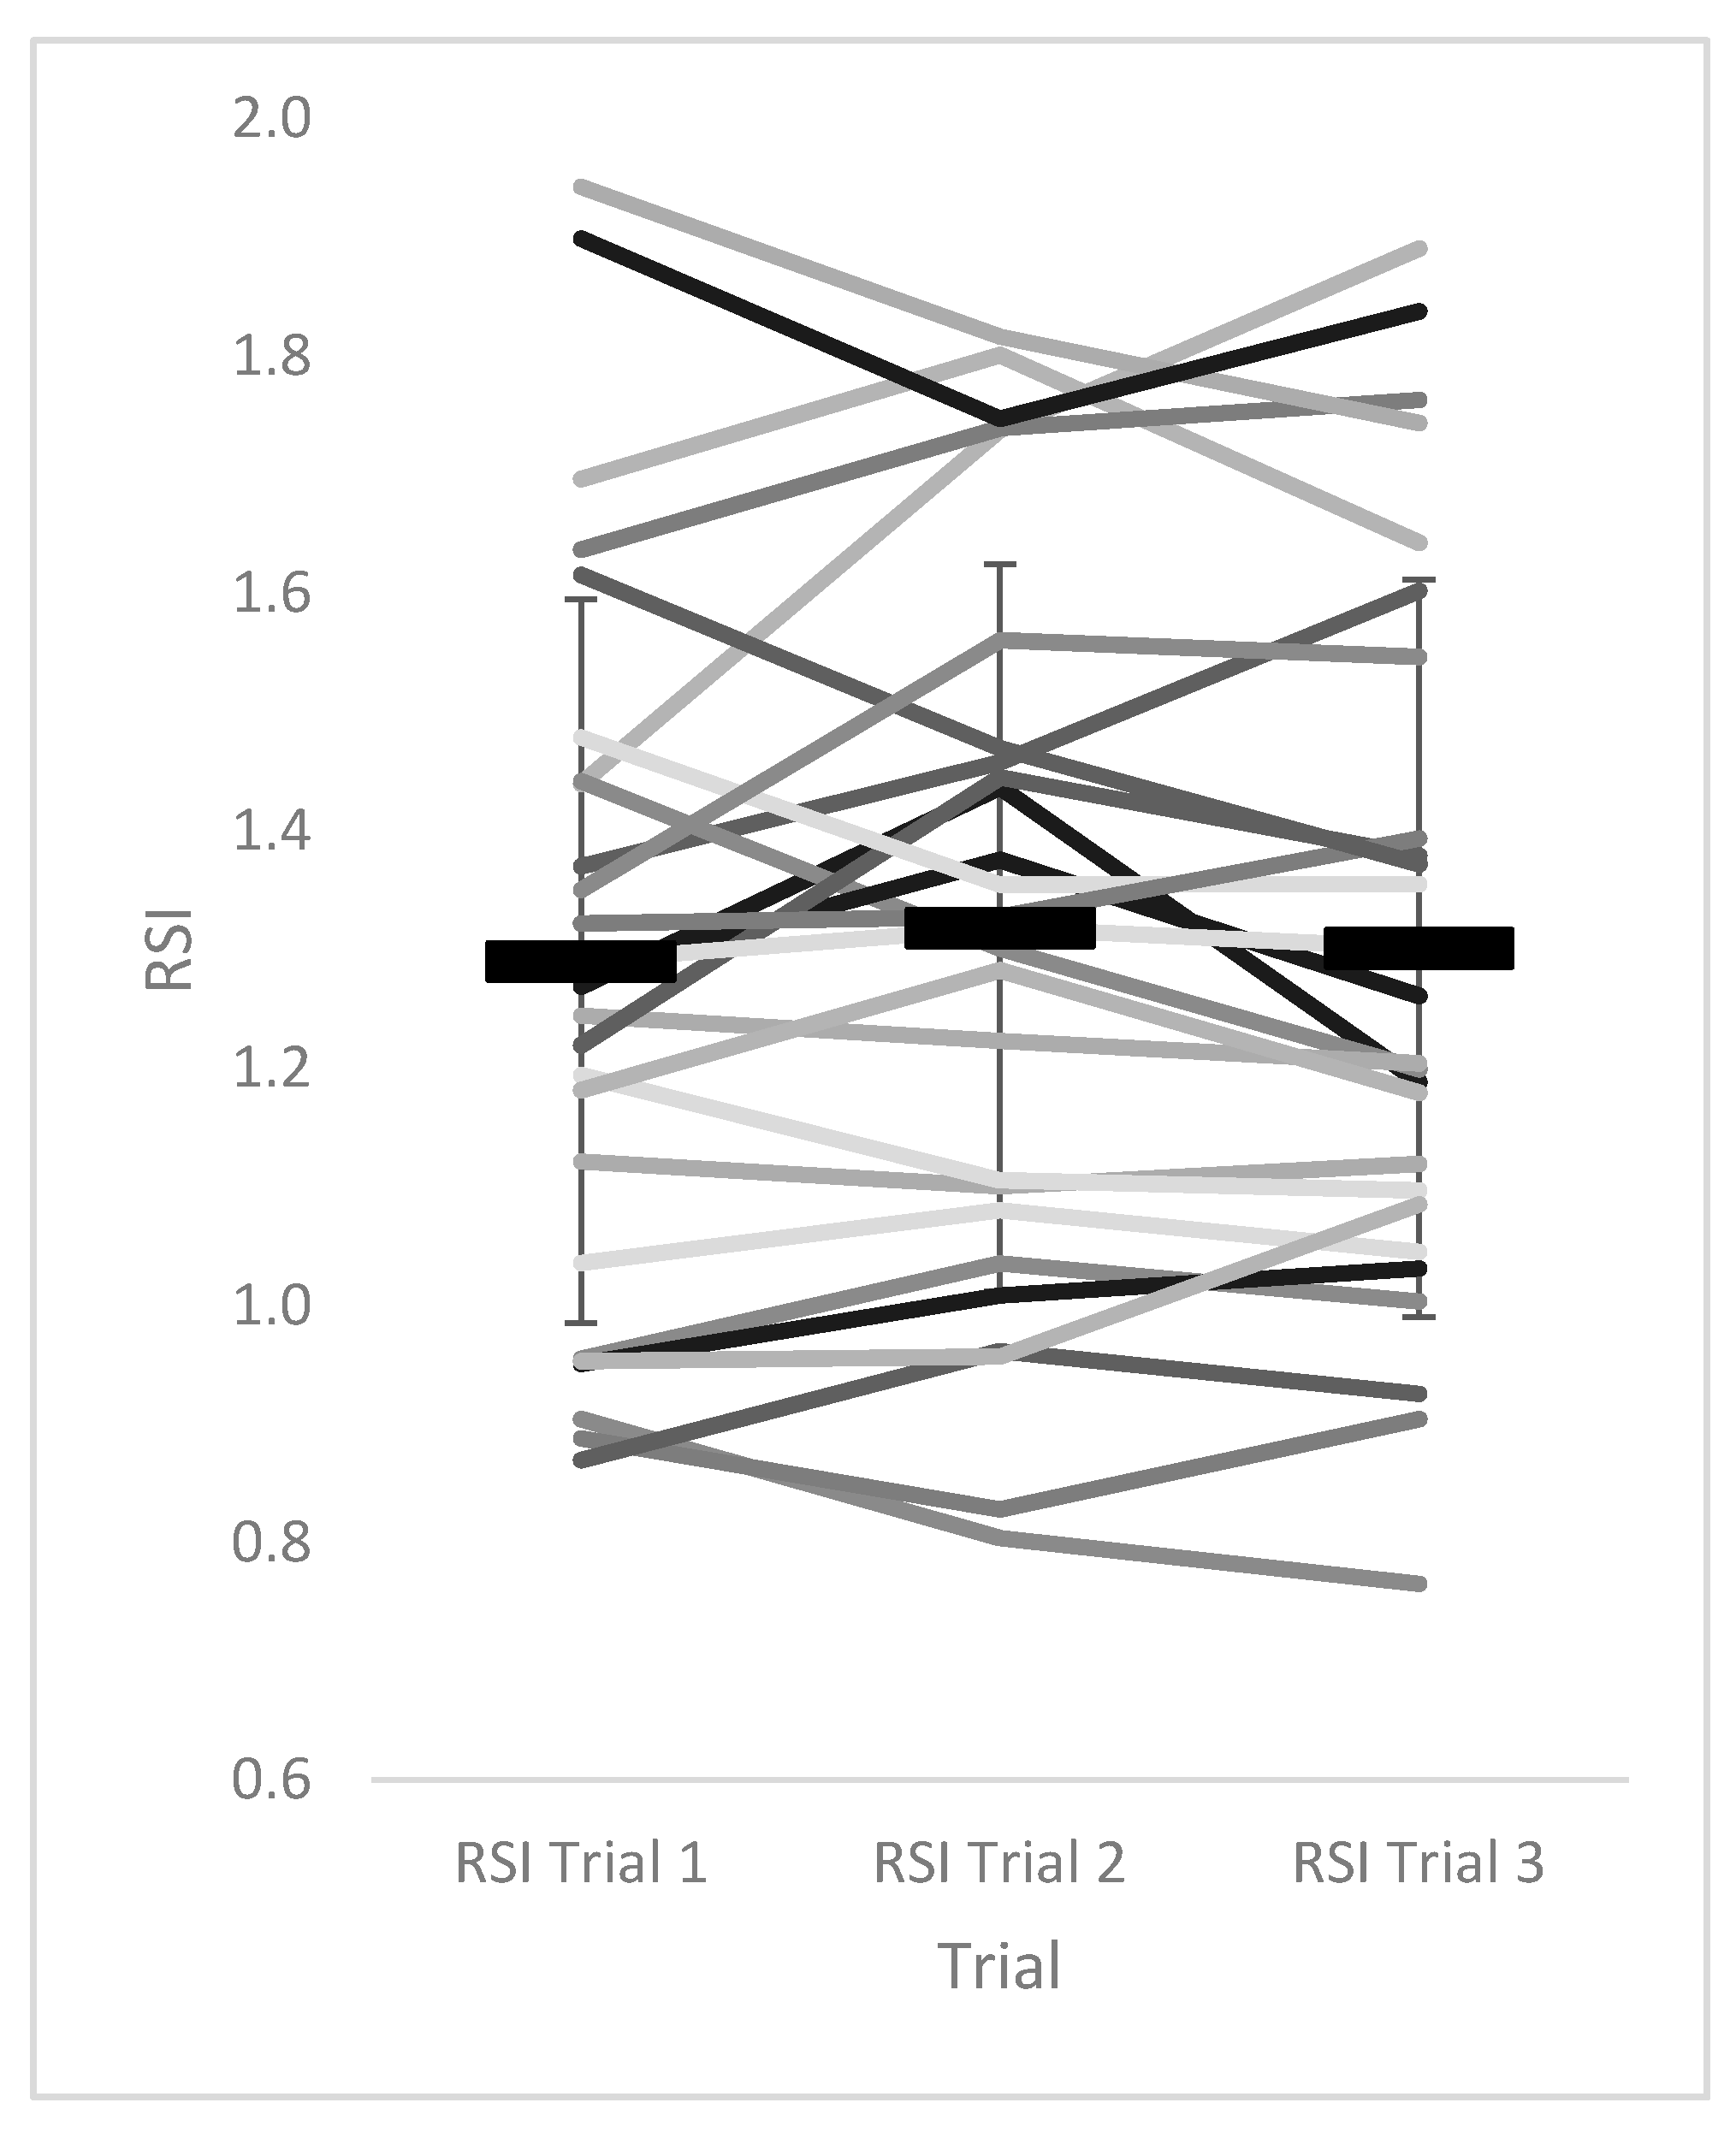
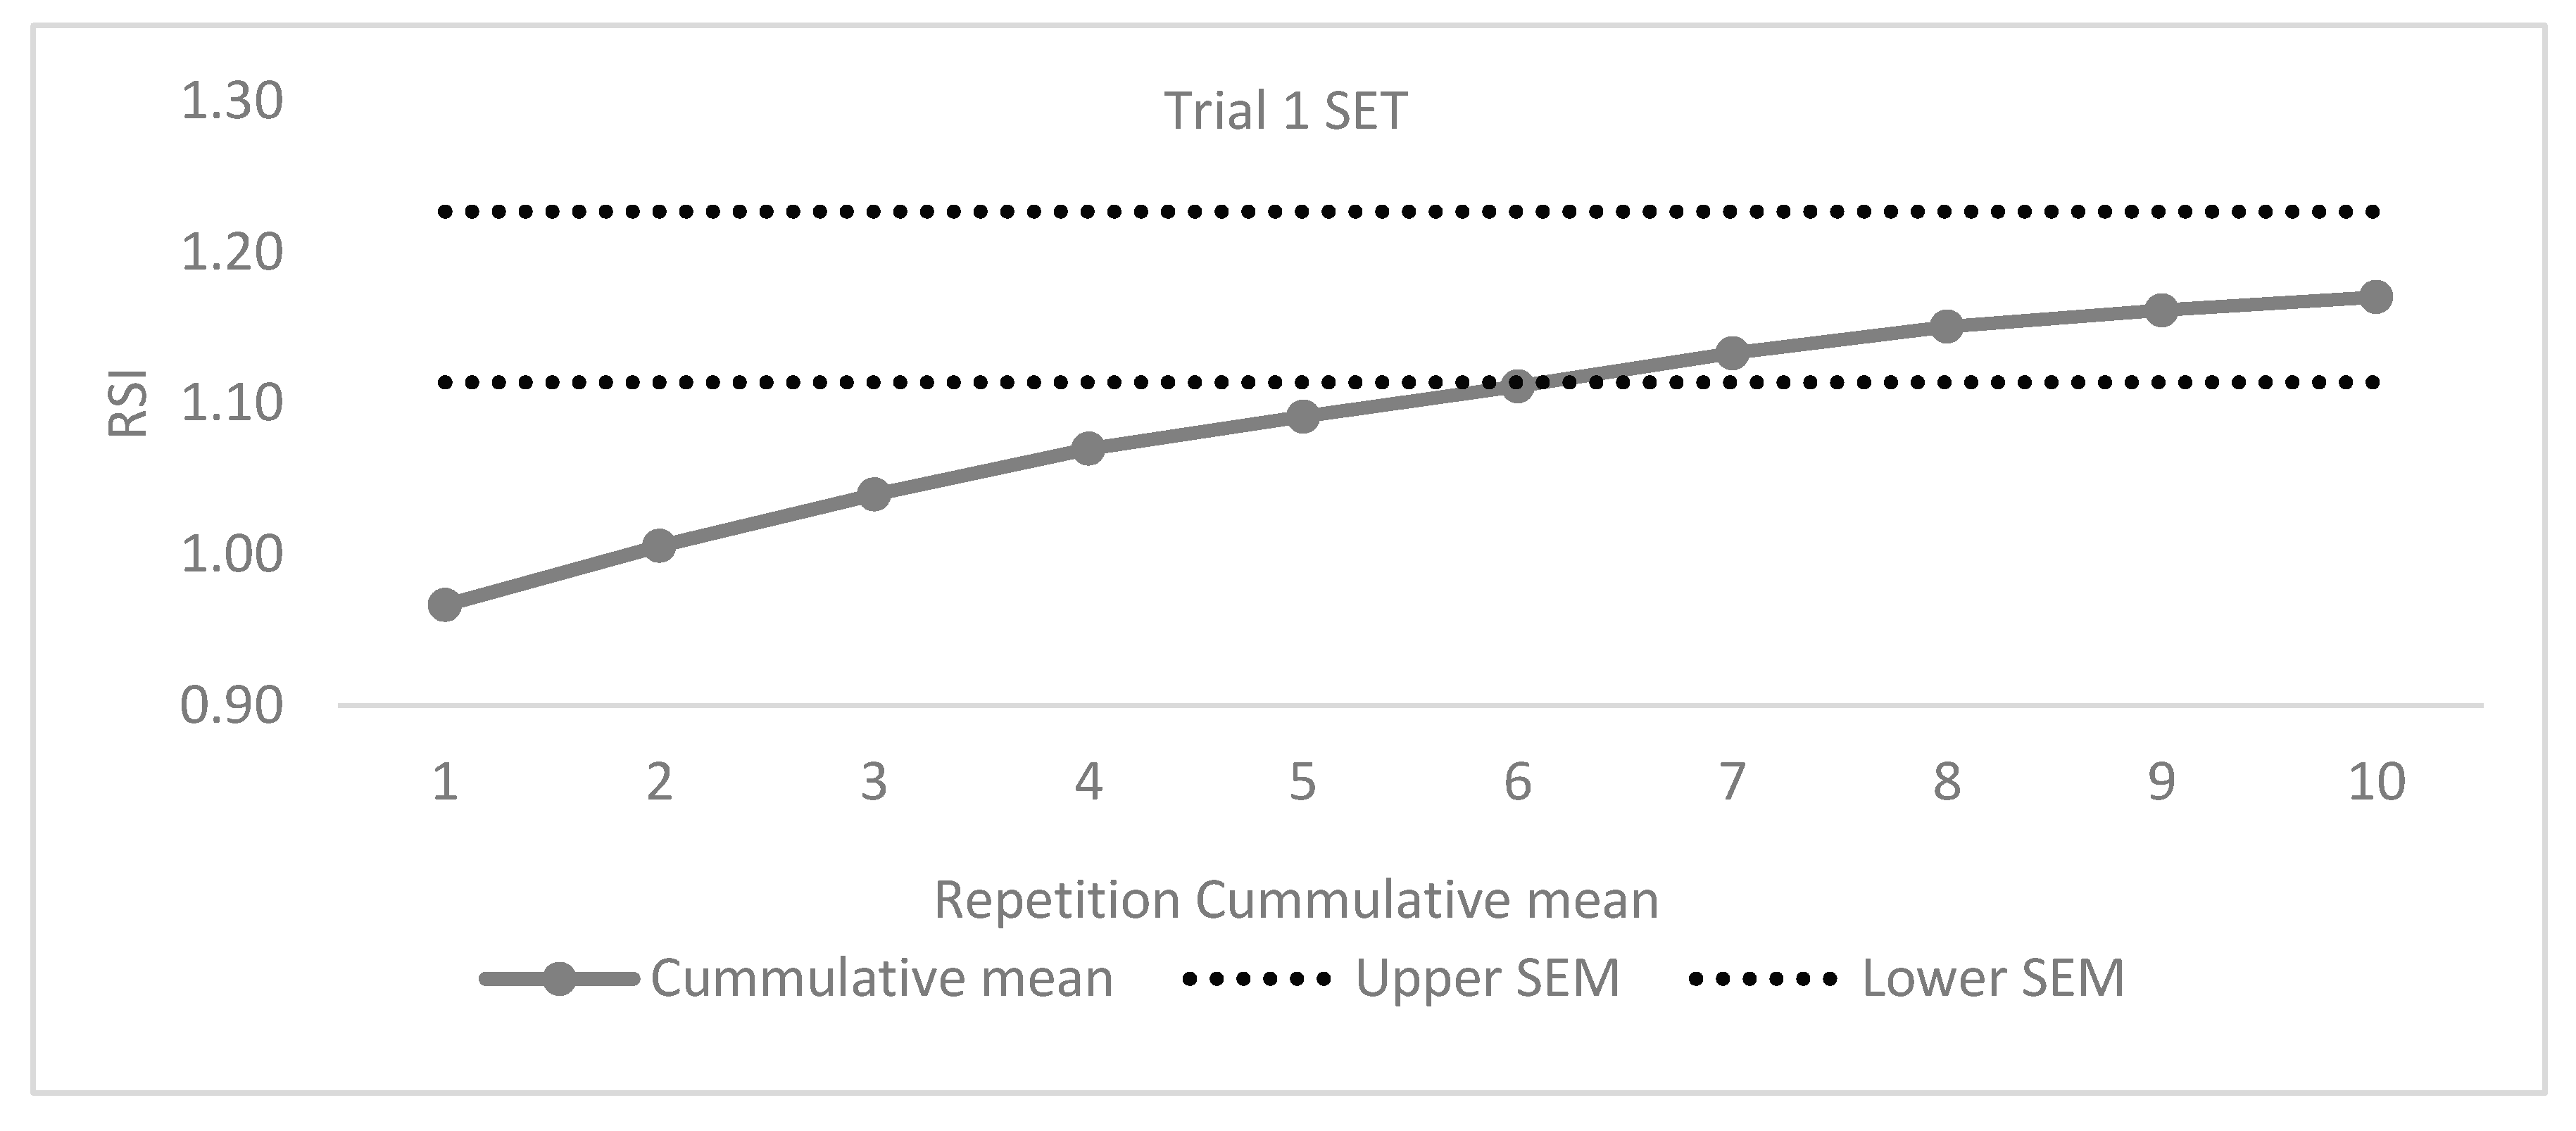
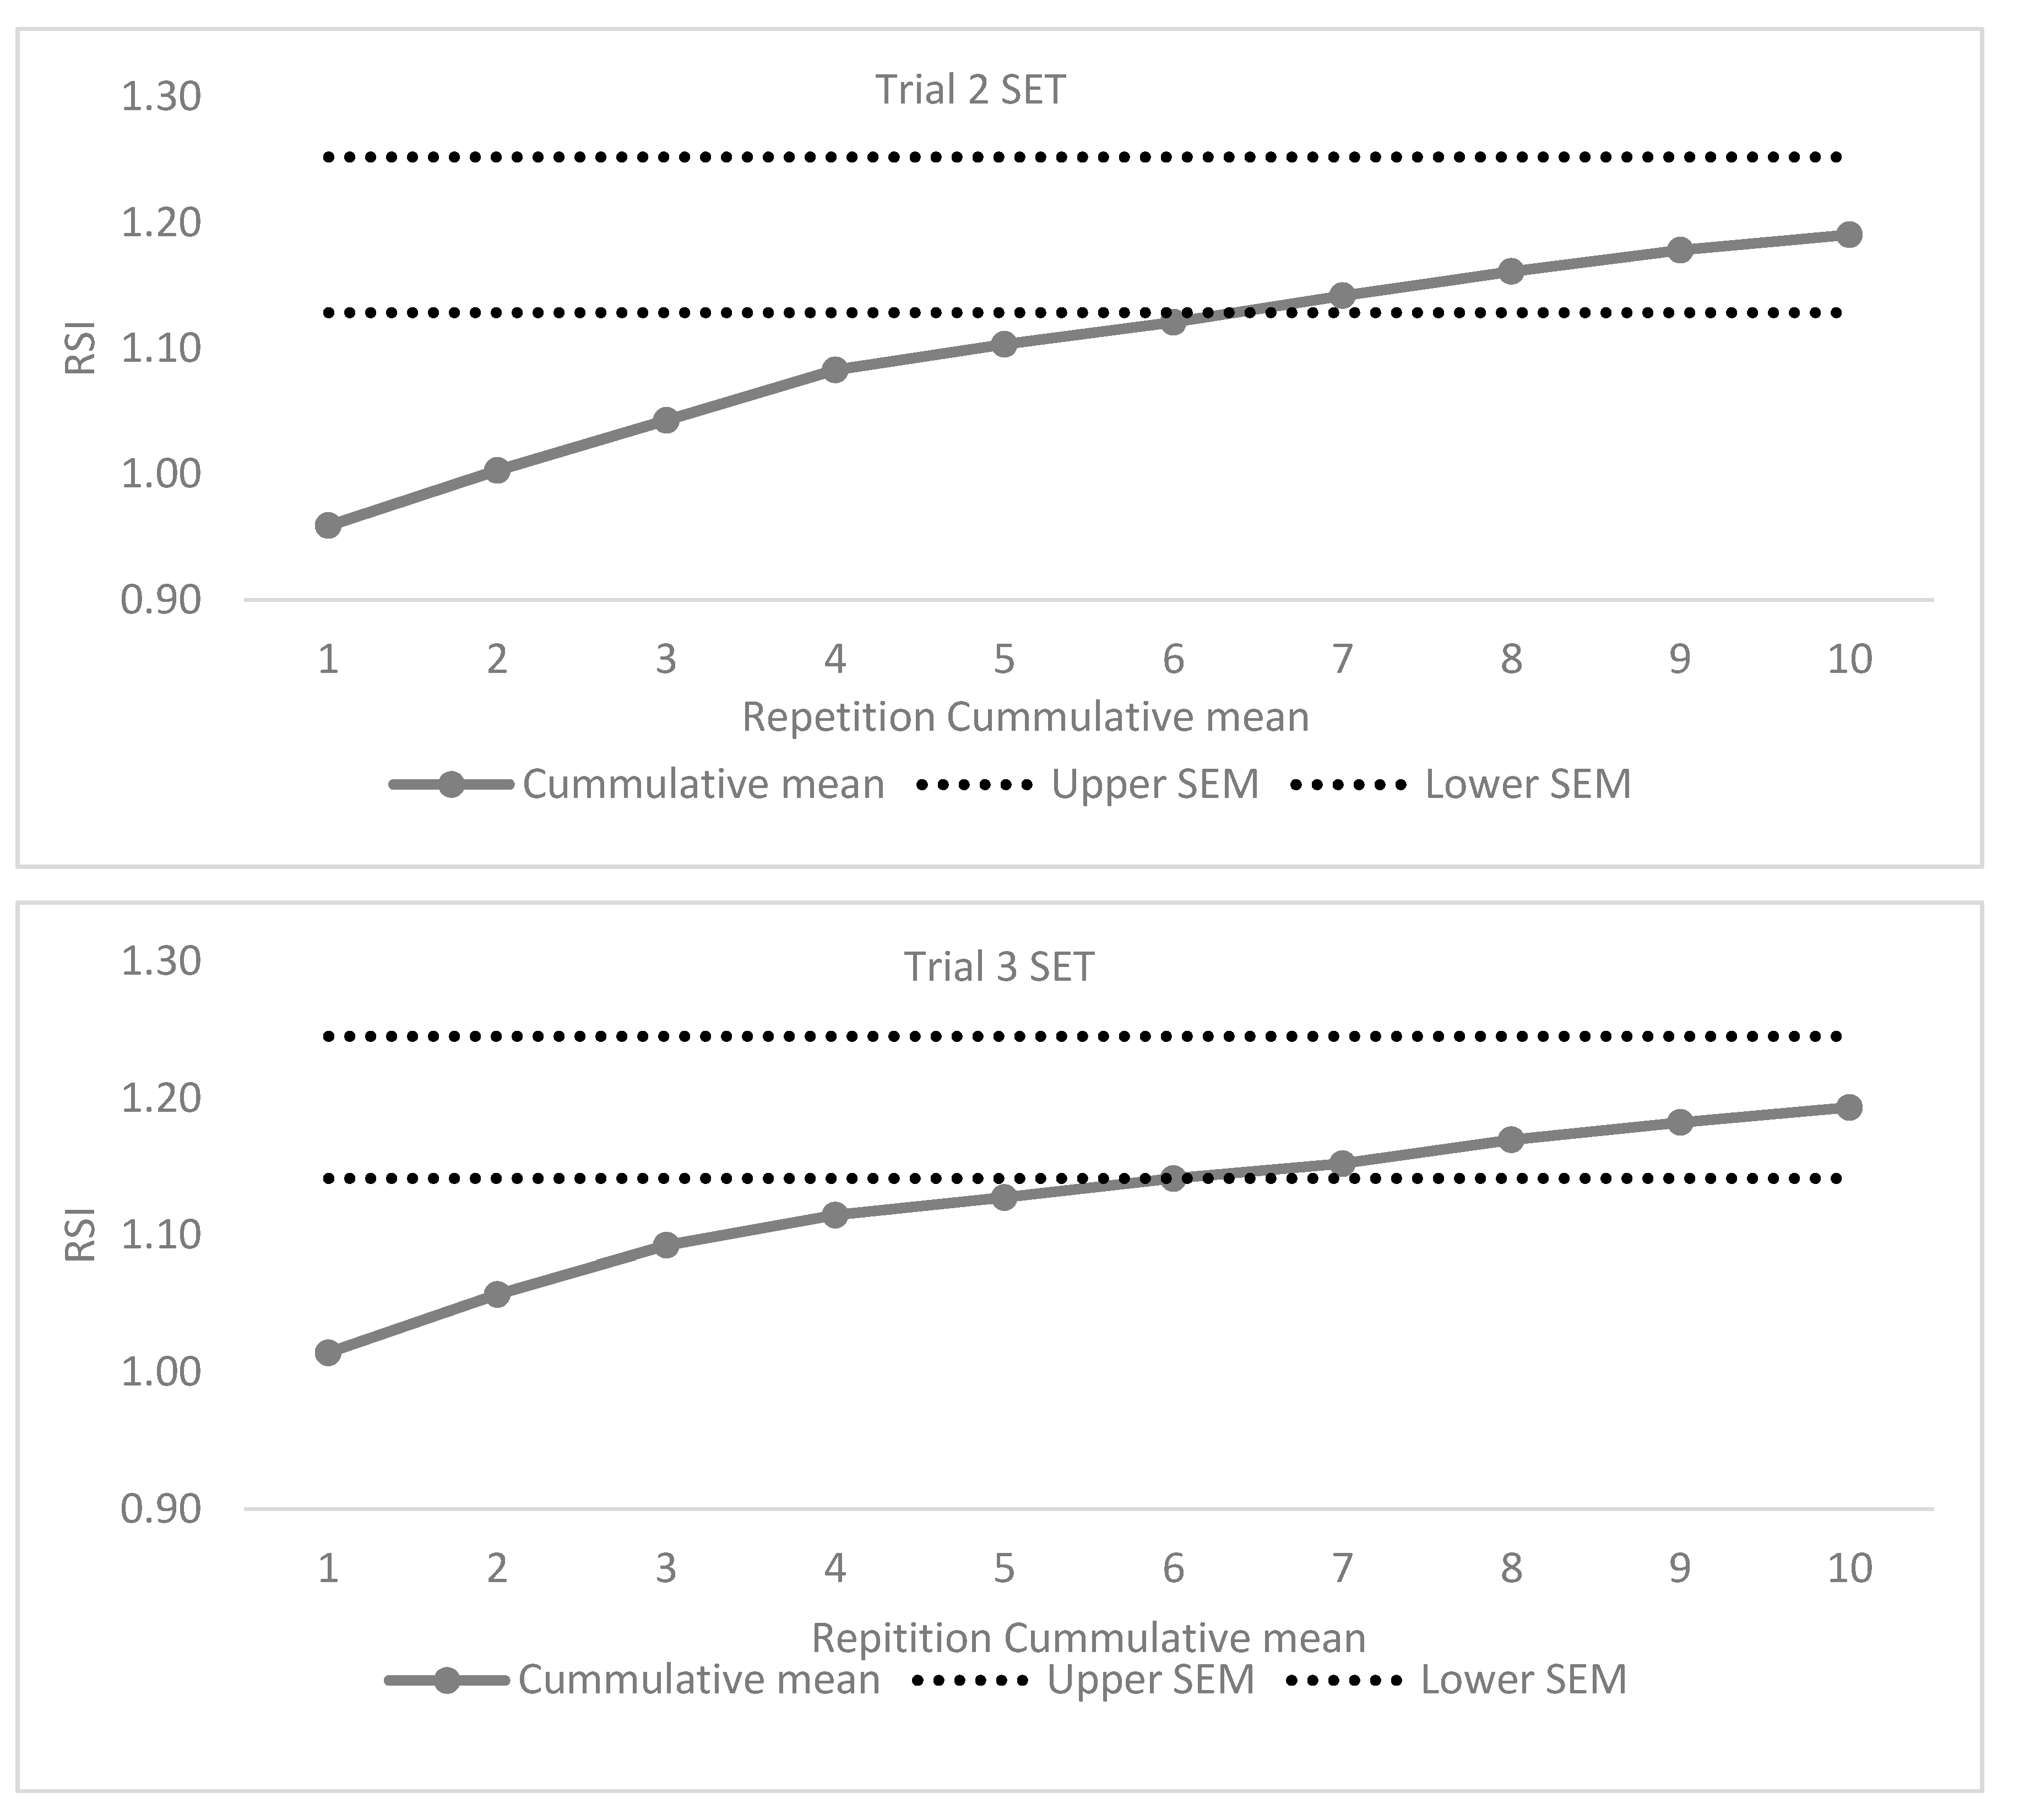
| Trial 1 | Trial 2 | Trial 3 | ||||
|---|---|---|---|---|---|---|
| Variable | ICC (95% CI) | CV (95% CI) | ICC (95% CI) | CV (95% CI) | ICC (95% CI) | CV (95% CI) |
| GCT | 0.935 | 8.3 | 0.916 | 8.4 | 0.952 | 7.6 |
| (0.881–0.968) | (6.8–9.7) | (0.846–0.959) | (7.2–9.6) | (0.914–0.976) | (6.5–8.8) | |
| JH | 0.985 | 10.8 | 0.982 | 10.4 | 0.986 | 9.4 |
| (0.974–0.992) | (8.8–12.9) | (0.968–0.991) | (8.9–11.8) | (0.975–0.993) | (7.6–11.2) | |
| RSI | 0.970 | 14.5 | 0.959 | 14.1 | 0.974 | 12.5 |
| (0.943–0.985) | (12.4–16.5) | (0.922–0.981) | (12.5–15.7) | (0.952–0.987) | (10.2–17.8) | |
| 10/5 RJT Trial 1 | |||||||||||||||
| Variable | Rep 1 | Rep 2 | Rep 3 | Rep 4 | Rep 5 | Rep 6 | Rep 7 | Rep 8 | Rep 9 | Rep 10 | Mean | RMANOVA p | η2/Power | Pairwise Comparisons | |
| GCT (s) | Mean | 0.229 | 0.214 | 0.204 | 0.201 | 0.196 | 0.195 | 0.193 | 0.194 | 0.196 | 0.194 | 0.202 | <0.001 | 0.377 | 1 > 3–10 (d = 0.86–1.21) 2 > 4,7 (d = 0.67–0.68) 3 > 7 (d = 0.41) |
| SD | 0.036 | 0.029 | 0.030 | 0.029 | 0.023 | 0.026 | 0.020 | 0.024 | 0.024 | 0.023 | 0.023 | 1.000 | |||
| JH (cm) | Mean | 0.220 | 0.222 | 0.223 | 0.232 | 0.231 | 0.235 | 0.244 | 0.246 | 0.244 | 0.241 | 0.234 | 0.006 | 0.159 | 3 < 7,8 (d = 0.31–0.34) |
| SD | 0.078 | 0.074 | 0.069 | 0.070 | 0.061 | 0.063 | 0.062 | 0.067 | 0.067 | 0.063 | 0.064 | 0.859 | |||
| RSI | Mean | 0.967 | 1.045 | 1.108 | 1.161 | 1.177 | 1.212 | 1.264 | 1.274 | 1.248 | 1.249 | 1.170 | <0.001 | 0.380 | 1 < 3–10 (d = −0.43 to −0.93) 2 < 6–9 (d = −0.50 to −0.68) 3 < 7,8 (d = −0.48 to −0.49) |
| SD | 0.328 | 0.341 | 0.335 | 0.324 | 0.287 | 0.322 | 0.312 | 0.339 | 0.341 | 0.327 | 0.300 | 1.000 | |||
| 10/5 RJT Trial 2 | |||||||||||||||
| Variable | Rep 1 | Rep 2 | Rep 3 | Rep 4 | Rep 5 | Rep 6 | Rep 7 | Rep 8 | Rep 9 | Rep 10 | Mean | RMANOVA p | η2/Power | Pairwise Comparisons | |
| GCT (s) | Mean | 0.231 | 0.213 | 0.202 | 0.198 | 0.198 | 0.199 | 0.196 | 0.196 | 0.195 | 0.195 | 0.202 | <0.001 | 1 > 2–10 (d = 0.60–1.40) 2 > 3–10 (d = 0.46–0.73) | |
| SD | 0.031 | 0.029 | 0.020 | 0.021 | 0.024 | 0.022 | 0.023 | 0.023 | 0.019 | 0.024 | 0.020 | ||||
| JH (cm) | Mean | 0.221 | 0.223 | 0.226 | 0.238 | 0.235 | 0.239 | 0.246 | 0.251 | 0.255 | 0.252 | 0.239 | <0.001 | 0.251 | 1 < 7–10 (d = −0.41 to −0.56) 2 < 8,9 (d = −0.42 to −0.49) 3 < 8–10 (d = −0.40 to −0.48) |
| SD | 0.060 | 0.070 | 0.059 | 0.065 | 0.056 | 0.062 | 0.063 | 0.066 | 0.060 | 0.058 | 0.058 | 0.998 | |||
| RSI | Mean | 0.959 | 1.047 | 1.122 | 1.203 | 1.185 | 1.208 | 1.269 | 1.297 | 1.314 | 1.301 | 1.190 | <0.001 | 0.434 | 1 < 3–10 (d = −0.64 to −1.24) 2 < 4–10 (d = −0.50 to −0.85) 3 < 8–10 (d = −0.54 to −0.63) 6 < 9 (d = −0.34) |
| SD | 0.236 | 0.299 | 0.272 | 0.308 | 0.246 | 0.299 | 0.352 | 0.370 | 0.329 | 0.317 | 0.277 | 1.000 | |||
| 10/5 RJT Trial 3 | |||||||||||||||
| Variable | Rep 1 | Rep 2 | Rep 3 | Rep 4 | Rep 5 | Rep 6 | Rep 7 | Rep 8 | Rep 9 | Rep 10 | Mean | RMANOVA p | η2/Power | Pairwise Comparisons | |
| GCT (s) | Mean | 0.232 | 0.210 | 0.204 | 0.204 | 0.206 | 0.203 | 0.203 | 0.199 | 0.200 | 0.203 | 0.206 | <0.001 | 0.304 | 1 > 2–10 (d = 0.61–1.12) |
| SD | 0.033 | 0.039 | 0.026 | 0.027 | 0.027 | 0.029 | 0.028 | 0.025 | 0.024 | 0.025 | 0.025 | 1.000 | |||
| JH (cm) | Mean | 0.234 | 0.227 | 0.237 | 0.239 | 0.242 | 0.242 | 0.243 | 0.254 | 0.255 | 0.260 | 0.243 | <0.001 | 0.203 | 2 < 8–10 (d = −0.41 to −0.51) |
| SD | 0.063 | 0.069 | 0.069 | 0.068 | 0.064 | 0.062 | 0.061 | 0.065 | 0.060 | 0.063 | 0.061 | 0.990 | |||
| RSI | Mean | 1.014 | 1.100 | 1.164 | 1.181 | 1.179 | 1.211 | 1.218 | 1.292 | 1.283 | 1.293 | 1.193 | <0.001 | 0.336 | 1 < 3–10 (d = −0.52 to −0.96) 2 < 7–10 (d = −0.35 to −0.59) 5 < 8,9 (d = −0.34–0.36) |
| SD | 0.250 | 0.333 | 0.321 | 0.334 | 0.302 | 0.328 | 0.336 | 0.356 | 0.315 | 0.327 | 0.298 | 1.000 | |||
| RSI Trial 1 | RSI Trial 2 | RSI Trial 3 | RMANOVA p | η2 (Power) | Pairwise Comparisons | ||
|---|---|---|---|---|---|---|---|
| Mean ± SD | 1.290 ± 0.305 | 1.318 ± 0.306 | 1.301 ± 0.311 | 0.554 | 0.024 (0.144) | Trial 1 vs. Trial 2 | p = 0.838, d = −0.09, r = 0.915, r2 = 0.84 |
| CV% (95% CI) | 5.7 (4.5–6.8) | 6.3 (5.1–7.5) | 6.2 (4.8–7.7) | Trial 1 vs. Trial 3 | p = 1.000, d = −0.04, r = 0.871, r2 = 0.76 | ||
| Trial 2 vs. Trial 3 | p = 1.000, d = 0.05, r = 0.952, r2 = 0.91 | ||||||
Publisher’s Note: MDPI stays neutral with regard to jurisdictional claims in published maps and institutional affiliations. |
© 2020 by the authors. Licensee MDPI, Basel, Switzerland. This article is an open access article distributed under the terms and conditions of the Creative Commons Attribution (CC BY) license (http://creativecommons.org/licenses/by/4.0/).
Share and Cite
Stratford, C.; Dos’Santos, T.; McMahon, J.J. The 10/5 Repeated Jumps Test: Are 10 Repetitions and Three Trials Necessary? Biomechanics 2021, 1, 1-14. https://doi.org/10.3390/biomechanics1010001
Stratford C, Dos’Santos T, McMahon JJ. The 10/5 Repeated Jumps Test: Are 10 Repetitions and Three Trials Necessary? Biomechanics. 2021; 1(1):1-14. https://doi.org/10.3390/biomechanics1010001
Chicago/Turabian StyleStratford, Callum, Thomas Dos’Santos, and John J. McMahon. 2021. "The 10/5 Repeated Jumps Test: Are 10 Repetitions and Three Trials Necessary?" Biomechanics 1, no. 1: 1-14. https://doi.org/10.3390/biomechanics1010001
APA StyleStratford, C., Dos’Santos, T., & McMahon, J. J. (2021). The 10/5 Repeated Jumps Test: Are 10 Repetitions and Three Trials Necessary? Biomechanics, 1(1), 1-14. https://doi.org/10.3390/biomechanics1010001


