Article

An AI-Driven TiO2-NiFeC-PEM Microbial Electrolyzer for In Situ Hydrogen Generation from POME Using a ZnO/PVA-EDLOSC Nanocomposite Photovoltaic Panel

1
GameAbove College of Engineering and Technology, Eastern Michigan University, Ypsilanti, MI 48197, USA
2
Faculty of Engineering, International Islamic University Malaysia, Kuala Lumpur 50728, Malaysia
3
Faculty of Economics, International Islamic University Malaysia, Kuala Lumpur 50728, Malaysia
*
Author to whom correspondence should be addressed.
Nanoenergy Adv. 2025, 5(4), 18; https://doi.org/10.3390/nanoenergyadv5040018
Submission received: 19 October 2025 / Revised: 15 November 2025 / Accepted: 18 November 2025 / Published: 26 November 2025
(This article belongs to the Special Issue Hybrid Energy Storage Systems Based on Nanostructured Materials)

Abstract

Electrolysis and biological processes, such as fermentation and microbial electrolysis cells, offer efficient hydrogen production alongside wastewater treatment. This study presents a novel microbial electrolyzer (ME) comprising a titanium dioxide (TiO2) anode, a nickel–iron–carbon (NiFeC) cathode, and a cellulose nanocrystal proton exchange membrane (CNC-PEM) designed to generate hydrogen from palm oil mill effluent (POME). The system is powered by a 12 V electric double-layer organic supercapacitor (EDLOSC) integrated with a ZnO/PVA-based solar thin film. Power delivery to the TiO2-NiFeC-PEM electrolyzer is optimized using an Adaptive Neuro-Fuzzy Inference System (ANFIS). Laboratory-scale pilot tests demonstrated effective degradation of POME’s organic content, achieving a hydrogen yield of approximately 60%. Additionally, the nano-structured ZnO/CuO–ZnO/PVA solar film facilitated stable power supply, enhancing in situ hydrogen production. These results highlight the potential of the EDLOSC-encased ZnO/PVA-powered electrolyzer as a sustainable solution for hydrogen generation and industrial wastewater treatment.

1. Introduction

The global land ocean temperature index has risen by 1.17 °C, making the past ten years the warmest on record [1]. This is because of the excessive use of 93.6 quadrillion British thermal units from nuclear, coal, and petroleum sources, while only 8.2 quads of renewable energy were used [2]. A broad range of solutions is needed to achieve net zero, and hydrogen is a crucial component. Biological hydrogen production using POME (C7H15O5P) has promising bioenergy potential and can act as alternative energy source due to its organic chemical contents of NaOH, HCL, H2SO4, H3PO4, and HNO3; chemical ingredient H3PO4 would generate hydrogen 1.51 mol H2/mol TCcon [3].
The worldwide focus on biohydrogen arises from its production mainly utilizing low-value waste as a substrate, such as livestock waste, agriculture waste, municipal wastes, industrial processing wastes, and agro-industrial waste, being a method of production that is both energy-efficient and sustainable [4]. It combines the extraction of value-added compounds with the recovery and treatment of abundant wastes, which have continuous and increasing output. Biohydrogen can be produced from residual wastewater that still has a high organic content. The production of biohydrogen from wastewater can be performed by using fermentation, bio-photolysis, or bio-electrochemical systems.
The specific energy by mass of hydrogen is 141.9 J/kg, which is much higher than natural gas, which has a specific energy of 50 J/kg [5]. National Clean Hydrogen aims to reach the following targets: 10 MMT/year by 2030, 20 MMT/year by 2040, and 50 MMT/year by 2050 [6]. Approximately USD 9.5 billion is available for clean hydrogen generation, which includes USD 8 billion for four regional clean hydrogen hubs, USD 0.5 billion for manufacturing and recycling, and USD 1 billion for electrolysis [7]. Decarbonizing the energy system and establishing a sustainable hydrogen economy that lowers greenhouse gas emissions depend heavily on hydrogen. Solid oxide electrolysis lowers the price of hydrogen fuel production. Electricity is what drives the cost of creating hydrogen through the electrolysis process. However, the largest factor affecting clean hydrogen’s financial feasibility is electricity prices. According to research from Idaho National Laboratory [8], a bloom electrolyzer needs 37.5 kWh of electricity to generate one kilogram of hydrogen. However, the electric power consumption of PEM and alkaline-based electrolyzers is 52 and 54 kWh, respectively [9].
A few studies have been conducted to find energy availability and optimization in hydrogen generation from the different waste streams, including solar and artificial lights [10,11]. One of the distinct disadvantages of using solar is its instability, not only the unavailability during the night but also the changes with the weather and season. Moreover, photo-fermentation inhibition of sunlight at noon was reported [12], and it was reported that the light utilization efficiency of sunlight is usually lower than the optimized artificial illumination system. However, the significant advantage of sunlight is its reduction in the total investment of the photo-fermentation system. Other light sources, including light-emitting diodes (LEDs), mercury–tungsten lamps, and halogen lamps, were also used in these years. Nevertheless, tungsten lamps have a wide wavelength but a short lifetime, while LEDs have a long lifetime but a high price. With respect to light intensity, it seems that the optimal light intensity is influenced by several factors, such as the characteristics of the feedstock, the functional strains, etc. Different light intensities, including 500, 1000, 2000, 3000, 4000, and 5000 lux, were used for photo-fermentation of rotten apples, and 3000 lux was found to be the best intensity, achieving the highest hydrogen production [13]. However, in another study of dairy wastewater, four different light intensities of 4000, 5000, 9000, and 13,000 lux were generated using a mercury–tungsten lamp, in which the highest hydrogen yield was observed at 9000 lux [14]. It was reported that not only the light intensity but also the wavelength play an important role in the photo-fermentation process [15]. However, even at the optimal condition, the light conversion efficiency is still low, which is identified to be the bottleneck for the scaling up of photo-fermentation to produce hydrogen. Four different pure PNSB strains, including R. capsulatus DSM 1710, R. capsulatus YO3, R. sphaeroides O.U.001, and Rp. palustris DSM 127, were individually used to produce hydrogen from sugar beet molasses with continuous illumination from a tungsten lamp at 114 W/m2 [16]. For all the strains with three different substrate concentrations, the highest light conversion efficiency was observed at 0.47% and the lowest was 0.09%, which indicated a huge energy waste of the light. In another study of brewery wastewater treatment with Rhodobacter sphaeroides [17], a slightly higher conversion efficiency of 1.7% was observed. However, in general, the average light efficiency of the normal traditional photo-reactor was reported to be 1–5%, and the highest conversion rate was limited within 10% [18].
Furthermore, one important factor influencing the creation of hydrogen is temperature. Although some studies have been conducted in extremely thermophilic circumstances (i.e., 65–75 °C), the majority of fermentative biohydrogen production research in mixed cultures has been conducted at 20–40 °C (i.e., mesophilic) and 50–60 °C (i.e., thermophilic) conditions [19]. According to studies, as the temperature rises, wastewater yield and hydrogen production both increase [20]. Certain wastewater systems (like textile industry effluent) must function at high temperatures due to energy economy and safety concerns, even though lower temperatures are better for hydrogen generation technology. As a result, the ideal temperature must be established for each case and depends on the kind of wastewater and the processes that produce hydrogen.
The poor generation rate of hydrogen energy and the high cost of its substrates, aside from wastewater and biowaste, are the primary barriers to its widespread usage [9]. Industrial wastewater, which is rich in organics containing biodegradable substrates (i.e., carbohydrates, proteins, and lipids), represents a low-cost and sustainable feedstock for hydrogen production [21]. Industrial wastewater treatment that occurs during hydrogen production is yet another benefit for environmental sustainability [22]. The biological approach to wastewater treatment for biohydrogen is considered as the most environmentally friendly and has the lowest energy consumption. However, the analysis of the results obtained so far showed that the main limitation of this technology is the low rate of biohydrogen production.
Electrolyzers are the core technological solution of hydrogen generation. Alkaline electrolyzers are ideal for large-scale hydrogen production; these systems offer cost-effectiveness and reliability, making them suitable for industrial applications. PEM electrolyzers are perfect for dynamic operations; these electrolyzers integrate seamlessly with existing energy systems, providing flexibility for decentralized applications. Solid oxide electrolyzers (SOEs) are the best suited for large-scale industrial applications; these systems enhance energy conversion efficiency. Microbial electrolysis is seen as one of the emerging technologies for cleaner hydrogen production, as it has the advantage of producing good hydrogen yields using less energy than water electrolysis, while also reducing chemical oxygen demand (COD) [23,24]. However, the energy barrier is always a concern, and additional electrical power is necessary.
This study’s goal is to develop and demonstrate a TiO2-NiFeC PEM microbial electrolyzer (ME) prototype that uses a photovoltaic EDLOSC-encased ZnO/PVA solar thin film to generate hydrogen from the POME. In order to provide the electrical power needed for the TiO2-NiFeC PEM microbial electrolyzer to produce hydrogen in situ, this study uses an electric double layer organic solar-dependent capacitor (EDLOSC), which is defined as six weight percent (wt.%) C, 30 (wt.%) ZnO/CuO, and 70 gsm soaked Na2SO4.

2. Methodology

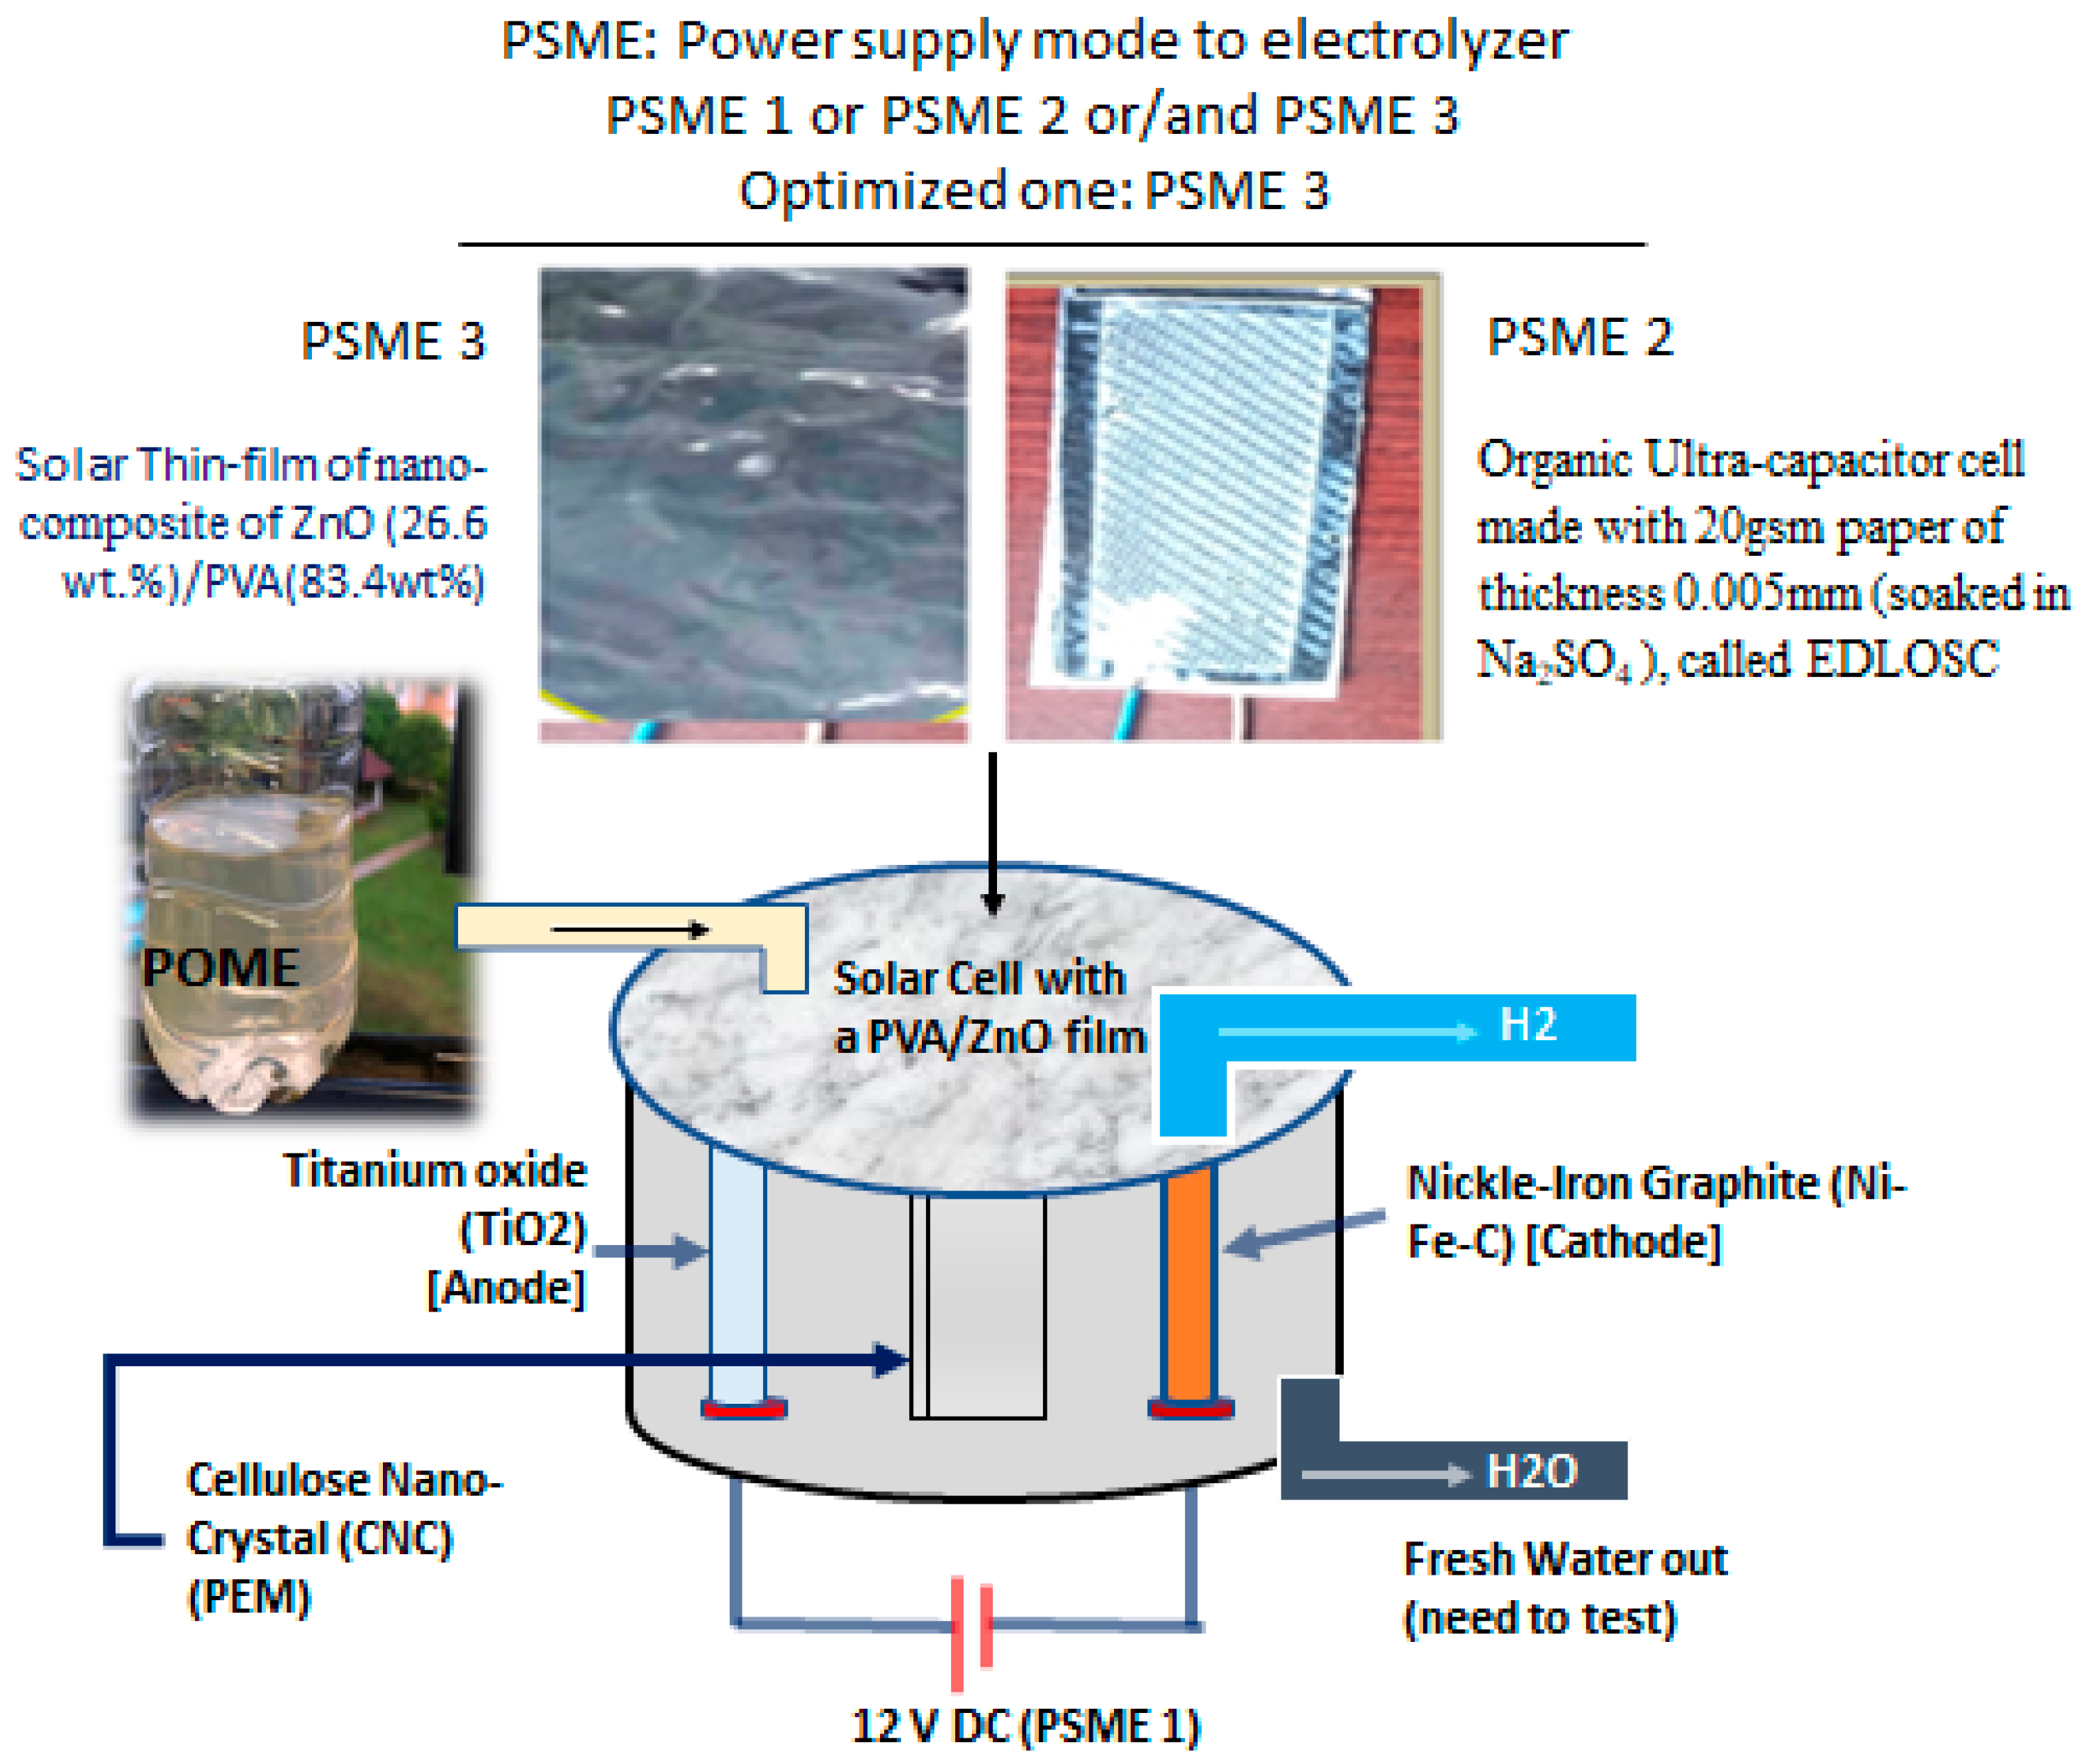
A microbial electrolyzer (ME) is shown in Figure 1, which has been made with titanium oxide (TiO2) as the anode, Ni-Fe graphite (C) as the cathode, and cellulose nanocrystal proton exchange membrane (CNPPEM) (Kuala Lumpur, Malaysia) to produce hydrogen from palm oil wastewater (POME). The electrolyzer is powered with hybrid PV solar thin-film. The solar thin film (ZnO/PVA) has been made with polyvinyl alcohol (PVA) and zinc oxide (ZnO) nanocomposite. To extend the electrolyzer’s power supply lifetime, a solar thin film PVA/ZnO has been utilized to raise the EDLOSC’s solar intensity by roughly 3–5%.
The TiO2-CNC-NiFeC model of a microbial electrolyzing device uses cellulose nanocrystal (CNC) as the PEM, NiFeC PEM as the cathode, and TiO2 as the anode. Power system design has been built using ZnO/CuO-C EDLOSC enclosed with ZnO/PVA solar thin film. The basic concept of EDLOSC/ZnO-PVA is to store solar energy for a longer duration by utilizing its organic content. It is also possible to increase the TiO2-CNC-NiFeC power consumption by adding a layer of organic cells. The microbiological TiO2-CNC-NiFeC PEM electrolyzing system was powered by an EDLOSC/ZnO-PVA power source in order to produce H2 from the organic wastewater of the industry. ZnO/PVA solar films boost solar intensity by around 10% to 15%, which raises solar energy output by EDLOSC by about 3–5%. They also help to power the TiO2-NiFeC electrolyzing system for a longer period, by about 5%, according to Shaheer et al. [25]. However, this innovative microbial TiO2-CNC-NiFeC PEM electrolyzer system has a slightly higher development cost than conventional microbial electrolysis.
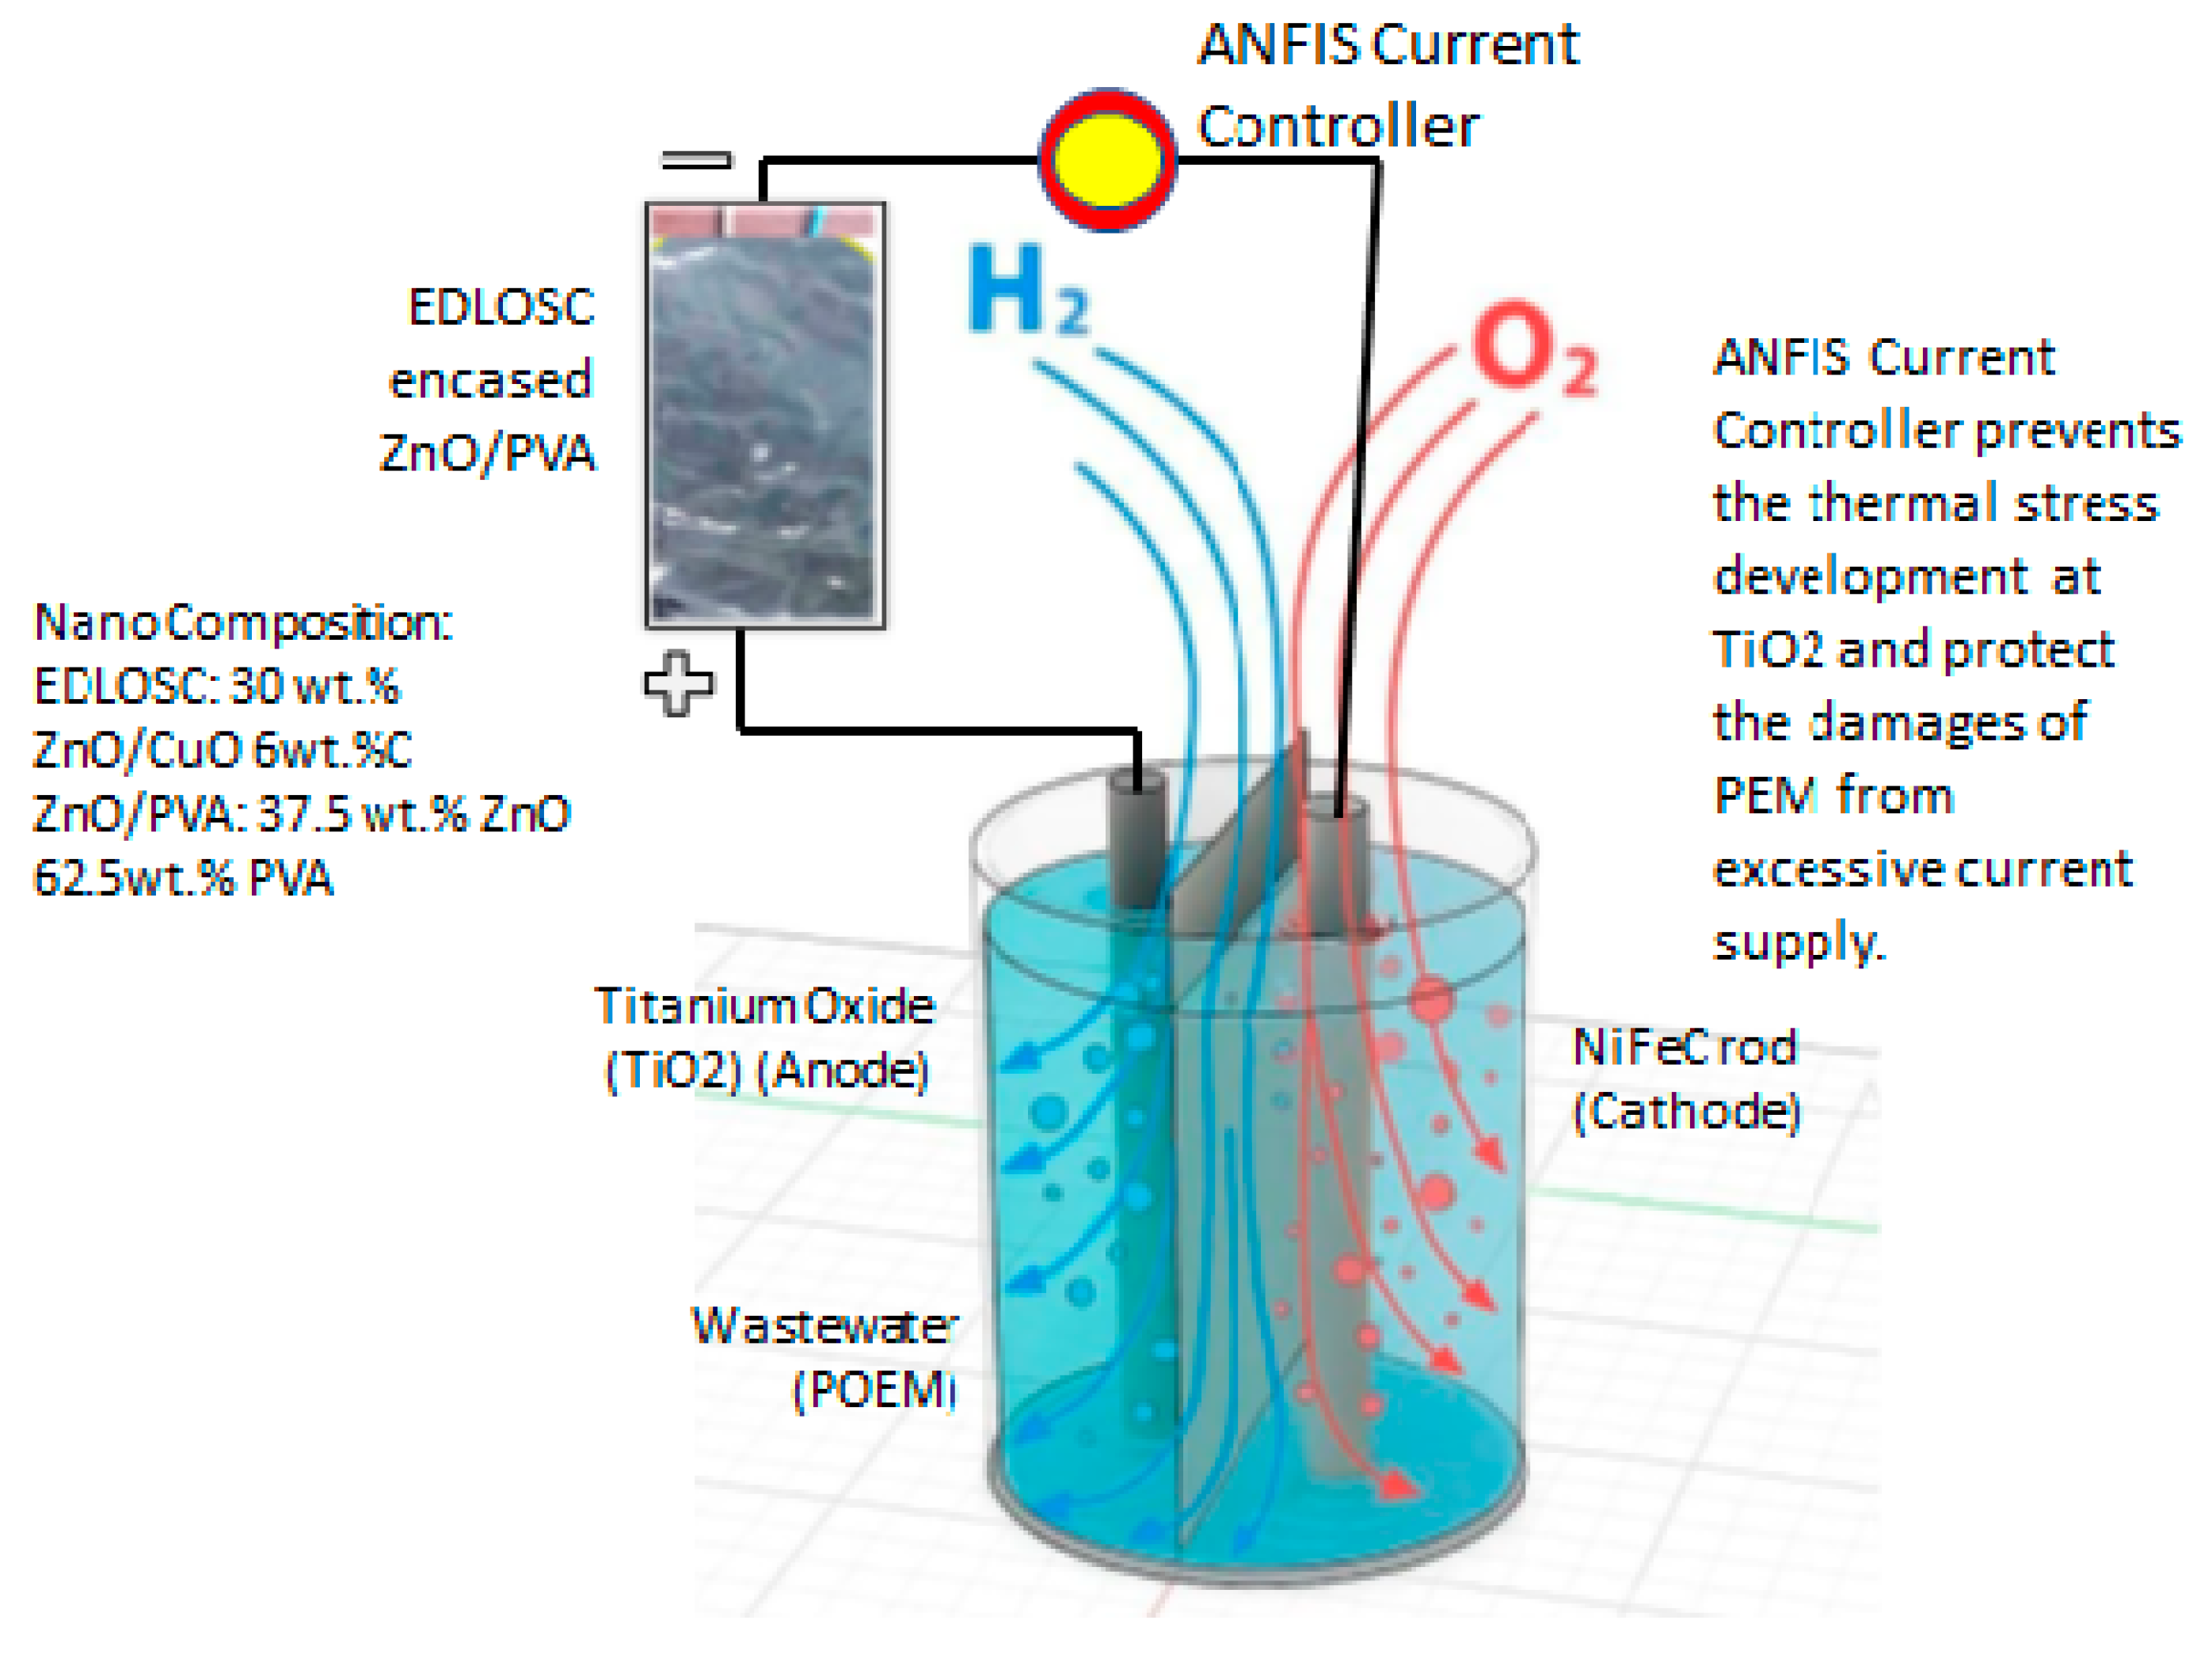
Figure 2 shows the power supply system to the TiO2-NiFeC PEM microbial electrolyzer for hydrogen production in situ from the POME, which has been classified as follows:
  • PSME 1: A 12 V DC lead gel battery is defined as the power supply mode to the electrolyzer;
  • PSME 2: A solar-dependent aqueous electric double-layer organic solar capacitor (EDLOSC) plus a 12 V battery;
  • PSME 3: A solar-dependent EDLOSC integrated with ZnO/PVA plus a 12 V battery.
However, because the EDLOSC functions as a photovoltaic power producer and storage device, the TiO2-NiFeC PEM microbial electrolyzer has been powered by the solar-dependent PSME 3 to maintain power supply in a longer mode.
Power supply to the ME has always been provided at 12 V, either by battery or EDLOSC. The 12 V DC battery supply has been used when the EDLOSC has been disconnected and vice versa. However, EDLOSC has a higher current density compared to the battery.

2.1. Organic Power System of the TiO2-NiFe CNC-PEM Electrolyzer

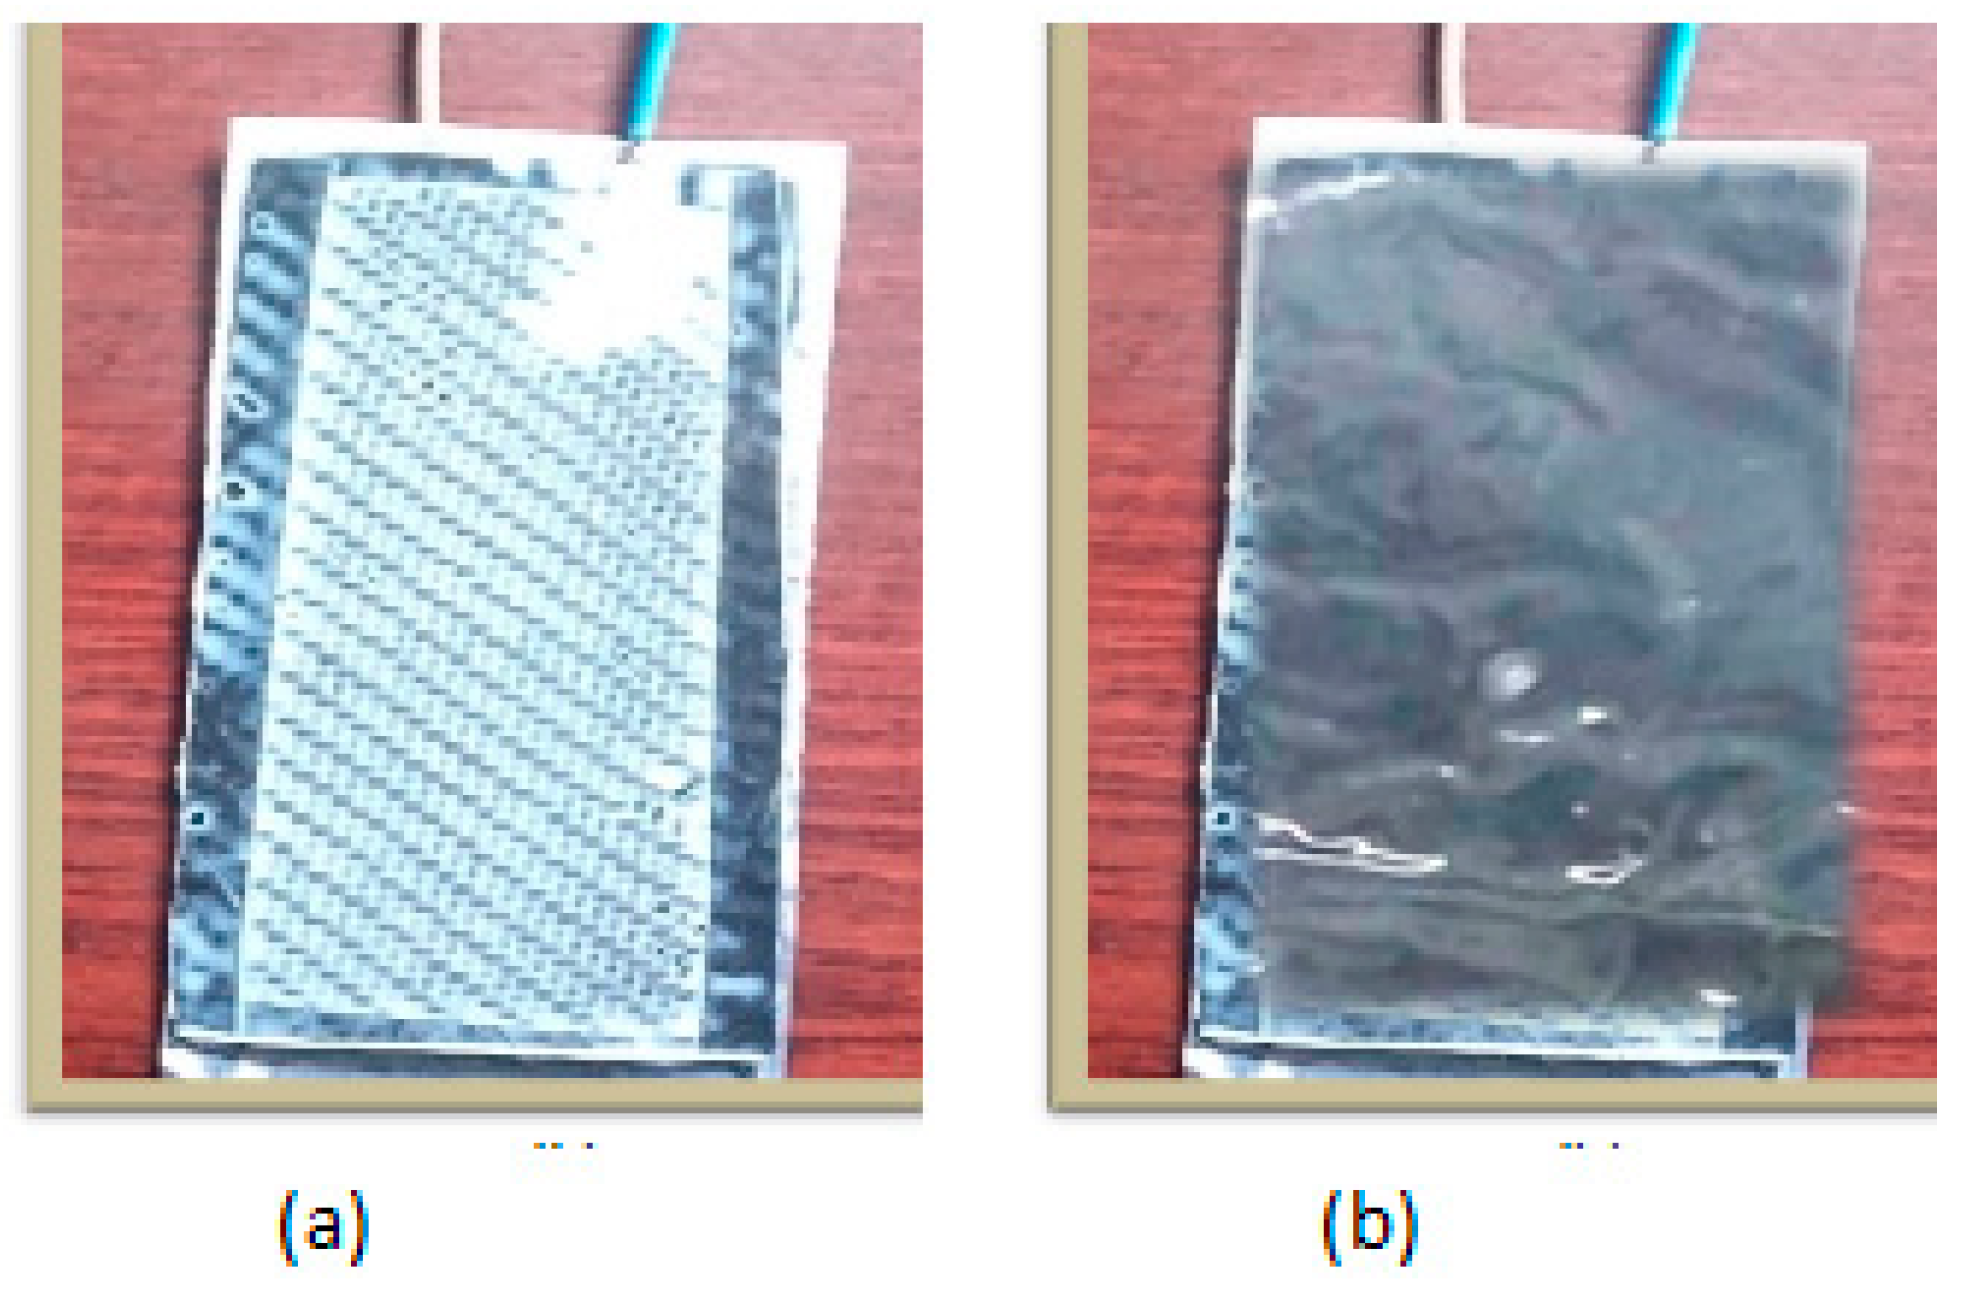
Two types of organic supercapacitor (OSC) have been made using 6% of C and 5% of ZnO for n-type and 5% of CuO for p-type. In addition, 20 gsm paper of thickness 0.005 mm soaked with Na2SO4 for the ultracapacitor is called ZnO/CuO-C EDLOSC, as shown in Figure 3. In contrast, Figure 3b shows the ZnO/CuO-C EDLOSC enclosed with an exotic PVA/ZnO organic solar thin film. An organic solar-dependent ZnO/CuO-C EDLOSC size of 10 cm × 4.5 cm × 0.5 cm has been developed using 6 wt.% C and 30 wt.% ZnO/CuO to generate electricity from solar heat and storage and used as the power system of the TiO2-NiFeC PEM microbial electrolyzer for in situ hydrogen production.

2.2. Performance of the Organic Power System in Hydrogen Generation

Reducing the cost of low-carbon electricity will be critical to bring down the expense of producing hydrogen from electrolysis with the supplying of renewable energy. Hydrogen production costs USD 1.00/kg H2, the 2030 goal of the US hydrogen production initiative. To reach this targeted hydrogen production cost, electricity prices must therefore be sufficiently below USD 20/MWh [26].
The EDLOSC has been used to develop renewable energy by capturing solar heat to power the electrolyzer electrolysis process to generate hydrogen. The test results of an EDLOSC cell at 32 °C show an energy conversion efficiency (ηec) of 19%, a voltage (Voc) of 2800 mV, a current density (Jsc) of 522 mA/cm2, a capacitance (µF) of 20.15 µF/cm2, an energy density (Ed) of 120 Wh/kg, and a power density (Pd) of 29 kW/kg.
The short-circuit current (Jsc), open-circuit current (Voc), and capacitance (µF) were measured by attaching a multi-meter directly to the two sides of the solar cell using wires with alligator clips attached to their ends, as shown in Figure 4: (a) shows the EDLOSC without solar thin film, (b) shows the solar thin film, and (c) shows the EDLOSC with solar thin film. The negative electrode of EDLOSC was attached to the negative terminal of the multi-meter, while the positive electrode was attached to the positive terminal of the multi-meter. The EDLOSC cell was tested outdoors under direct solar heat at 32 °C. The performance of the OSC (organic supercapacitor) has been summarized in Table 1 in terms of capacitance, in micro-farads (µF), for the 3 types of OSC cells using 70 gsm dielectric paper and soaked with Na2SO4. The 6 wt.% C, 30 wt.% ZnO/CuO with 70 gsm was soaked in Na2SO4.
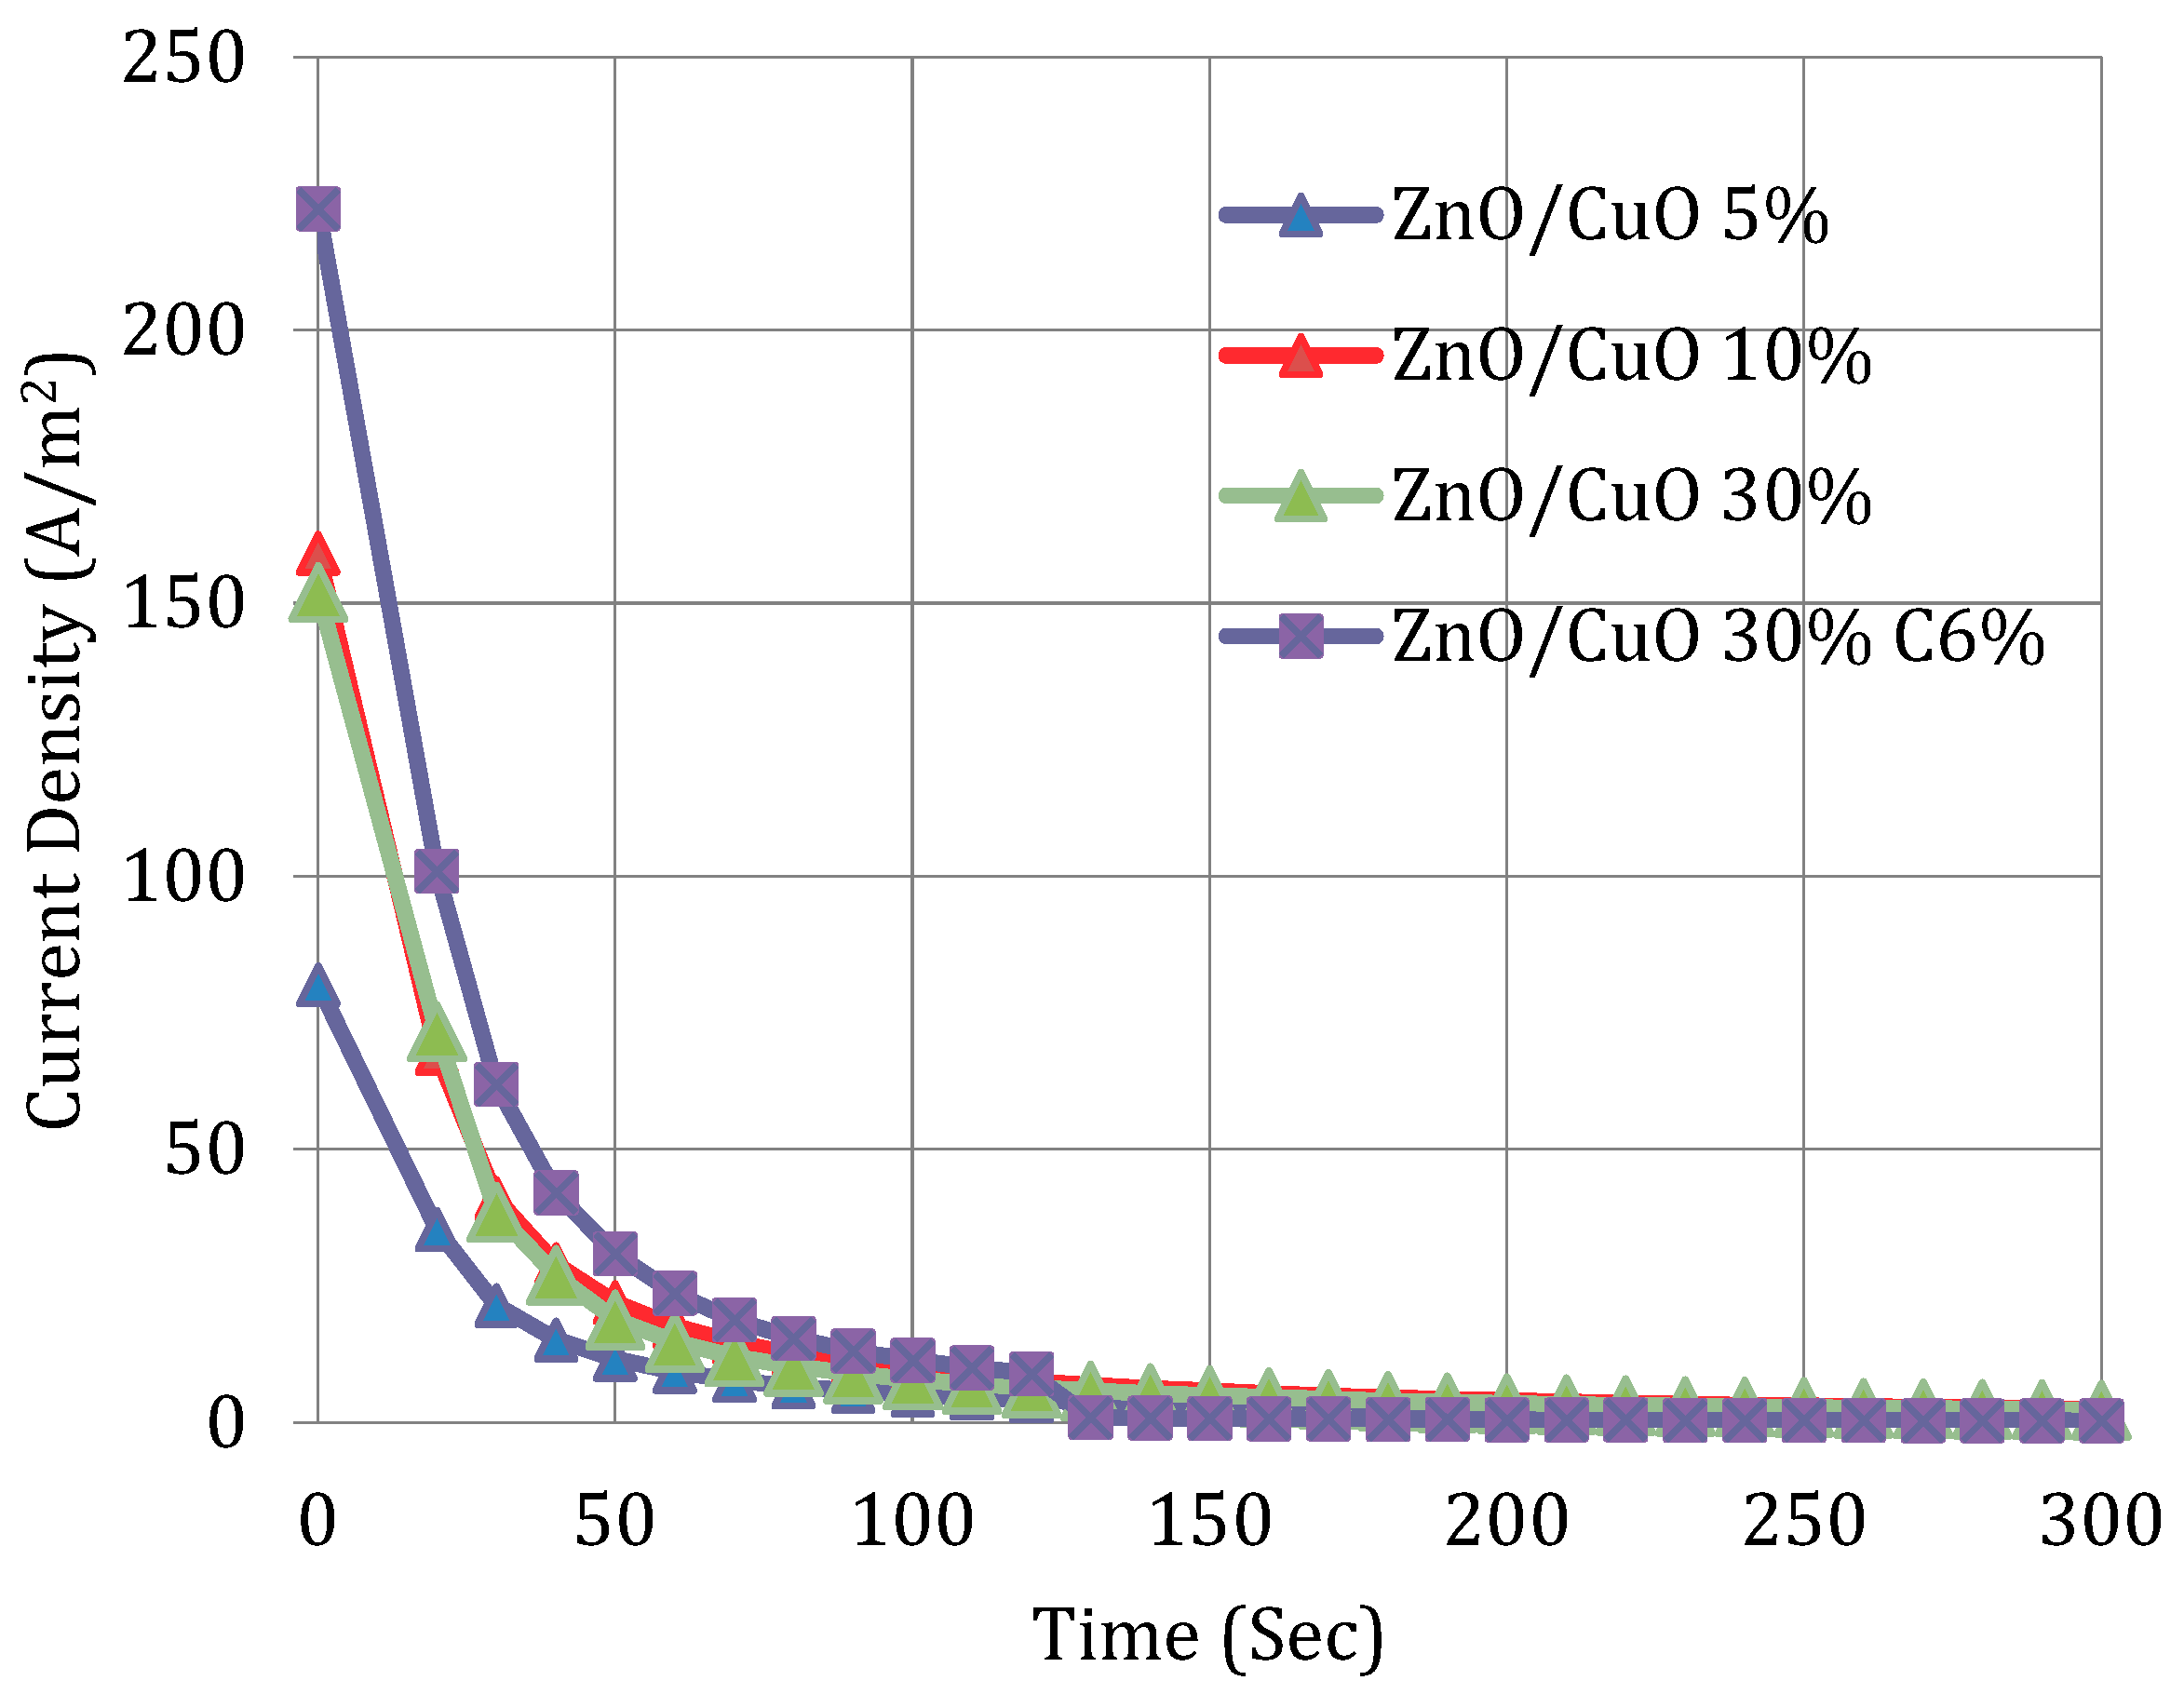
Figure 5 shows the current density level was measured for the EDLOSC with a thickness of 2.0 mm and an area of 0.0033 m2 in 1.5 s as 75 A/m2, 151 A/m2, 160 A/m2, and 222.22 A/m2 for the sample 5 wt% ZnO/CuO, 10% wt% ZnO/CuO, 30 wt% ZnO/CuO, and 30 wt% ZnO/CuO with 6 wt% C, respectively. The discharge time was measured until zero JSC. The EDLOSC-encased PVA/ZnO thin film has been used as a power supply to the TiO2-NiFeC PEM microbial electrolyzer as stated earlier. The PVA/ZnO thin film increased the conversion of efficiency of ZnO/CuO EDLOSC by 3–5% based on the solar power density. Thus, 30 wt.% ZnO/CuO 6 wt.%C ZnO/CuO EDLOSC-encased PVA/ZnO thin film conversation efficiency has achieved 15% at a solar power density of 1000 W/m2. Furthermore, the conversion efficiency of ZnO/CuO-C EDLOSC can be increased by adding the layer of EDLOSC-encased ZnO/PVA.
The EDLOSC encompassed nanomaterials of 30 wt.% ZnO/CuO 6 wt% C, in which the charging time is faster and the discharging time is slower compared to the other EDLOSC. The average power conversion efficiency of the EDLOSC was found to be 11.5% at a solar power density of 1000 W/m2.
The photovoltaic generation of EDLOSC- and EDLOSEC-encased ZnO/PVA has been investigated at 32 °C solar heat. It was found that the photovoltaic generation is achieved using a 0.0033 m2 EDLOSC 1.25 V, while the EDLOCE is encased in a 0.25 mm ZnO/PVA solar thin film 1.3 V. The EDLOSC-encased ZnO/PVA increases voltage generation by 4% over EDLOSC. Thus, the EDLOSC-encased ZnO/PVA solar energy conversion efficiency is recorded as 14.65%, as shown in Table 2. The EDLOSC’s performance has been examined in terms of solar energy conversion efficiency (eta), short-circuit current density (JSC), and open-circuit voltage (VOC). Compared to the EDLOSC, the ZnO/PVA-encased EDLOSC performs 6.4% better. By generating, storing, and delivering electrical power to the TiO2-NiFeC PEM microbial electrolyzer, the EDLOSC-encased ZnO/PVA is a possible solar renewable energy system that can produce hydrogen in situ without requiring travel to the power source.
However, the optical direct bandgap decreased with the increase in ZnO concentration in the polymer matrix, which also results in the loss of efficiency. The thickness of the ZnO/PVA nanocomposite film also affects the efficiency of the organic solar cell, and the efficiency decreases with the increase in thickness of the ZnO/PVA nanocomposite film.

2.3. Comparison of EDLOSC with the Published Related Product

The EDLC has been used in this study to supply power to the ME in situ hydrogen generation, which will minimize the cost of hydrogen production. The performance result of the EDLOSC made with ZnO/CuOC RP has been compared with the published research work in [25,27], as shown in Table 3. The AC for the 1200 g/m2 surface area has shown a capacitance of 19 µF/cm2 [27], which is slightly less than the authors’ experimental result for 1050 g /m2, which shows a capacitance of 18.56 µF/cm2. This could be mainly due to the 14% smaller surface area of the authors compared [25].
Table 4 shows the difference between the EDLC (authors) with the published works. The authors’ EDLC has shown the better performance compared to [13,28], except for the author product SWNT.
Table 5 shows that the performance comparison of the authors’ EDLC of wt.% 6 AC wt.%30 ZnO/CuO in terms of VOC, ISC, and efficiency is found to be better than the authors of (Dhara et al., 2016) [32]. However, extensive experimental study is required to test the EDLC with the EV as a body panel for its validation.

Characterization of EDLOSC-Encased ZnO/PVA

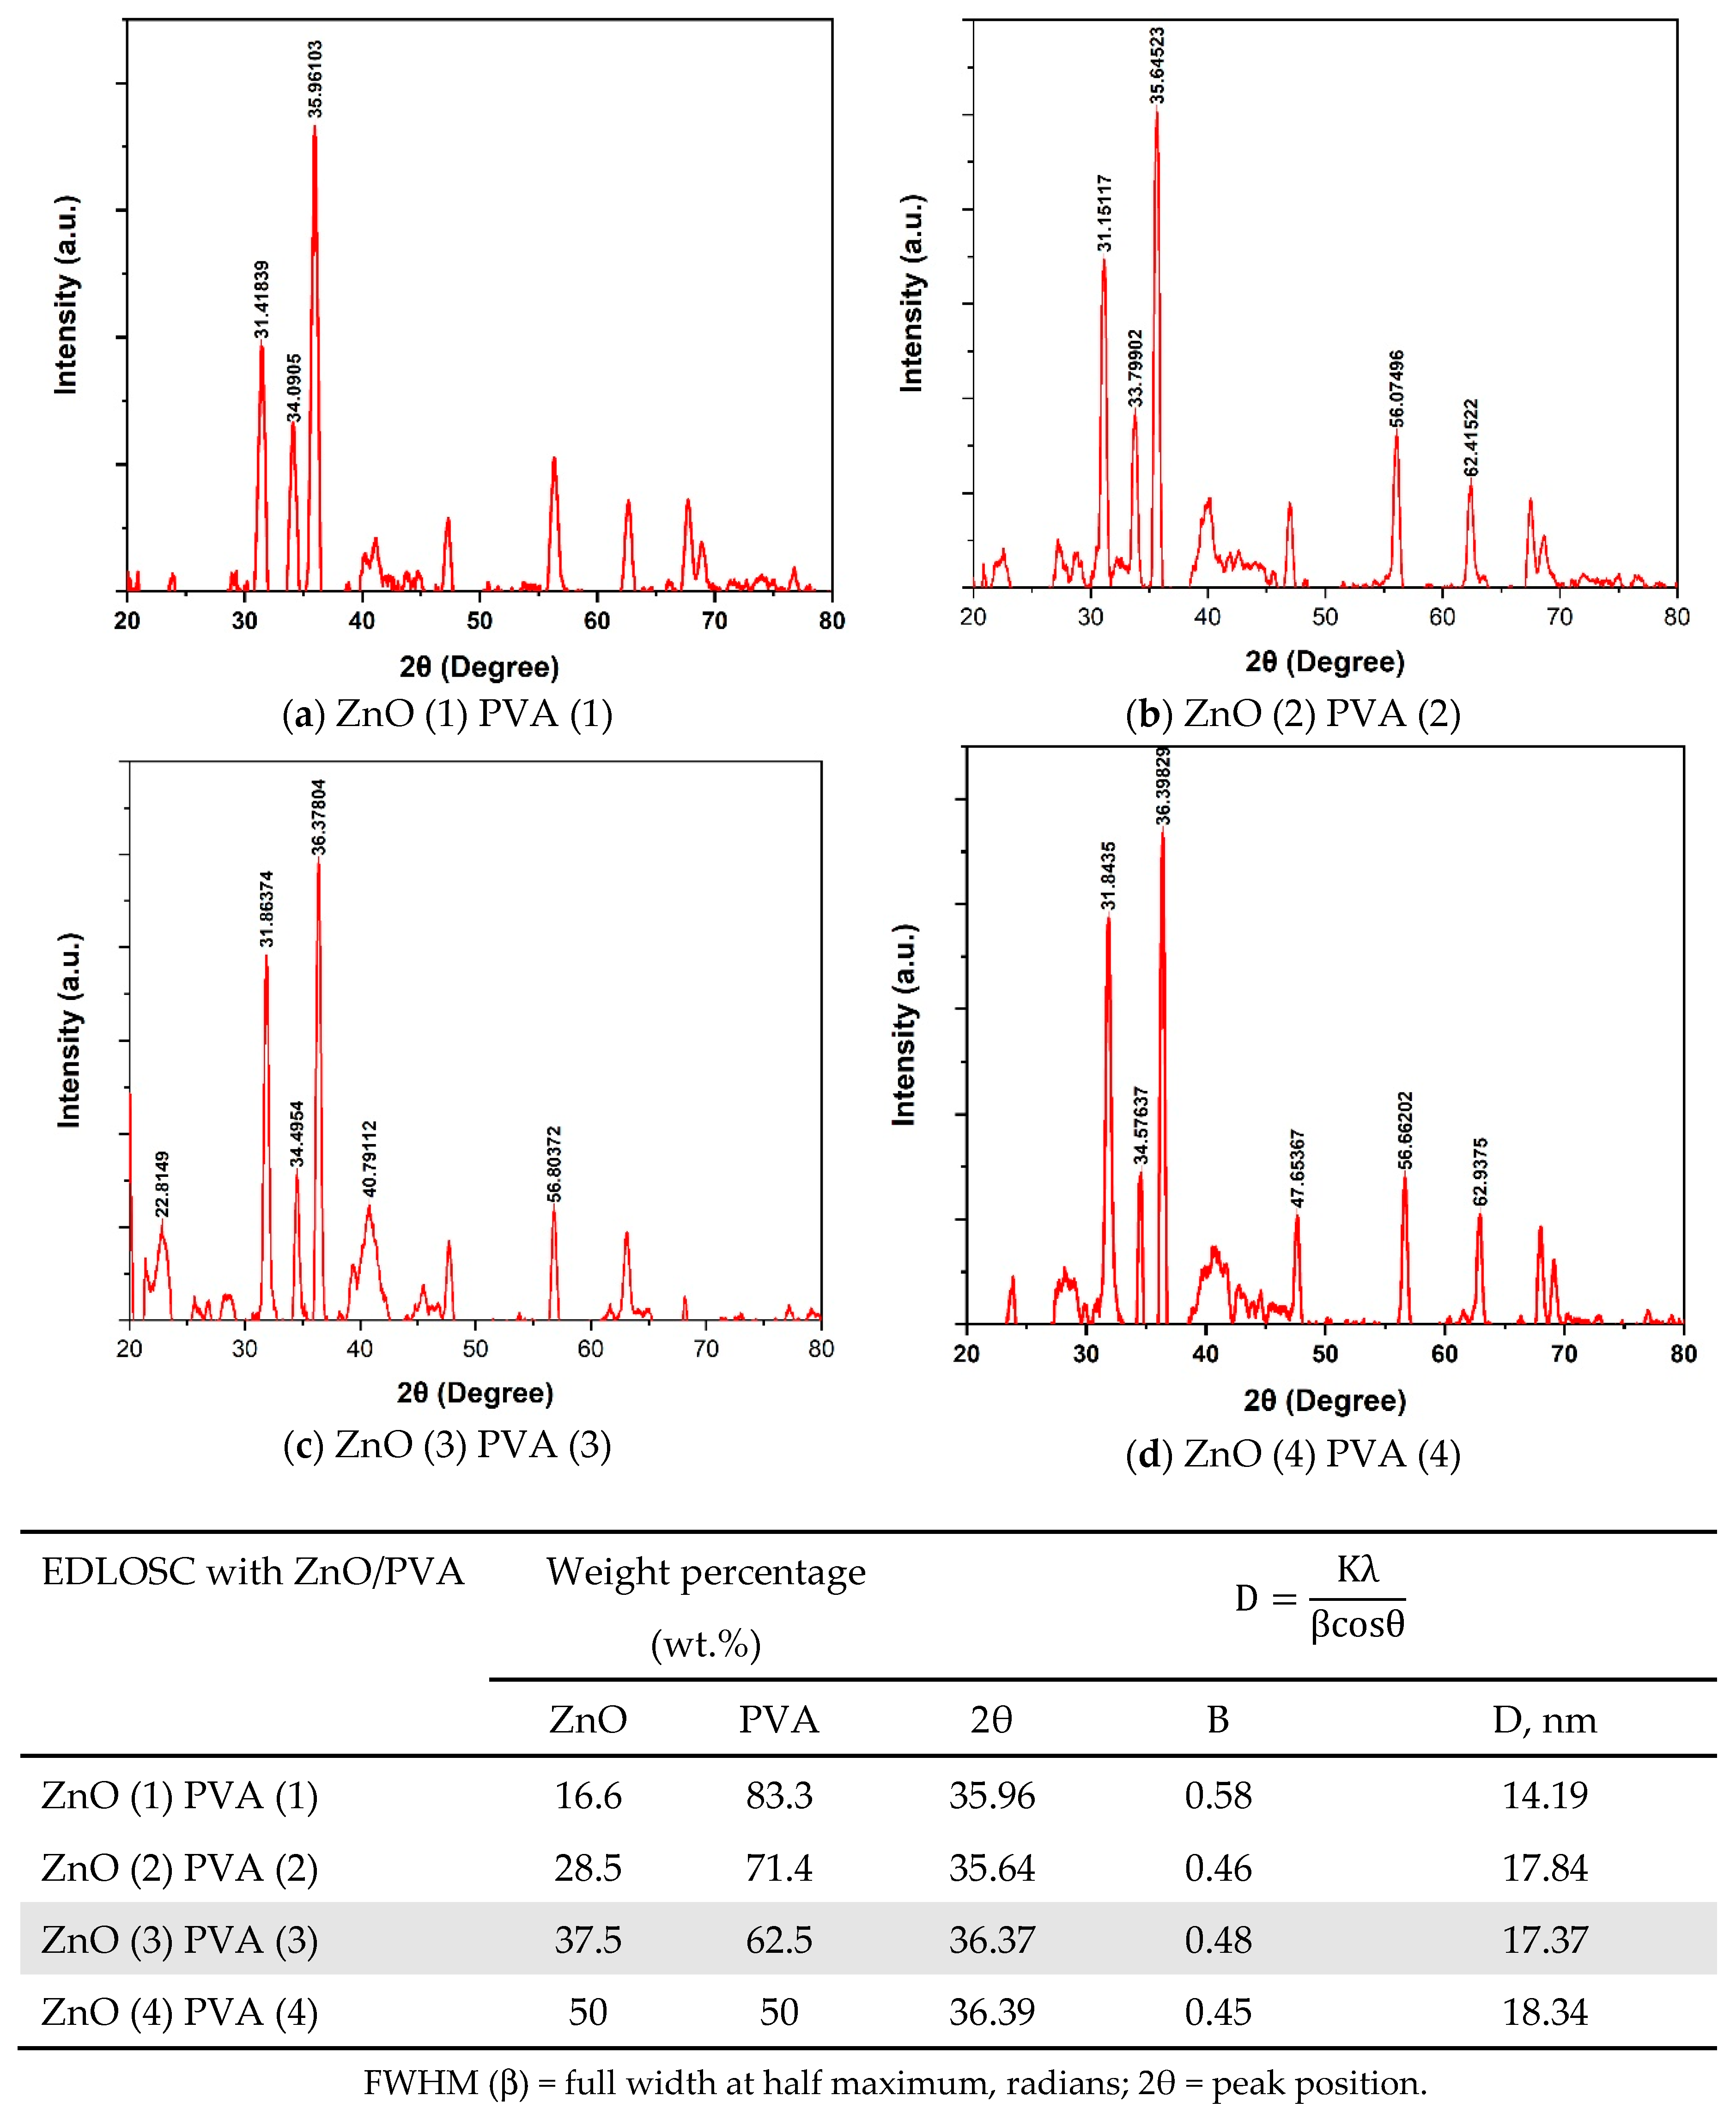
The characterization of ZnO/PVA has been characterized using the SEM, XRD, optical energy bandgap (OEB), and absorption spectra (AS) for the samples:
EDLOSC * PVA/ZnOWeight Percentage (wt.%)
ZnOPVA
ZnO (1) PVA (1)16.683.3
ZnO (2) PVA(2)28.571.4
ZnO (3) PVA (3)37.562.5
ZnO (4) PVA (4)5050
EDLOSC *: Nano-structure of 6 wt.% C 30 wt.% ZnO/CuO with Na2SO4 soaked aqueous 70 gsm.
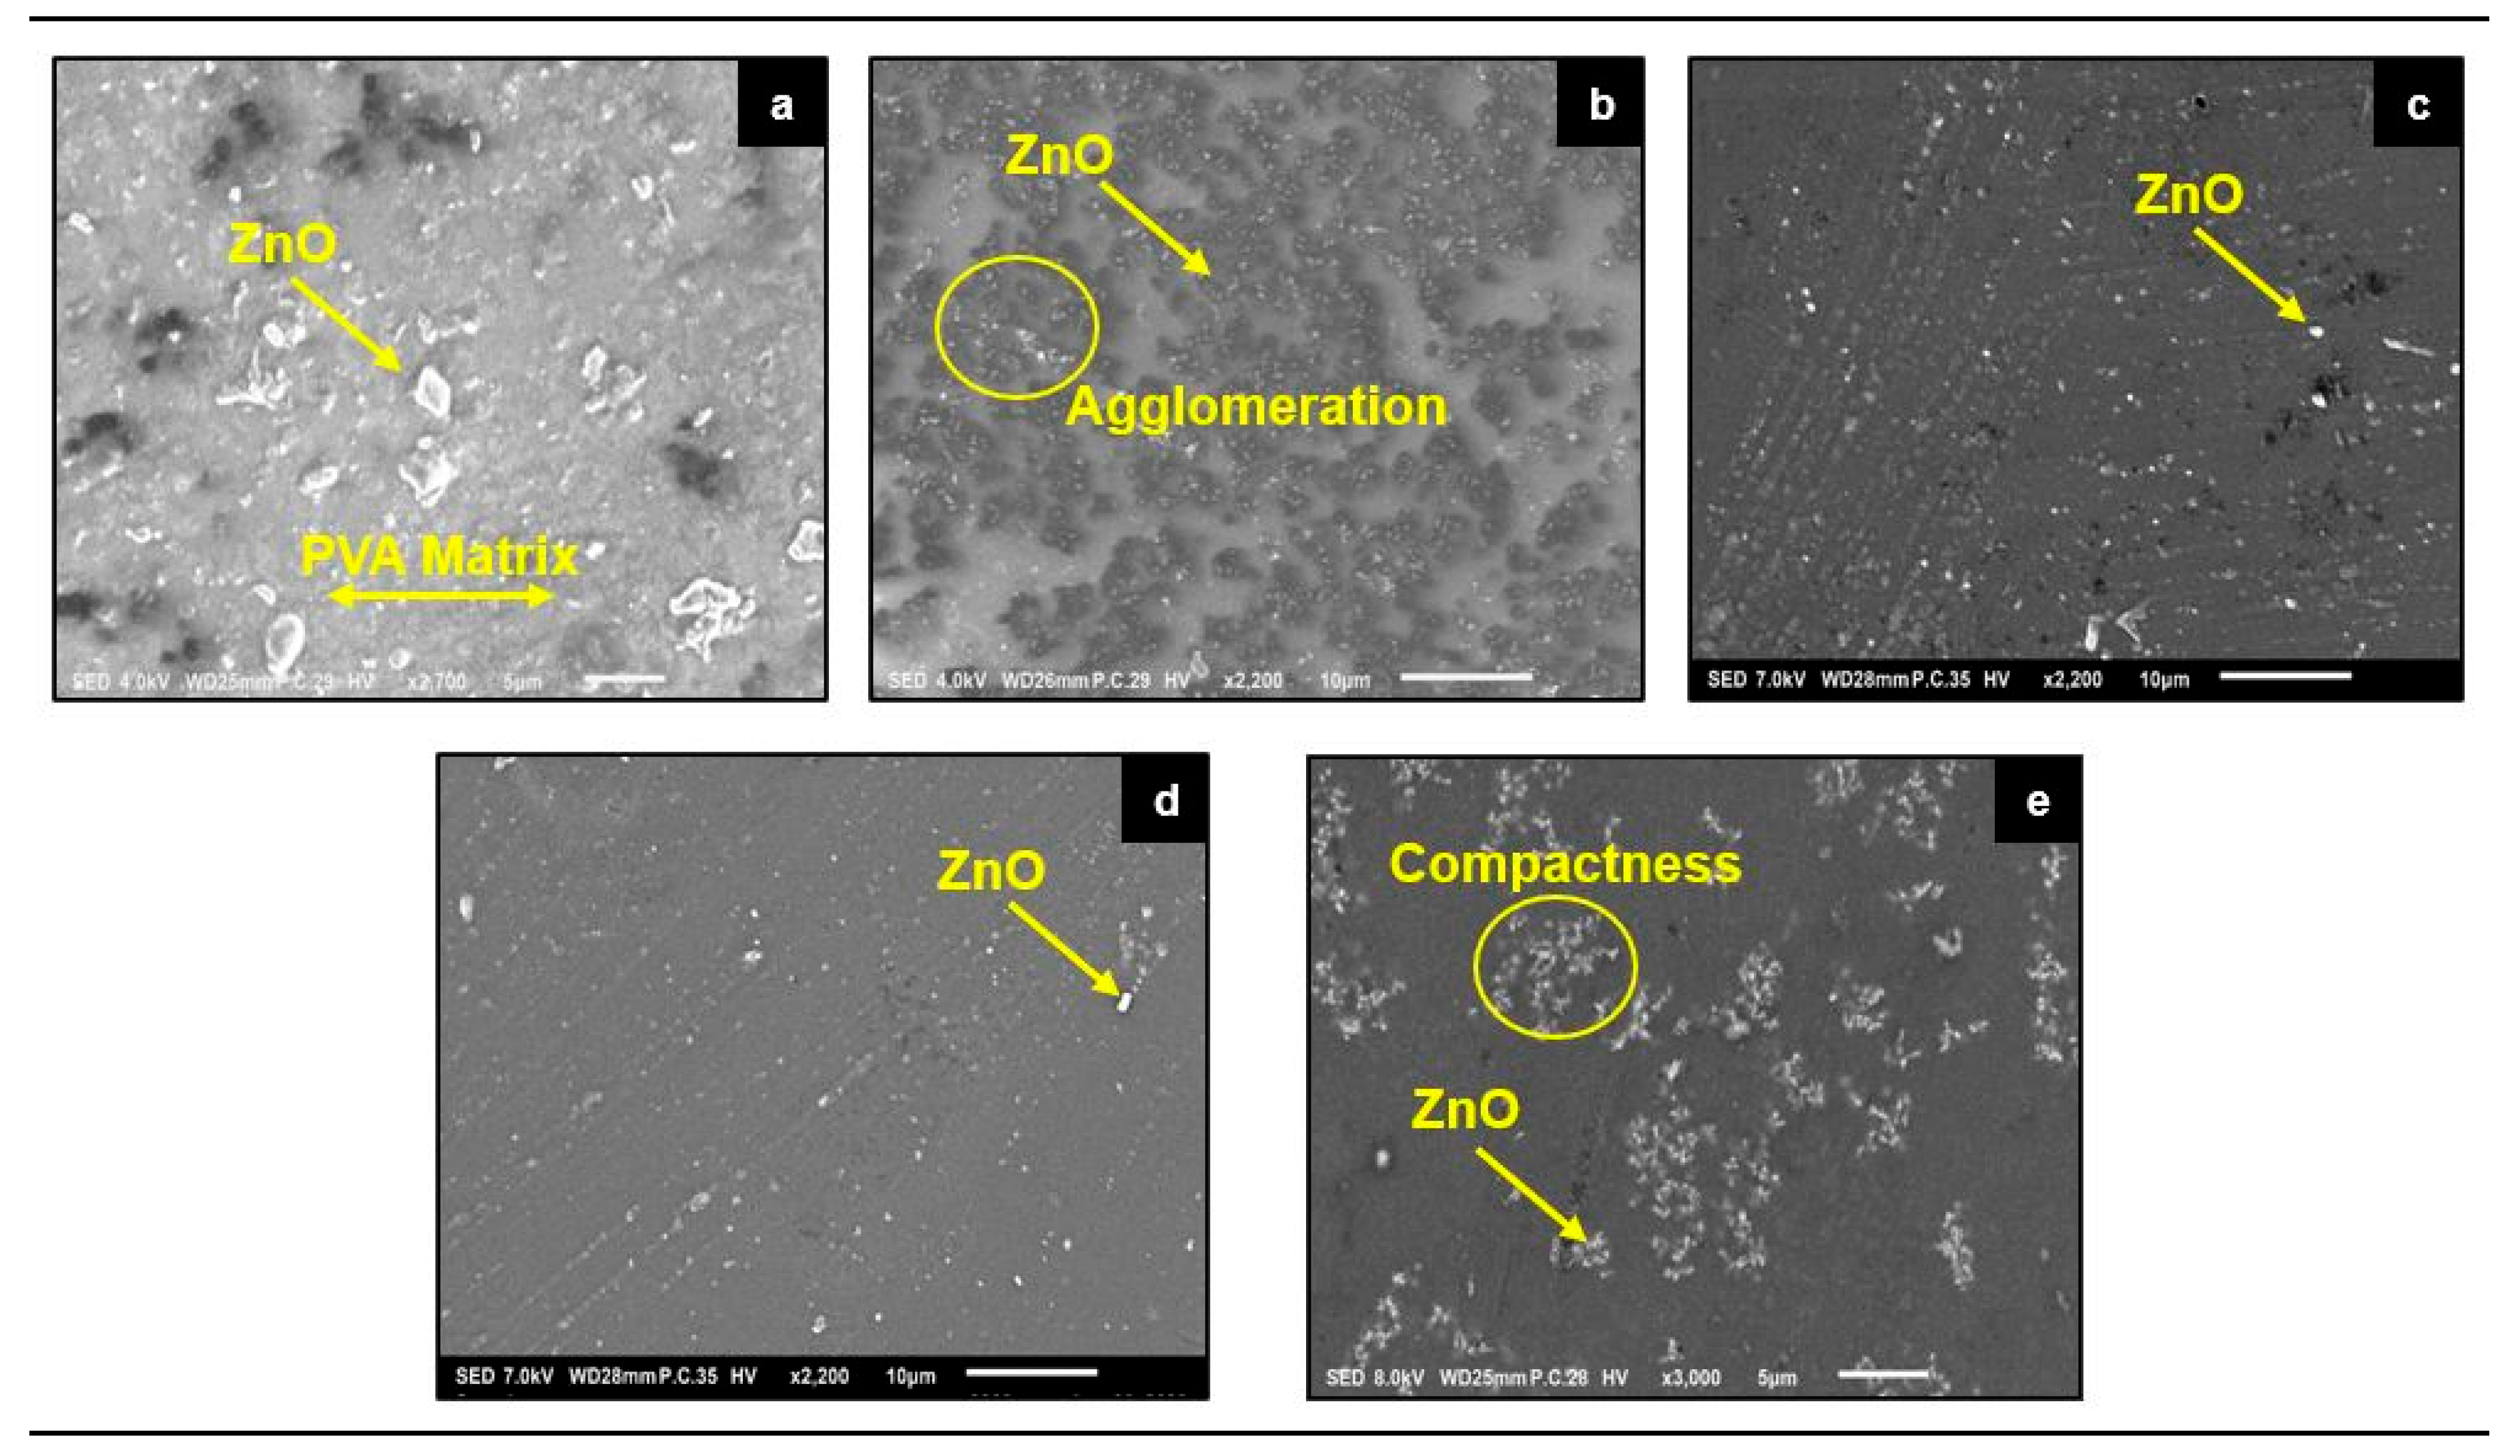
The aggregate shape causes a non-linear electron flow, which leads to a decrease in energy generation, and it is supported by the conclusion of the authors of [33]. Figure 6b demonstrates that the nanoparticles are distributed uniformly within the PVA matrix. The ZnO/PVA nanocomposite demonstrated that crystallites formed and began to grow in the immediate vicinity of the surface as the ZnO concentration was increased. Additionally, it demonstrated uniform dispersion of ZnO nanoparticles, whereas increased ZnO concentration resulted in increased compactness and aggregation, which is supported by the authors of [34]. Figure 6c examines the nanoparticles’ uniform dispersion within the PVA matrix. The analysis of the surface morphology of the ZnO/PVA composite film shows several aggregates or chunks dispersed randomly on the film’s surface. It is critical to note that irregular ZnO nanoparticles ranging in size from 15 to 18 nm were formed. Figure 6d shows a smooth PVA matrix with chunks of flake-shaped ZnO particles scattered around the surface. It is significant to mention that irregular ZnO nanoparticles with diameters ranging from 16 to 19 nm were formed. Figure 6e shows a micrograph of the ZnO/PVA film with a higher PVA concentration in the matrix, arising from inappropriate ZnO mixing.
The XRD pattern of ZnO/PVA nanocomposite is shown in Figure 7, with a relatively strong broad peak located at 2θ = 36.37. The corresponding diffraction peaks matched with the diffraction peak of PVA and standard PDF database (JCPDS 36-1451) of ZnO wurtzite hexagonal crystal structure. These diffraction peaks confirmed the formation of ZnO/PVA nanocomposite with the increase in crystallinity of the PVA matrix with the embodiment of ZnO nanoparticles. The crystallite size of PVA/ZnO nanocomposite films was calculated using the Debye–Scherrer formula, D = K λ β c o s θ , where D was found to be in the range of 16.86–19.55 nm considering a wavelength of 1.5406 nm and 2θ = 36.37. Higher peak intensities generally indicate a larger number of atoms contributing to that diffraction of solar power in shorter peak position. The nanocomposite solar film made with ZnO3 PVA3 (ZnO wt.% 37.5 and CuO wt.% 62.5) is the optimized crystalline structure for the solar power intensity and diffracted gap of 17.37 nm.
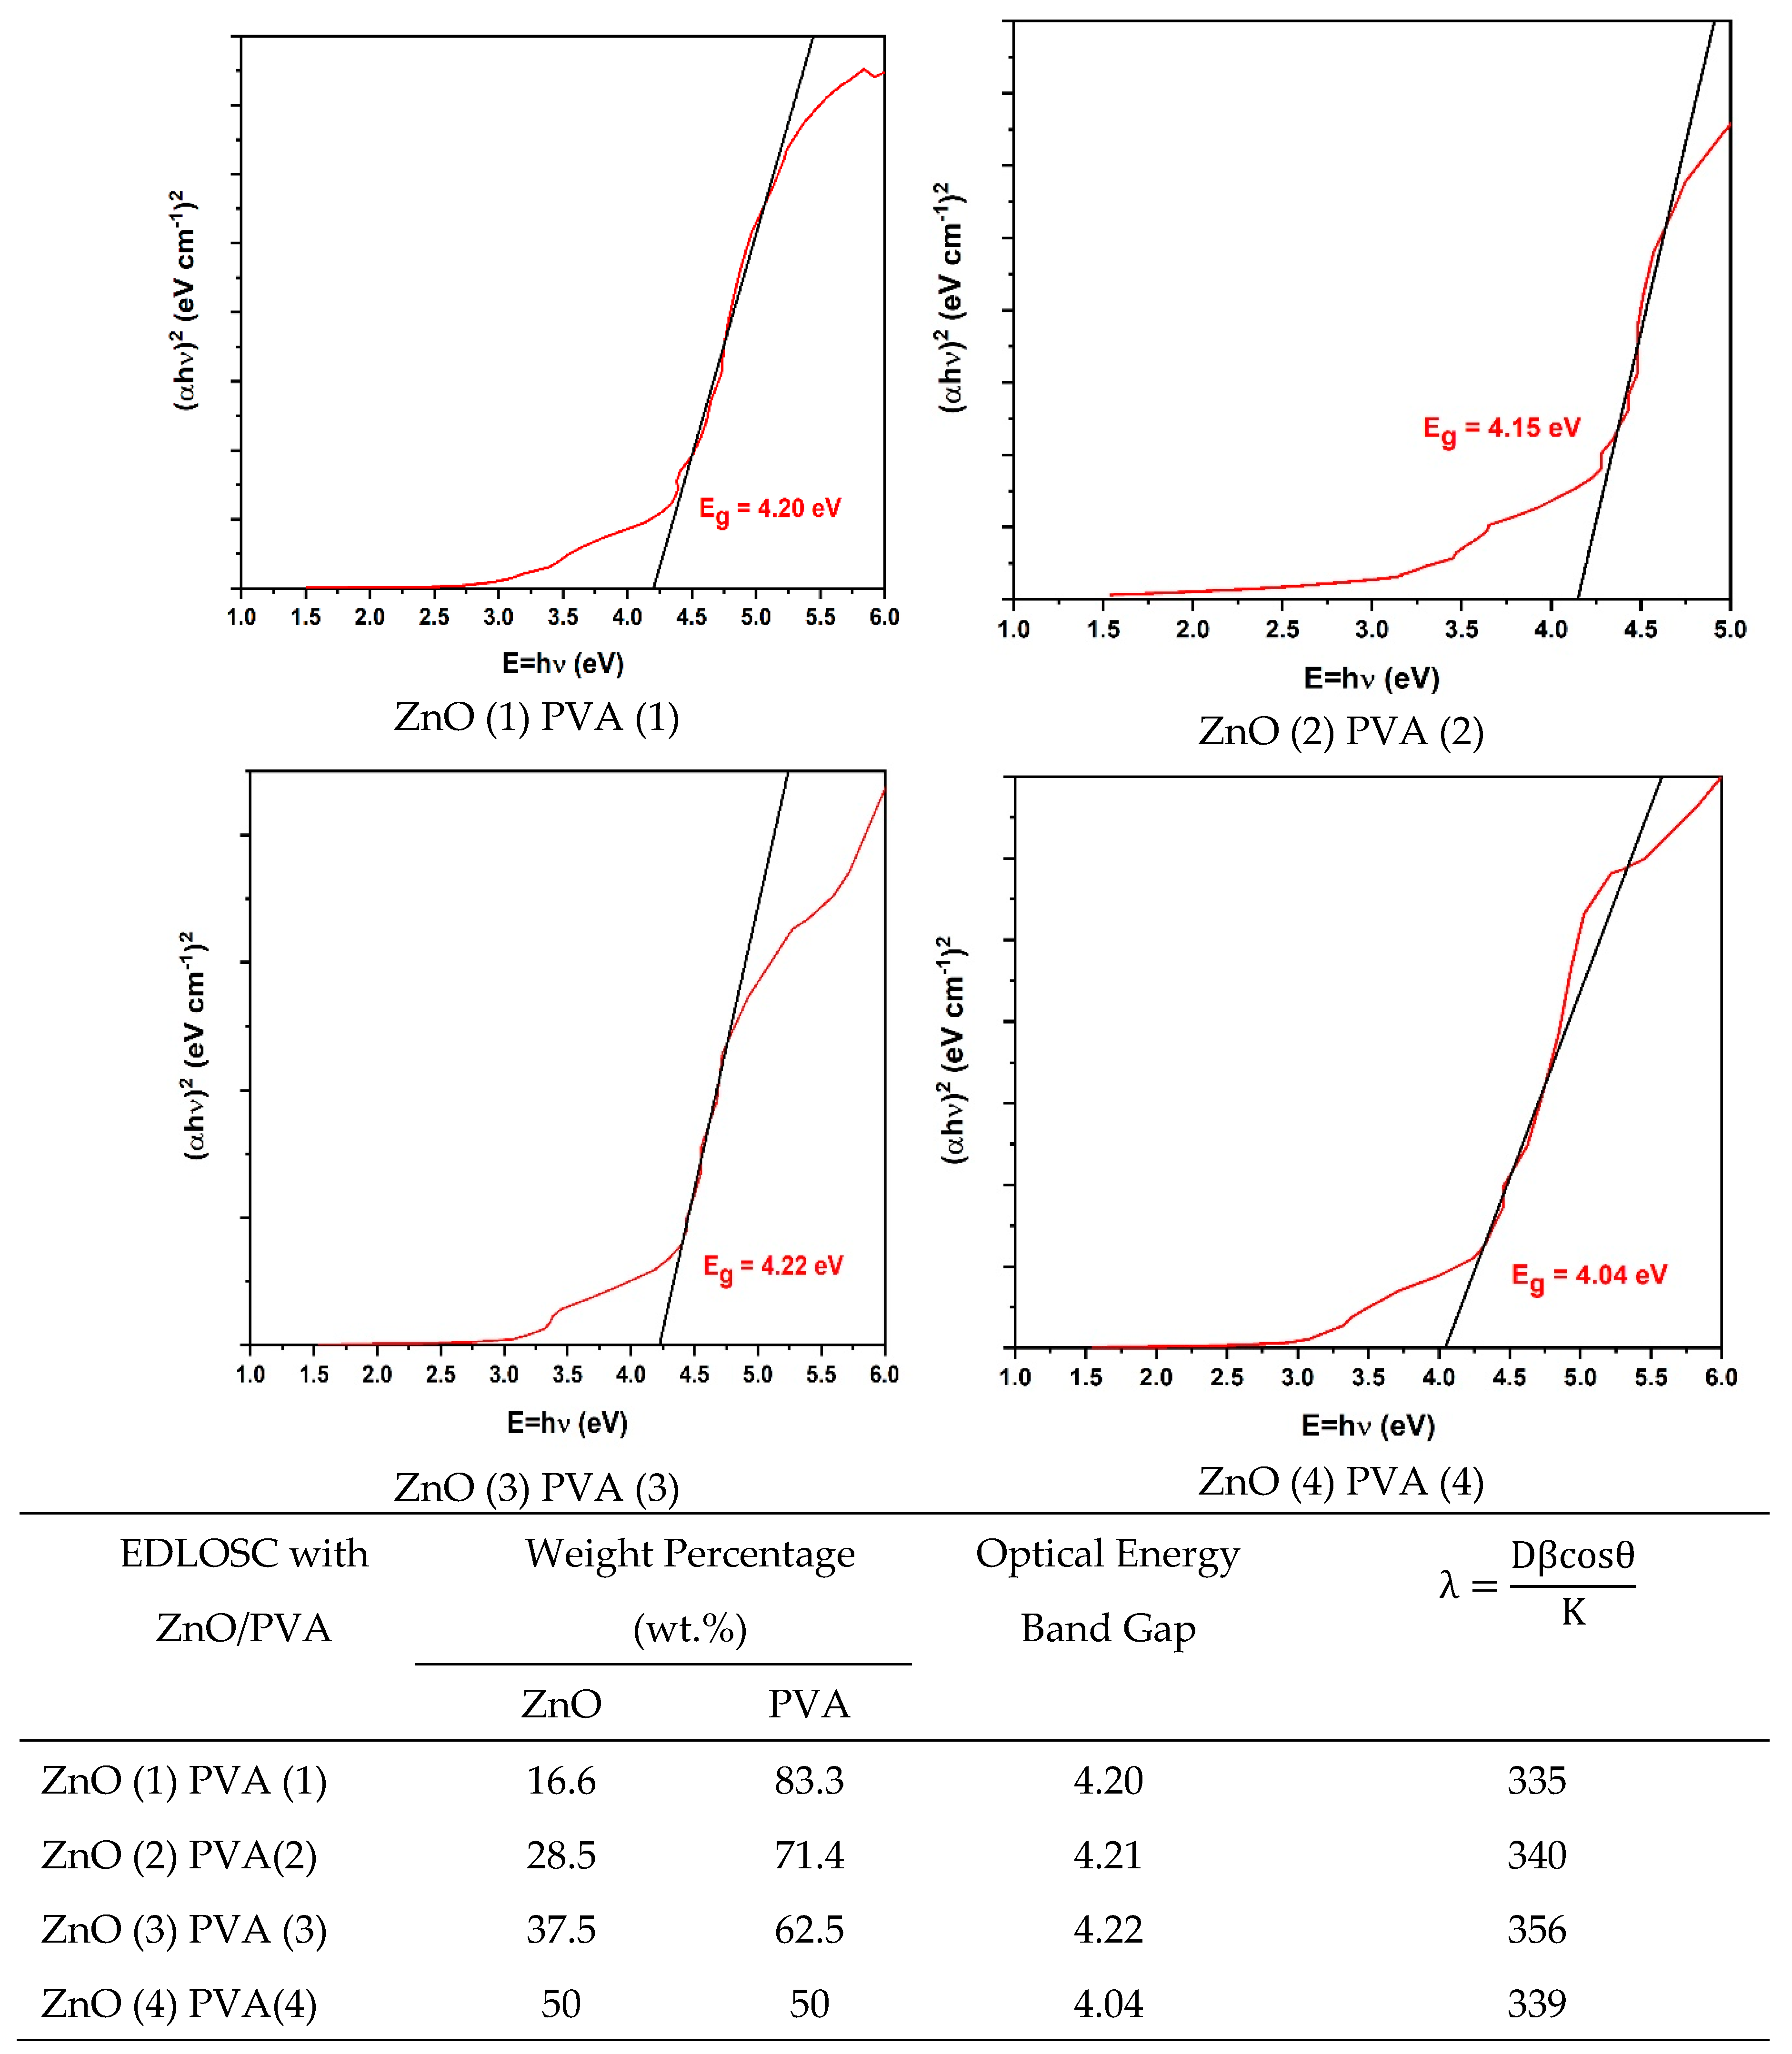
The semiconductor bandgap, also known as the optical gap, energy gap, or mobility gap, is an important property of semiconductors that determines the optoelectronic properties of devices created from such semiconductors. The value of the bandgap energy (Eg) is characteristic for each semiconductor in solar energy conversion. Organic solar panels are most efficient at converting solar heat energy into electrical energy within the visible and infrared range, i.e., 400–1100 nm. In contrast, the longer wavelengths (like infrared) are less effective, and shorter wavelengths (like ultraviolet) can be damaging. Result shows that the ZnO (3) PVA (3) nano-composition thin film is effectively transparent to photons of energy to the EDLOSC developed in the infrared range at 356 nm, which would be efficient to convert the solar energy into electrical energy of the ZnO/CuO-C EDLOSC of an area of 0.0033 m2. The PVA-ZnO composite film’s optical absorption spectra showed two bands occurring in the range of 235–366 nm, with a lower intensity corresponding to the presence of ZnO in the film. These bands referred to PVA absorption and ZnO nanoparticle excitons. The energy bandgap was found to be 4.16 eV by converting the spectra into a Tauc plot, as shown in Figure 8. A decrease in optical energy bandgap is observed with the increase in nano-ZnO concentration in the matrix [35,36].
Figure 8 shows the absorption spectra of EDLOSC-encased ZnO/PVA to identify its ability in absorbing the solar heat and transfer to the EDLOSC to enhance the performance. The absorption spectra are measured with open circuit voltage, VOC, and short-circuit current density, JSC. The maximum VOC and JSC are found to be 662.81 mV and 31.46 mA/cm2 for the EDLOSC-encased ZnO (3) PVA (3) nano-composition thin film, which contributed to enhancing the efficiency of the EDLOSC by about 5%. However, this result is found based on the laboratory facilities. The field experimental result shows about 3.5% efficiency enhancement of the EDLOSC by encasing in ZnO/PVA at a solar temperature of 32 °C [37].

3. Parametric Study

Any change in a material’s temperature can induce thermal stress, a form of mechanical stress that may lead to plastic deformation or fracture of the PEM, which has a thickness of 0.06 mm. Finite Element Analysis (FEA) software was used to optimize the PEM configuration for hydrogen production from POME. As shown in Figure 9, the electric power supply to the TiO2–NiFe CNC-PEM microbial electrolyzer was examined in continuous mode, while the POME feed was tested under an ON/OFF control mode to optimize PEM performance. The default manual ON/OFF valve settings were based on the thermal durability of the PEM. The FEA software’s code inspection and analysis tools ensured compliance with relevant legal and industrial standards, following design codes such as ASCE, Eurocode, and AISC. To evaluate the structural and thermal behavior of the TiO2–NiFe CNC-PEM microbial electrolyzer, a Finite Element Analysis (FEA) was conducted. The simulation encompassed key parameters such as temperature distribution, stress analysis, gas flow dynamics, and mechanical displacement. The primary objective was to assess the effects of heat generation, electrical loading, and gas production on the structural integrity and overall efficiency of the proton exchange membrane (PEM).
The FEA results confirm the efficiency and mechanical reliability of the proposed electrolyzer design. The temperature distribution analysis showed a manageable thermal gradient across the PEM, indicating no risk of thermal degradation. Stress analysis demonstrated that the membrane is exposed to very low structural and thermal stresses (maximum stress < 0.002 MPa), which are well below the material failure threshold, ensuring long-term durability. Additionally, displacement behavior was within acceptable limits, signifying minimal deformation even under sustained operation. Together, these results confirm that the TiO2-NiFe CNC-PEM electrolyzer is robust, stable, and capable of safe hydrogen production under various power inputs and environmental conditions.
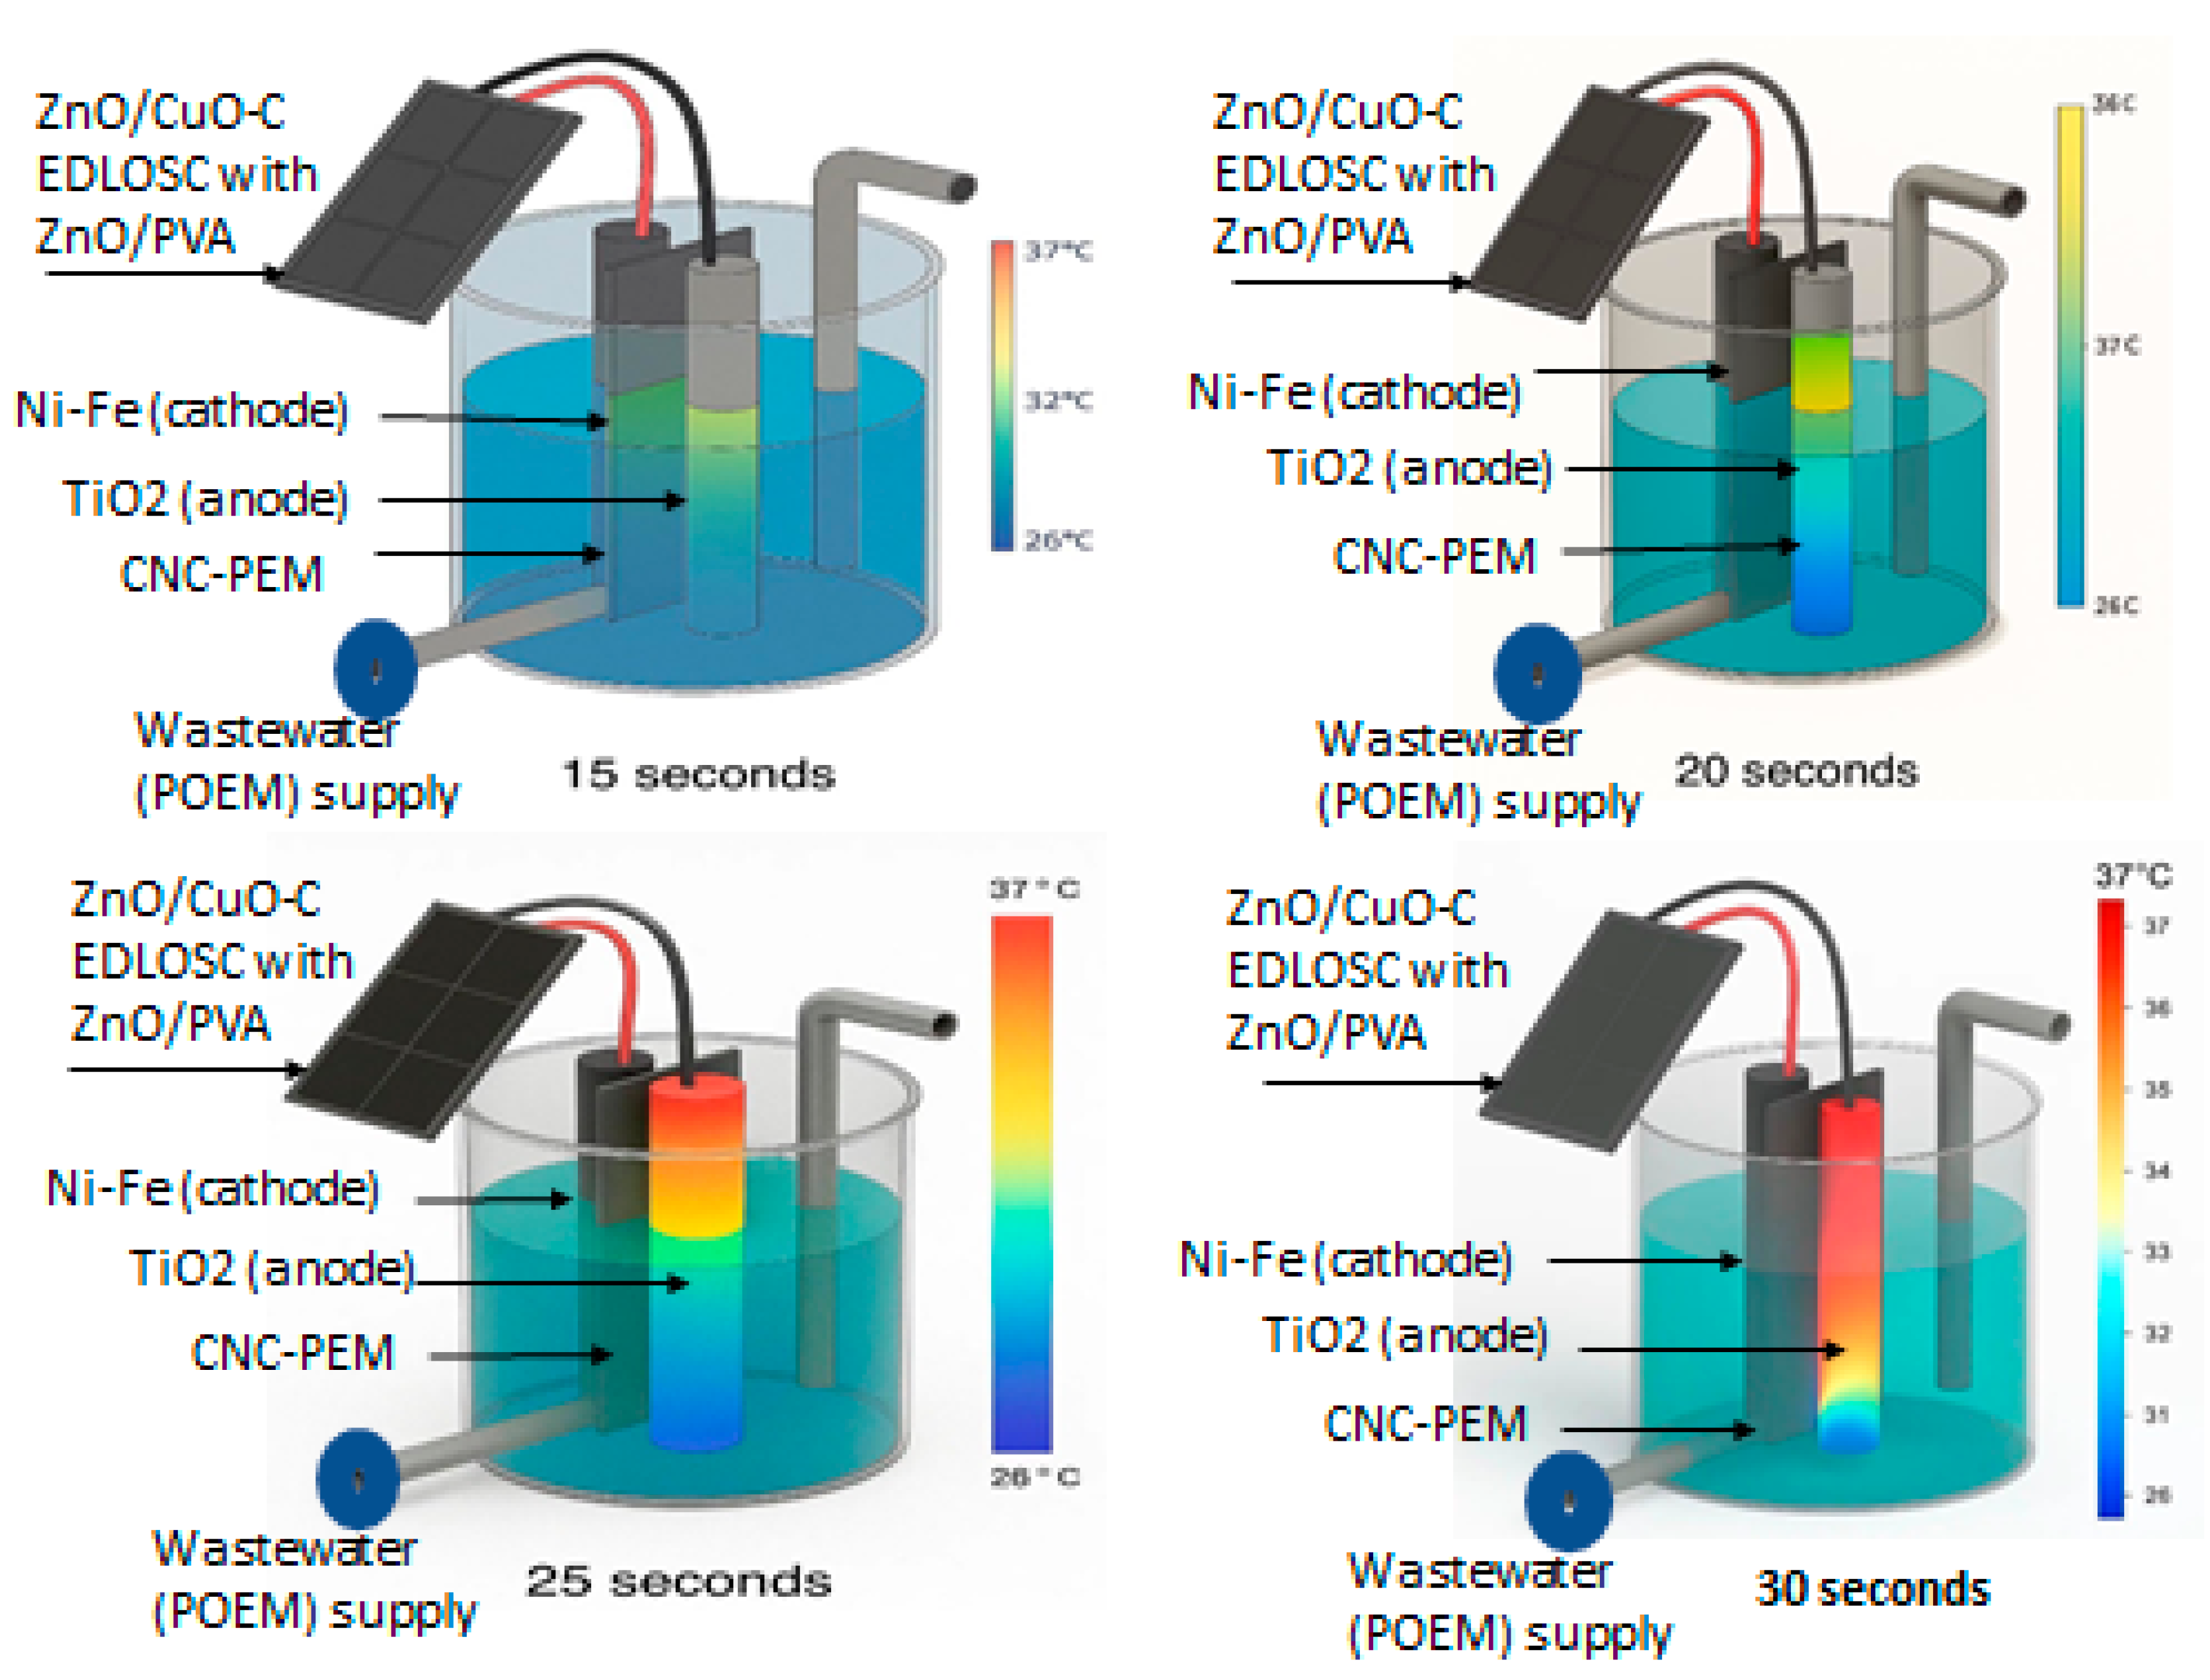
The maximum current supply to the electrolyzer was considered as 10 A, and it was limited based on the structure of TiO2NiFeC. The effect of 10 A current supply to the PEM of TiO2NiFeC while varying the time in seconds by ON/OFF POME supply to the enclosed electrolyzing unit has been checked by FEA analysis.
One of the best solar renewable energy systems is the EDLOSC encased in ZnO/PVA, which produces hydrogen in situ without the need for a current controller has shown in Figure 10. In order to replicate the effects of a 10 A current supply to the TiO2-NiFeC PEM microbial electrolyzer in hydrogen production, the wastewater (POME) supply has been regulated by a valve setting for 15 s, 20 s, 25 s, and 30 s. The results of the FEA simulation demonstrate that the electrolyzer’s maximum 15 A current supply has no effect on the development of thermal stress when stopping wastewater supply for 15–20 s. Nonetheless, the thermal stress development is clearly visible at the 25 and 30 s wastewater supply stops.
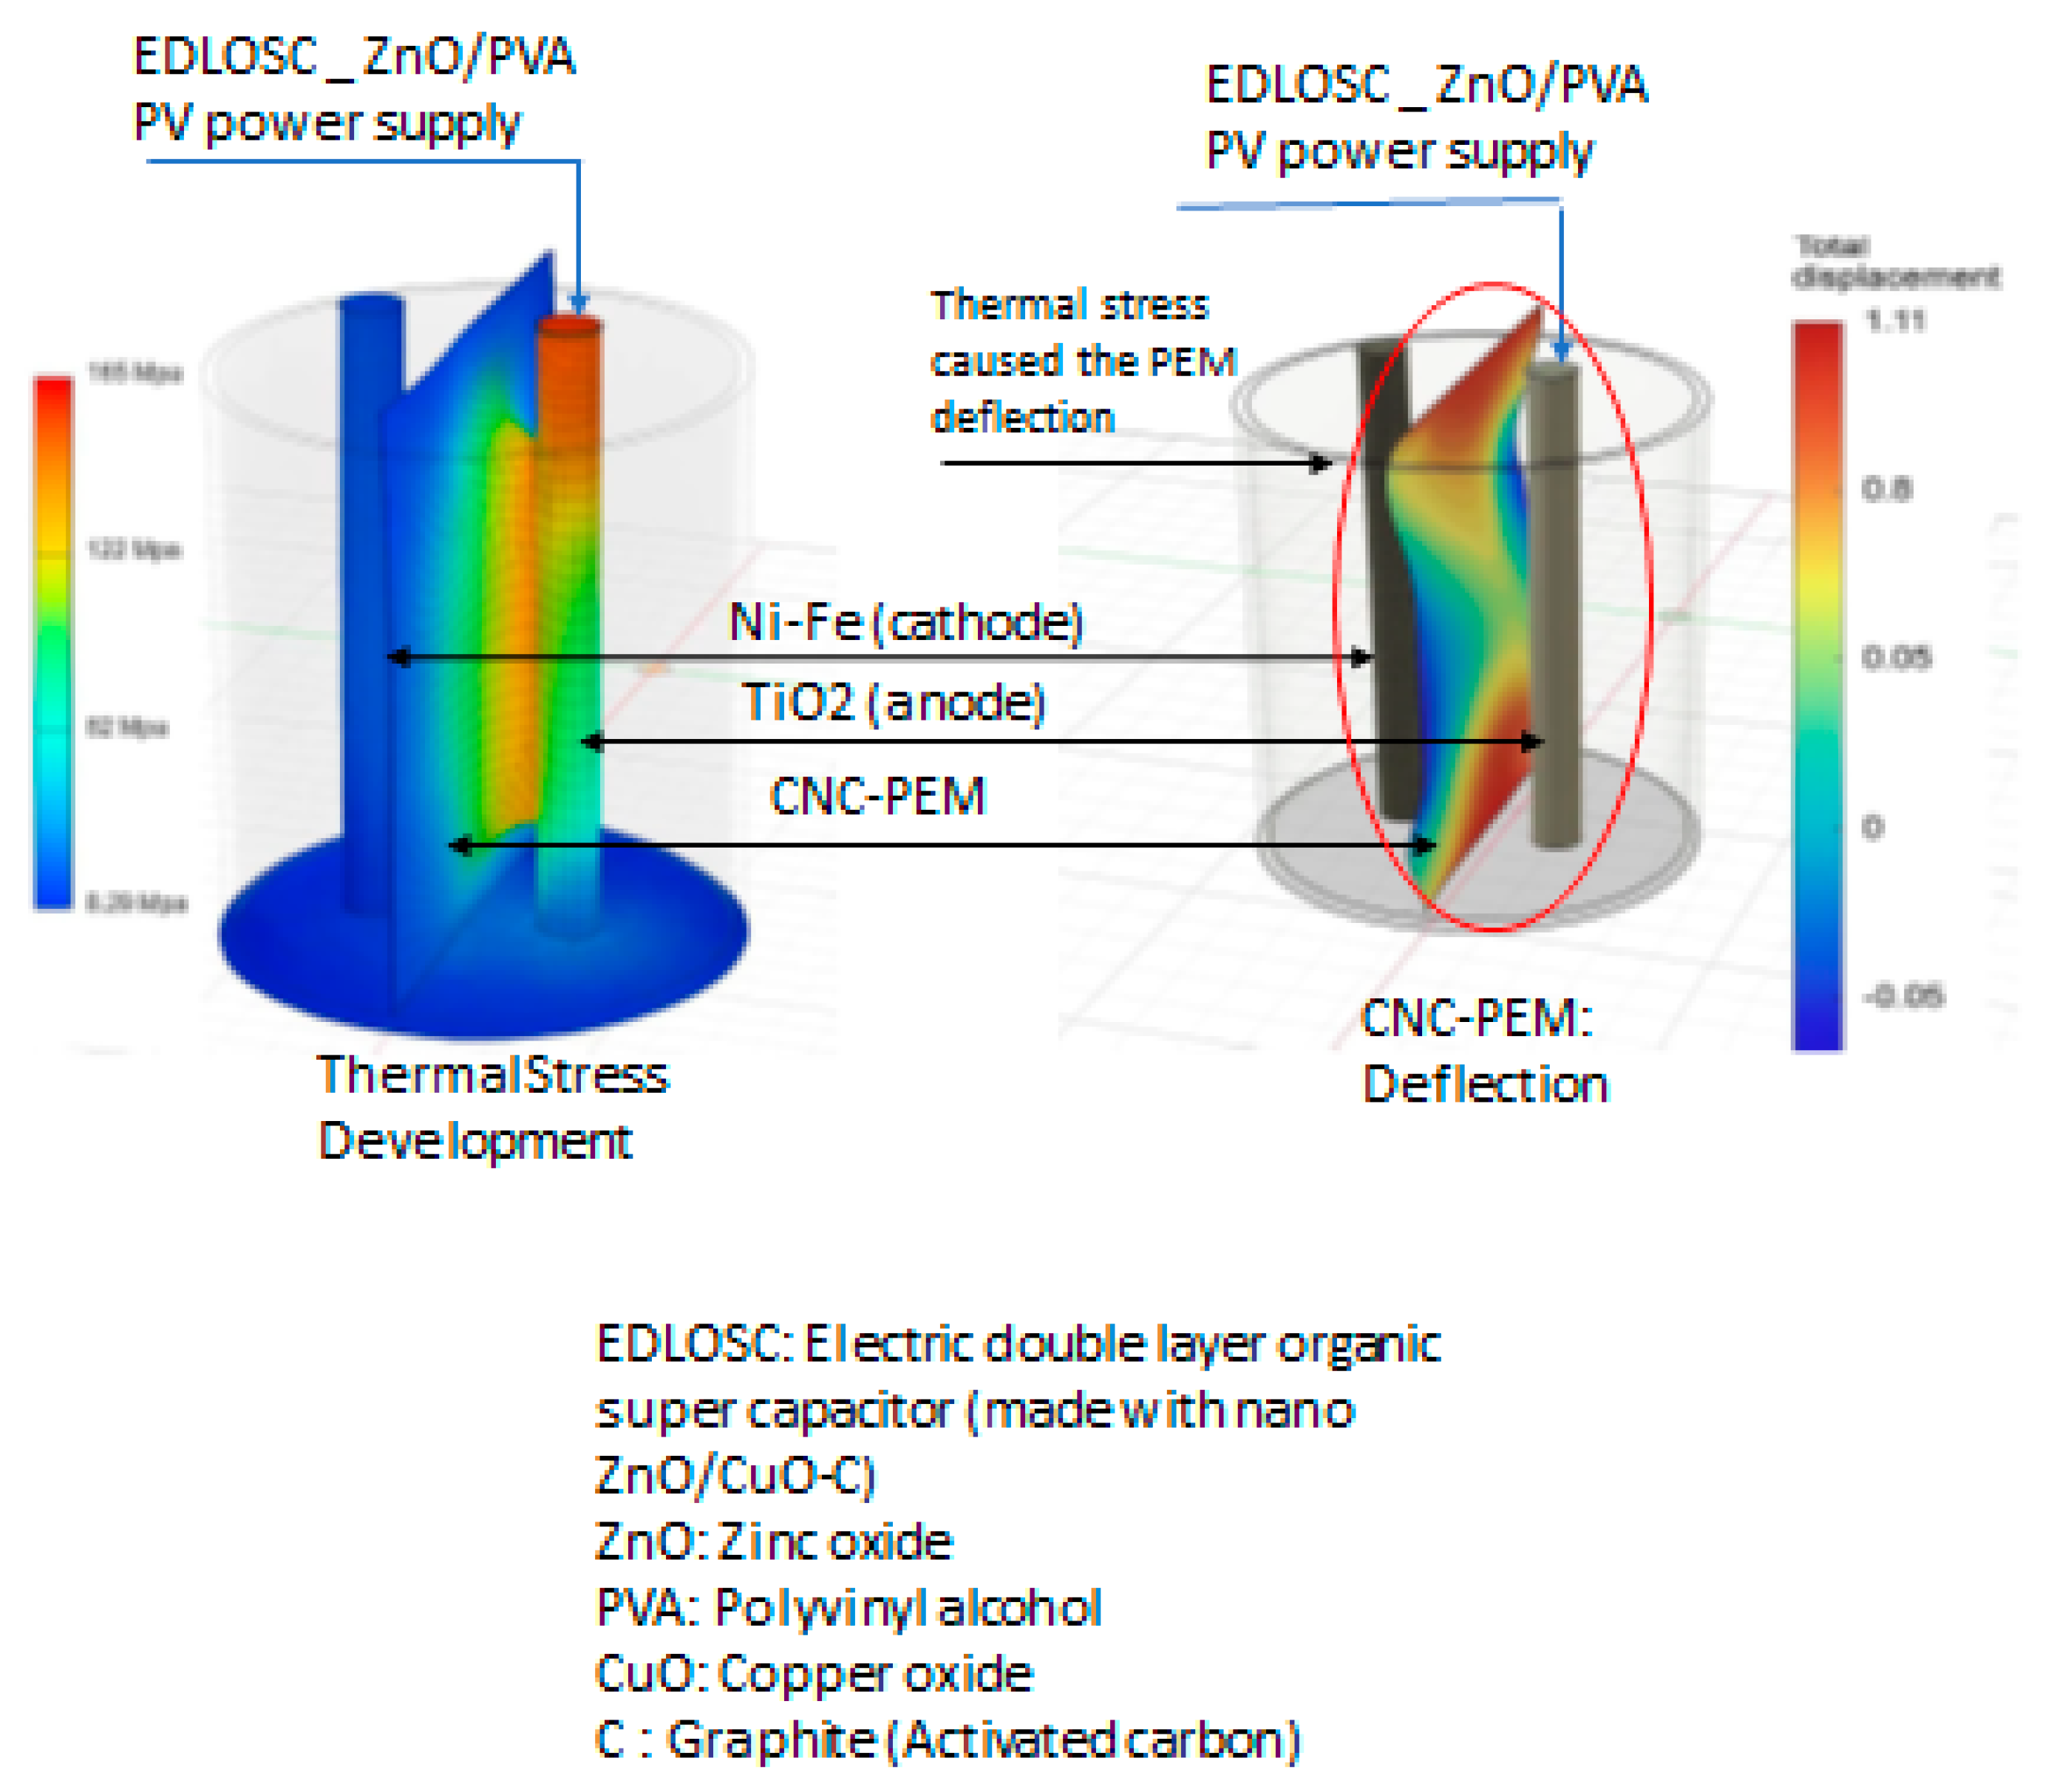
The thermal stress development at the anode (TiO2) of the TiO2-NiFeC PEM microbial electrolyzer affects the PEM, as shown in Figure 11, which decreases the efficacy of hydrogen generation by the TiO2-NiFeC PEM microbial electrolyzer. The simulation result shows that the maximum displacement of the PEM is found to be 1.1 mm. Thus, AI is required to control the power flow of EDLOSC to the ME mechanism during the operation to keep the POME temperature at 50 °C by controlling the flow of POME every 25 s. The ANFIS controller defines the AI, and research has been conducted in parallel with the ME development and demonstration.
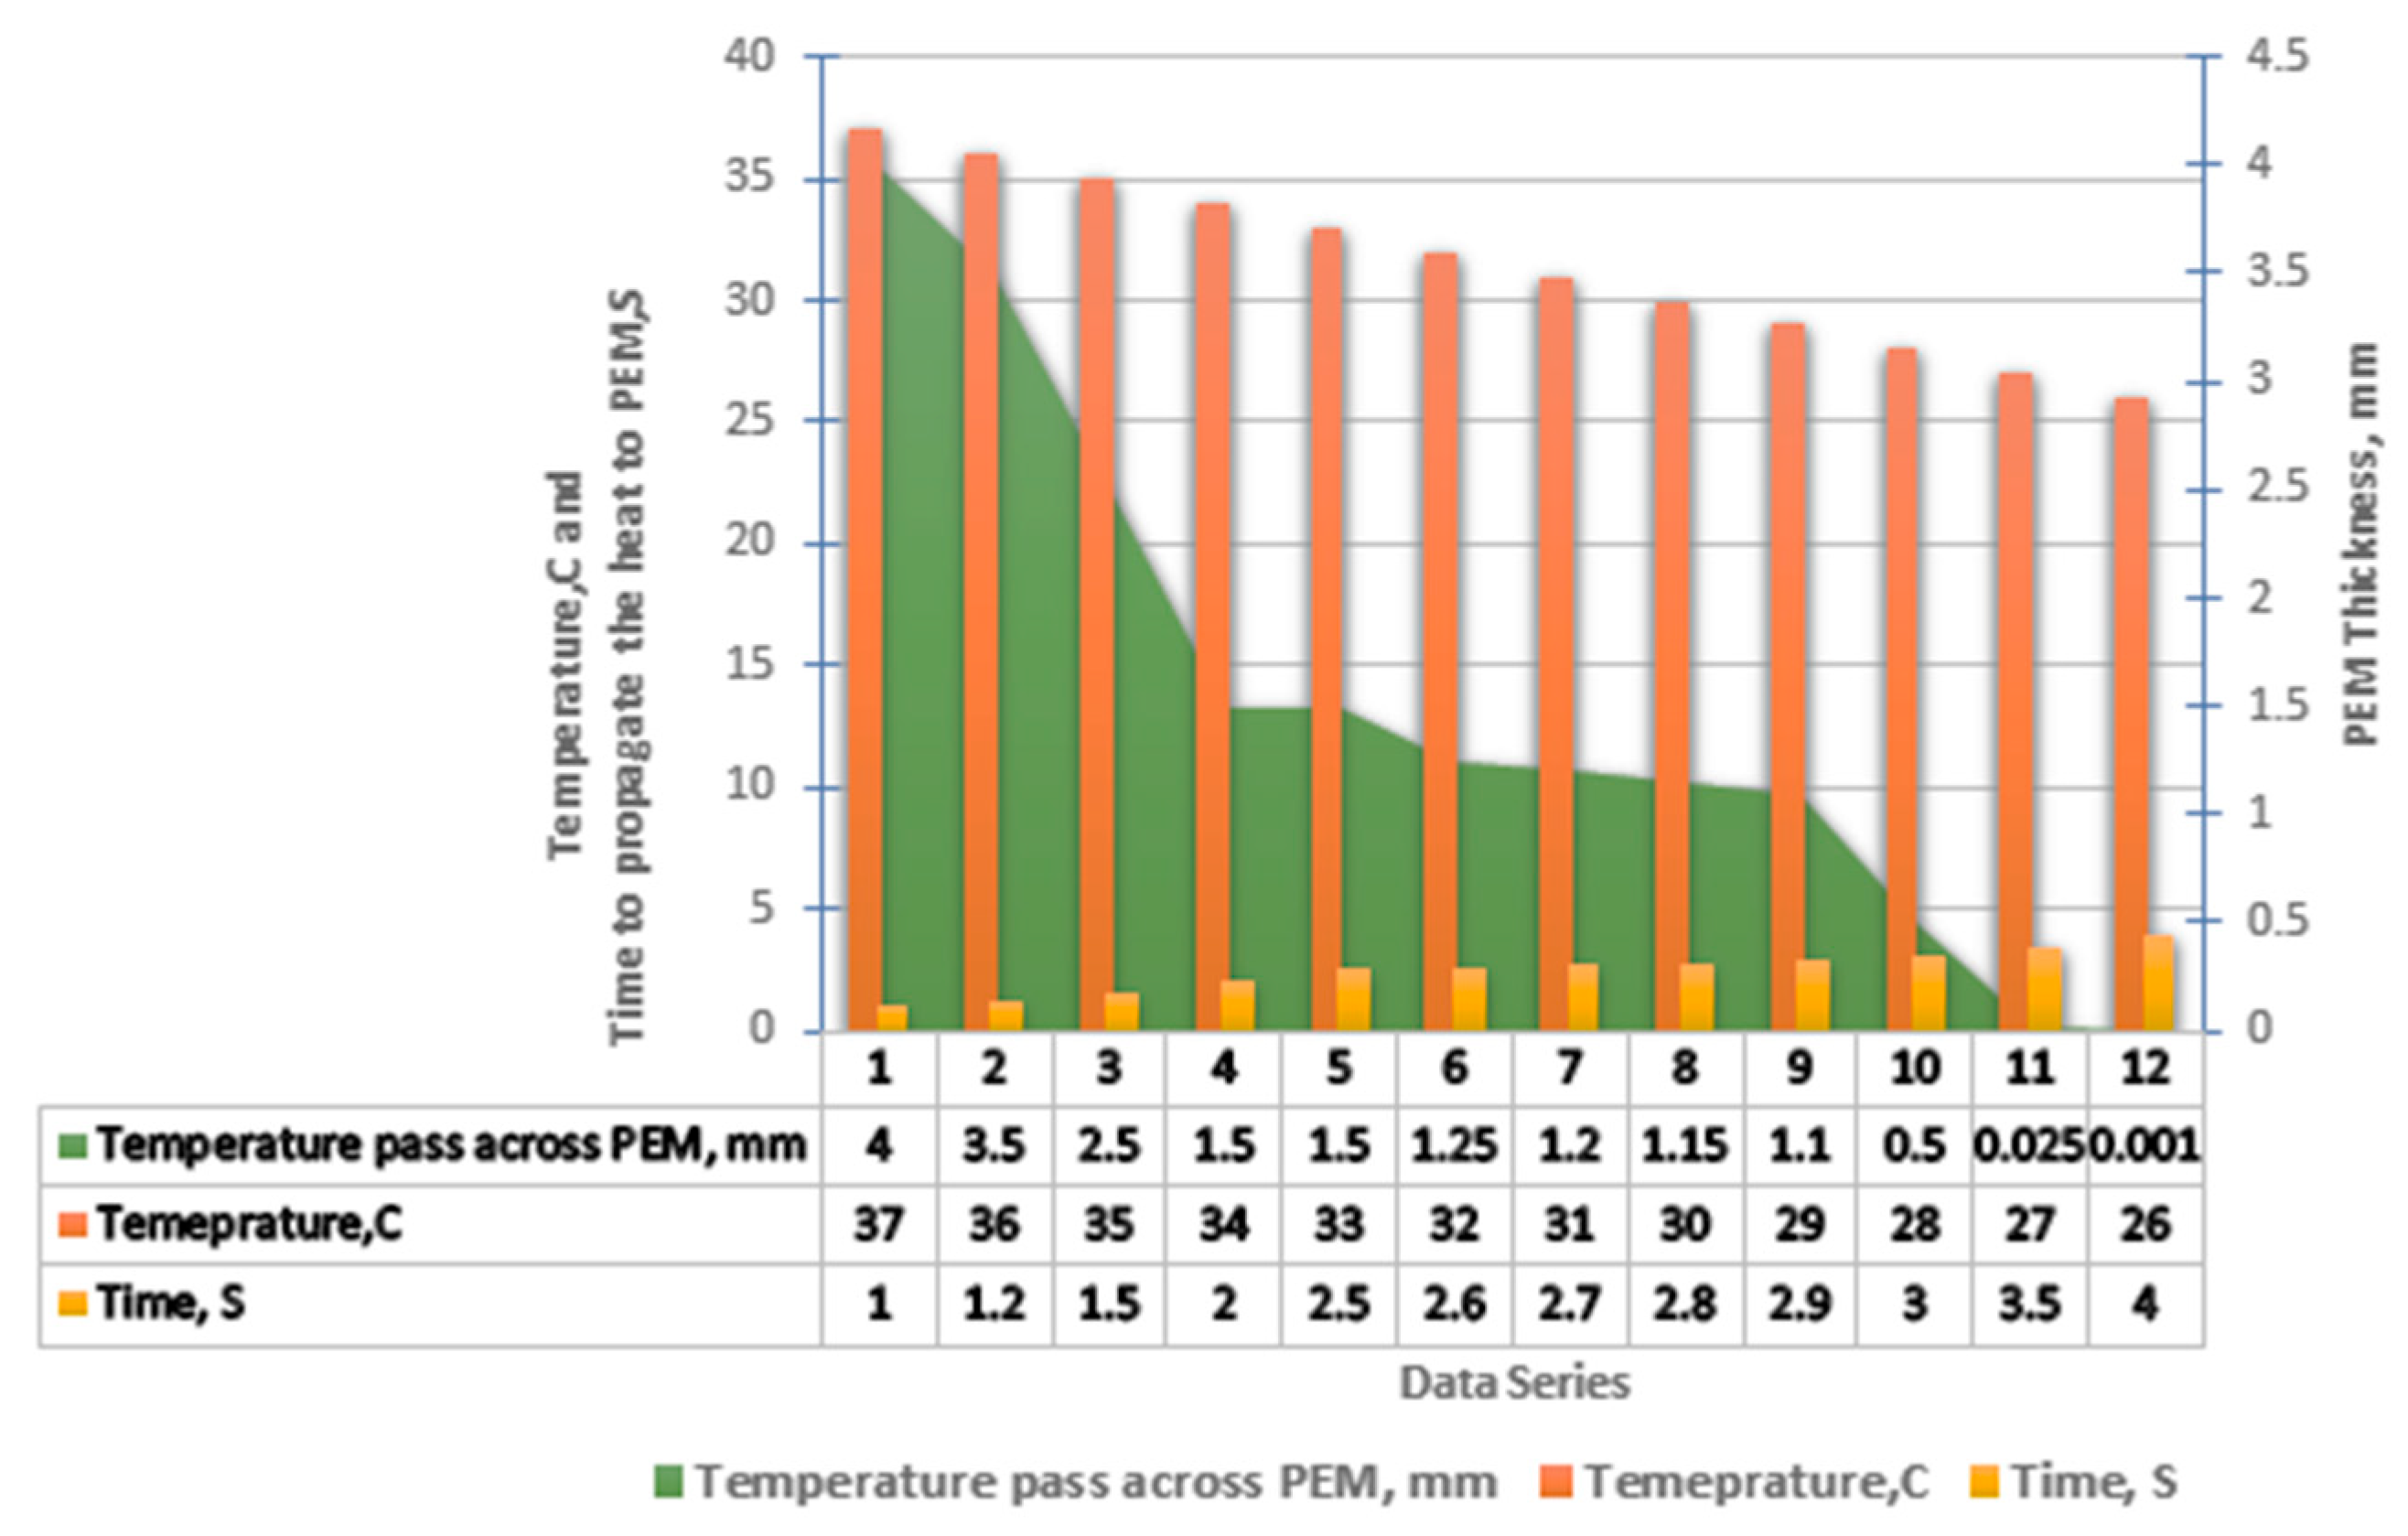
Experimental results indicate that reducing the DELOSC power supply duration accelerates POME electrolysis, achieving hydrogen production of approximately 1 g per second at 35–40 °C with a 30 A current input (Figure 12). In this setup, POME is alternately supplied to and drained from the electrolyzer in a 30 s ON/OFF cycle, with the DELOSC delivering up to 30 A under solar heating conditions of 32 °C. Finite Element Analysis (FEA) shows that applying a 30 A current to the TiO2 layer for 30 s causes significant heat accumulation, which then propagates toward the PEM. Elevated POME temperatures transfer heat rapidly to the PEM, leading to deformation or potential melting, whereas lower POME temperatures result in slower heat transfer, allowing the PEM to remain stable until new POME enters the ME. To safeguard the PEM and optimize ME performance, an AI-based control system has been implemented. This system operates using real-time thermal sensor feedback integrated within the ME. Optimal ME performance is achieved at 35 °C and a 30 A current supply, yielding up to 60% hydrogen per 30 s cycle, although the POME-based microbial electrolysis produces 7.11% H2 per gram of substrate, but it treats waste and can utilize chemical energy stored in organics, reducing external energy input.

4. Performance Investigation

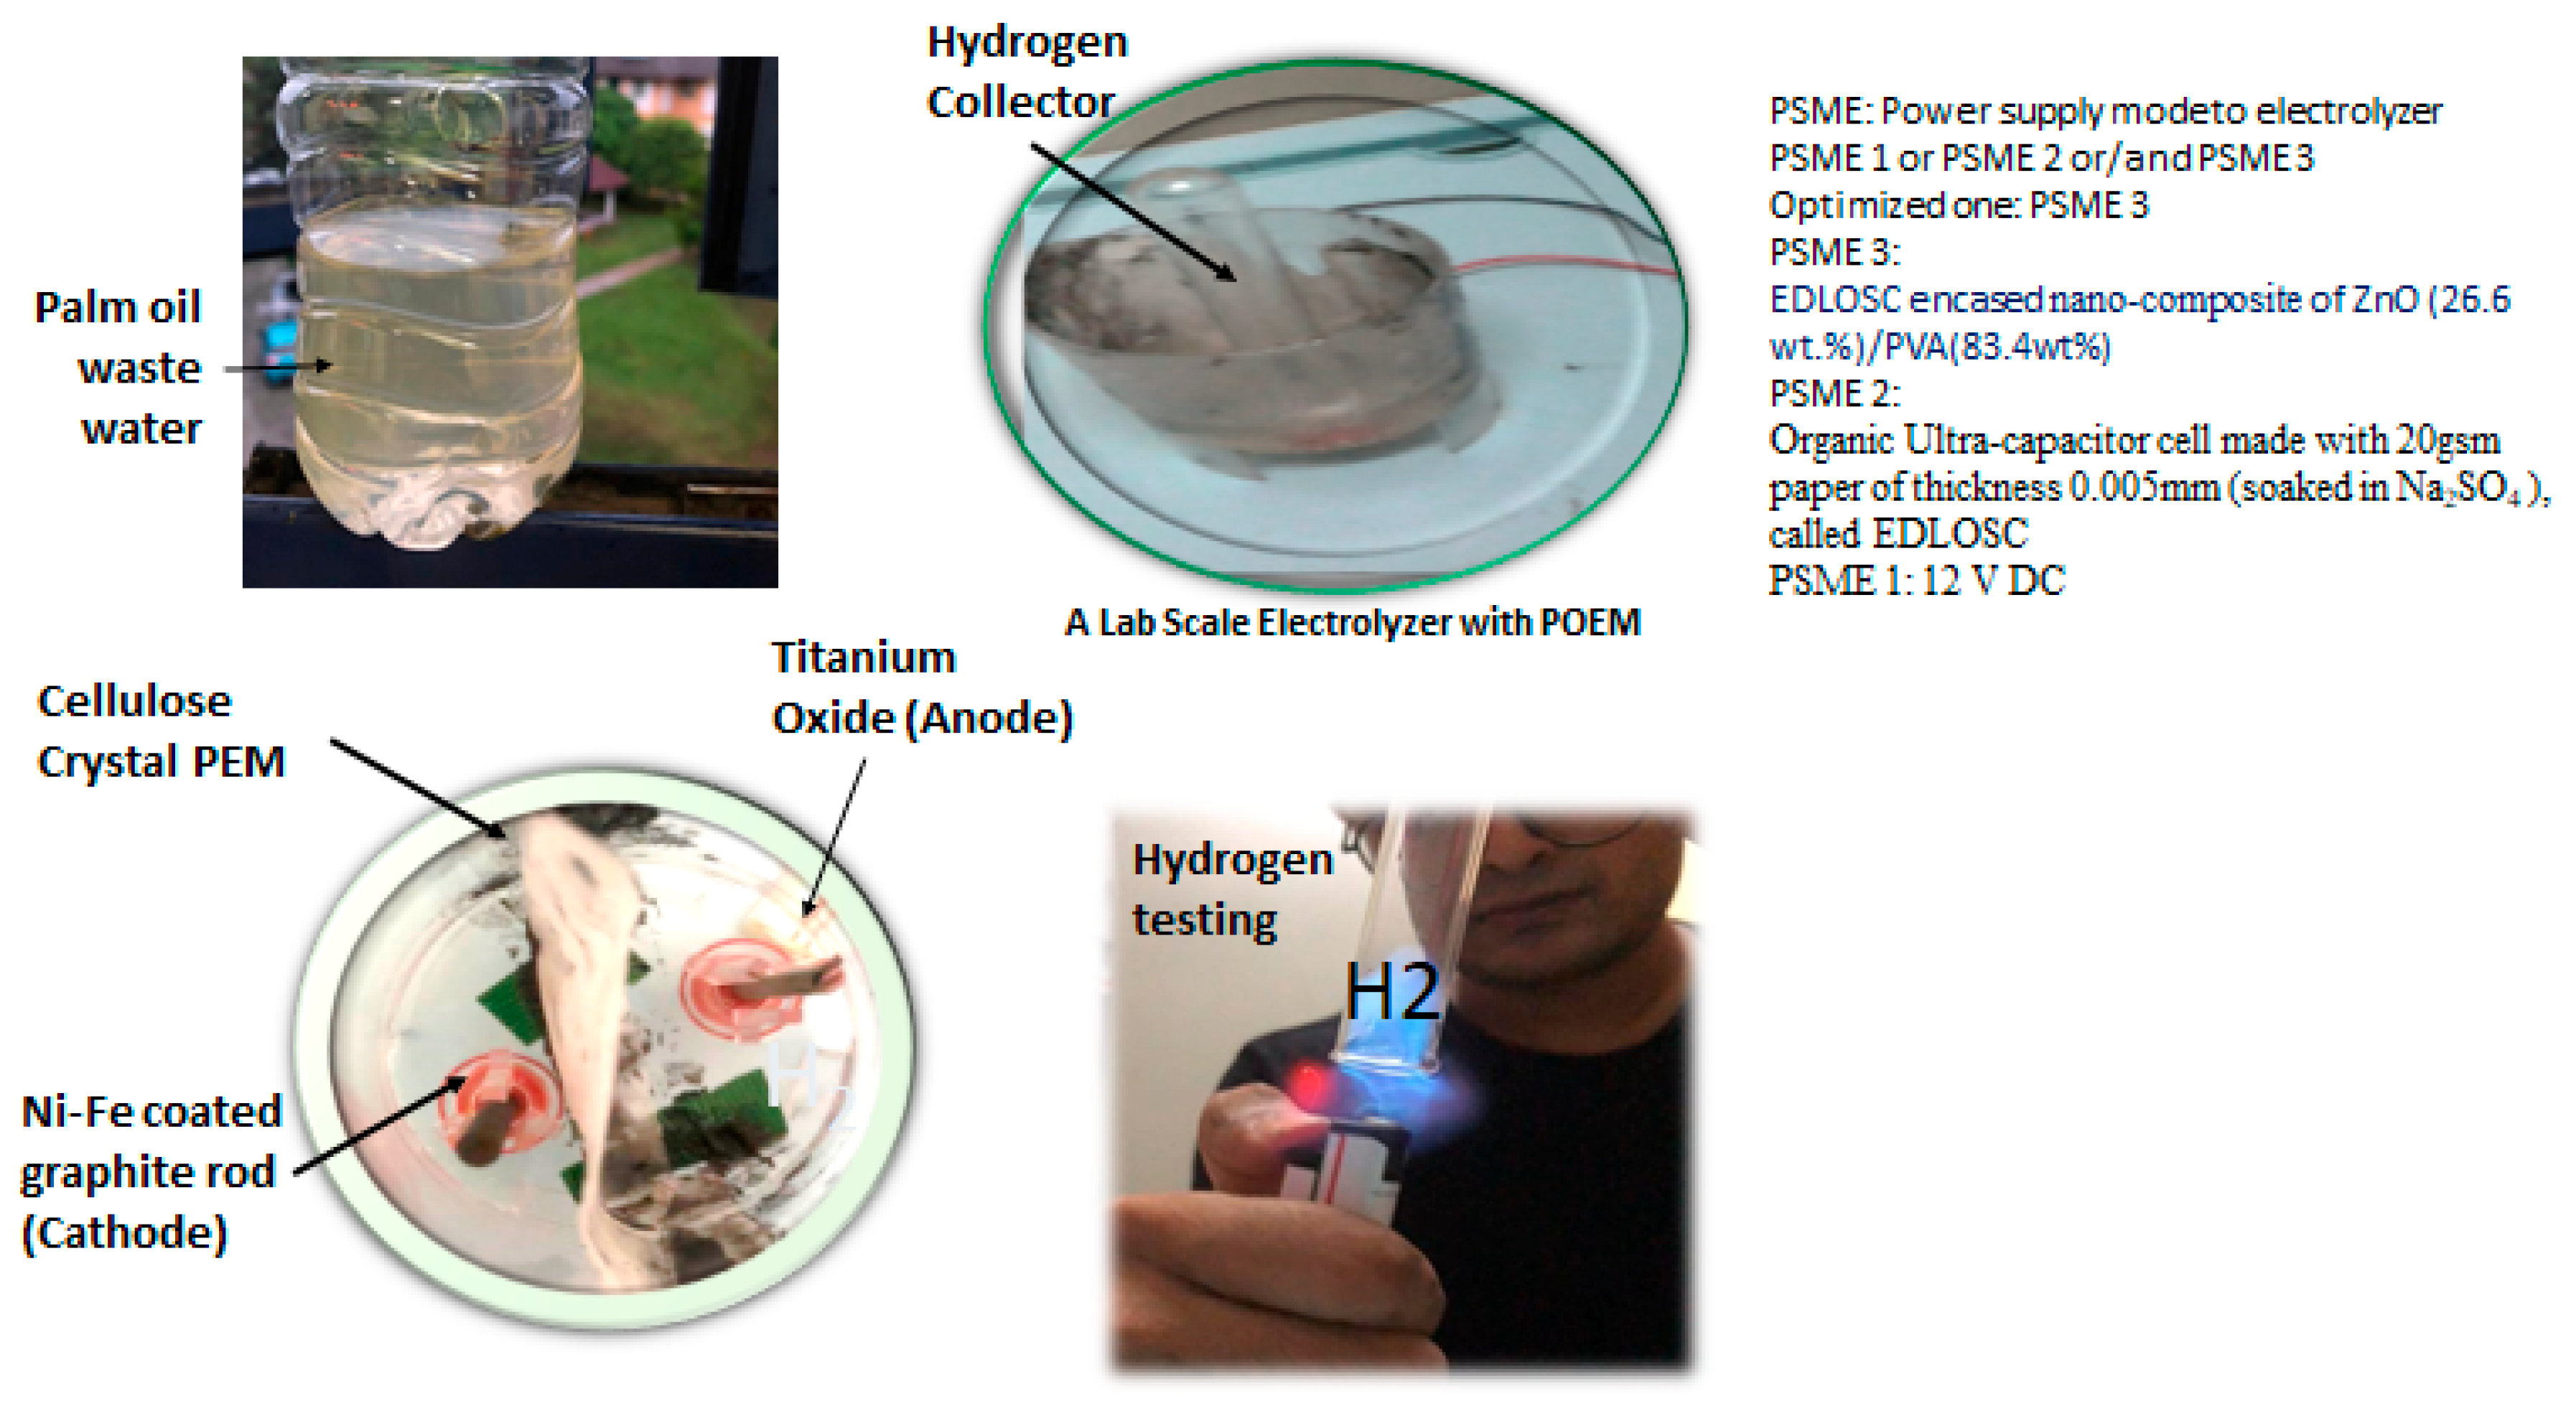
The performance of a lab-scale microbial electrolyzer (TiO2–NiFeC with CNC PEM) was evaluated for in situ hydrogen production from POME under three different power supply modes (Figure 13):
  • PSME 1: A 12 V DC lead gel battery;
  • PSME 2: A solar-dependent aqueous electric double-layer organic solar capacitor plus battery;
  • PSME 3: A solar-dependent EDLOSC integrated with ZnO/PVA plus battery.
It was found that the hydrogen yield rate reached 10.5% (wt./vol) when the electrolyzer was powered by a 12 V DC lead gel battery (PSME 1), 10.8% when powered by the EDLOSC (PSME 2), and 11.0% when powered by the EDLOSC integrated with ZnO/PVA solar film (PSME 3), as presented in Table 3, Table 4 and Table 5. The electrolyzer performance in terms of hydrogen generation using the ZnO/PVA-encased EDLOSC was 0.5% higher per mole compared to the 12 V DC supply, and 0.2% higher compared to the standalone EDLOSC.
The chemical formula of POME is C7H15O5P, and its molar mass of POME (C7H15O5P) is 210.165 g/mol, as shown in the calculation below:
  • Carbon (C): 7 atoms × 12.01 g/mol = 84.07 g/mol;
  • Hydrogen (H): 15 atoms × 1.01 g/mol = 15.15 g/mol;
  • Oxygen (O): 5 atoms × 16.00 g/mol = 80.00 g/mol;
  • Phosphorus (P): 1 atom × 30.97 g/mol = 30.97 g/mol.
The molar mass of POME (MH2) was calculated to be 210.19 g/mol, derived from the sum of its elemental components: 84.07 (C) + 15.15 (H) + 80.00 (O) + 30.97 (others) = 210.19 g/mol. Based on this composition, the hydrogen content by mass is estimated to be 7.21% and the hydrogen mass percentage in water to be 11.1%. The key difference in hydrogen product electrical energy required is as follows:
  • Water electrolysis has high theoretical H2 yield per mole of substrate but requires electrical energy input.
  • POME-based microbial electrolysis produces less H2 per gram of substrate, but it treats waste and can utilize chemical energy stored in organics, reducing external energy input.
A summarized table of hydrogen yield from electrolysis comparison between water and POME is shown in Table 6.
A mathematical equation can be modeled to estimate the hydrogen from the POME using ME electrolysis process using the EDLOSC power as follows:
m H 2 =   n H 2   M H 2
The number of moles of hydrogen produce per mole is as follows:
n H 2 = n e 2 = I     t 2   F
where I is the current supply to the ME, t is time to keep the POME supply OFF while keeping 1 L in the ME, and F is the Faraday’s constant (96,485 C/mol), where 1 C = 1 A ∗ 1 s, which can be defined as 1 A current flow to the ME in 1 s.
The current supply is controlled at a maximum of 50 A by the EDLOSC at a solar temperature of 32 °C and with a maximum time of about 30 s to turn off the POME control valve. However, it depends on the temperature of POME at ME.
A 1 L (1000 g) of POME produces moles of hydrogen,
n H 2 = n H 2   p e r   m o l     1000   g 15.15   g   o f   H 2 / m o l
The molar mass of POME (C7H15O5P) is as follows:
M H 2 = 210   g/mol
Using Equation (1), the mass of hydrogen produced by the ME from POME with a 30 A current applied for 30 s is calculated to be 1616.22 g. In this calculation, the AI-based control system is assumed to regulate the POME inflow and outflow to the ME at 30 s intervals.
However, experimental results show that the TiO2–NiFeC CNC-PEM microbial electrolyzer achieves in situ hydrogen production from POME: 3.29% above the theoretical estimate when powered by a 12 V DC battery, 3.59% higher when powered by the EDLOSC, and 3.79% higher when powered by the EDLOSC integrated with ZnO/PVA, as shown in Table 7. It is notified that the current supply to the ME was found by the battery to be a maximum of 10 A, EDLOSC plus battery without film to be about 20–30 A, and EDLOSC plus battery and with ZnO/PVA to be 20 to 35 A. These findings indicate enhanced hydrogen yield beyond the expected value based on molar mass calculations.
The in situ hydrogen yield obtained from the ME powered by the solar-dependent EDLOSC is approximately 30% lower than the theoretical prediction, primarily due to losses associated with manual hydrogen collection.

5. AI (ANFIS) Power Driven

Artificial intelligence (AI, ANFIS) control is a hybrid method that consists of two parts, which are the gradient method applied to calculate input membership function parameters and the least square method applied to calculate the parameters of the output function. The objectives of the AI in this study are as follows:
  • To control the EDLOSC power flow to the ME to protect the PEM from damage.
  • To prevent the EDLOSC from overcharging when trapping solar heat above 32 °C.
  • To optimize power supply to the ME to prevent PEM from being affected.
  • To control the POME supply to the ME based on the temperature and current supply in every 25 s, which will enhance the hydrogen generation and increase the sustainability of ME.
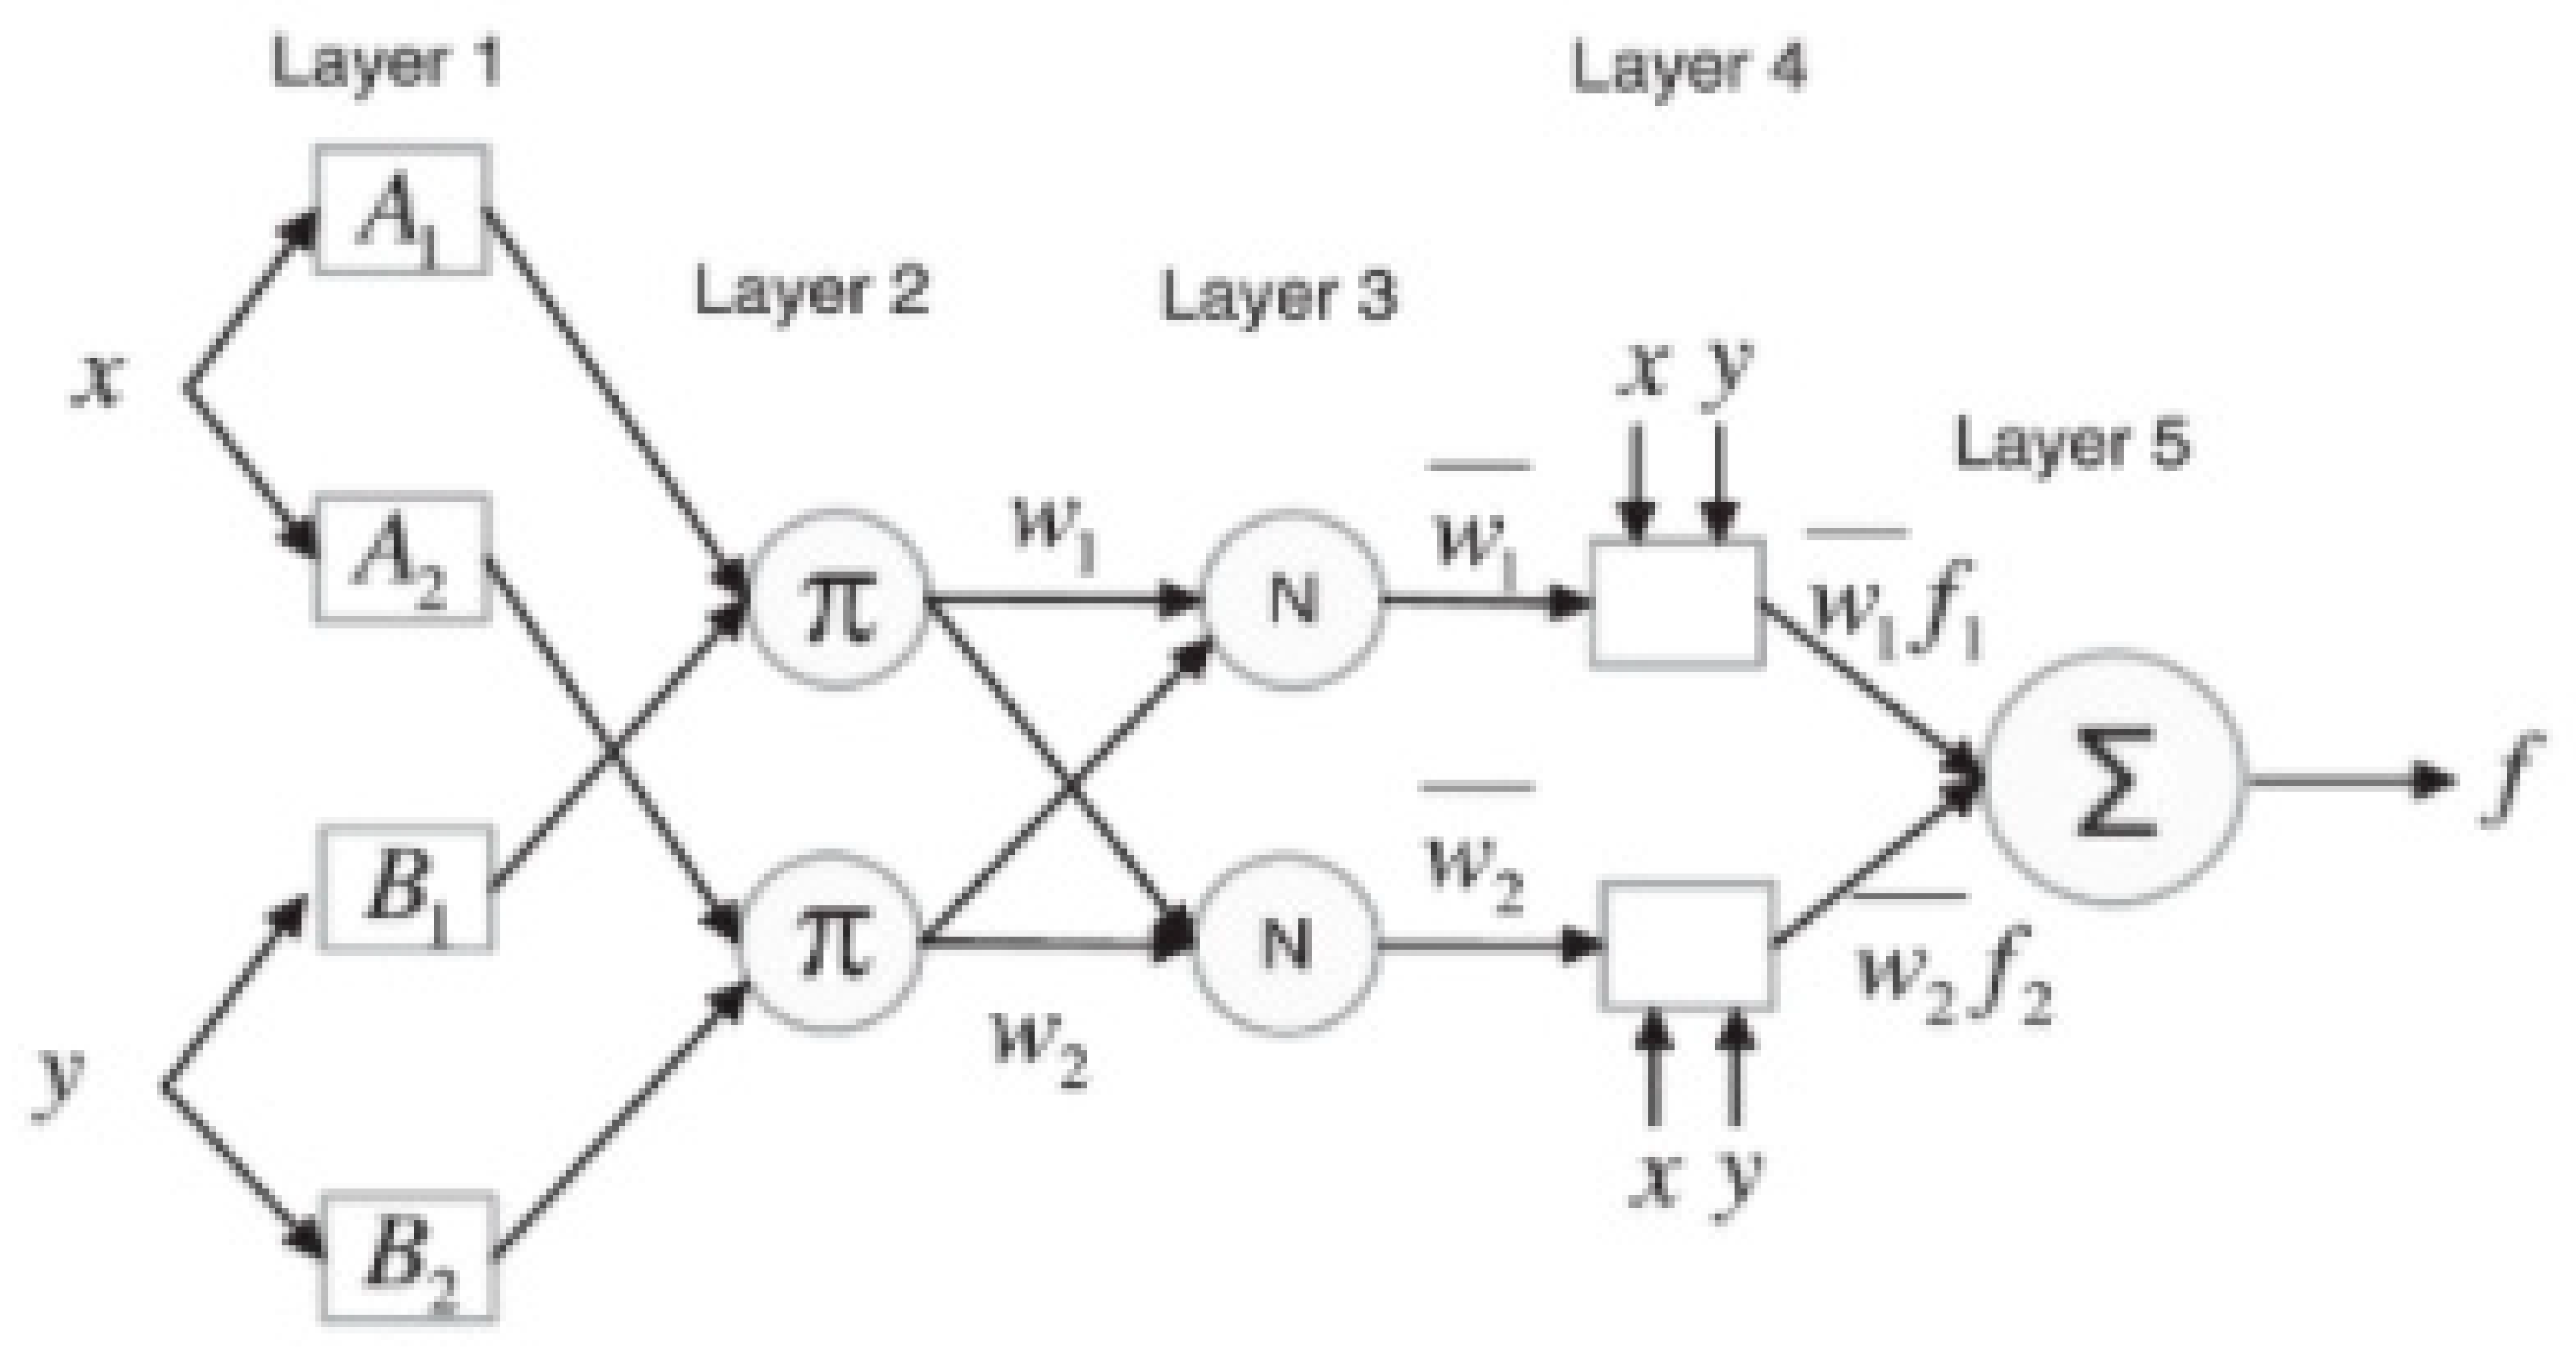
The structure of ANFIS is shown in Figure 14.
A first-order Sugeno model with two fuzzy ‘If–Then’ rules can express the ANFIS configuration with the following rules and equations:
Rule (1): IF x is a1 AND y is b1, THEN
f1 = p1x + q1y + r1
Rule (2): IF x is A2 AND y is B2, THEN
f2 = p2x + q2y + r2
where xi and yi are the inputs, ai and bi are the fuzzy sets, fi is the output specified by the fuzzy rule, and pi, qi, and ri are the design parameters that are determined during the training process.
The configuration of ANFIS is fixed with many parameters, which causes a tendency for the system to overfit the data on which it is trained, especially with a large number of training epochs. The trained FIS may not adapt effectively to other independent data sets if overfitting occurs. For an ideal situation, the efficiency of the converters is considered as 0.9. For solar power, it is represented as the following equation [37]:
Ideal Psolar = [VmaxVSeries][ImaxNparallel]
where Psolar is the power generated by the solar panel, Vmax is the maximum voltage, Nsries is the number of solar modules in series, Imax is the maximum current, and Nparallel is the number of solar modules in parallel.
The ideal power of the battery and the supercapacitor are determined by the following equations [37]:
Ideal Pbattery = Vbattery Ibattery
Ideal Psc = Vsc Isc
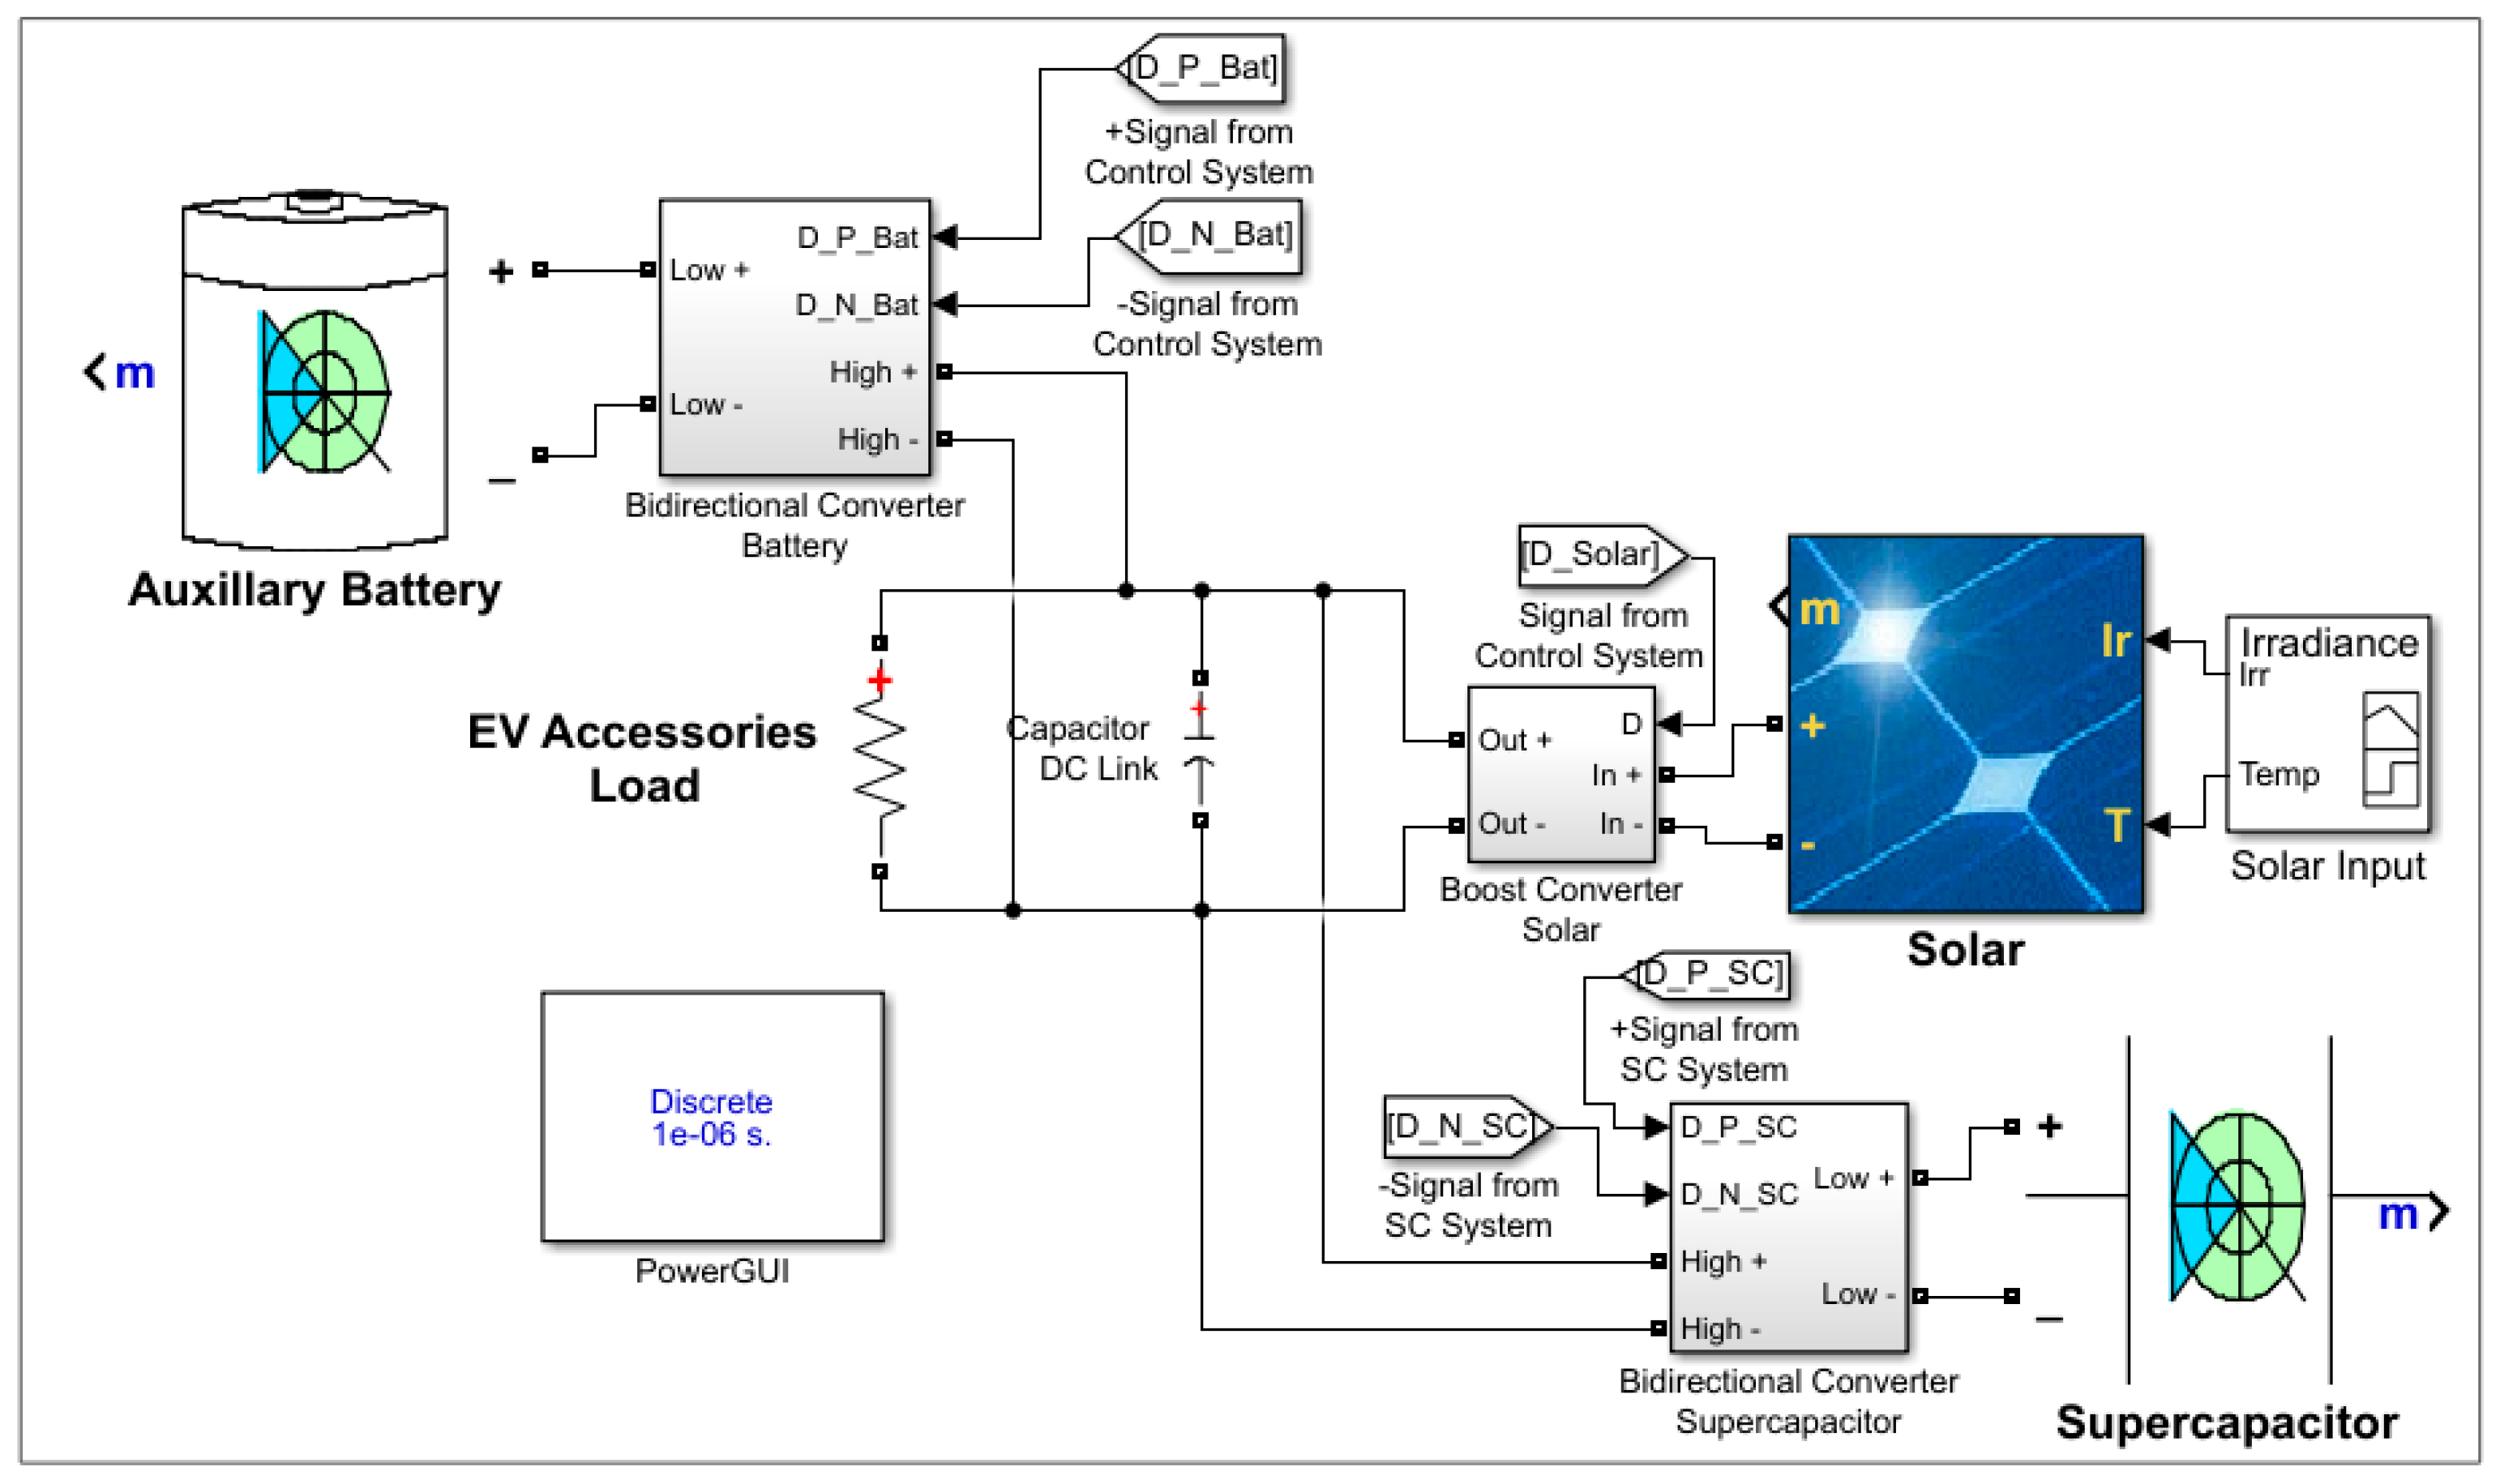
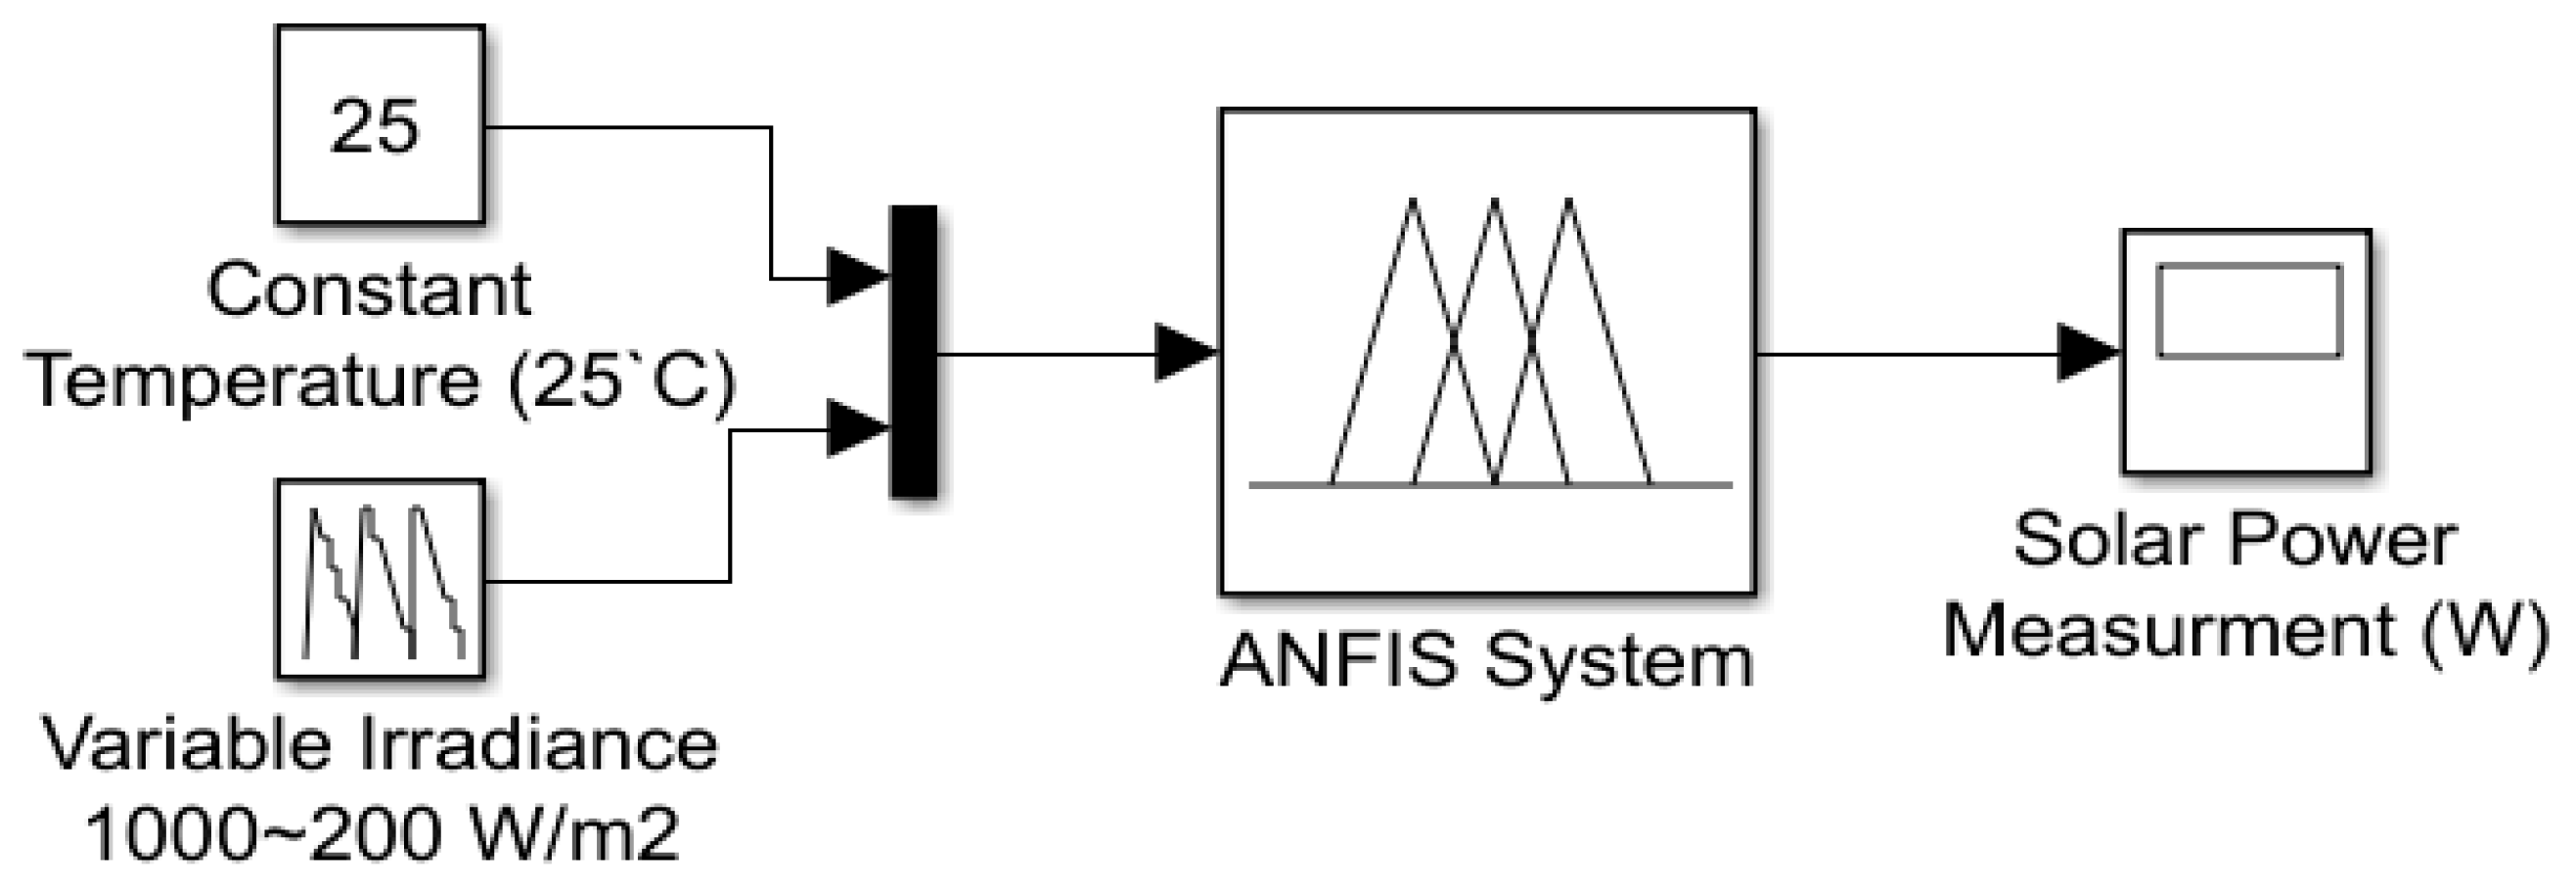
Power simulation for the EDLOSC (comprising 6 wt.% activated carbon and 30 wt.% ZnO/CuO) was conducted using a Simulink model, as illustrated in Figure 15. It is assumed that the power demands of electric vehicle (EV) subsystems such as the starting system, lighting, instrumentation, wiper motor, power window motors, and air-conditioning are supplied by the EDLOSC-integrated body panel. Solar power input is simulated as the product of the solar panel’s open-circuit voltage (VOC) and short-circuit current density (ISC). To evaluate the real-life cycle efficiency of the solar supercapacitor, variable irradiance levels ranging from 200 to 2000 W/m2 were applied at a constant temperature of 25 °C, resulting in output power ranging from 180 to 1000 W, as detailed in Table 8.
The primary objective of the EDLOSC’s power management system (PMS) is to protect the n-type (AC-ZnO) and p-type (CuO) semiconductor components from overheating caused by excessive electrochemical reactions and heat generation. To achieve this, the PMS utilizing an Adaptive Neuro-Fuzzy Inference System (ANFIS) can divert surplus power to the ground by connecting the EDLOSC to a grounding path (Table 9). This mechanism allows the EDLOSC to operate efficiently and safely as an auxiliary energy storage unit, as depicted in Figure 16.
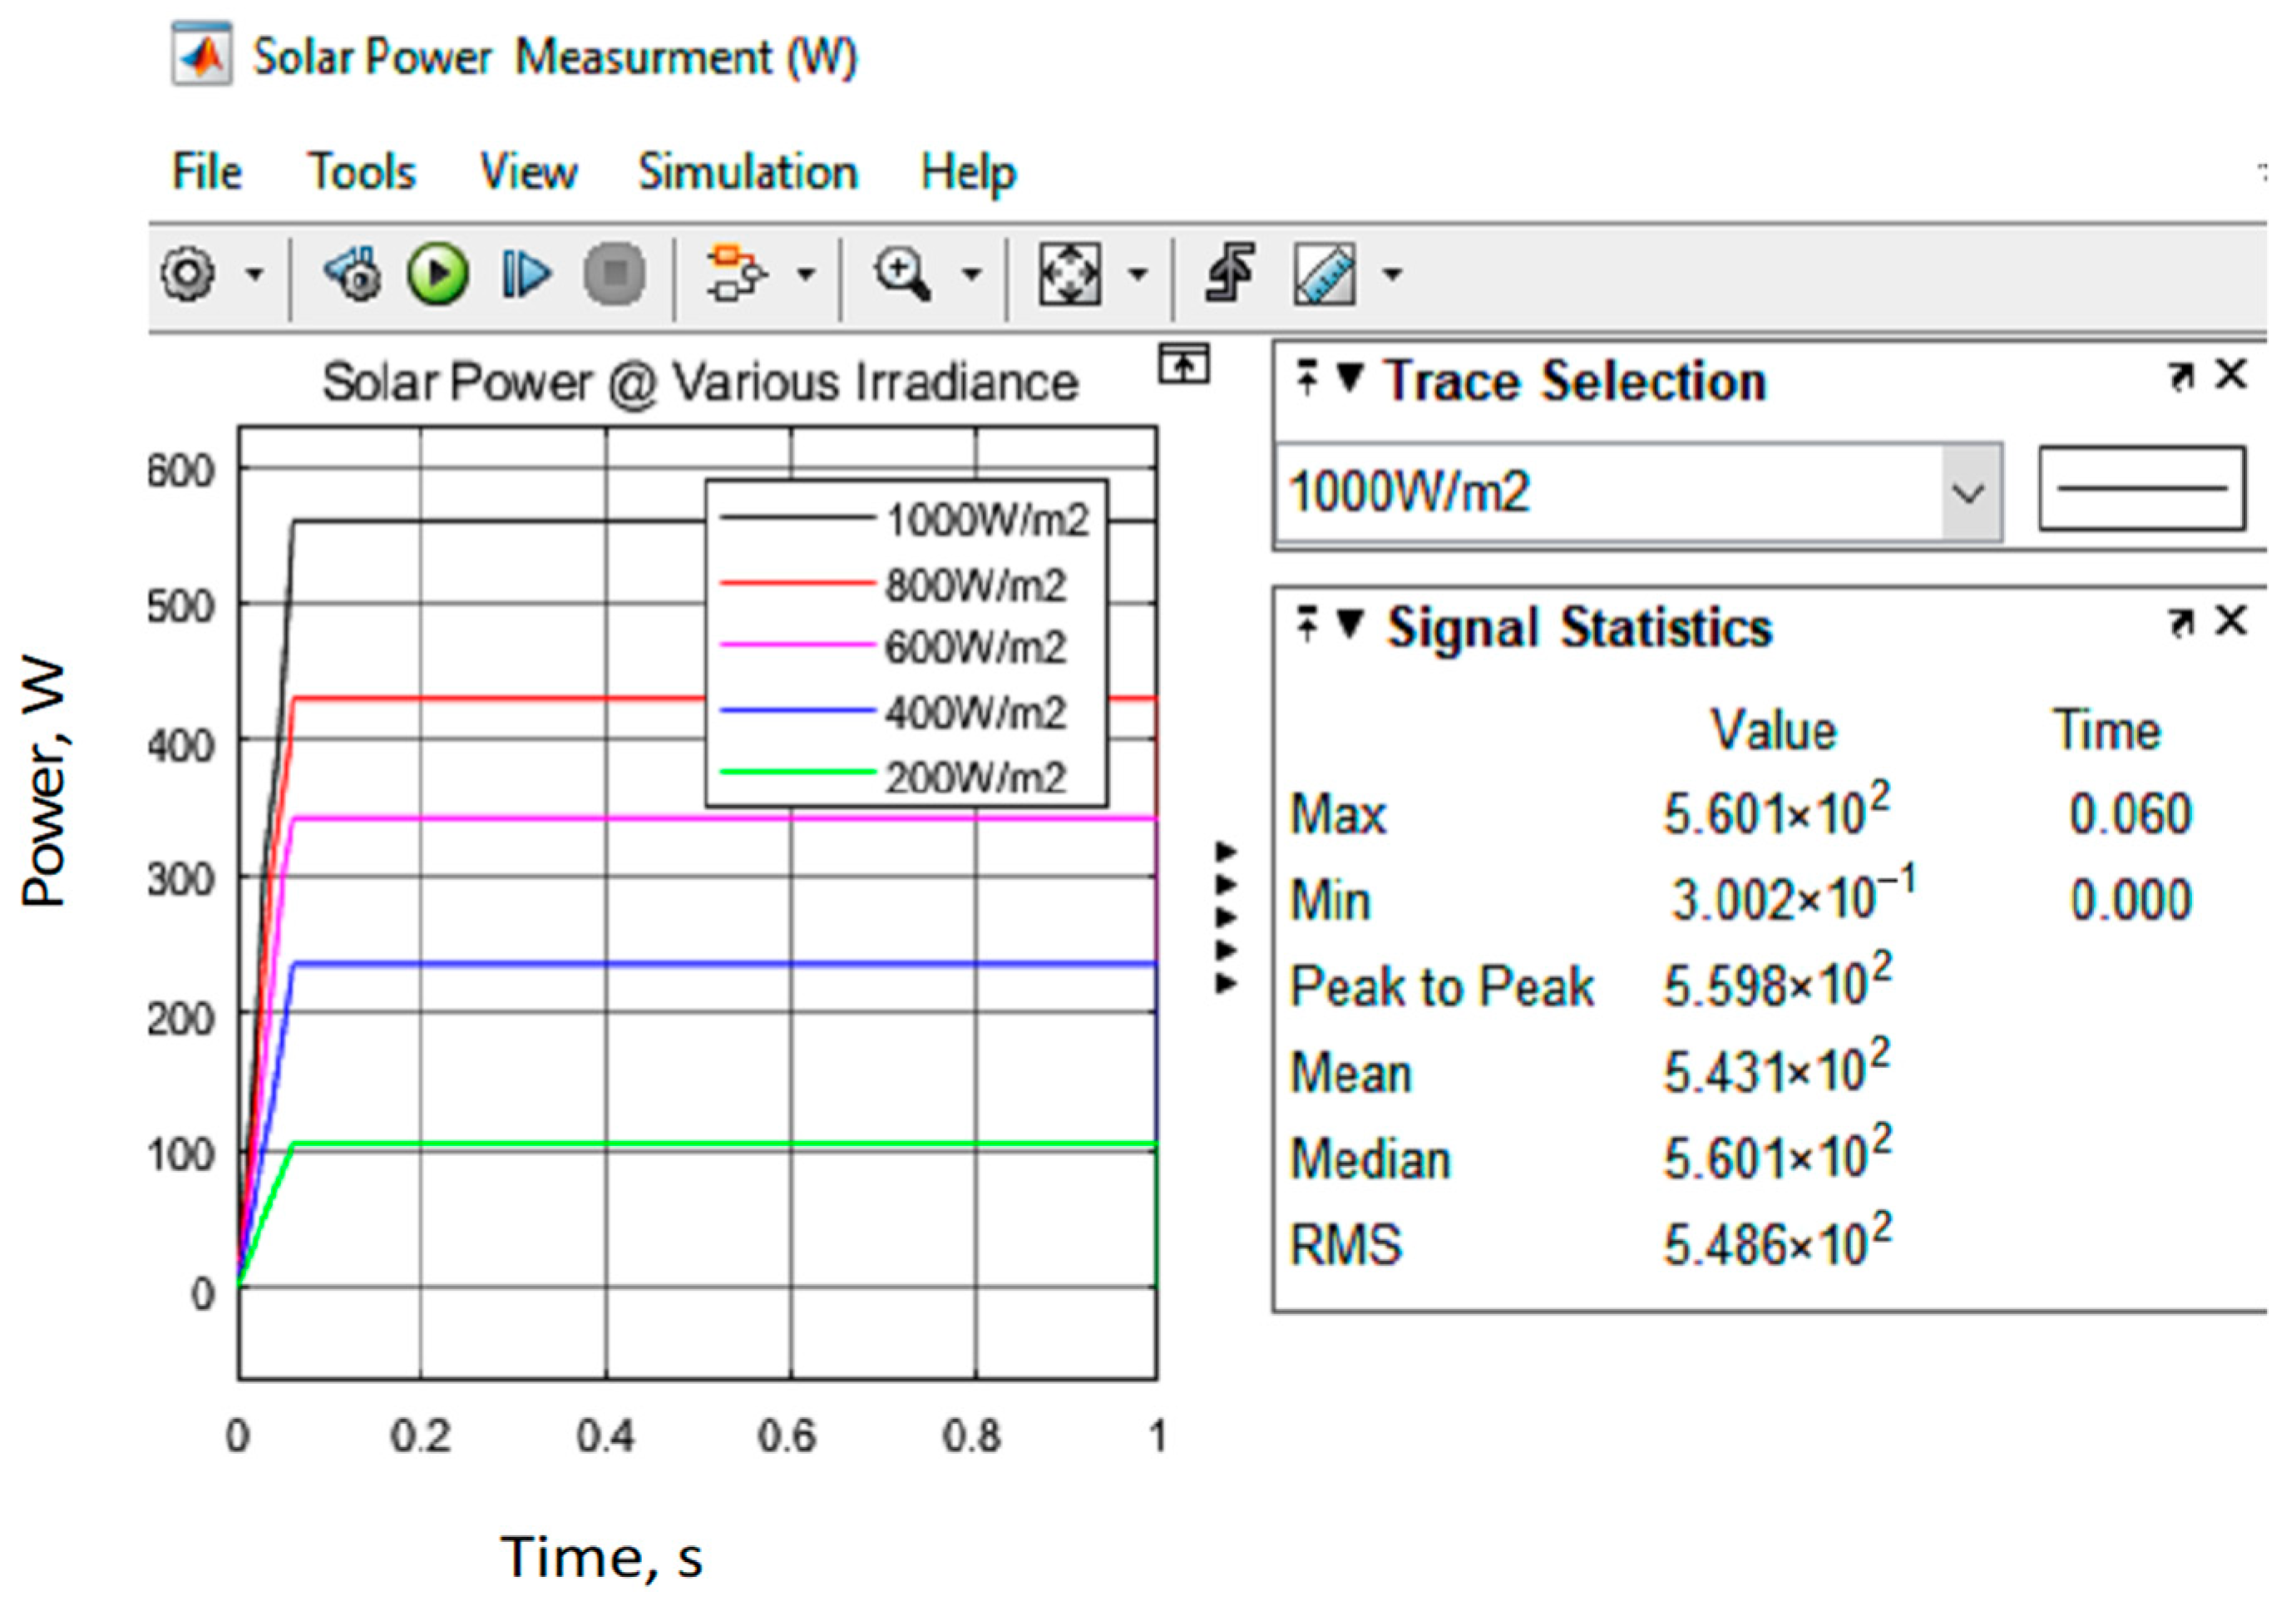
For real-life applications of the solar supercapacitor, input irradiance varies depending on the geographical location. In this simulation, the solar irradiance profile was set as follows: 1000 W/m2 for 30% of the total daytime (10 a.m.–3.30 p.m.), 600 W/m2 for 30% daytime (3.30–4.30 p.m.), 200 W/m2 for 30% daytime (4.30–6.30 p.m.), and 0 W/m2 (no sunlight) for the remaining 10% of the day as shown in Figure 17. Signal statistics from the Simulink model indicate that the mean solar power over the simulated period is 495.4 W, as shown in Figure 17 [38].
A few selected published studies were reviewed and compared with the authors’ hydrogen generation results, as presented in Table 10. The findings indicate that the authors’ experimental performance is slightly superior to that reported in previous studies. This improvement can be attributed to the ON/OFF flow of POME (palm oil mill effluent) wastewater into the microelectrolyzer (ME) system, as well as the optimized power supply to the ME electrodes, which was intelligently controlled using an AI-based system.

6. Conclusions

  • The discharging time of the organic EDLC is longer compared to its charging time, primarily due to the AC-ZnO/CuO composite being bonded with epoxy resin (ER), which influences ion mobility and charge retention.
  • The electrolyzer performance in terms of hydrogen generation using the ZnO/PVA-encased EDLOSC was 0.5% higher per mole compared to the 12 V DC supply, and 0.2% higher compared to the standalone EDLOSC.
  • The PMS utilizing an Adaptive Neuro-Fuzzy Inference System (ANFIS) can divert surplus power to the ground by connecting the EDLOSC to a grounding path, which allows the EDLOSC to operate efficiently and safely as an auxiliary energy storage unit.
  • The TiO2–NiFeC CNC-PEM microbial electrolyzer achieves higher in situ hydrogen production from POME: 3.29% above the theoretical estimate when powered by a 12 V DC battery, 3.59% higher when powered by the EDLOSC, and 3.79% higher when powered by the EDLOSC integrated with ZnO/PVA.

6.1. Indexing: In Situ Hydrogen Production

In situ hydrogen production by a TiO2–NiFeC CNC-PEM microbial electrolyzer is a key advantage of this system. In situ refers to the ability to operate the ME and its power unit anywhere, without reliance on public electrical infrastructure. The ME is fully powered by the solar-dependent EDLOSC unit, enabling independent and portable hydrogen generation.

6.2. Challenges

  • The development of the TiO2-NiFeC-PEM microbial electrolyzer integrated with an organic solar energy capacitor involves high material, fabrication, and system integration costs. The complexity of combining microbial, electrochemical, and photovoltaic components significantly increases research and development expenses, necessitating substantial financial support such as grants from the Department of Energy (DOE) to advance the technology toward commercialization.
  • Scale-up of TiO2-NiFeC-PEM microbial electrolyzer cells (MECs), volumetric current density, and hydrogen production rates decline significantly compared to lab-scale performance.
  • Operating at excessive current densities can generate localized thermal stress within the proton exchange membrane (PEM), accelerating its mechanical and chemical degradation. This deterioration adversely affects ionic conductivity and may ultimately compromise the electrolyzer’s hydrogen production performance.
  • Integration of the microbial elements with electrochemical elements including the organic solar energy capacitor brings additional material compatibility, which complicates electrode design.
  • The in situ hydrogen yield obtained from the ME powered by the solar-dependent EDLOSC is approximately 30% lower than the theoretical prediction, primarily due to losses associated with manual hydrogen collection.

6.3. Novelties

Novelties of the study that has been presented in this manuscript:
  • EDLOSC (ZnO/CuO RP with encased solar film made with ZnO/PVA) to provide the power supply to the ME in situ H2 production.
  • AI (ANFIS) controls and optimizes the power supply to the ME to protect the PEM from damage at higher solar heat.
  • AI protects the EDLOSC from damage from overcharging at higher power at higher solar trapping heats above 32 °C.
  • Control the POME flow to the ME based on the temperature and current supply.

Author Contributions

A.R.M.: Conceptualization, methodology development, product development, formal analysis, supervision; M.Q.: Funding acquisition; H.L.: Conduct experiment and collection POME; R.A.: Data analysis; M.G.: Revising and editing; S.I.: Revising and editing. All authors have read and agreed to the published version of the manuscript.

Funding

There is no funding available.

Data Availability Statement

The original contributions presented in this study are included in the article. Further inquiries can be directed to the corresponding author.

Acknowledgments

The authors express their gratitude to Eastern Michigan University in Ypsilanti, Michigan, USA, for enabling them to continue their research, and to the Research Management System at International Islamic University for funding this project. The laboratory technician’s assistance in the development of this project is also appreciated by the authors. The intelligent online tool ChatGPT has been partially utilized to enhance the language quality during the development of this article.

Conflicts of Interest

There is no conflict of interest of any authors and the Eastern Michigan University, Michigan, USA, and the International Islamic University to publish any of the materials with the Journal of Nanoenergy Advances, MDPI.

References

  1. Mussio, I.; Chilton, S.; Duxbury, D.; Nielsen, J.S. A risk–risk trade-off assessment of climate-induced mortality risk changes. Risk Anal. 2024, 44, 536–552. [Google Scholar] [CrossRef]
  2. Lopez, A.; Zuckerman, G.R.; Pinchuk, P.; Gleason, M.; Rivers, M.; Roberts, O.; Williams, T.; Heimiller, D.; Thomson, S.-M.; Mai, T.; et al. Renewable Energy Technical Potential and Supply Curves for the Contiguous United States: 2024 Edition; NREL Technical Report NREL/TP-6A20-91900; National Renewable Energy Laboratory: Golden, CO, USA, 2025. [CrossRef]
  3. Arisht, S.N.; Mahmod, S.S.; Abdul, P.M.; Indera, A.A.; Lay, C.H.; Silvanamy, H.; Sittijunda, S.; Jashim, J.M. Enhancing biohydrogen gas production in anaerobic system gas: Comparative chemical pre-treatment on palm oil mill effluent (POME). J. Environ. Manag. 2022, 321, 115892. [Google Scholar] [CrossRef]
  4. AlNouss, A.; McKay, G.; Al-Ansari, T. Enhancing waste to hydrogen production through biomass feedstock blending: A techno-economic-environmental evaluation. Appl. Energy 2020, 266, 114885. [Google Scholar] [CrossRef]
  5. Dawood, F.; Anda, M.; Shafiullah, G.M. Hydrogen production for energy: An overview. Int. J. Hydrogen Energy 2020, 45, 3847–3869. [Google Scholar] [CrossRef]
  6. Satyapal, S. Clean Hydrogen and Environmental Justice. U.S. Department of Energy—Hydrogen and Fuel Cell Technologies Office, 2024. [Online]. Available online: https://www.energy.gov/eere/fuelcells/clean-hydrogen-and-environmentaljustice (accessed on 23 November 2023).
  7. U.S. Congress. Infrastructure Investment and Jobs Act, Public Law 117-58, §40314, 135 Stat. 429, 15 November 2021. [Online]. Available online: https://www.congress.gov/117/plaws/publ58/PLAW-117publ58.pdf (accessed on 23 November 2023).
  8. Idaho National Laboratory (INL). Hydrogen—Integrated Energy. 2024. [Online]. Available online: https://inl.gov/integrated-energy/hydrogen/ (accessed on 23 November 2023).
  9. Martin, P. What is good hydrogen policy? The U.S. clean hydrogen tax credits. Hydrogen Science Coalition, 17 November 2024. [Online]. Available online: https://h2sciencecoalition.com/blog/good-hydrogen-policy-us-clean-hydrogen-tax-credits/ (accessed on 17 November 2024).
  10. Seifert, K.; Waligorska, M.; Laniecki, M. Brewery wastewaters in photobiological hydrogen generation in presence of Rhodobacter sphaeroides O.U. 001. Int. J. Hydrogen Energy 2010, 35, 4085–4091. [Google Scholar] [CrossRef]
  11. Sagir, E.; Ozgur, E.; Gunduz, U.; Eroglu, I.; Yucel, M. Single-stage photofermentative biohydrogen production from sugar beet molasses by different purple non-sulfur bacteria. Bioprocess Biosyst. Eng. 2017, 40, 1589–1601. [Google Scholar] [CrossRef]
  12. Basak, N.; Jana, A.K.; Das, D.; Saikia, D. Photofermentative molecular biohydrogen production by purple-non-sulfur (PNS) bacteria in various modes: The present progress and future perspective. Int. J. Hydrogen Energy 2014, 39, 6853–6871. [Google Scholar] [CrossRef]
  13. Lu, C.; Zhang, Z.; Ge, X.; Wang, Y.; Zhou, X.; You, X.; Liu, H.; Zhang, Q. Bio-hydrogen production from apple waste by photosynthetic bacteria HAU-M1. Int. J. Hydrogen Energy 2016, 41, 13399–13407. [Google Scholar] [CrossRef]
  14. Tian, H.; Li, J.; Yan, M.; Tong, Y.W.; Wang, C.W.; Wang, X. Organic waste to biohydrogen: A critical review from technological development and environmental impact analysis perspective. Appl. Energy 2019, 256, 113961. [Google Scholar] [CrossRef]
  15. Nakada, E.; Asada, Y.; Arai, T.; Miyake, J. Light penetration into cell suspensions of photosynthetic bacteria and relation to hydrogen production. J. Ferment. Bioeng. 1995, 80, 53–57. [Google Scholar] [CrossRef]
  16. Dutta, S. A review on production, storage of hydrogen and its utilization as an energy resource. J. Ind. Eng. Chem. 2014, 20, 1148–1156. [Google Scholar] [CrossRef]
  17. Ishaq, H.; Dincer, I.; Crawford, C. A review on hydrogen production and utilization: Challenges and opportunities. Int. J. Hydrogen Energy 2022, 47, 26238–26264. [Google Scholar] [CrossRef]
  18. Zhang, Q.; Wang, Y.; Zhang, Z.; Lee, D.-J.; Zhou, X.; Jing, Y.; Ge, X.; Jiang, D.; Hu, J.; He, C. Photo-fermentative hydrogen production from crop residue: A mini review. Bioresour. Technol. 2017, 229, 222–230. [Google Scholar] [CrossRef] [PubMed]
  19. Abreu, A.A.; Tavares, F.; Alves, M.M.; Cavaleiro, A.J.; Pereira, M.A. Garden and food waste co-fermentation for biohydrogen and biomethane production in a two-step hyperthermophilic–mesophilic process. Bioresour. Technol. 2019, 278, 180–186. [Google Scholar] [CrossRef]
  20. Shi, X.; Kim, D.H.; Shin, H.S.; Jung, K.W. Effect of temperature on continuous fermentative hydrogen production from Laminaria japonica by anaerobic mixed cultures. Bioresour. Technol. 2013, 144, 225–231. [Google Scholar] [CrossRef] [PubMed]
  21. Ismail, S.; Nasr, M.; Abdelrazek, E.; Awad, H.M.; Zhaof, S.; Meng, F.; Tawfik, A. Techno-economic feasibility of energy-saving self-aerated sponge tower combined with up-flow anaerobic sludge blanket reactor for treatment of hazardous landfill leachate. J. Water Process Eng. 2020, 37, 101415. [Google Scholar] [CrossRef]
  22. Abdullahi, A.; Elreedy, A.; Fujii, M.; Ibrahim, M.G.; Tawfik, A. Robustness of anaerobes exposed to cyanuric acid contaminated wastewater and achieving efficient removal via optimized co-digestion scheme. J. Adv. Res. 2022, 24, 211–222. [Google Scholar] [CrossRef]
  23. Poudel, M.B.; Logeshwaran, N.; Prabhakaran, S.; Kim, A.R.; Kim, D.H.; Yoo, D.J. Low-cost hydrogen production from alkaline/seawater over a single-step synthesis of Mo3Se4–NiSe core–shell nanowire arrays. Adv. Mater. 2024, 36, 2305813. [Google Scholar] [CrossRef]
  24. Fede, G.; Collina, G.; Tugnoli, A.; Bucelli, M.; Daniel, F.; Silva, F.; Sgarbossa, F. Hydrogen supply design for the decarbonization of energy-intensive industries addressing cost, inherent safety and environmental performance. Int. J. Hydrogen Energy 2025, 175, 151373. [Google Scholar] [CrossRef]
  25. Khan, S.; Rahman, A. The impact of ZnO/PVA solar film on the enhancement of organic solar panel efficiency. Mater. Res. Express 2021, 8, 1–12. [Google Scholar]
  26. International Energy Agency. Global Hydrogen Review 2021; OECD Publishing: Paris, France, 2021. [Google Scholar]
  27. Iro, Z.S.; Subramani, C.; Dash, S.S. A brief review on electrode materials for supercapacitor. Int. J. Electrochem. Sci. 2016, 11, 10628–10643. [Google Scholar] [CrossRef]
  28. Razaq, A.; Nyholm, L.; Sjödin, M.; Strømme, M.; Mihranyan, A. Paper-based energy-storage devices comprising carbon fiber-reinforced polypyrrole–Cladophora nanocellulose composite electrodes. Adv. Energy Mater. 2012, 2, 445–454. [Google Scholar] [CrossRef]
  29. Pushparaj, V.L.; Shaijumon, M.M.; Kumar, A.; Murugesan, S.; Ci, L.; Vajtai, R.; Linhardt, R.J.; Nalamasu, O.; Ajayan, P.M. Flexible energy storage devices based on nanocomposite paper. Proc. Natl. Acad. Sci. USA 2007, 104, 13574–13577. [Google Scholar] [CrossRef]
  30. Yu, G.H.; Hu, L.B.; Vosgueritchian, M.; Wang, H.L.; Xie, X.; McDonough, J.R.; Cui, X.; Cui, Y.; Bao, Z.N. Solution-processed graphene/MnO2 nanostructured textiles for high-performance electrochemical capacitors. Nano Lett. 2011, 11, 2905–2911. [Google Scholar] [CrossRef]
  31. Chen, W.; Rakhi, R.B.; Hu, L.B.; Xie, X.; Cui, Y.; Alshareef, H.N. High-performance nanostructured supercapacitors on a sponge. Nano Lett. 2011, 11, 5165–5172. [Google Scholar] [CrossRef] [PubMed]
  32. Dhara, A.; Bibhutibhushan, S.; Basak, A.; Chattopadhyay, S.; Nillohit, M. Core–shell CuO–ZnO p–n heterojunction with high specific surface area for enhanced photoelectrochemical energy conversion. Sol. Energy 2016, 135, 327–332. [Google Scholar] [CrossRef]
  33. Mansour, A.F.; Mansour, S.F.; Abdo, M.A. Improvement of structural and optical properties of ZnO/PVA nanocomposites. IOSR J. Appl. Phys. 2015, 7, 60–69. [Google Scholar]
  34. Kandulna, R.; Choudhary, R.B. Concentration-dependent behaviors of ZnO-reinforced PVA–ZnO nanocomposites as electron transport materials for OLED application. Polym. Bull. 2018, 75, 3089–3107. [Google Scholar] [CrossRef]
  35. Rahman, A.; Aung, K.M. Development of solar supercapacitor by utilizing organic polymer and metal oxides for subsystem of electric vehicle. Mater. Res. Express 2021, 8, 125301. [Google Scholar] [CrossRef]
  36. Rahman, A.; Afroz, R.; Jafar, A.H. Green Transportation System, 1st ed.; IIUM Press: Kuala Lumpur, Malaysia, 2019. [Google Scholar]
  37. Ataur, R.; Sany, I.I.; Jashi, F.; Driveline, A. Autonomous Driveline: Electric & Autonomous Electric Vehicle; Springer Nature: Singapore, 2025. [Google Scholar]
  38. Rahman, A.; Aung, M.K.M.; Ihsan, S.; Shah, R.A.; Qubeissi, R.M.A.L.M.; Aljarrah, M.T. Solar energy dependent supercapacitor system with ANFIS controller for auxiliary load of electric vehicles. Energies 2023, 16, 2690. [Google Scholar] [CrossRef]
  39. Wang, X.; Fang, Y.; Wang, Y.; Hu, J.; Zhang, A.; Ma, X.; Yang, H.; Guo, L. Single-stage photofermentative hydrogen production from hydrolyzed straw biomass using Rhodobacter sphaeroides. Int. J. Hydrogen Energy 2018, 43, 13810–13820. [Google Scholar] [CrossRef]
  40. Jiang, D.; Ge, X.; Zhang, T.; Liu, H.; Zhang, Q. Photo-fermentative hydrogen production from enzymatic hydrolysate of corn stalk pith with a photosynthetic consortium. Int. J. Hydrogen Energy 2016, 41, 16778–16785. [Google Scholar] [CrossRef]
  41. Rai, P.K.; Singh, S.P.; Asthana, R.K.; Singh, S. Biohydrogen production from sugarcane bagasse by integrating dark- and photo-fermentation. Bioresour. Technol. 2014, 152, 1406. [Google Scholar] [CrossRef] [PubMed]
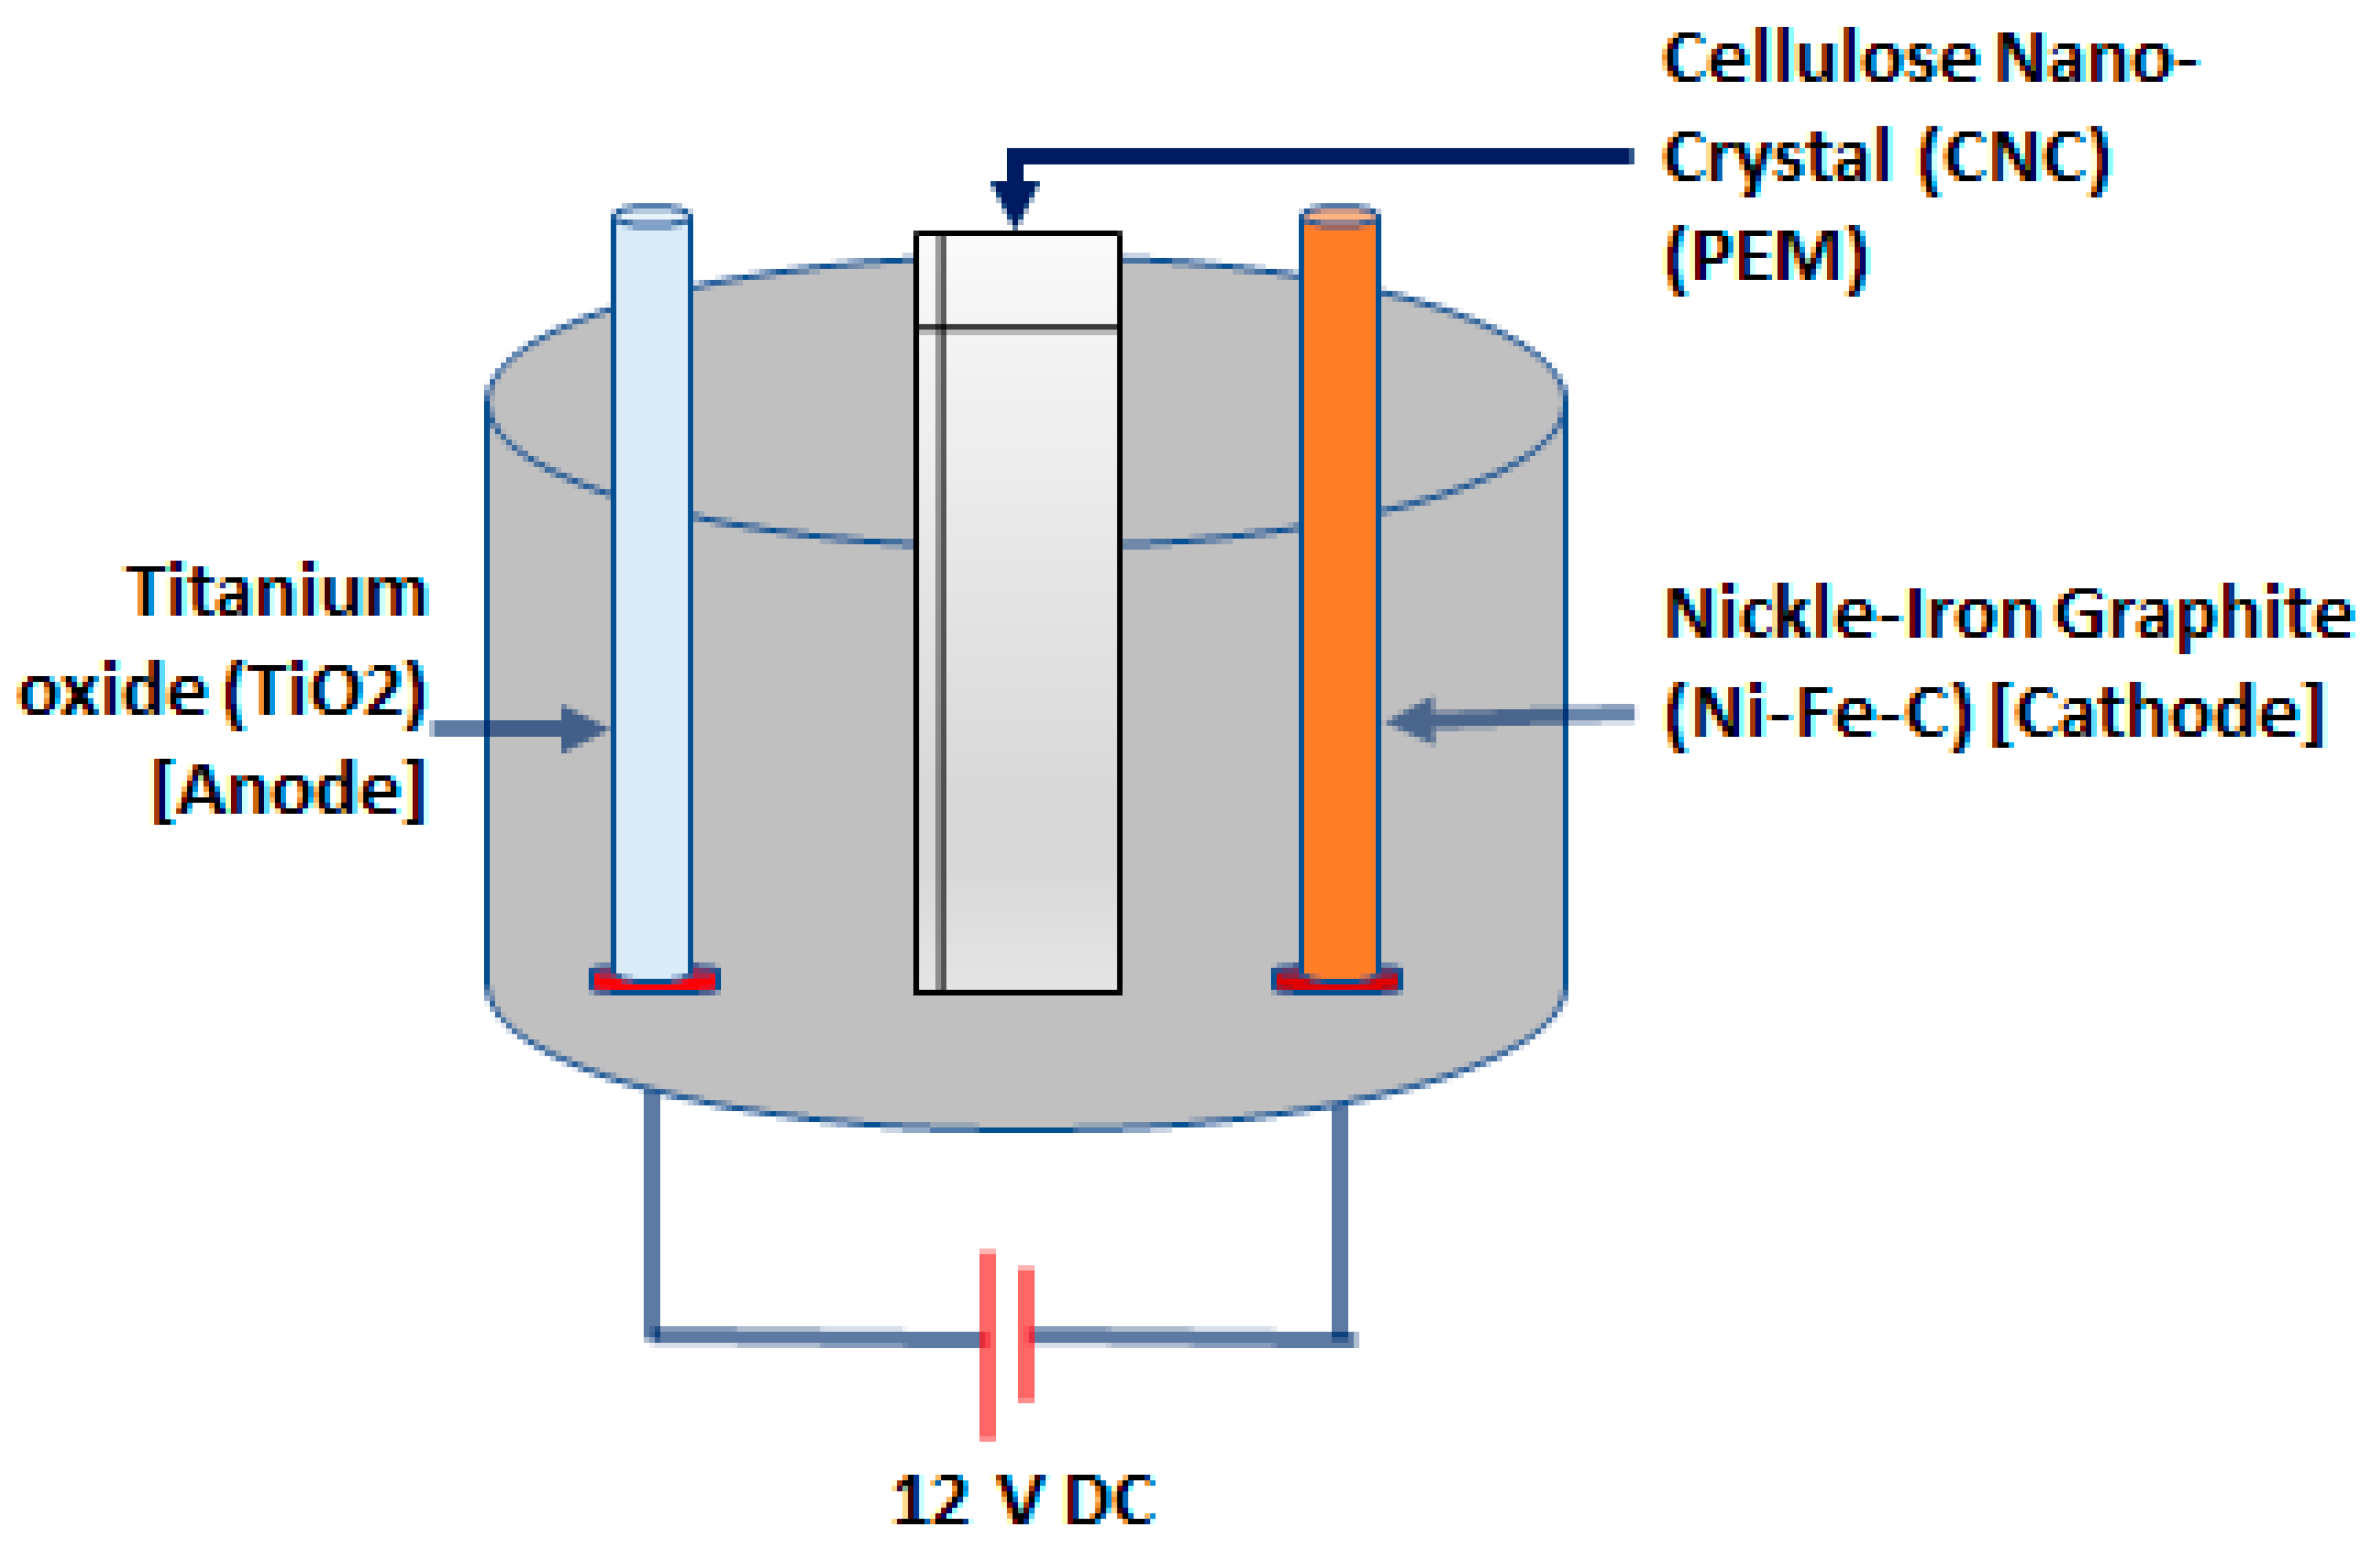
Figure 1. Structure of the microbial TiO2 -NiFeC PEM electrolyzer.
Nanoenergyadv 05 00018 g001
Figure 2. Schematic diagram of a TiO2-NiFeC PEM microbial electrolyzer with photovoltaic EDLOSC integrated ZnO/PVA solar thin film.
Nanoenergyadv 05 00018 g002
Figure 3. Organic capacitor (a) ZnO/CuO-C EDLOSC and (b) ZnO/CuO-C EDLOSC with PVA/ZnO solar thin film.
Nanoenergyadv 05 00018 g003
Figure 4. ZnO/CuO-C EDLOSC performance investigation. (a) Organic ZnO/CuO solar PV cell made with 20 gsm paper of thickness 0.005 mm (soaked in Na2SO4) (EDLOSC), (b) nanocomposite: ZnO (26.6 wt.%)/PVA(83.4 wt%) solar thin film, and (c) organic ZnO/CuO solar EDLOSC and a PVA/ZnO solar thin film.
Nanoenergyadv 05 00018 g004
Figure 5. Current density (A/m2) of EDLOSC sample size 0.003 m2.
Nanoenergyadv 05 00018 g005
Figure 6. SEM image, (a) wt.% ZnO 16.66 and wt.% PVA 83.33, (b) wt.% ZnO 28.57 and wt.% PVA 71.42, (c) wt.% ZnO 37.50 and wt.% PVA 62.50, (d) wt.% ZnO 50 and wt.% PVA 50, and (e) wt.% ZnO 40 and wt.% PVA 60.
Nanoenergyadv 05 00018 g006
Figure 7. XRD for EDLOSC-encased PVA/Zn.
Nanoenergyadv 05 00018 g007
Figure 8. Optical energy bandgap for EDLOSC-encased ZnO/PVA.
Nanoenergyadv 05 00018 g008
Figure 9. Hydrogen production of TiO2-NiFe CNC-PEM microbial electrolyzer with the power of EDLOSC encased in ZnO/PVA.
Nanoenergyadv 05 00018 g009
Figure 10. PEM deflection due to the heat propagation of anode (TiO2) at current supply maximum 25 A using the EDLOSC without a battery.
Nanoenergyadv 05 00018 g010
Figure 11. PEM deflection and displacement due to the thermal stress development for excessive power supply at the anode (TiO2).
Nanoenergyadv 05 00018 g011
Figure 12. Electrolyzer heat impact on the PEM.
Nanoenergyadv 05 00018 g012
Figure 13. Performance of the electrolyzer in hydrogen (H2) generation using a 12-volt DC power DC battery, solar PV and 12 volts of DC power, and solar PV with a PVA/ZnO solar thin film.
Nanoenergyadv 05 00018 g013
Figure 14. Architecture of the ANFIS system.
Nanoenergyadv 05 00018 g014
Figure 15. Simulation model [38].
Nanoenergyadv 05 00018 g015
Figure 16. ANFIS simulation for Psolar [38].
Nanoenergyadv 05 00018 g016aNanoenergyadv 05 00018 g016b
Figure 17. Solar power at different irradiance settings by ANFIS.
Nanoenergyadv 05 00018 g017
Table 1. Measured capacitance of the aqueous ZnO/CuO-C EDLOSC.
Capacitance of OSC (µF)
10% ZnO/CuO 0 wt.% C30% ZnO/CuO 0 wt% C30% ZnO/CuO 6 wt% C
Dielectric OSC
Capacitance (µF)0.552.16.1
EDLOSC
Capacitance (µF)346510578
EDLOSC-encased ZnO/PVA
Capacitance (µF)--606
Table 2. EDLOSC of composition 30% ZnO/CuO 6 wt% C cell performance at 32 °C solar heat.
Performance of EDLOSC
Voc
(mV)
Jsc
(mA/cm2)
Fill Factor (FF)
F F   =   J m   ×   V m J S C   ×   V S C
Efficiency (η),
η = J S C   ×   V O C   ×   F F P i n
EDLOSC570.8824.664.22% 11.01%
EDLOSC-encased ZnO/PVA662.8131.4673.3%16.65%
Table 3. Different electrodes for EDLC and their properties.
Carbonaceous
Material
Electrolyte Double-Layer Capacitance
(µF/cm2)
Surface Area
g/m2
Reference
Published Product
Activated carbon10% NaCl191200 [27]
Carbon black1 M H2SO4
3.1 wt.% KOH
8~10230
Graphite powder10% NaCl354
Graphite cloth0.168 N NaCl10.7630
Carbon aerogel4 M KOH23650
Researcher Products:
(ACZnO/CuO with 20 gsm paper soaked in Na2SO4)
AC 6%1 M Na2SO4 18.561050 Authors’ Experimental
Result
AC10%13.35
AC15%13.156
AC20%11.27
Table 4. Surface area of different electrolytes.
ElectrodeElectrolytePower Density (kW/kg)Energy Density
(Wh/kg)
Reference
Published Product [Porous Carbon (PC), Surface Area (SA)]
PC, SA1496 m2/g6 M KOH4.23.3[28]
Graphene aerogel6 M KOH745[29]
B-doped rGO 0.5 M H 2 S O 4 105.5[30]
Graphene nanoribbon1 M H2SO49.74.10[31]
Researcher Products [AC, Surface Area (SA)]
AC6%, SA1050 m2/g1 M Na2SO4 18.6915.198Authors’ Experimental Result
AC10%, SA1050 m2/g16.747.707
AC 15%, SA1050 m2/g15.858.85
Activated Carbon 20%,
1050 m2/g
5.8631.623
Table 5. Comparison with other research.
CompositeVoc(V)Isc (A/m2)Efficiency (%)Reference
AC-ZnO/CuO
(6%AC ZnO/CuO)
0.779220.595.71Authors’ result
CuO/ZnO0.631804.48[32]
SnS/ZnO0.120.40.003
CdS/SnS0.26961.3
Table 6. Hydrogen yield from substrate by electrolysis.
SubstrateReaction Typeg H2 Per Mole of SubstrateNotes
Water (H2O)Electrolysis2 g H2/18 g H2O ≈ 0.111 g/gHigh energy input, high yield per mole
POME (organics)Microbial electrolysis / fermentation~0.0721 g H2 per g carbohydrateLower yield, uses waste organics, lower energy input
Table 7. Hydrogen yield of electrolyzer from POME for each 30 s.
Test No.Volume of Waste Water (mL)Durations
(mins)
Observation (Bubbles Formation)Hydrogen Test Results
Status
Hydrogen Yield (g/L)
Using Different Power Mode Supplying 1 L of POME for Each 30 s
12 V DC Power12 V Solar Organic EDLOSC
Without
ZnO/PVA Thin Film
With ZnO/PVA Thin Film
12550Very dense in short timePositive (louder)280280280
25050Very dense but decreased over timePositive (loudest)620600650
310050Very dense and continuous over timePositive (extremely high and scary)620600710
Table 8. Solar power simulation results from Simulink (OSSC size of 9.75 m2) [38].
Input ParameterOutput Parameter
Temperature (°C)Irradiance (W/m2)Psolar (W)
251000957.1
25800729.1
25600584.1
25400388.4
25200180.8
Table 9. Power simulation results from Simulink.
Input ParameterOutput ParameterTime to Deliver Power to the Electrolyzer
(Hour)
Temperature
(°C)
Irradiance
(W/m2)
Psolar (W)Required Power of Electrolyzer (W)
251000957.11208.0
25800729.16.1
25600584.15.0
25400388.43.2
25200180.81.5
Table 10. Comparison of hydrogen generation.
Waste TypeTechnologyPretreatmentTemperature
(°C)
Hydrogen YieldReference
Maize strawReactor (Batch)5% HCl at 118 C304.62 mol/mol[39]
Corn stalk pithEnzyme cellulase302.6 mol/mol[40]
Brewery wastewaterSterilized at 120 C for 20 min300.22 L/L[10]
Sugar cane bagasse-340.75 L/L waste[41]
Sugar beet molasses-3012.7 mol/mol[11]
Apple waste Crushed and30.5112 mL/L[13]
screened
POME wasteElectrolyzer
(using EDLOSC solar-dependent capacitor power control with AI system)
No pretreatment35600–710 mL/LAuthors’ findings
Disclaimer/Publisher’s Note: The statements, opinions and data contained in all publications are solely those of the individual author(s) and contributor(s) and not of MDPI and/or the editor(s). MDPI and/or the editor(s) disclaim responsibility for any injury to people or property resulting from any ideas, methods, instructions or products referred to in the content.