Article

Rheology of Cellulosic Microfiber Suspensions Under Oscillatory and Rotational Shear for Biocomposite Applications

by
Helena Cristina Vasconcelos
1,2,*,
Henrique Carrêlo
3,
Telmo Eleutério
1,
Maria Gabriela Meirelles
1,4,
Reşit Özmenteş
5 and
Roberto Amorim
6
1
Faculty of Sciences and Technology, University of the Azores (FCT-UAc), 9500-321 Ponta Delgada, Portugal
2
Laboratory for Instrumentation, Biomedical Engineering and Radiation Physics (LIBPhys-UNL), Department of Physics, NOVA School of Science and Technology, NOVA University of Lisbon, 2829-516 Caparica, Portugal
3
Department of Materials Science and CENIMAT/I3N, Faculty of Sciences and Technology, Nova University of Lisbon, 2829-516 Caparica, Portugal
4
Institute of Marine Research (IMAR), OKEANOS—R&D Centre, University of the Azores, 9900-138 Horta, Portugal
5
Vocational School of Health Services, Bitlis Eren University, 13100 Bitlis, Türkiye
6
Innovation Green Azores (IGA), 9500-321 Ponta Delgada, Portugal
*
Author to whom correspondence should be addressed.
Compounds 2024, 4(4), 688-707; https://doi.org/10.3390/compounds4040042
Submission received: 17 October 2024 / Revised: 29 October 2024 / Accepted: 5 November 2024 / Published: 12 November 2024

Abstract

:
This study investigates the rheological behavior of cellulose microfiber suspensions derived from kahili ginger stems (Hedychium gardnerianum), an invasive species, in two adhesive matrices: a commercial water-based adhesive (Coplaseal®) and a casein-based adhesive made from non-food-grade milk, referred to as K and S samples, respectively. Rheological analyses were performed using oscillatory and rotational shear tests conducted at 25 °C, 50 °C, and 75 °C to assess the materials’ viscoelastic properties more comprehensively. Oscillatory tests across a frequency range of 1–100 rad/s assessed the storage modulus (G′) and loss modulus (G″), while rotational shear tests evaluated apparent viscosity and shear stress across shear rates from 0.1 to 1000 s−1. Fiber-free samples consistently showed lower moduli than fiber-containing samples at all frequencies. The incorporation of fibers increased the dynamic moduli in both K and S samples, with a quasi-plateau observed at lower frequencies, suggesting solid-like behavior. This trend was consistent in all tested temperatures. As frequencies increased, the fiber network was disrupted, transitioning the samples to fluid-like behavior, with a marked increase in G′ and G″. This transition was more pronounced in K samples, especially above 10 rad/s at 25 °C and 50 °C, but less evident at 75 °C. This shift from solid-like to fluid-like behavior reflects the transition from percolation effects at low frequencies to matrix-dominated responses at high frequencies. In contrast, S samples displayed a wider frequency range for the quasi-plateau, with less pronounced moduli changes at higher frequencies. At 75 °C, the moduli of fiber-containing and fiber-free S samples nearly converged at higher frequencies, indicating similar effects of the fiber and matrix components. Both fiber-reinforced and non-reinforced suspensions exhibited pseudoplastic (shear-thinning) behavior. Fiber-containing samples exhibited higher initial viscosity, with K samples displaying greater differences between fiber-reinforced and non-reinforced systems compared to S samples, where the gap was narrower. Interestingly, S samples exhibited overall higher viscosity than K samples, implying a reduced influence of fibers on the viscosity in the S matrix. This preliminary study highlights the complex interactions between cellulosic fiber networks, adhesive matrices, and rheological conditions. The findings provide a foundation for optimizing the development of sustainable biocomposites, particularly in applications requiring precise tuning of rheological properties.

1. Introduction

The global shift toward sustainable materials has accelerated interest in biocomposites, which integrate renewable cellulose-based fibers and bio-based polymer matrices [1,2]. These materials are not only biodegradable and widely available but also represent a growing economic sector. According to Precedence Research, the biocomposites market was valued at approximately USD 25.2 billion in 2022 and is expected to reach around USD 103.6 billion by 2032, driven by increased demand across automotive, construction, and packaging industries [3]. This robust growth underscores both the economic potential and environmental relevance of renewable materials. Notably, the performance of biocomposites depends heavily on the mechanical and rheological properties imparted by fiber reinforcements and polymer matrices, making it essential to optimize these interactions for expanded application potential. Cellulosic fibers such as bamboo, flax, and hemp have long been utilized for their mechanical advantages; however, recent research has begun to explore lesser-known fibers, including those derived from invasive species like kahili ginger (Hedychium gardnerianum) [4,5,6], which is invasive in places such as Azores, Hawaii, New Zealand, and parts of the Caribbean. Utilizing invasive biomass not only addresses environmental management issues but also creates new opportunities for innovative materials and sustainable practices. For example, Zima et al. [7] demonstrated that incorporating fibers from invasive plants can enhance the mechanical properties of polylactic acid biocomposites while mitigating ecological concerns. Cellulose fibers possess unique chemical characteristics due to their high content of hydroxyl (-OH) groups and other oxygen-containing functional groups, rendering them highly reactive [8]. In biodegradable composites using natural polymers, both the fibers and the polymer are hydrophilic and share a similar chemical structure. This similarity promotes better bonding between the fibers and the matrix without the need for additional surface treatments [9,10]. When properly oriented, cellulose fibers can significantly enhance the mechanical properties of composites, providing substantial reinforcement [11]. Conversely, in composites made with synthetic (hydrophobic) polymers, surface treatments—such as alkali treatment—are often necessary to reduce the hydroxyl groups on cellulose fibers, improving adhesion with the hydrophobic polymer [12]. The effectiveness of cellulose as a filler lies not only in its structural integrity but also in its potential for promoting interfacial adhesion, which is crucial for the mechanical robustness of sustainable biocomposites [13].
Despite these advantages, the hydrophilic nature of cellulose fibers can still pose challenges. The distinct morphology of cellulose fibers, particularly their microfibrils (as shown in Figure 1), supports strong fiber bonding [14]. Therefore, this hydrophilic nature increases the risk of fiber agglomeration in cellulose fiber-reinforced suspensions, which can disrupt the flow behavior of the mixture. Optimizing processing conditions, such as fiber loading and alkali treatment, along with managing temperature, is essential to mitigate fiber agglomeration and ensure a uniform distribution of fibers [15], ultimately enhancing the overall performance of biocomposites. To prevent these issues, cellulose suspensions are typically used immediately after preparation, or the fibers are dried for long-term preservation to maintain their structural integrity [16].
Research by Borchani et al. [17] investigates the viscoelastic behavior of biocomposites made with short Alfa (Stipa tenacissima) fibers dispersed in a polyester-starch bioplastic of the Mater-Bi® type. The study shows that as the fiber content increases, the dynamic moduli of the biocomposites also rise, indicating enhanced material stiffness. Moreover, the biocomposites exhibit a plateau in storage modulus (G′) at low frequencies, which suggests the formation of a percolated fiber network. The research also highlights that alkali treatment of the fibers improves the low-frequency elastic behavior, enhancing the overall mechanical performance of the biocomposite materials.
Building on these advances, the development of bio-based polymer matrices has gained traction as a sustainable alternative to synthetic materials. Bio-based adhesives, including those derived from soy protein [18] and milk-based casein [19], are increasingly recognized for their potential to replace conventional synthetic adhesives in applications such as food packaging [20]. Previous studies have demonstrated that bio-based matrices, such as casein, can effectively interact with cellulose fibers, resulting in enhanced mechanical properties. For example, Melnychuk et al. [19] demonstrated that incorporating cellulose fibers into a casein matrix significantly increased the material’s impact strength, approaching that of polystyrene, a widely used material in food packaging.
While much of the existing research emphasizes key performance indicators such as strength and biodegradability, the viscoelastic properties of fiber suspensions often receive insufficient attention. Rheology, the study of flow and deformation in materials, is essential for understanding the behavior of fiber-reinforced suspensions during processing [17]. The addition of cellulose fibers to polymer matrices often results in complex rheological responses, including non-Newtonian behaviors like shear-thinning, as well as significant changes in viscosity and shear stress. Oscillatory shear tests, which measure storage modulus (G′) and loss modulus (G″), provide key information on a material’s elastic and viscous properties.
Understanding how these materials flow and deform under applied stresses is crucial for optimizing their processability in manufacturing, especially in techniques such as extrusion and injection molding [21]. Shear-thinning behavior—where viscosity decreases as shear rate increases—facilitates material flow during shaping processes [22]. A related study examining the rheological characteristics of microfibrillated cellulose (MFC) in water suspensions reveals that MFC displays a complex rheological profile [23]. Typically, these suspensions show pseudoplastic behavior, characterized by shear-thinning, as the fiber network breaks down under shear stress, allowing fibrils to flow in clustered formations. Iotti et al. [23] found that at elevated shear rates, specifically above 100 s−1, the water suspensions of MFC can exhibit shear-thickening behavior, due to the formation of structures induced by shear, facilitated by temporary hydrogen bonds or van der Waals interactions.
The interactions between fibers and matrices significantly affect suspension behavior during processing, directly influencing the mechanical strength of the final product [24]. The presence of fibers enhances the elastic properties of the suspension, leading to more complex flow behavior compared to fiber-free suspensions [25]. These rheological characteristics are strongly influenced by factors such as fiber aspect ratio, shape, dispersion state, surface characteristics, loading, and matrix–filler interactions [26]. Recent advancements in natural fiber-reinforced composites show that optimizing factors like fiber content, length, and orientation during processing can improve material performance [27,28].
To the best of our knowledge, nobody has investigated the rheological properties of biocomposites made from Hedychium gardnerianum fibers combined with various bio-based adhesives. This study explores the suspensions of these fibers with two bio-based adhesives to assess their effects on rheological behavior. By examining fiber concentration, adhesive type, and temperature, we aim to conduct a preliminary investigation of the rheological behavior of these suspensions, potentially leading to enhanced processing methods.

2. Methodology

The rheological behavior of biocomposite suspensions was studied using fibers extracted from Hedychium gardnerianum stems and two types of bio-based adhesives: the commercially available food-contact adhesive Coplaseal®, (patented: https://patents.google.com/patent/PT108552B/pt (accessed on 4 November 2024)) from Lusocopla Lda, 4520-621 São João de Vêr, Portugal, and a homemade casein adhesive made from non-food-grade milk, prepared according to the recipe in [29]. While proprietary constraints limit the details available for the commercial adhesive, its water-based nature allows for a direct comparison with the homemade casein adhesive in terms of fiber interaction, viscoelastic behavior, and response to temperature variations. Both oscillatory and continuous rotational shear tests were conducted to characterize the rheological properties of these biocomposites. Additionally, visual assessments were carried out to enable visual monitoring of the samples and capture observable effects. All rheological measurements were performed in triplicate. Error bars are included in Figures 3, 5, 7, and 10 to illustrate the variability across the triplicate measurements. However, in Figures 4 and 6, which offer comparative views of the same data presented in Figures 3 and 5, respectively, error bars have been omitted for simplicity.

2.1. Fiber Processing

Fibers were extracted and mechanically processed following established methods [4,5]. The preparation involved combing the fibers to remove impurities and ensure a high degree of alignment. Short or damaged fibers were discarded, leaving only the longer, stronger fibers for use. Long fibers were defined as those exceeding 10 cm, as illustrated in Figure 2a, while short fibers were those shorter than this length. After combing, the long Hedychium gardnerianum microfibers were ground in a knife mill (TRF 600) to an average length of 0.5 cm. The fibers were then dried at 60 °C for 48 h in an oven with air circulation. Following this, they were further ground in a Marconi knife Willey mill (model MA048, Piracicaba, SP, Brazil) to achieve an approximate length of 0.50 mm.
To ensure uniform fiber dispersion, a sieving process was conducted using a 500 µm mesh to isolate fibers with lengths between 0.2 mm and 5 mm (Figure 2b). While fibers of sufficient length support efficient stress transfer and interaction within the polymer matrix, enhancing mechanical strength and modifying flow behavior, fibers that are too long can lead to clumping, which can negatively impact processing. Studies indicate that maintaining an appropriate fiber length distribution is essential for effective reinforcement in polymer composites [30]. In contrast, fibers longer than 5 mm can lead to poor dispersion and localized weak points, while fibers shorter than 0.2 mm may not provide adequate reinforcement [24].

2.2. Sample Preparation

Biocomposite suspensions were prepared using both adhesives, reinforced at 0 wt% and 10 wt% fiber concentrations. The 10 wt% concentration was chosen based on our experience and prior studies, which indicated rheological changes at similar levels [27]. To ensure uniform dispersion the suspensions were stirred at room temperature for 2 min at 500 rpm. Subsequently, ultrasound treatment was applied at approximately 20 kHz and 200 watts for 20 min to prevent fiber sedimentation. This treatment was conducted immediately after stirring to achieve optimal dispersion of the fibers. Following the ultrasound treatment, the suspensions were allowed to rest for 30 min before rheological investigations were performed.

2.3. Rheological Measurements

The viscoelastic properties of the matrix (adhesive) and of the biocomposites (suspensions) were measured using two rotational rheometers: a Malvern Bohlin Gemini HR Nano (plate/plate geometry of 20 mm) and an Anton Paar MCR 502 (plate/plate geometry of 50 mm). The Malvern Bohlin Gemini HR Nano served as the primary equipment for gathering the quantitative rheological data presented in the results. The Anton Paar MCR 502 was used to repeat some tests solely for visual control purposes. Specifically, these tests aimed to capture observable effects in the samples, such as sample slippage, film formation, and other changes during rheological testing.
Oscillatory tests were conducted to measure the storage modulus (G′) and loss modulus (G″) across an angular frequency range of 1 to 100 rad/s. Throughout these tests, the oscillation frequency was kept constant at 1 Hz to ensure consistency and reliable comparisons of the results. In addition, continuous rotational tests were performed over a shear rate range of 0.1 to 100 s−1 to evaluate the relationship between shear stress and shear rate, providing insights into the flow behavior of the samples.
Prior to testing, a pre-shear rate of 0.1 s−1 was applied for 60 s to achieve uniform dispersion of the material and to eliminate any structural memory that could influence the outcomes.
To determine the appropriate testing conditions, a strain sweep test was first conducted at a constant angular frequency to identify the linear viscoelastic region (LVR). During this test, the strain amplitude gradually increased until both G′ and G″ remained constant, indicating the material’s linear response. Based on these results, a constant strain of 0.05%—well within the LVR—was selected for the frequency sweep.
The frequency sweep was then carried out over a logarithmic range of 1 to 100 rad/s, ensuring that the measurements accurately reflected the material’s behavior under small, non-destructive deformations. Frequency spectra were obtained to verify that the measured rheological properties were representative of the material’s behavior under these conditions. By varying the angular frequency (ω), the oscillatory tests provided crucial information about the balance between the elastic and viscous responses of the suspensions under oscillatory shear.

2.4. Temperature Selection

The suspensions were tested at three distinct temperatures: 25 °C, 50 °C, and 75 °C. These temperatures were strategically chosen to ensure that the water remained in a liquid phase at atmospheric pressure while also representing various processing conditions that biocomposites may encounter during manufacturing or use. At 25 °C, the baseline temperature reflects room temperature, allowing for an understanding of the materials’ behavior under ambient conditions, which is crucial for applications where the biocomposite is expected to perform without significant heating. The temperature of 50 °C simulates intermediate conditions where biocomposites may experience moderate heat during processing or use; at this temperature, many adhesive systems start to soften, providing insights into the materials’ behavior under mild thermal stress. Finally, 75 °C represents high-temperature scenarios typical of intensive processing methods such as extrusion or injection molding. At this elevated temperature, the polymer matrix may undergo significant changes, including softening or partial melting, which can affect fiber–matrix interactions and overall rheological behavior. It is also important to consider that most biopolymers tend to degrade at higher temperatures, which is why we opted to remain below 100 °C, as degradation is generally associated with bond strengths that typically require temperatures exceeding 100 °C to break [24].

2.5. Visual and Rheological Assessments

In addition to rheological measurements, the samples were visually inspected during and after testing to assess changes in their appearance and consistency at different temperatures. The Anton Paar MCR 502 was used to capture these visual effects during rheological testing, including slippage, film formation, and other surface behaviors that might not be fully captured by numerical rheological data alone. These images are intended to illustrate sample behavior and complement the quantitative data obtained from the Malvern Bohlin Gemini HR Nano.

2.6. Nomenclature of Samples

Samples were labeled based on the adhesive type (S for casein-based adhesives, K for Coplaseal®), fiber content (0% or 10%), and test temperature. For example, the sample labeled “s25 0” represents a Super (casein-based) adhesive with 0% fiber content, tested at 25 °C. In contrast, “k50 10” represents a Kappa (Coplaseal®) sample with 10% fiber content, tested at 50 °C. Table 1 presents the nomenclature used to reference each sample, indicating the temperature and percentage of fibers present in each.

3. Results and Discussion

3.1. Oscillatory Tests

The rheological properties of both K (Coplaseal®) and S (casein-based) samples were examined through oscillatory tests, where the storage modulus (G′) represents the material’s elastic response, and the loss modulus (G″) represents its viscous behavior. These moduli were evaluated as functions of angular frequency (ω) in radians per second (rad/s). The fibers in the samples, due to their hydroxyl groups and large surface areas, absorbed significant amounts of water [8], resulting in suspensions with a gel-like consistency. This network predominantly exhibited elastic behavior, with G′ exceeding G″. This finding indicates the fibers’ reinforcing effect on the adhesive matrix.
A key parameter in understanding this transition is the loss factor (tanδ), defined as the ratio of the loss modulus to the storage modulus as shown in Equation (1):
t a n δ = G G
When tanδ is greater than 1, the suspension behaves more like a liquid, while values less than 1 indicate a gel-like consistency. The loss factor serves as a critical indicator of material performance. When is greater than 1, the material exhibits more liquid-like behavior, suitable for processes requiring flowability, such as coating applications. Conversely, if less than 1 signifies a predominance of elastic behavior, indicating a stable gel structure that can maintain its shape under load. This transition can be influenced by factors such as temperature, frequency, and material composition.
Our fiber suspensions demonstrated complex rheological responses to varying frequencies, distinguishing them from typical viscoelastic liquids and gels [31]. Unlike viscoelastic liquids, which usually exhibit a storage modulus proportional to the square of the angular frequency (G′(ω) ∝ ω2) and a loss modulus proportional to the frequency (G″(ω) ∝ ω), our suspensions did not strictly follow this behavior. The observed frequency-dependent behavior of G′ and G″ can be understood through viscoelastic models. For instance, in the Maxwell model, a combination of spring (representing elasticity) and dashpot (representing viscosity) elements reflects the time-dependent behavior of polymers. As frequency increases, the time available for molecular rearrangements decreases, leading to an increase in G′ and a decrease in G″, characteristic of solid-like behavior.
To further capture this unique behavior, we can also consider a power-law model, which has been documented in the literature for various complex materials [32], where the storage modulus and loss modulus depend on angular frequency as follows:
G ( ω ) = G 0 + K ω n
G ( ω ) = G 0 + K ω m
Here, n and m are exponents that indicate the material’s frequency sensitivity for G′ and G″, respectively. When n = 1, G′(ω) increases linearly with frequency, indicating a stable rise in elasticity, resulting in a straight line with a positive slope on the graph. If n > 1, G′(ω) increases more rapidly and nonlinearly, typical of complex materials that respond intensely to higher deformation rates; this results in a steeper, upward-curving graph. The exponent m similarly influences G″(ω); higher values of m correspond to greater energy dissipation at elevated frequencies, indicating that these materials lose energy more rapidly under higher frequency oscillations. This behavior deviates from the frequency-independent characteristics typical of gels, where G′(ω) remains constant (G′(ω) ∝ ω0) [33]. The complex rheological responses observed in our fiber suspensions signify their unique behavior, differentiating them from conventional materials. The ability to adapt between liquid-like and gel-like properties depending on frequency makes them versatile for various applications, such as in bio-based adhesives where flow properties during application are critical.

3.1.1. K-Rheological Properties

The changes in the storage modulus (G′) and loss modulus (G″) across angular frequency (ω) for K samples with (k10) and without (k0) fibers were analyzed at the designated temperatures, as shown in Figure 3. Both G′ and G″ increased with angular frequency at all temperatures, typical of viscoelastic materials. This suggests that at higher frequencies, the material becomes more elastic and less viscous, demonstrating enhanced solid-like behavior. The moduli of the k0 (neat adhesive) are the lowest at all frequencies in comparison with the k10 samples. The inclusion of cellulose fibers significantly increased both moduli, reflecting the fibers’ role in reinforcing the material, as is consistent with prior studies [15,34], which shows that biocomposites exhibit enhanced mechanical properties due to the reinforcement provided by fibers.
The fibers act as rigid fillers within the Coplaseal® adhesive matrix, restricting polymer chain mobility and enhancing the material’s ability to store elastic energy [25,26,28]. This is reflected in the increased G′ and a lower slope in the modulus plots, indicating that the material becomes stiffer and better able to resist deformation [34]. Additionally, the loss tangent value remained below 1, indicating a consistent gel-like structure where the material behaves predominantly elastically [15]. As a result, fiber-reinforced K samples may be better suited for load-bearing applications, such as packaging or structural components.
The loss modulus (G″), which reflects energy dissipation as heat, also increases in k10, aligning with the observation that fibers create additional internal interactions within the matrix, increasing friction during deformation [35]. This leads to greater energy dissipation. Therefore, the addition of fibers enhances both the elastic (G′) and viscous (G″) behavior, improving the overall mechanical performance of the composite. In contrast, k0 (without fiber reinforcement) exhibits a predominantly elastic response, with G′ greater than G″, though to a lesser extent than in k10. This suggests that while the adhesive matrix alone can store some elastic energy, it is less stiff and more prone to flow without fiber reinforcement.
Across all frequencies, both k0 and k10 demonstrate G′ > G″, indicating predominantly elastic behavior. In addition, the effect of fiber content is much higher at high frequencies than at low frequencies. At low frequencies, both the storage and loss moduli display similar slopes, yet G′ remains lower than G″, indicating a response that is more liquid-like in nature. At low frequency, the value of the storage modulus becomes almost independent from frequency, indicating a solid-like behavior or elastic response (G′ and G″ are close to each other in our experiments) with long relaxation time.
However, the increase in G′ is more pronounced in k10, underscoring the role of fiber reinforcement in enhancing elasticity and resistance to deformation. The addition of fibers disrupts polymer flow, increasing the viscosity and making it harder for polymer chain segments to move freely [36,37]. As a result, even without fibers, the adhesive matrix retains a higher G′ than G″, meaning the material stores more elastic energy than it dissipates as heat. Fiber addition further strengthens this elastic dominance, as the increase in G′ is greater than in G″, indicating stronger fiber–matrix interactions and forming a more solid-like structure [26].
The interaction between cellulose fibers and the adhesive matrix can be summarized as the reaction:
Cellulose-OH + Coplaseal®-OHCellulose-OH-O-Coplaseal®.
This reaction indicates that the hydroxyl groups on cellulose and Coplaseal form strong hydrogen bonds, enhancing the composite’s stability and mechanical properties. These interactions significantly contribute to the observed increases in the storage modulus (G′) and loss modulus (G″) during oscillatory tests.
The cellulose fibers not only reinforce the adhesive but also modify its microstructure, leading to a more rigid and cohesive structure. The increased G′ reflects enhanced elasticity due to stronger fiber–matrix interactions, while the rise in G″ indicates greater viscosity and energy dissipation during deformation. This results in a predominance of elastic behavior, as seen by G′ exceeding G″ across various frequencies.
The changes of G′ and G″ across the selected temperatures is illustrated in Figure 4, which presents data for both K samples with fibers (k10) and without fibers (k0).
For k0, both G′ and G″ remain relatively stable only at 25 °C and 50 °C, indicating that the viscoelastic properties of the material are less affected at these lower temperatures. However, at 75 °C, both moduli increase significantly, suggesting that stability is compromised under elevated temperatures. This pronounced rise in G′ may be attributed to thermal cross-linking, where additional bonds form between polymer chains, resulting in a stiffer material [34]. Alternatively, a phase transition could occur, leading to a more ordered and rigid matrix. In this context, we can interpret the changes at higher temperatures as a disruption in the expected behavior of the material, raising concerns about its performance in applications requiring high-temperature resistance. Further investigation, including microstructural analysis and thermal testing, will be necessary to confirm these hypotheses.
In contrast, k10 samples demonstrate greater stability across all temperatures, including 75 °C. The presence of fibers helps maintain a more consistent balance between G′ and G″, preventing the sharp increases seen in k0 at higher temperatures. While k10 exhibits improved resistance to disruption, it is still influenced by temperature changes. This stability indicates that the fibers effectively enhance the thermal and mechanical behavior of the matrix, maintaining the balance between elastic and viscous properties even at elevated temperatures. By restricting polymer chain movement, the fibers prevent the matrix from becoming overly fluid-like, enabling k10 to retain its elasticity and resist the significant increases in G′ and G″ observed in k0 at 75 °C. This behavior is consistent with similar studies [38]. Finally, the frequency sweep results for k10 reveal a low-frequency plateau in the storage modulus, indicating a transition to solid-like behavior, which corresponds to strong fiber–fiber interactions [38,39]. This plateau suggests that at low frequencies, filler interactions dominate, as observed in fiber-reinforced composites [26,38]. The enhanced moduli at low frequencies compared to k0 further demonstrate that the fibers significantly improve the composite’s rheological properties while minimizing potential disruptions in performance.

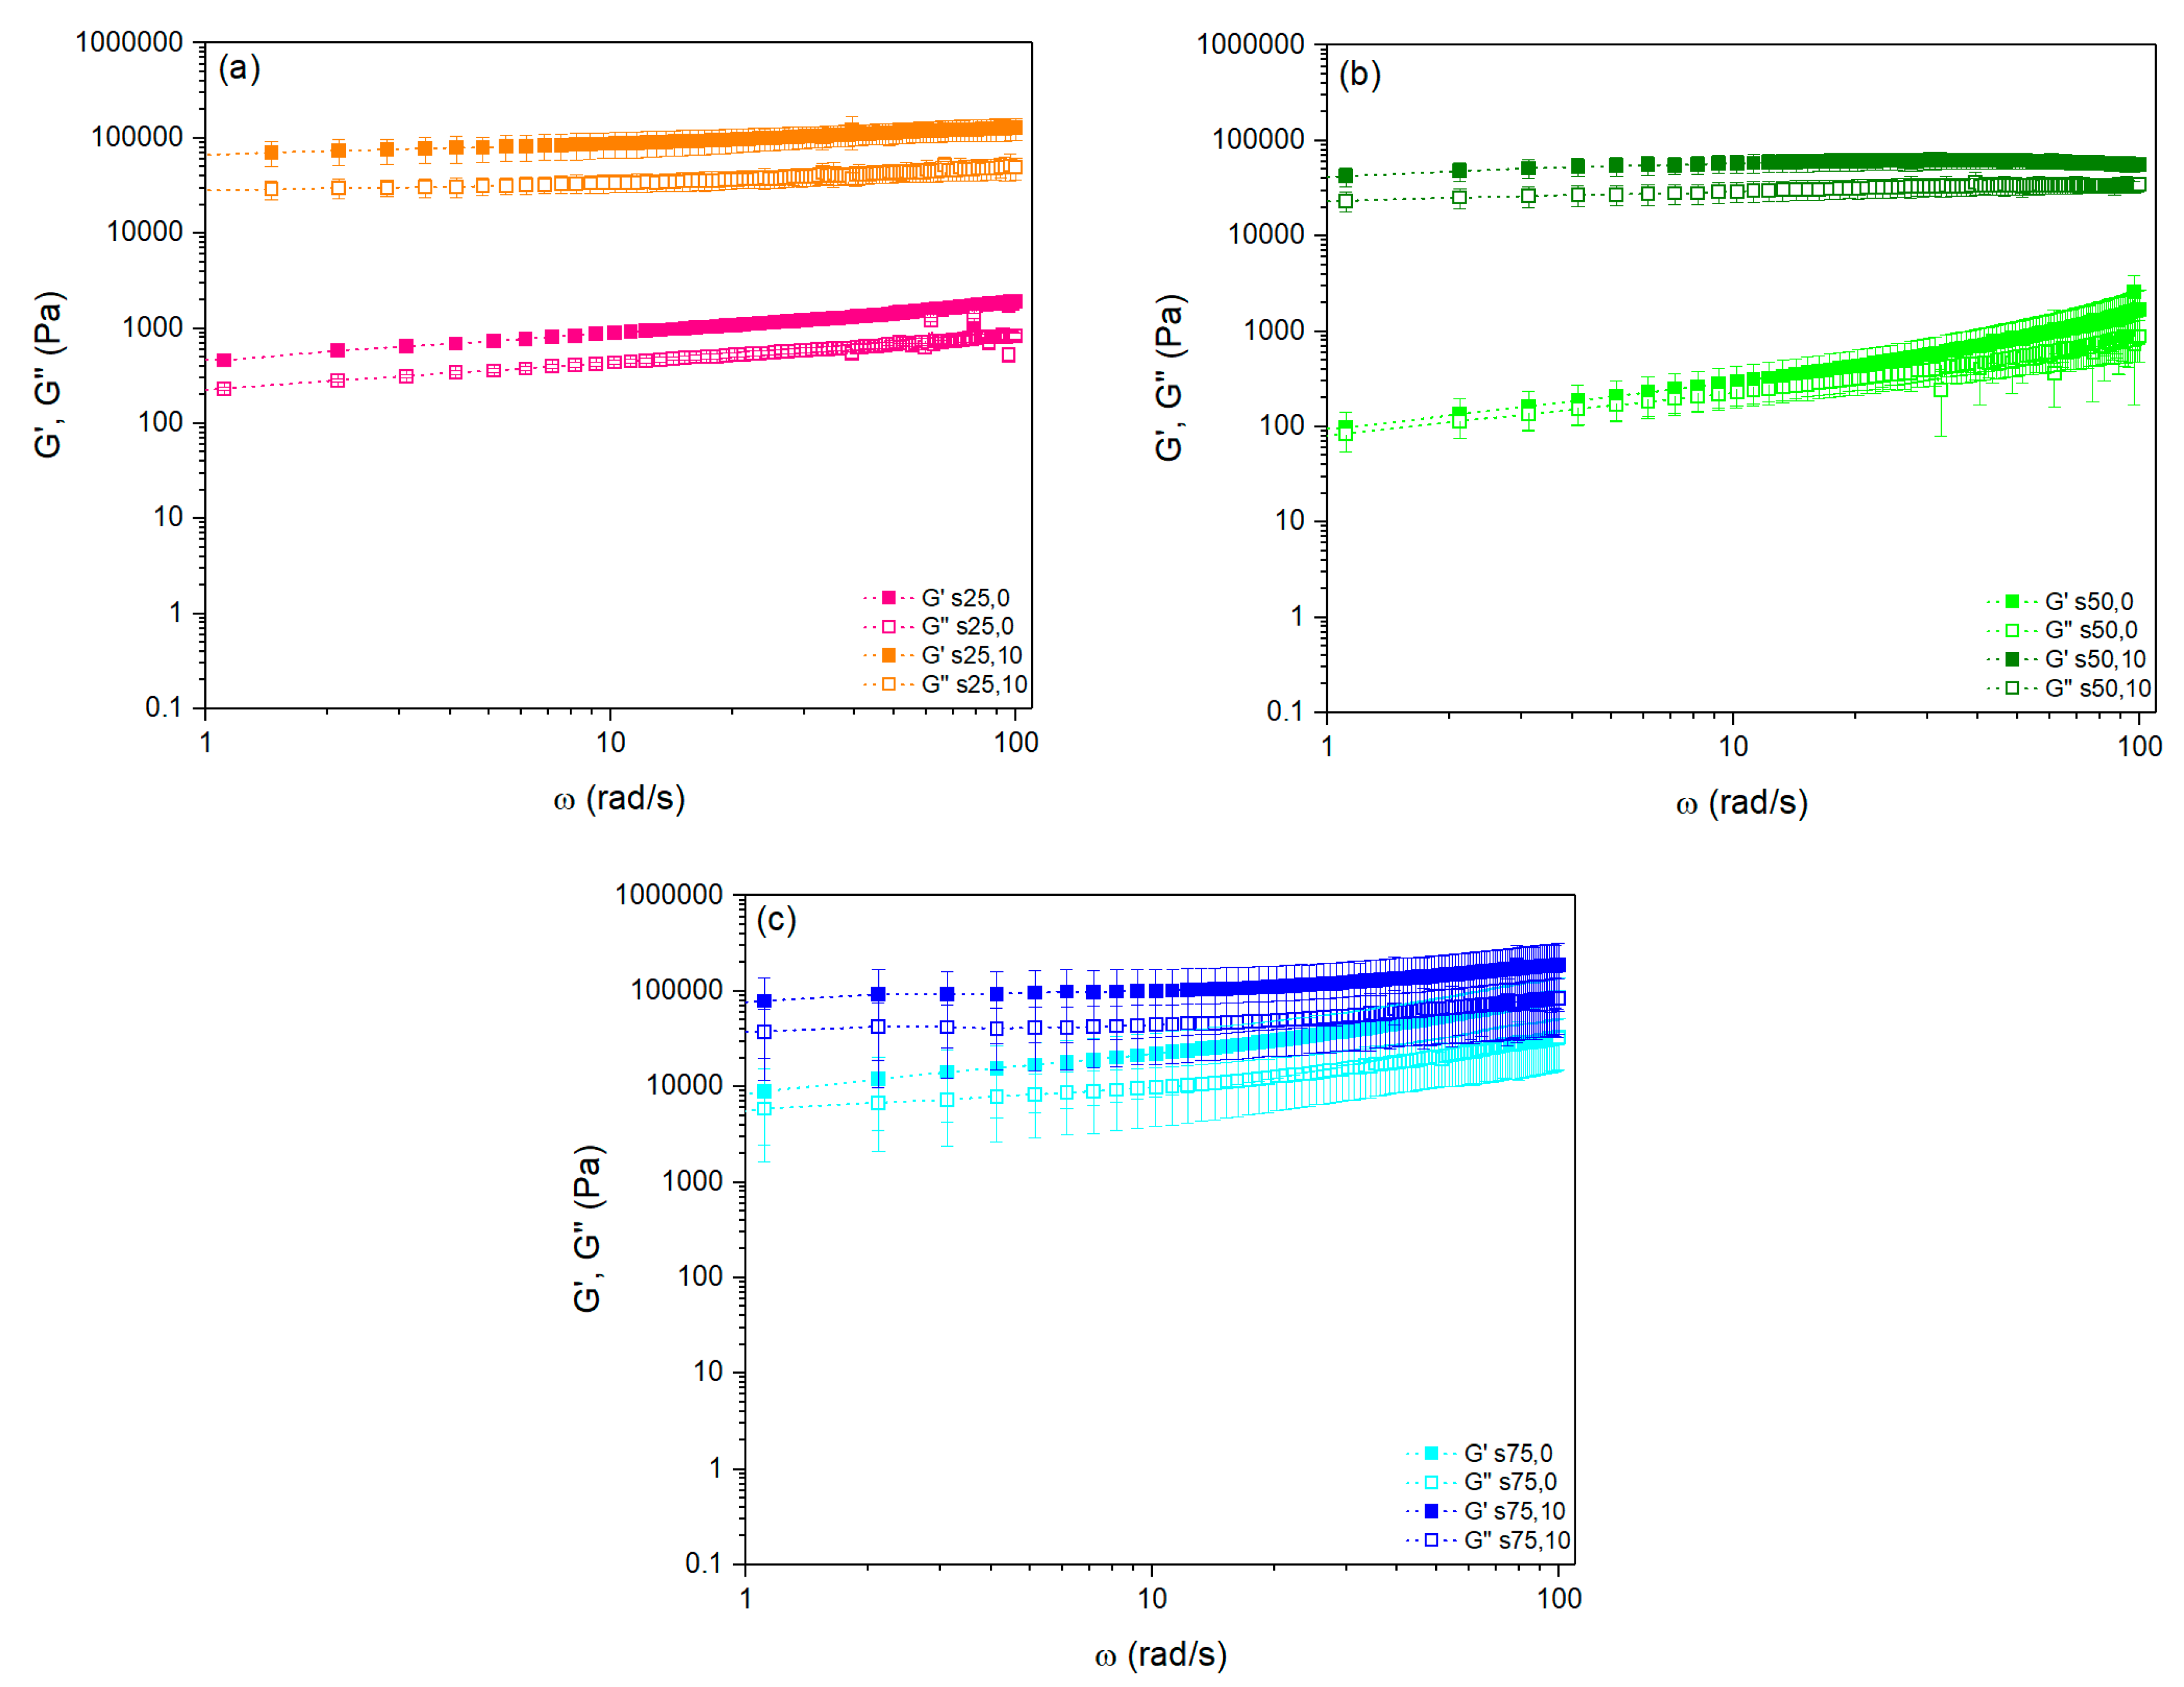
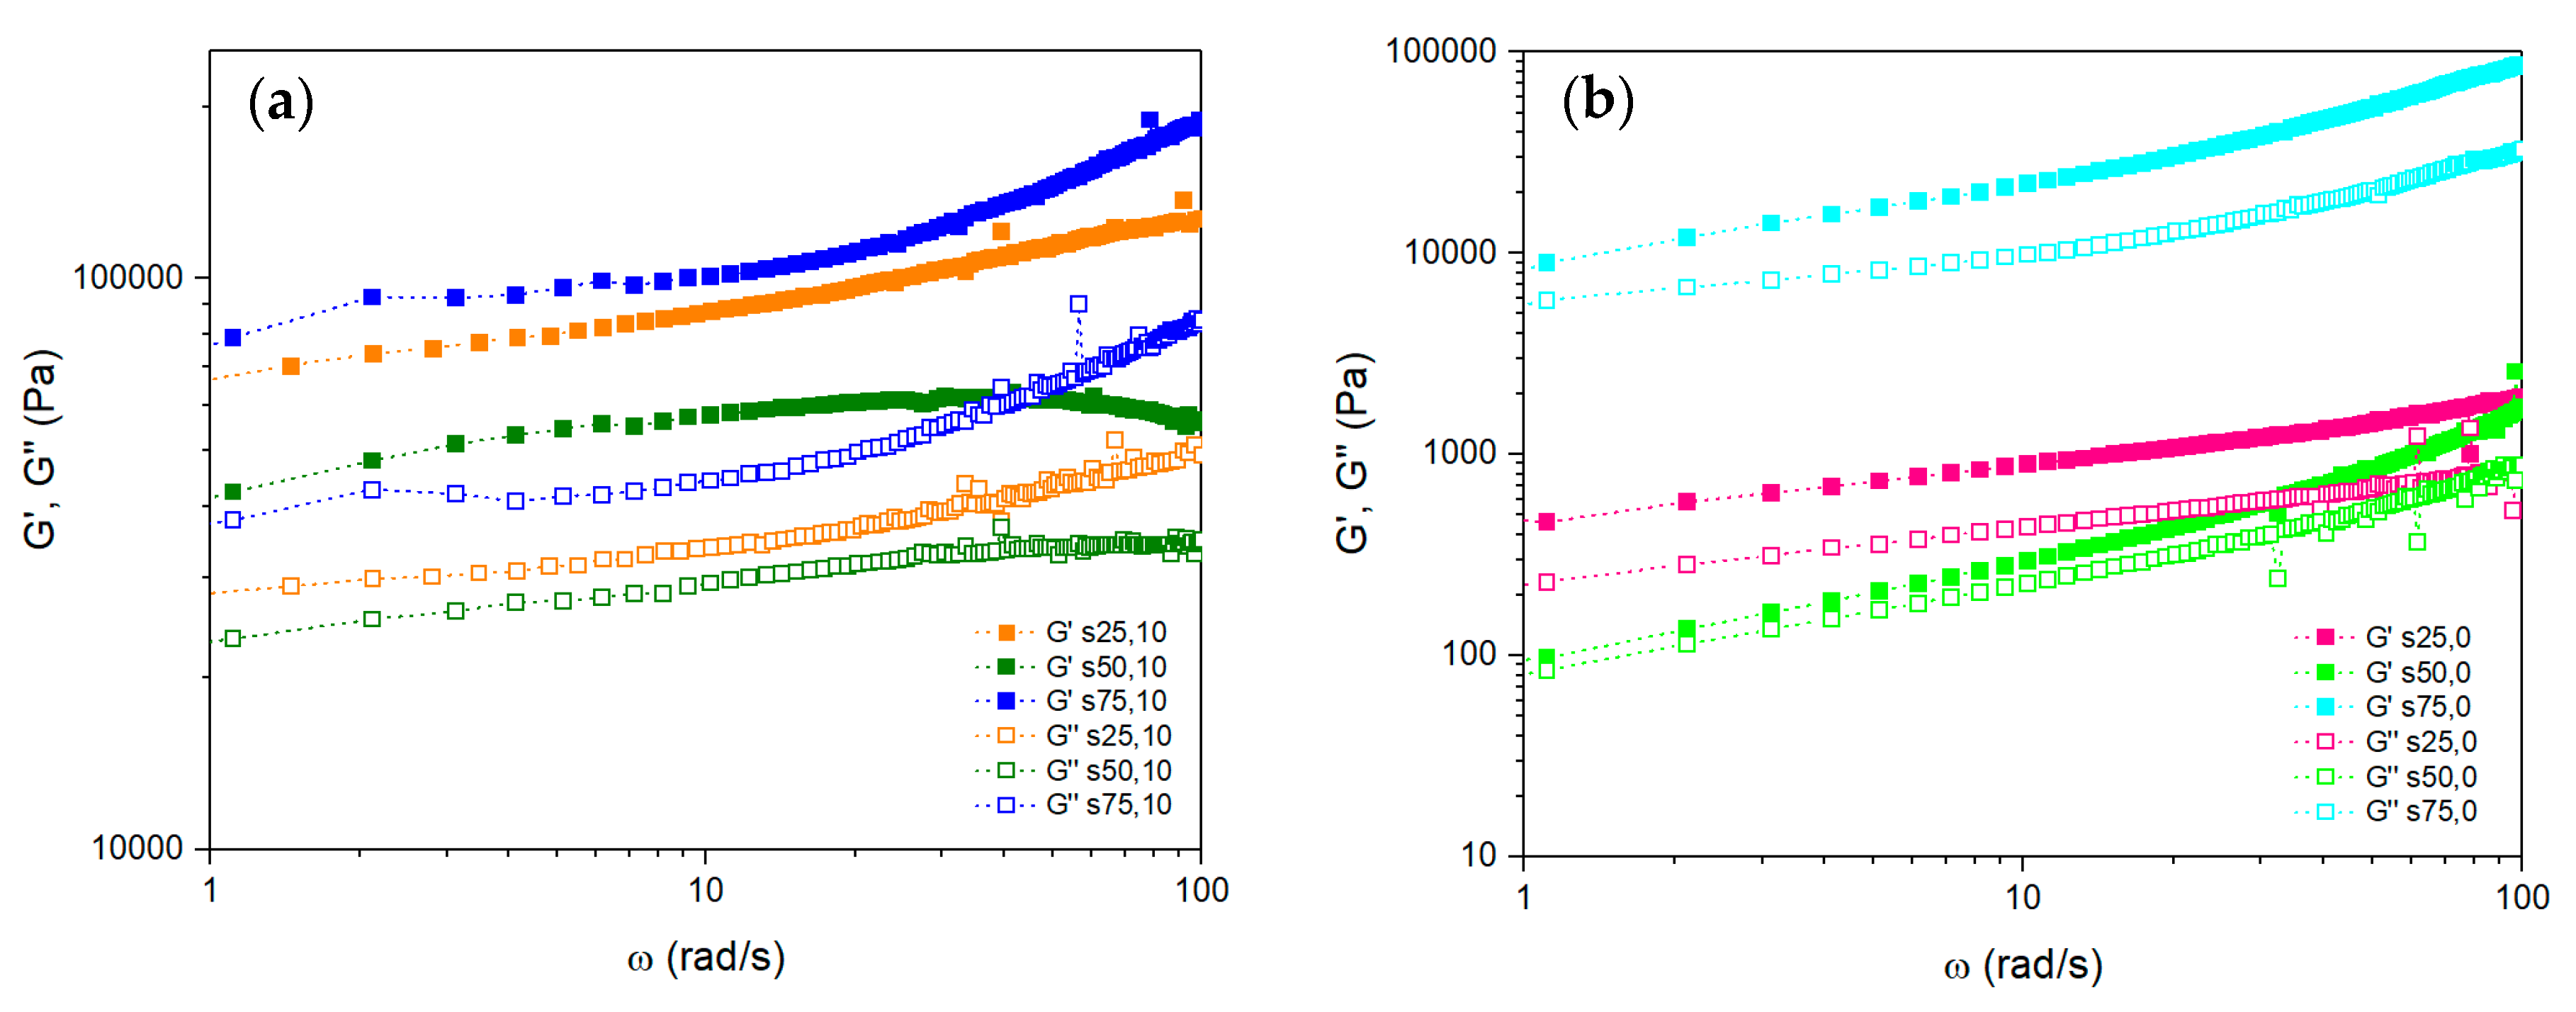
3.1.2. S-Rheological Properties

The oscillatory tests performed on S samples (casein-based adhesive) with (s10) and without (s0) fibers are presented in Figure 5. Consistent with observations from K samples, the incorporation of fibers led to a significant increase in both the storage modulus and the loss modulus, as also observed in [15]. This enhancement indicates that the fibers effectively reinforce the material, improving its elasticity and viscosity. Notably, the S samples exhibit a higher degree of elasticity compared to the K samples. When comparing s0 and s10 samples, the impact of temperature on viscoelastic properties reveals significant differences. In the s10 samples, the presence of fibers provides structural integrity, resulting in a consistent increase in both G′ and G″ across the temperature range. Specifically, at 75 °C, both moduli for the fiber-reinforced S samples remain elevated, especially at higher frequencies. This behavior suggests that the fibers enhance the material’s ability to retain its elastic properties even under thermal stress.
In contrast, s0 samples demonstrate more erratic behavior in response to temperature changes. While an increase in both moduli at 75 °C indicates improved energy storage and dissipation capabilities, the unexpected drop in moduli at 50 °C signifies potential alterations in the material’s internal structure. This could be attributed to factors such as partial curing, which can create rigid regions within the polymer matrix, or phase transitions that impact the polymer’s viscoelastic behavior. At 25 °C, a more solid-like behavior occurs, with a higher storage modulus (G′) compared to the loss modulus (G″), indicating that the material stores energy elastically rather than dissipating it as heat. As the temperature increases, the behavior shifts toward a more fluid-like state, resulting in a decrease in the storage modulus and an increase in the loss modulus, suggesting greater energy dissipation.
For s10 samples, there is an improvement in the elastic modulus across the temperature and frequency range studied, indicating that the fibers help maintain elasticity even as temperature rises. Both K and S suspensions demonstrate viscoelastic behavior with solid-like characteristics, meaning they possess both elastic and viscous properties. This allows the suspensions to store and release energy when deformed, making them resilient and capable of returning to their original state after deformation.
The interaction of hydroxyl (-OH) groups in the casein-based adhesive also plays a crucial role. The reaction between cellulose and casein hydroxyl groups can be represented as follows:
Cellulose-OH + Casein-OHCellulose-OH-O-Casein
This reaction enhances adhesion through hydrogen bonding. Additionally, esterification reactions can occur, where heat facilitates the formation of stable ester linkages, releasing water:
Cellulose-OH + Casein-COOH H e a t Cellulose-O-CO-Casein + H 2 O
The release of water during these reactions can influence the rheological properties, particularly by altering the internal structure and interaction of the adhesive matrix.
As shown in Figure 6, a comparative view of the storage modulus (G′) and loss modulus (G″) for S samples across different temperatures (25 °C, 50 °C, and 75 °C) reveals how the moduli evolve with temperature. Figure 6 presents data for fiber-reinforced S samples (s10) in panel (a), while panel (b) shows data for non-fiber samples (s0). This Figure highlights that at higher temperatures, particularly 75 °C, the fiber-reinforced samples maintained their structure and elasticity better than the non-fiber samples. The fibers appear to mitigate the temperature-induced softening of the adhesive matrix, contributing to more stable mechanical performance under thermal stress.
The S samples, like the K samples, exhibit viscoelastic behavior; however, the S samples show greater elasticity, especially with the inclusion of fibers. The effect of temperature on fiber-free S samples is more complex, with a decrease in moduli at 50 °C, followed by an increase at 75 °C, particularly at higher frequencies. This suggests that the casein-based adhesive may undergo structural changes, such as partial curing or water loss, at elevated temperatures, which could explain the non-linear behavior of the moduli.

3.2. Continuous Rotating Tests

3.2.1. K Samples—Apparent Viscosity and Shear Stress Measurements

The results of continuous rotating tests, as shown in Figure 7, reveal the behavior of apparent viscosity (left Figure 7) and shear stress (right Figure 7) as functions of shear rate for the K samples, both with and without fibers, at different temperatures (25 °C, 50 °C, and 75 °C). All samples exhibit clear shear-thinning behavior, where apparent viscosity decreases with increasing shear rate, which is typical of polymeric and fibrous suspensions [15]. This behavior is advantageous in processes like extrusion and injection molding, where efficient flow under high shear conditions is essential. Shear-thinning occurs because the material’s internal structure resists flow at low shear rates but breaks down under higher forces. All samples show typical non-Newtonian behavior, meaning their viscosity changes with shear rate [24]. As expected, the fiber-reinforced samples (k10) exhibit significantly higher viscosities compared to the non-fiber samples (k0) across all temperatures. For example, at a shear rate of 1 s−1, the apparent viscosity of k25,10 is approximately 300 Pa·s, in stark contrast to about 2 Pa·s for k25,0. This notable difference emphasizes the influence of fibers on the flow behavior, demonstrating increased flow resistance due to the fiber matrix. For the k0 samples (k25,0, k50,0, k75,0), the effect of temperature on viscosity is especially noticeable at lower shear rates, below 1 s−1. At these lower shear rates, the sample at 25 °C (k25,0) exhibits relatively rigid behavior, resulting in higher viscosity due to the stiffness of the polymer network. As the shear rate increases, the viscosity decreases as the matrix begins to deform, which is consistent with typical polymer behavior, where the internal structure starts to break down under shear forces [40]. At 50 °C (k50,0), the matrix softens, leading to a reduced initial viscosity at low shear rates. The viscosity decreases more smoothly with increasing shear, reflecting the enhanced mobility of the polymer chains at this temperature. The observed behavior of the k75,0 sample, where viscosity initially remains high at low shear rates but decreases significantly with shear beyond 1 s−1, may be attributed to a delay in the sample reaching the intended temperature before testing. If the sample does not uniformly achieve the desired temperature, it can lead to inconsistencies in rheological properties. The initial high viscosity could indicate that the polymer chains have not fully relaxed or reorganized at the target temperature, resulting in erratic viscosity measurements as shear rates increase. The subsequent abrupt decrease in viscosity is consistent with anticipated behavior, suggesting that the material transitions to a softer state under shear forces, aligning with typical polymer responses [40]. However, a slightly change occurs at approximately 40 s−1. While the general trend is a decrease in viscosity as shear rate increases—a common characteristic of shear-thinning polymers—this specific inflection point indicates an intriguing transition in the Kappa’s rheological properties. As the shear rate approaches 40 s−1, a slight increase in viscosity is observed before the expected decline continues. This phenomenon can be attributed to the loss of water from the polymer matrix. In water-based adhesives, water acts as a plasticizer, maintaining fluidity and reducing viscosity. As water is lost—either through evaporation or being expelled at higher shear rates—the polymer concentration increases, resulting in enhanced hydrophobic interactions within the polymer matrix [12], which temporarily raise viscosity before these interactions are eventually broken down by continued shear forces.
In fiber-filled samples (k10), the presence of fibers changes the flow dynamics. At 25 °C, the matrix remains rigid, and the fibers are embedded within it, leading to higher viscosity at low shear rates. As shear increases, the fibers align with the flow, leading to a sharp viscosity drop around 100 s−1. At 50 °C, while the matrix softens, fiber alignment is still supported at lower shear rates, though the viscosity drops sharply with increasing shear to a lesser degree than at 25 °C. At 75 °C, the matrix is highly fluid, and although fiber alignment still occurs, the viscosity drop is more gradual, indicating a reduced structural support from the matrix.
The shear stress plot mirrors the trends observed in the apparent viscosity plot. Since apparent viscosity is defined as the ratio of shear stress to shear rate, the behavior of shear stress reflects the changes in viscosity.
For fiber-free samples (k0), shear stress increases steadily with shear rate, which corresponds to a gradual decrease in viscosity. In contrast, fiber-filled samples (k10) exhibit a sharp drop in shear stress around 100 s−1, coinciding with a significant decrease in viscosity due to fiber alignment. At 75 °C, both fiber-free and fiber-filled samples show a reduction in shear stress throughout the test, attributed to the softening of the polymer matrix. In comparison, at lower temperatures (25 °C and 50 °C), the matrix remains more rigid, resulting in higher initial shear stress before the abrupt drop caused by fiber alignment. At elevated temperatures, the impact of the fibers diminishes as the matrix becomes more fluid, leading to smoother transitions in both shear stress and viscosity.
During testing, it was observed that fiber-reinforced samples, particularly k25,10 and k50,10, were expelled from the gap at higher shear rates (Figure 8), just before 100 s−1, likely due to increased rigidity from fiber reinforcement. This expulsion may have contributed to the sharp viscosity drop seen at 100 s−1, alongside fiber alignment reducing flow resistance.
Post-test observations revealed that K samples tested at 50 °C and 75 °C exhibited a decrease in fluidity, leading to the formation of thick films or layers, especially along the edges of the plate zones. As temperature increases, viscosity generally decreases, reducing resistance to flow and making the fluid more prone to forming thick layers in areas of lower shear rates. This behavior can be explained by the power-law model, which relates shear stress (τ) to shear rate ( γ ˙ ) as:
τ = η ×   ( γ ˙ ) n
where η represents viscosity, and n is the flow behavior index, which indicates the degree of shear thinning. The model explains the reduced resistance to flow at higher temperatures, contributing to the formation of thick layers. As temperature increases, the thermal energy of the polymer chains also increases, leading to enhanced molecular mobility. This mobility reduces the intermolecular forces that contribute to viscosity, thereby decreasing the material’s resistance to flow. According to the Arrhenius equation, the viscosity of polymeric materials typically exhibits an exponential dependence on temperature, which can be described by the equation:
η = η 0 e E a R
where η0 is the pre-exponential factor, Ea is the activation energy for flow, R is the universal gas constant, and T is the absolute temperature. This relationship indicates that as temperature increases, viscosity decreases significantly, which aligns with the observations of reduced flow resistance. This behavior is illustrated in post-test observations. Figure 9a shows the sample at 25 °C, where the fluid remains in a liquid state, with no significant signs of thickening. In Figure 9b, the sample tested at 50 °C begins to show fragments and thicker sections, indicating the early stages of film formation. Figure 9c,d depict the sample tested at 75 °C, where pronounced thick layers have developed along the edge zones. Finally, Figure 9e shows the 75 °C sample after testing, where the sample volume has notably reduced, likely due to the formation of thick layers that left less material to fill the gap.

3.2.2. S Samples—Apparent Viscosity and Shear Stress Measurements

The flow behavior of Super (S) samples using the casein-based adhesive was studied under continuous shear conditions. Figure 10, panel (a), illustrates the apparent viscosity as a function of shear rate for various suspensions tested at 25 °C, 50 °C, and 75 °C, with fiber concentrations of 0% and 10%. All tested suspensions exhibit shear-thinning behavior, typical of non-Newtonian fluids.
When comparing suspensions without fibers (s0) to those with fibers (s10), the fiber-free samples consistently show lower viscosities across all shear rates. At low shear rates, the viscosity of the fiber-free suspension ranges from about 10 to 100 Pa·s, while the fiber-containing suspensions reach viscosities between 1000 and 10,000 Pa·s, depending on temperature. This increase in viscosity with fiber addition is likely due to the formation of a fiber network that enhances the suspension’s resistance to flow, particularly at low shear rates where the fibers are more randomly oriented and entangled. As the shear rate increases, the gap in viscosity between fiber-free and fiber-containing suspensions narrows due to fiber alignment in the direction of flow, which reduces overall resistance to deformation and leads to a faster decrease in viscosity for the fiber-containing samples. At higher shear rates (100–1000 s−1), the fiber-free suspensions have viscosities between 1 and 10 Pa·s, whereas the fiber-containing samples remain higher, ranging between 10 and 100 Pa·s. The fiber-containing suspensions demonstrate a steeper decline in viscosity with increasing shear rate, likely due to shear-induced disruption of fiber networks.
Temperature significantly impacts viscosity, as suspensions tested at 25 °C consistently exhibit higher apparent viscosities than those tested at 50 °C and 75 °C. For instance, at low shear rates, the viscosity of the 25 °C suspension is around 10,000 Pa·s, while at 50 °C and 75 °C, the viscosities drop to approximately 1000 Pa·s and 500 Pa·s, respectively. The fiber-free samples experience a pronounced decrease in viscosity at 75 °C. This reduction can be attributed to thermal effects on the protein ratio of the casein matrix [41] and fiber dynamics. As a thermosensitive protein, casein undergoes changes in its molecular structure with rising temperatures, leading to protein unfolding or partial denaturation. This process weakens the internal network formed by casein micelles, enhancing fluidity. Additionally, higher temperatures reduce the viscosity of the suspending fluid, contributing to lower apparent viscosity at 50 °C and 75 °C. As shear rates increase, the viscosity of all suspensions decreases, but the differences between temperatures become less pronounced. At shear rates around 100 s−1, the viscosity of the 25 °C suspension is about 50 Pa·s, while it is roughly 20 Pa·s for suspensions at 50 °C and 75 °C. The 25 °C suspension exhibits the steepest decline in viscosity, indicating that lower temperatures maintain a stronger protein network within the casein matrix, which is more sensitive to shear rate changes.
An anomaly occurs in the suspension s50,10, where a slight increase in viscosity is observed between shear rates of approximately 50 to 500 s−1. This behavior contrasts with other samples, which continue to show decreasing viscosity. This phenomenon could result from temporary fiber–fiber or fiber–fluid interactions, leading to a local increase in resistance to flow. At this temperature, the casein matrix may also contribute to restructuring around the fibers, causing a local increase in viscosity before being disrupted or fully aligned at higher shear rates.
At 25 °C, the behavior of s25,10 shows an unusual trend, with viscosity experiencing an abrupt drop around a shear rate of 100 s−1, which differs from the gradual decreases observed in other samples. This sharp transition raises questions about the factors driving this response at a lower temperature. One possible explanation is the interaction between the fibers and the matrix. At 25 °C, the matrix remains more rigid due to lower thermal activation, while the 10% fiber content forms a network that initially increases viscosity. However, as the shear rate reaches a critical point, this fiber–matrix network may break down suddenly, leading to an abrupt drop in viscosity. The sharp decline could be due to the fibers aligning with the flow or weakening fiber–matrix bonds. Alternatively, localized phase separation may occur, where fibers and matrix maintain stable interactions at lower shear rates, but the interaction weakens or disrupts beyond a certain shear rate, resulting in a rapid reduction in viscosity. This could also indicate the material reaching a yield point, where the internal structure can no longer withstand applied shear forces.
Considering s75,0, a distinct pattern of viscosity behavior is observed across the shear rate range. This sample exhibits a steady decline in viscosity, with unique characteristics. Between approximately 0.8 and 3 s−1, viscosity plateaus around 30 Pa·s, indicating that the casein matrix retains some structural integrity and resists deformation under low shear forces. This plateau may be due to molecular interactions within the casein matrix, maintaining stability against significant flow. After 3 s−1, viscosity drops sharply to about 2 Pa·s, followed by another plateau until around 10 s−1. This sudden decrease suggests a breakdown in the molecular network, allowing casein molecules to align more easily with shear forces. Despite this breakdown, the secondary plateau between 3 and 10 s−1 indicates residual molecular interactions within the casein matrix, possibly due to the protein’s structural properties that resist further flow even after some rearrangement [20]. Beyond 10 s−1, viscosity declines more gradually, indicating continued deformation of the matrix at a slower rate. The behavior of s75,0 at elevated temperatures can be explained by increased molecular mobility of casein, enhancing the flexibility of the protein network and facilitating its response to shear forces.
The shear stress plot (Figure 10b) confirms the trends observed in the apparent viscosity plot. In most samples, shear stress increases consistently with shear rate, characteristic of shear-thinning behavior. The exception is the s75,0 sample, where shear stress initially decreases at lower shear rates (around 3 s−1) before rising again, suggesting that the casein matrix softens at 75 °C, leading to temporary structural disruption, which recovers as flow rate increases, possibly due to matrix realignment.
In the S0 samples, such as s25,0, s50,0, and s75,0, the casein matrix shows a gradual increase in shear stress with shear rate at 25 °C and 50 °C, indicating resistance to deformation. However, at 75 °C, the casein softens, leading to a temporary drop in shear stress at lower shear rates, followed by recovery as shear rates rise. This behavior is consistent with the thermal sensitivity of casein, which tends to lose structural integrity at higher temperatures, causing a reduction in resistance to flow.
In the s10 fiber-reinforced samples, fibers lead to higher shear stress across all shear rates compared to fiber-free samples. This is particularly evident in s25,10 and s50,10, where fibers reinforce the casein matrix, enhancing flow resistance. Even at 75 °C, the s75,10 sample still shows increased shear stress with rising shear rates, although overall stress values are lower than at cooler temperatures, reflecting reduced influence of fibers as the matrix softens.
Generally, shear stress decreases as temperature rises, particularly in s0 samples, with the most pronounced softening observed in s75,0. In fiber-reinforced samples, however, the impact of temperature is less severe, indicating that fibers help maintain structural integrity even as the matrix becomes more fluid. Although the casein matrix softens at higher temperatures, the presence of fibers mitigates the sharp decline in shear stress seen in fiber-free samples, especially at 75 °C, highlighting the stabilizing role of fibers in maintaining flow resistance under thermal stress.

3.2.3. Comparison of S and K Samples

The comparison between Super (S) samples and Kappa (K) samples highlights distinct differences in temperature sensitivity, fiber–matrix interactions, and structural characteristics due to the use of different adhesives: casein in S samples and a water-based adhesive in K samples. Both sample types exhibit shear-thinning behavior, where viscosity decreases with increasing shear rate. However, S samples demonstrate a higher sensitivity to temperature changes, particularly in fiber-free systems.
In the s0 samples, the effect of temperature is pronounced. At 25 °C, viscosity decreases gradually, like k0 samples; however, it drops sharply at 50 °C and 75 °C, indicating less thermal stability compared to the K samples. The casein matrix in S samples has an amorphous structure, characterized by a lack of crystallinity and a flexible arrangement of protein chains. This amorphous nature leads to significant softening at elevated temperatures, resulting in a rapid loss of structural integrity under shear. As temperature increases, the hydration and conformational changes in casein contribute to its decreased viscosity and cohesive strength.
For the s25,10 samples, a sudden viscosity drop occurs around 100 s−1, likely due to fiber alignment or matrix instability. In contrast, k25,10 samples display a more gradual decrease in viscosity, reflecting a more resilient fiber–matrix structure, primarily due to the stabilizing effects of the water-based adhesive. This adhesive creates a cross-linked network with the fibers, enhancing the overall integrity and load-bearing capacity of the K samples. In addition, the hydrophilic nature of the water-based adhesive helps maintain moisture, further supporting the fiber–matrix interactions and reducing brittleness.
The fiber reinforcement in s10 samples initially increases viscosity at 25 °C, but this advantage diminishes at higher temperatures, where the casein matrix transitions to a fluid-like state. The amorphous structure of the casein becomes less capable of maintaining cohesion under thermal stress, leading to a breakdown in the fiber–matrix interaction. Conversely, k10 samples maintain better viscosity retention across shear rates due to their stable structure, while s10 samples suffer more severe viscosity losses at 75 °C. This suggests that the casein adhesive in S samples struggles under heat and shear compared to the more stable water-based adhesive in K samples, which exhibit gradual viscosity reductions and improved shear resistance.
Gap-related effects in s10 samples, as highlighted in Figure 11, reveal critical structural breakdown due to fiber–matrix network disruption under applied shear forces. The amorphous nature of the casein structure lacks the robustness seen in the K samples, making it more susceptible to deformation and failure under stress. This disruption is also observed in fiber-free S samples (Figure 11a), which lack structural reinforcement, complicating their ability to consistently fill gaps. In contrast, K samples, reinforced with fibers and stabilized by the water-based adhesive, benefit from a more cohesive and elastic matrix. This allows them to better resist shear forces, maintaining viscosity and structural cohesion.
The formation of thick films during tests conducted at 50 °C and 75 °C in S samples is another critical observation, as depicted in Figure 11c. The casein matrix softens at elevated temperatures, leading to film formation, which aligns with decreased flow resistance as temperature rises. The less structured and amorphous casein matrix fails to provide the necessary support to the fibers, resulting in films that can easily deform and lose functionality. K samples demonstrate better resistance to these changes, with fiber reinforcement helping to maintain a more structured matrix and reducing the extent of film formation compared to S samples.
The drying effect observed at higher temperatures further compounds the challenges in S samples. As shown in Figure 12, the S series samples take on a dried appearance as water evaporates during testing. This water loss results in diminished adhesive flexibility and increased brittleness, complicating gap filling. The less hydrophilic nature of the casein matrix exacerbates this issue, as it becomes more brittle and prone to cracking when dehydrated. In contrast, K samples, while also affected by water loss, demonstrate better retention of flow properties due to the flexibility and adhesive characteristics of the water-based adhesive, ensuring smoother gap-filling behavior.

4. Conclusions

The incorporation of fibers from Hedychium gardnerianum significantly enhances the viscoelastic properties of both Kappa (Coplaseal®) and Super (casein-based) adhesive matrices. Rheological analysis demonstrated that fiber-reinforced samples exhibited increased storage (G′) and loss moduli (G″), indicating improved elastic and viscous behavior compared to fiber-free samples. The results highlight the potential of utilizing invasive plant species to create sustainable biocomposites with enhanced mechanical properties.
Temperature played a crucial role in the rheological behavior of the samples. While fiber-free Kappa samples showed stable viscosity across a range of temperatures, fiber-reinforced samples experienced a slight decrease in viscosity as temperature increased from 25 °C to 75 °C. Conversely, Super samples displayed a decrease in viscosity with increasing temperature, suggesting that shear rate effects may dominate over temperature influences on viscosity. Additionally, the molecular interactions between fibers and adhesives, particularly the hydrogen bonding in the casein system, significantly influence the rheological properties of the biocomposites.
Continuous tests confirmed the shear-thinning flow behavior of the suspensions, which is advantageous for processing techniques such as extrusion and injection molding. The findings underscore the importance of fiber content and adhesive type in shaping the rheological properties of biocomposites, indicating that careful formulation can optimize material performance for specific applications.
Challenges related to curing and water release during testing were also noted, indicating complexities in processing these biocomposite materials. Understanding these factors is essential for optimizing formulations and processing methods.
This study highlights the effectiveness of Hedychium gardnerianum fibers in reinforcing biocomposite matrices, demonstrating enhanced rheological performance and potential for various sustainable applications. Future research should explore the effect of extreme temperature and humidity conditions on these biocomposites to better understand their performance in real-world applications. Additionally, examining the influence of fiber morphology and alternative invasive plant fibers could yield opportunities for optimizing fiber-reinforced biocomposites. Future action lines should also include investigating the durability and mechanical properties of these materials under diverse environmental conditions, as well as exploring their potential applications in various industries, which could pave the way for broader adoption.

Author Contributions

Conceptualization, H.C.V., R.A. and T.E.; methodology, H.C. and M.G.M.; software, H.C.; investigation, H.C.V. and H.C.; data curation, H.C.; writing—original draft preparation, M.G.M., R.Ö. and T.E.; writing—review and editing, H.C.V., R.Ö. and T.E. All authors have read and agreed to the published version of the manuscript.

Funding

This research received no external funding.

Data Availability Statement

No new data were created or analyzed in this study. Data sharing is not applicable to this article.

Acknowledgments

The authors dedicate this work to Teresa Cidade, distinguished researcher at CENIMAT and Professor at FCT-NOVA (Portugal). We express our deepest gratitude for her unwavering support, insightful discussions, and the numerous opportunities she provided throughout the development of this research. Her contributions were truly invaluable, and it is with great respect that we dedicate this work to her memory.

Conflicts of Interest

Author Roberto Amorim was employed by the company Cooperativa União Agrícola (CUA). The remaining authors declare that the research was conducted in the absence of any commercial or financial relationships that could be construed as a potential conflict of interest.

References

  1. Bledzki, A.K.; Gassan, J. Composites reinforced with cellulose based fibres. Prog. Polym. Sci. 1999, 24, 221–274. [Google Scholar] [CrossRef]
  2. Baghaei, B.; Skrifvars, M. All-Cellulose Composites: A review of recent studies on structure, properties and applications. Molecules 2020, 25, 2836. [Google Scholar] [CrossRef]
  3. Precedence Research. Biocomposites Market Size, Share, Growth, Report 2023–2032. 2023. Available online: https://www.precedenceresearch.com/biocomposites-market (accessed on 6 October 2024).
  4. Eleutério, T.; Pinto, A.S.; Pereira, M.J.; Vasconcelos, H.C. Preliminary structural and thermal characterization of Conteira’s (Hedychium gardnerianum) fibers for further functionalization with silica colloidal nanoparticles. Procedia Eng. 2017, 200, 162–169. [Google Scholar] [CrossRef]
  5. Eleutério, T.; Pereira, M.J.; Vasconcelos, H.C. Effect of extraction method on physicochemical characteristics of Kahili ginger (Hedychium gardnerianum) fibres. Mater. Sci. Nanotechnol. 2018, 2, 1–4. [Google Scholar] [CrossRef]
  6. Vasconcelos, H.C.; Eleutério, T. Sustainable materials for advanced products. In Handbook of Sustainability Science in the Future; Springer International Publishing: Berlin/Heidelberg, Germany, 2022; pp. 1–17. [Google Scholar] [CrossRef]
  7. Zima, V.; Zetková, K.; Hausner, D.; Toufar, M.; Horáková, R.; Vasconcelos, H.C.; Eleutério, T.; Cabal, B. Polylactic acid composites with vegetable fibers for applications in packaging industry (presentation at the “Czech Idea Heading to the World” seminar organized by TAČR). In Plastko 2022, Proceedings of the Conference Univerzita Tomáše Bative Zlíně, Zlín, Czech Republic, 21–22 September 2022; Univerzita Tomáše Bative Zlíně: Zlín, Czech Republic, 2022; pp. 21–22. ISBN 978-80-7678-096-5. [Google Scholar]
  8. Eleutério, T.; Sério, S.; Teodoro, O.M.N.D.; Bundaleski, N.; Vasconcelos, H.C. XPS and FTIR studies of DC reactive magnetron sputtered TiO2 thin films on natural based-cellulose fibers. Coatings 2020, 10, 287. [Google Scholar] [CrossRef]
  9. Satyanarayana, K.G.; Arizaga, G.G.C.; Wypych, F. Biodegradable composites based on lignocellulosic fibers—An overview. Prog. Polym. Sci. 2009, 34, 982–1021. [Google Scholar] [CrossRef]
  10. Zhou, Y.; Fan, M.; Chen, L. Interface and bonding mechanisms of plant fibre composites: An overview. Compos. Part B Eng. 2016, 101, 31–45. [Google Scholar] [CrossRef]
  11. Sridhara, P.K.; Vilaseca, F. Assessment of Fiber Orientation on the Mechanical Properties of PA6/Cellulose Composite. Appl. Sci. 2020, 10, 5565. [Google Scholar] [CrossRef]
  12. Delgado, J.F.; Bovi, J.; Foresti, M.L.; Bernal, C. All-cellulose composites derived from natural plant fibers. Mater. Res. Found. 2022, 122, 1–36. [Google Scholar] [CrossRef]
  13. Marcuello, C.; Chabbert, B.; Berzin, F.; Bercu, N.B.; Molinari, M.; Aguié-Béghin, V. Influence of Surface Chemistry of Fiber and Lignocellulosic Materials on Adhesion Properties with Polybutylene Succinate at Nanoscale. Materials 2023, 16, 2440. [Google Scholar] [CrossRef]
  14. Etale, A.; Onyianta, A.J.; Turner, S.R.; Eichhorn, S.J. Cellulose: A review of water interactions, applications in composites, and water treatment. Chem. Rev. 2023, 123, 2016–2048. [Google Scholar] [CrossRef]
  15. Agoda-Tandjawa, G.; Durand, S.; Berot, S.; Blassel, C.; Gaillard, C.; Garnier, C.; Doublier, J.L. Rheological characterization of microfibrillated cellulose suspensions after freezing. Carbohydr. Polym. 2010, 80, 677–686. [Google Scholar] [CrossRef]
  16. Hodzic, A.; Shanks, R. (Eds.) Natural Fibre Composites: Materials, Processes and Properties; Woodhead Publishing Series in Composites Science and Engineering; Elsevier Science: Cambridge, UK, 2013; 408p, ISBN 0857095242/9780857095244. [Google Scholar]
  17. Borchani, K.E.; Carrot, C.; Jaziri, M. Rheological behavior of short Alfa fibers reinforced Mater-Bi® biocomposites. Polym. Test. 2019, 77, 105895. [Google Scholar] [CrossRef]
  18. Zeng, Y.; Xu, P.; Yang, W.; Chu, H.; Wang, W.; Dong, W.; Chen, M.; Bai, H.; Ma, P. Soy protein-based adhesive with superior bonding strength and water resistance by designing densely crosslinking networks. Eur. Polym. J. 2021, 142, 110128. [Google Scholar] [CrossRef]
  19. Melnychuk, M.; Malets, V.; Sosnowski, M.; Mykhaylyuk, I.; Boyarska, I. Preparation and characterization of a biocomposite based on casein and cellulose. In Advances in Design, Simulation and Manufacturing IV; DSMIE 2021. Lecture Notes in Mechanical Engineering; Ivanov, V., Trojanowska, J., Pavlenko, I., Zajac, J., Peraković, D., Eds.; Springer: Cham, Switzerland, 2021; pp. 555–561. [Google Scholar] [CrossRef]
  20. Bhaskar, R.; Zo, S.M.; Narayanan, K.B.; Purohit, S.D.; Gupta, M.K.; Han, S.S. Recent development of protein-based biopolymers in food packaging applications: A review. Polym. Test. 2023, 124, 108097. [Google Scholar] [CrossRef]
  21. Vahid, S.; Burattini, V.; Afshinjavid, S.; Dashtkar, A. Comparison of rheological behaviour of bio-based and synthetic epoxy resins for making ecocomposites. Fluids 2021, 6, 38. [Google Scholar] [CrossRef]
  22. Boronat, T.; Seguí, V.J.; Peydro, M.A.; Reig, M.J. Influence of temperature and shear rate on the rheology and processability of reprocessed ABS in injection molding process. J. Mater. Process. Technol. 2009, 209, 2735–2745. [Google Scholar] [CrossRef]
  23. Iotti, M.; Gregersen, Ø.; Moe, S.; Lenes, M. Rheological studies of microfibrillar cellulose water dispersions. J. Polym. Environ. 2011, 19, 137–145. [Google Scholar] [CrossRef]
  24. Schmid, C.F.; Klingenberg, D.J. Mechanical flocculation in flowing fiber suspensions. Phys. Rev. Lett. 2000, 84, 290–293. [Google Scholar] [CrossRef]
  25. Nelson, A.Z.; Schweizer, K.S.; Rauzan, B.M.; Nuzzo, R.G.; Vermant, J.; Ewoldt, R.H. Designing and transforming yield-stress fluids. Curr. Opin. Solid State Mater. Sci. 2019, 23, 100758. [Google Scholar] [CrossRef]
  26. Mukherjee, T.; Czaka, M.; Kao, N.; Gupta, R.K.; Choi, H.J.; Bhattachary, S. Dispersion study of nanofibrillated cellulose based poly(butylene adipate-co-terephthalate) composites. Carbohydr. Polym. 2014, 102, 537. [Google Scholar] [CrossRef] [PubMed]
  27. Hadjadj, A.; Jbara, O.; Tara, A.; Gilliot, M.; Malek, F.; Maafi, E.M.; Tighzert, L. Effects of cellulose fiber content on physical properties of polyurethane based composites. Compos. Struct. 2016, 135, 217–223. [Google Scholar] [CrossRef]
  28. Dasore, A.; Manohar, P.; Paliwal, D.K.; Chauhan, S.R.; Kumar, A. An overview of refinements, processing methods and properties of natural fiber composites. Mater. Today Proc. 2022, 49, 296–300. [Google Scholar] [CrossRef]
  29. Ciência Viva. (n.d.). Protein Glue. Available online: https://webstorage.cienciaviva.pt/public/pt.cienciaviva.io/recursos/files/protein_glue_13768318185eb1.pdf (accessed on 10 October 2024).
  30. Baiardo, M.; Zini, E.; Scandola, M. Flax fibre–polyester composites. Compos. Part A Appl. Sci. Manuf. 2004, 35, 703–710. [Google Scholar] [CrossRef]
  31. Amrutha, S.R.; Rejimon, P.K.; Suja, N.R.; Mart, A. Thermal properties of biopolymers. In Handbook of biopolymers; Thomas, S., AR, A., Jose Chirayil, C., Thomas, B., Eds.; Springer: Singapore, 2023; pp. 455–473. [Google Scholar] [CrossRef]
  32. TA INSTRUMENTS. Rheological Properties of Polymers. Available online: https://www.tainstruments.com/pdf/literature/RH064.pdf (accessed on 29 October 2024).
  33. Malkin, A.Y.; Derkach, S.R.; Kulichikhin, V.G. Rheology of gels and yielding liquids. Gels 2023, 9, 715. [Google Scholar] [CrossRef]
  34. Larson, R.G. The structure and Rheology of Complex Fluids; Oxford University Press: New York, NY, USA, 1999. [Google Scholar]
  35. Nair KC, M.; Kumar, R.P.; Thomas, S.C.; Schit, K.; Ramamurthy, K. Rheological behavior of short sisal fiber-reinforced polystyrene composites. Compos. Part A Appl. Sci. Manuf. 2000, 31, 1231–1240. [Google Scholar] [CrossRef]
  36. Madera-Santana, T.J.; Drzal, L.T.; Robledo, D.; Freile-Pelegrin, Y. Preparation and characterization of biodegradable agar/poly(butylene adipate-co-terephthalate) composites. Polym. Eng. Sci. 2009, 49, 1117–1124. [Google Scholar] [CrossRef]
  37. Foruzanmehr, M.; Vuillaume, P.Y.; Elkoun, S.; Robert, M. Physical and mechanical properties of PLA composites reinforced by TiO2 grafted flax fibers. Mater. Des. 2016, 106, 295–304. [Google Scholar] [CrossRef]
  38. Nayak, S.; Mohanty, J.R. Study of mechanical, thermal, and rheological properties of areca fiber-reinforced polyvinyl alcohol composite. J. Nat. Fibers 2018, 16, 688–701. [Google Scholar] [CrossRef]
  39. Shenoy, A.V. Rheology of Filled Polymer Systems; Kluwer Academic Publishers: London, UK, 1999. [Google Scholar] [CrossRef]
  40. Kamal, M.R.; Khoshkava, V. Effect of cellulose nanocrystals (CNC) on rheological and mechanical properties and crystallization behavior of PLA/CNC nanocomposites. Carbohydr. Polym. 2015, 123, 105–114. [Google Scholar] [CrossRef]
  41. Warncke, M.; Kieferle, I.; Nguyen, T.M.; Kulozik, U. Impact of heat treatment, casein/whey protein ratio and protein concentration on rheological properties of milk protein concentrates used for cheese production. J. Food Eng. 2022, 312, 110745. [Google Scholar] [CrossRef]
Figure 1. SEM micrograph of mechanically extracted fiber from the stems of the Kahili ginger plant (Hedychium gardnerianum).
Compounds 04 00042 g001
Figure 2. (a) Long Hedychium gardnerianum fibers (>10 cm); (b) short Hedychium gardnerianum fibers (between 0.2 and 5 mm).
Compounds 04 00042 g002
Figure 3. Oscillatory tests for k0 and k10 at different temperatures: (a) 25 °C, (b) 50 °C, and (c) 75 °C. Each graph, with logarithmic scales on both axes, displays storage modulus (G′) and loss modulus (G″) as functions of angular frequency (ω) in rad/s.
Compounds 04 00042 g003
Figure 4. Comparison of the storage modulus (G′) and loss modulus (G″) of Kappa samples across different temperatures (25, 50, and 75 °C). Panel (a) shows data for Kappa samples with fibers (k10), while panel (b) displays data for Kappa samples without fibers (k0). Note: Error bars are not plotted here for simplicity.
Compounds 04 00042 g004
Figure 5. Oscillatory tests for s0 and s10 at different temperatures: (a) 25 °C, (b) 50 °C, and (c) 75 °C. Each graph, with logarithmic scales on both axes, displays the storage modulus (G′) and the loss modulus (G″) as functions of angular frequency (ω) in rad/s.
Compounds 04 00042 g005
Figure 6. Comparison of the storage modulus (G′) and loss modulus (G″) of Super samples across different temperatures (25, 50, and 75 °C). Panel (a) shows data for Super samples with fibers (s10), while the panel (b) displays data for Super samples without fibers (s0). Note: Error bars are not plotted here for simplicity.
Compounds 04 00042 g006
Figure 7. Continuous tests of K samples, without fibers and with 10% fibers, at different temperatures (25 °C, 50 °C, and 75 °C): Apparent viscosity (a); shear stress (b).
Compounds 04 00042 g007
Figure 8. End of continuous test for k25,10. Expulsion of the sample from the gap is observed.
Compounds 04 00042 g008
Figure 9. Post-rheological test observations of K samples at different temperatures: (a) Sample at 25 °C showing a liquid state without significant thickening; (b) sample at 50 °C with visible thick layer formation beginning to occur; (c) sample at 75 °C showing substantial film formation along edge zones; (d) another view of 75 °C sample, highlighting more pronounced thick layers at edges; (e) sample tested at 75 °C showing reduced volume after testing due to thick layer formation.
Compounds 04 00042 g009
Figure 10. Continuous tests S samples, without fibers and with 10% fibers at different temperatures (25, 50, and 75 °C): (a) viscosity; (b) shear stress.
Compounds 04 00042 g010
Figure 11. (a) Fiber-free S samples at 25 °C after rotational test with gap leak; (b) fiber-free S samples at 75 °C following oscillatory test; (c) fiber-free S samples at 50 °C after rotational testing.
Compounds 04 00042 g011
Figure 12. S sample with fibers after an oscillatory test at 50 °C.
Compounds 04 00042 g012
Table 1. Nomenclature used to reference each sample, indicating the temperature (of tests performed) and percentage of fibers present in each.
Nomenclature of S SamplesNomenclature of K Samples
s25 0Super with 0% fibers at 25 °Ck25 0Kappa with 0% fibers at 25 °C
s25 10Super with 10% fibers at 25 °Ck25 10Kappa with 10% fibers at 25 °C
s50 0Super with 0% fibers at 50 °Ck50 0Kappa with 0% fibers at 50 °C
s50 10Super with 10% fibers at 50 °Ck50 10Kappa with 10% fibers at 50 °C
s75 0Super with 0% fibers at 75 °Ck75 0Kappa with 0% fibers at 75 °C
s75 10Super with 10% fibers at 75 °Ck75 10Kappa with 10% fibers at 75 °C
Disclaimer/Publisher’s Note: The statements, opinions and data contained in all publications are solely those of the individual author(s) and contributor(s) and not of MDPI and/or the editor(s). MDPI and/or the editor(s) disclaim responsibility for any injury to people or property resulting from any ideas, methods, instructions or products referred to in the content.

