Review

Vibrational Spectroscopies for Investigating Structural and Biochemical Modifications Induced in Hard Dental Tissues by Femtosecond Laser Ablation: A Brief Review

1
Dipartimento di Medicina Sperimentale, Università della Campania “L. Vanvitelli”, Via S. Maria di Costantinopoli 16, 80138 Napoli, Italy
2
Dipartimento di Scienze Ecologiche e Biologiche, Università della Tuscia, 01100 Viterbo, Italy
3
Dipartimento di Scienze Odontostomatologiche e Maxillo Facciali, Università di Roma “La Sapienza”, Via Caserta, 00161 Roma, Italy
*
Author to whom correspondence should be addressed.
Compounds 2024, 4(4), 587-603; https://doi.org/10.3390/compounds4040036
Submission received: 16 July 2024 / Revised: 16 September 2024 / Accepted: 30 September 2024 / Published: 3 October 2024

Abstract

:
In recent years, the femtosecond laser ablation of hard dental tissues has stimulated great interest in preparing accurate and reproducible dental cavities. Many studies on the changes induced in the surface morphology, structure, and composition of human teeth have been performed using various advanced experimental techniques. Vibrational spectroscopies such as Fourier transform infrared (FT-IR) and Raman spectroscopy have been adopted for obtaining precise information about changes induced by femtosecond laser ablation in human teeth. Their two main components, dentin and enamel, have been carefully investigated. The analysis of the vibrational spectra has allowed for the identification of the optimal working parameters for efficient laser ablation processes. In the present review, a brief description of the abovementioned vibrational techniques is reported, and the principal results obtained by these two vibrational spectroscopies in the study of femtosecond laser ablated teeth are summarized and analyzed.

1. Introduction

Rotary instruments have been used for cavity preparation and caries removal since the dawn of operative dentistry. Advances in new materials and techniques that enable minimally invasive dentistry no longer allow for cavity extension. Lasers have become a valuable tool in dentistry and are currently used to eliminate tooth decay in the treatment of dentin and enamel. In this framework, the use of laser to ablate damaged or undesired tooth material represents a very powerful candidate to ameliorate dentin cavity preparation. Laser ablation is a process that aims to remove a certain quantity of material from a sample by means of the direct absorption of laser energy [1]. The possibility to use this method for application in dentistry has been envisaged for many years. Lasers with different characteristics have been used for this purpose [2] since laser pulse duration plays a key role in the mechanism of interaction between the light and the hard dental tissue. When long-duration laser pulses are used, the dissipation of the absorbed energy in the samples and material removal occur during the laser pulse. Pulse shortening minimizes the effects of heating and allows the introduction of new mechanisms such as plasma-mediated ablation, which differs from the thermal ablation employed by conventional lasers due to the almost total absence of thermal effects, which translates into a notable increase in the precision and quality of the tissue ablation. When femtosecond laser pulses are used, a high peak power is delivered to the samples in a very short time. In this case, the heat diffusion within the samples is negligible. The exact description of femtosecond laser ablation processes is challenging as many physical phenomena take place at the same time. In the solid phase of samples, phonon–phonon, electron–phonon, and phonon-lattice interactions, as well as heat transfer modalities, should be considered. Furthermore, the processes of chemical transformations of the material to be removed and hydrodynamic flows should be considered [3]. When femtosecond lasers are used, the mechanism basically consists of the ionization, through non-linear processes, of atoms or molecules on the surface of the irradiated material, which form a dense plasma that expands upon completion of the pulse (with a duration of the order of 100 fs) without having time to diffuse the heat into the solid material (which requires pulses of the order of tens of picoseconds), resulting in the removal of the dental hard tissue with very little heating. In this case, two competing mechanisms are responsible for the ablation process: the Coulomb explosion and thermal vaporization [3]. The Coulomb explosion is more relevant when the laser intensity is near the ablation threshold value. When the laser intensity is higher than the ablation threshold, after the Coulomb explosion, thermal vaporization occurs in the sample, and this effect becomes the most relevant for material removal.
The identification of the best operation conditions for precise and efficient cavity preparation in teeth has been the object of different papers aimed at revising the different available procedures [4,5,6]. These studies have focused on the study of laser ablation conditions for the two principal tooth components: enamel and dentin. Enamel is the hardest tissue in the human body and contains the highest percentage of minerals equal to 96% (w/w) and a 4% (w/w) of organic material. The most important mineral is hydroxyapatite (HA), constituted by crystalline calcium phosphate with hexagonal crystals (70 nm width and 30 nm thickness). The crystals are arranged in prismatic and interprismatic structures. The organic material is mainly constituted by lipids, proteins, and water. This is located in the empty spaces between HA crystals. Dentin is constituted by 70% (w/w) of inorganic material, 20% (w/w) of organic material (mainly type 1 collagen), and 10% (w/w) of water [7,8,9,10].
Many different characterization techniques have been adopted for evidencing the changes induced in hard dental tissues using ablation processes. The most used are optical microscopy [11,12,13], scanning electron microscopy [14,15], X-ray diffraction methods [16], X-ray photoelectron spectroscopy [17,18], energy dispersive X-ray spectroscopy [12,19], 3-D line scanning [20], and optical coherence tomography [21]. These techniques have contributed to clarifying different aspects of the interaction among femtosecond laser beams and dentin and enamel.
X-ray diffraction (XRD) methods and X-ray photoelectron (XPS) spectroscopy are generally used to characterize the constituents of ablated surfaces. Some researchers have exploited the potentialities of vibrational techniques for monitoring the changes induced in dentin and enamel by femtosecond laser ablations. Among vibrational techniques, Fourier transform infrared (FT-IR) and Raman spectroscopies represent the most used techniques, allowing a complementary approach.
In this short review, the most significant results obtained by the abovementioned techniques in the field of femtosecond laser ablation of dentin and enamel are analyzed. To retrieve lists of potential articles to be included in the review, the search strategy included the following databases up to June 2024: Scopus, PubMed, Web of Knowledge, and Google Scholar. To identify relevant records, the search encompassed terms including ‘vibrational spectroscopies’, ‘Raman spectroscopy’, micro-Raman spectroscopy’, ‘infrared spectroscopy’, ‘Fourier-Transform infrared spectroscopy’, AND ‘femtosecond laser ablation’, AND ‘dentin’, ‘enamel’, human tooth’. Title and abstract screening were performed to identify potentially relevant papers and remove duplicate articles.
The main aim of this brief survey is to inform a wider audience about the potentialities of the two abovementioned techniques in a field in which no significant use of them is reported. In fact, the literature does not present a very large number of papers or reviews related to the use of FT-IR and Raman spectroscopies for studying human tooth samples processed with femtosecond lasers, notwithstanding the exceptional potentialities of these optical techniques and the peculiarities of femtosecond laser ablation treatments that offer a realistic approach to be used in dentistry. For readers not familiar with vibrational spectroscopies, the basic principles of these techniques are presented in the Supplementary Materials.

2. Representative Results of Applications of Vibrational Spectroscopies to Monitor Changes Occurring in Dentin and Enamel after Laser Ablation

Several papers related to the applications of vibrational spectroscopies in the study of hard dental tissues have been reported in the literature. FT-IR spectroscopy has allowed for the characterization of the chemical structures of enamel and dentin [22,23,24,25,26] or the investigation of the effects of chemical and physical agents on dentin and enamel [27,28,29,30]. Raman spectroscopy has been applied to investigate the characteristics of the junction between restorative materials and the tooth [31,32,33,34,35].
In the present short review, we focus our attention on some representative papers describing the use of FT-IR and Raman spectroscopies characterizing changes induced in dentin and enamel by femtosecond laser ablation.

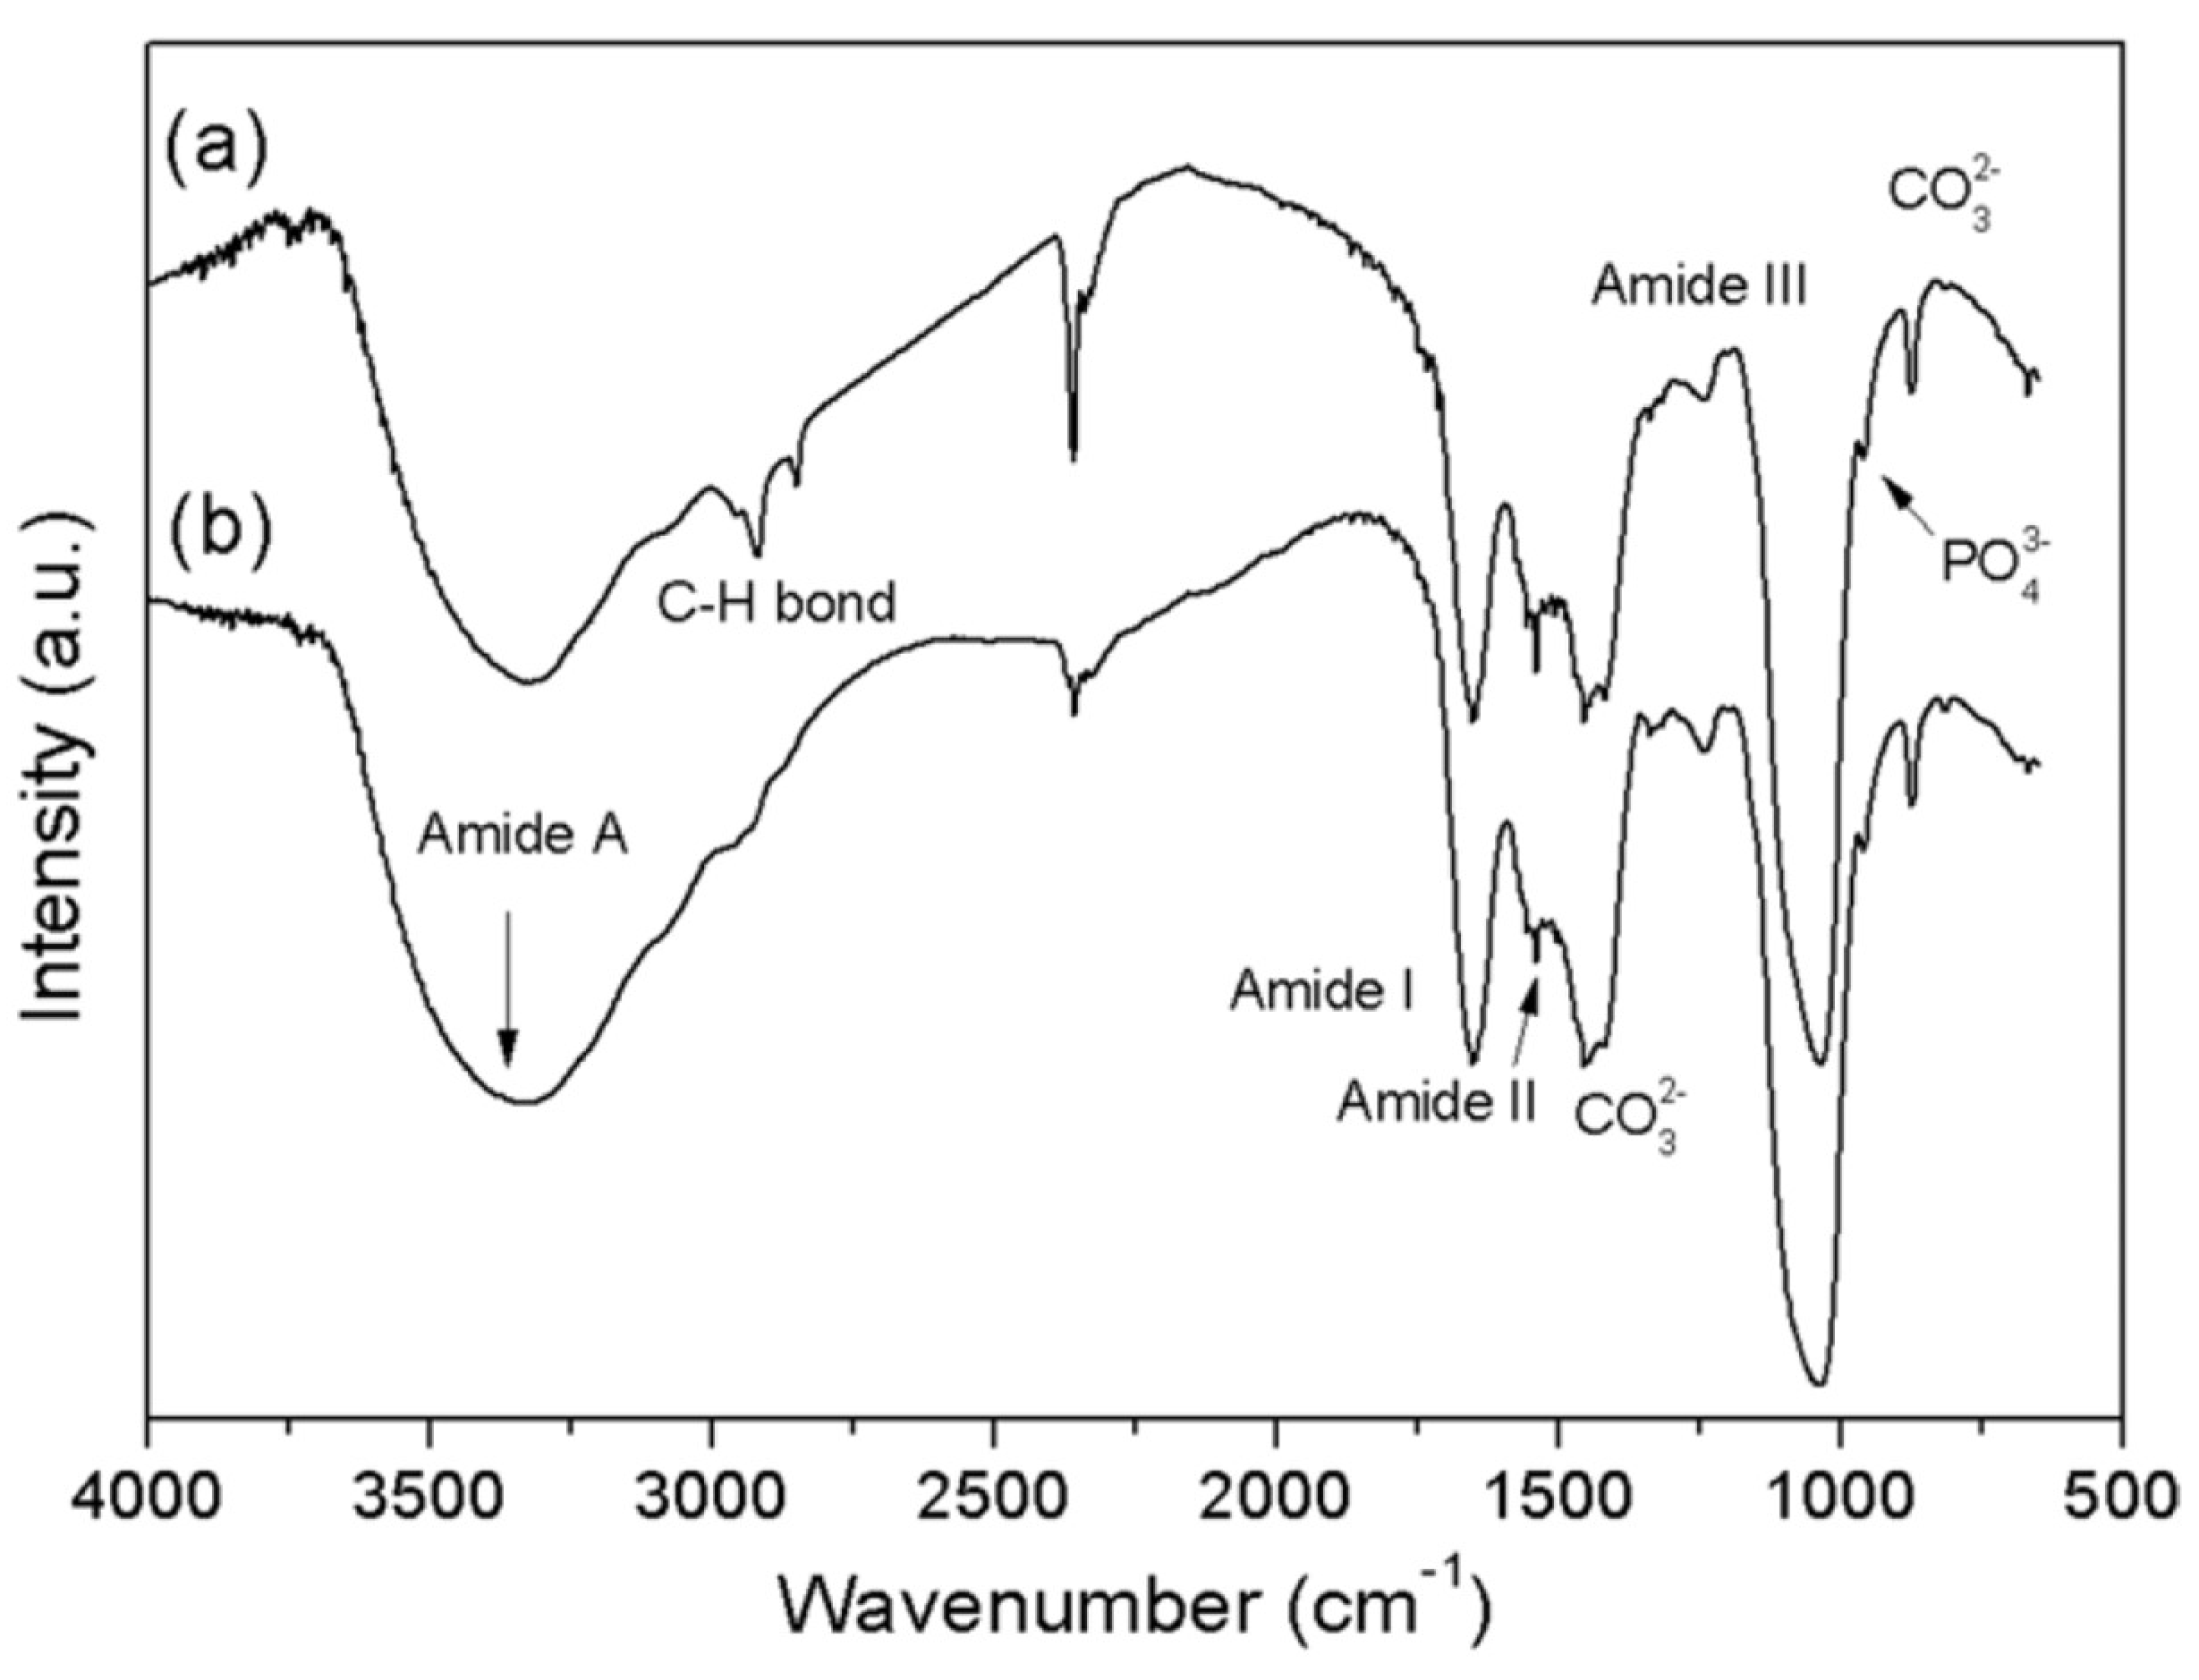
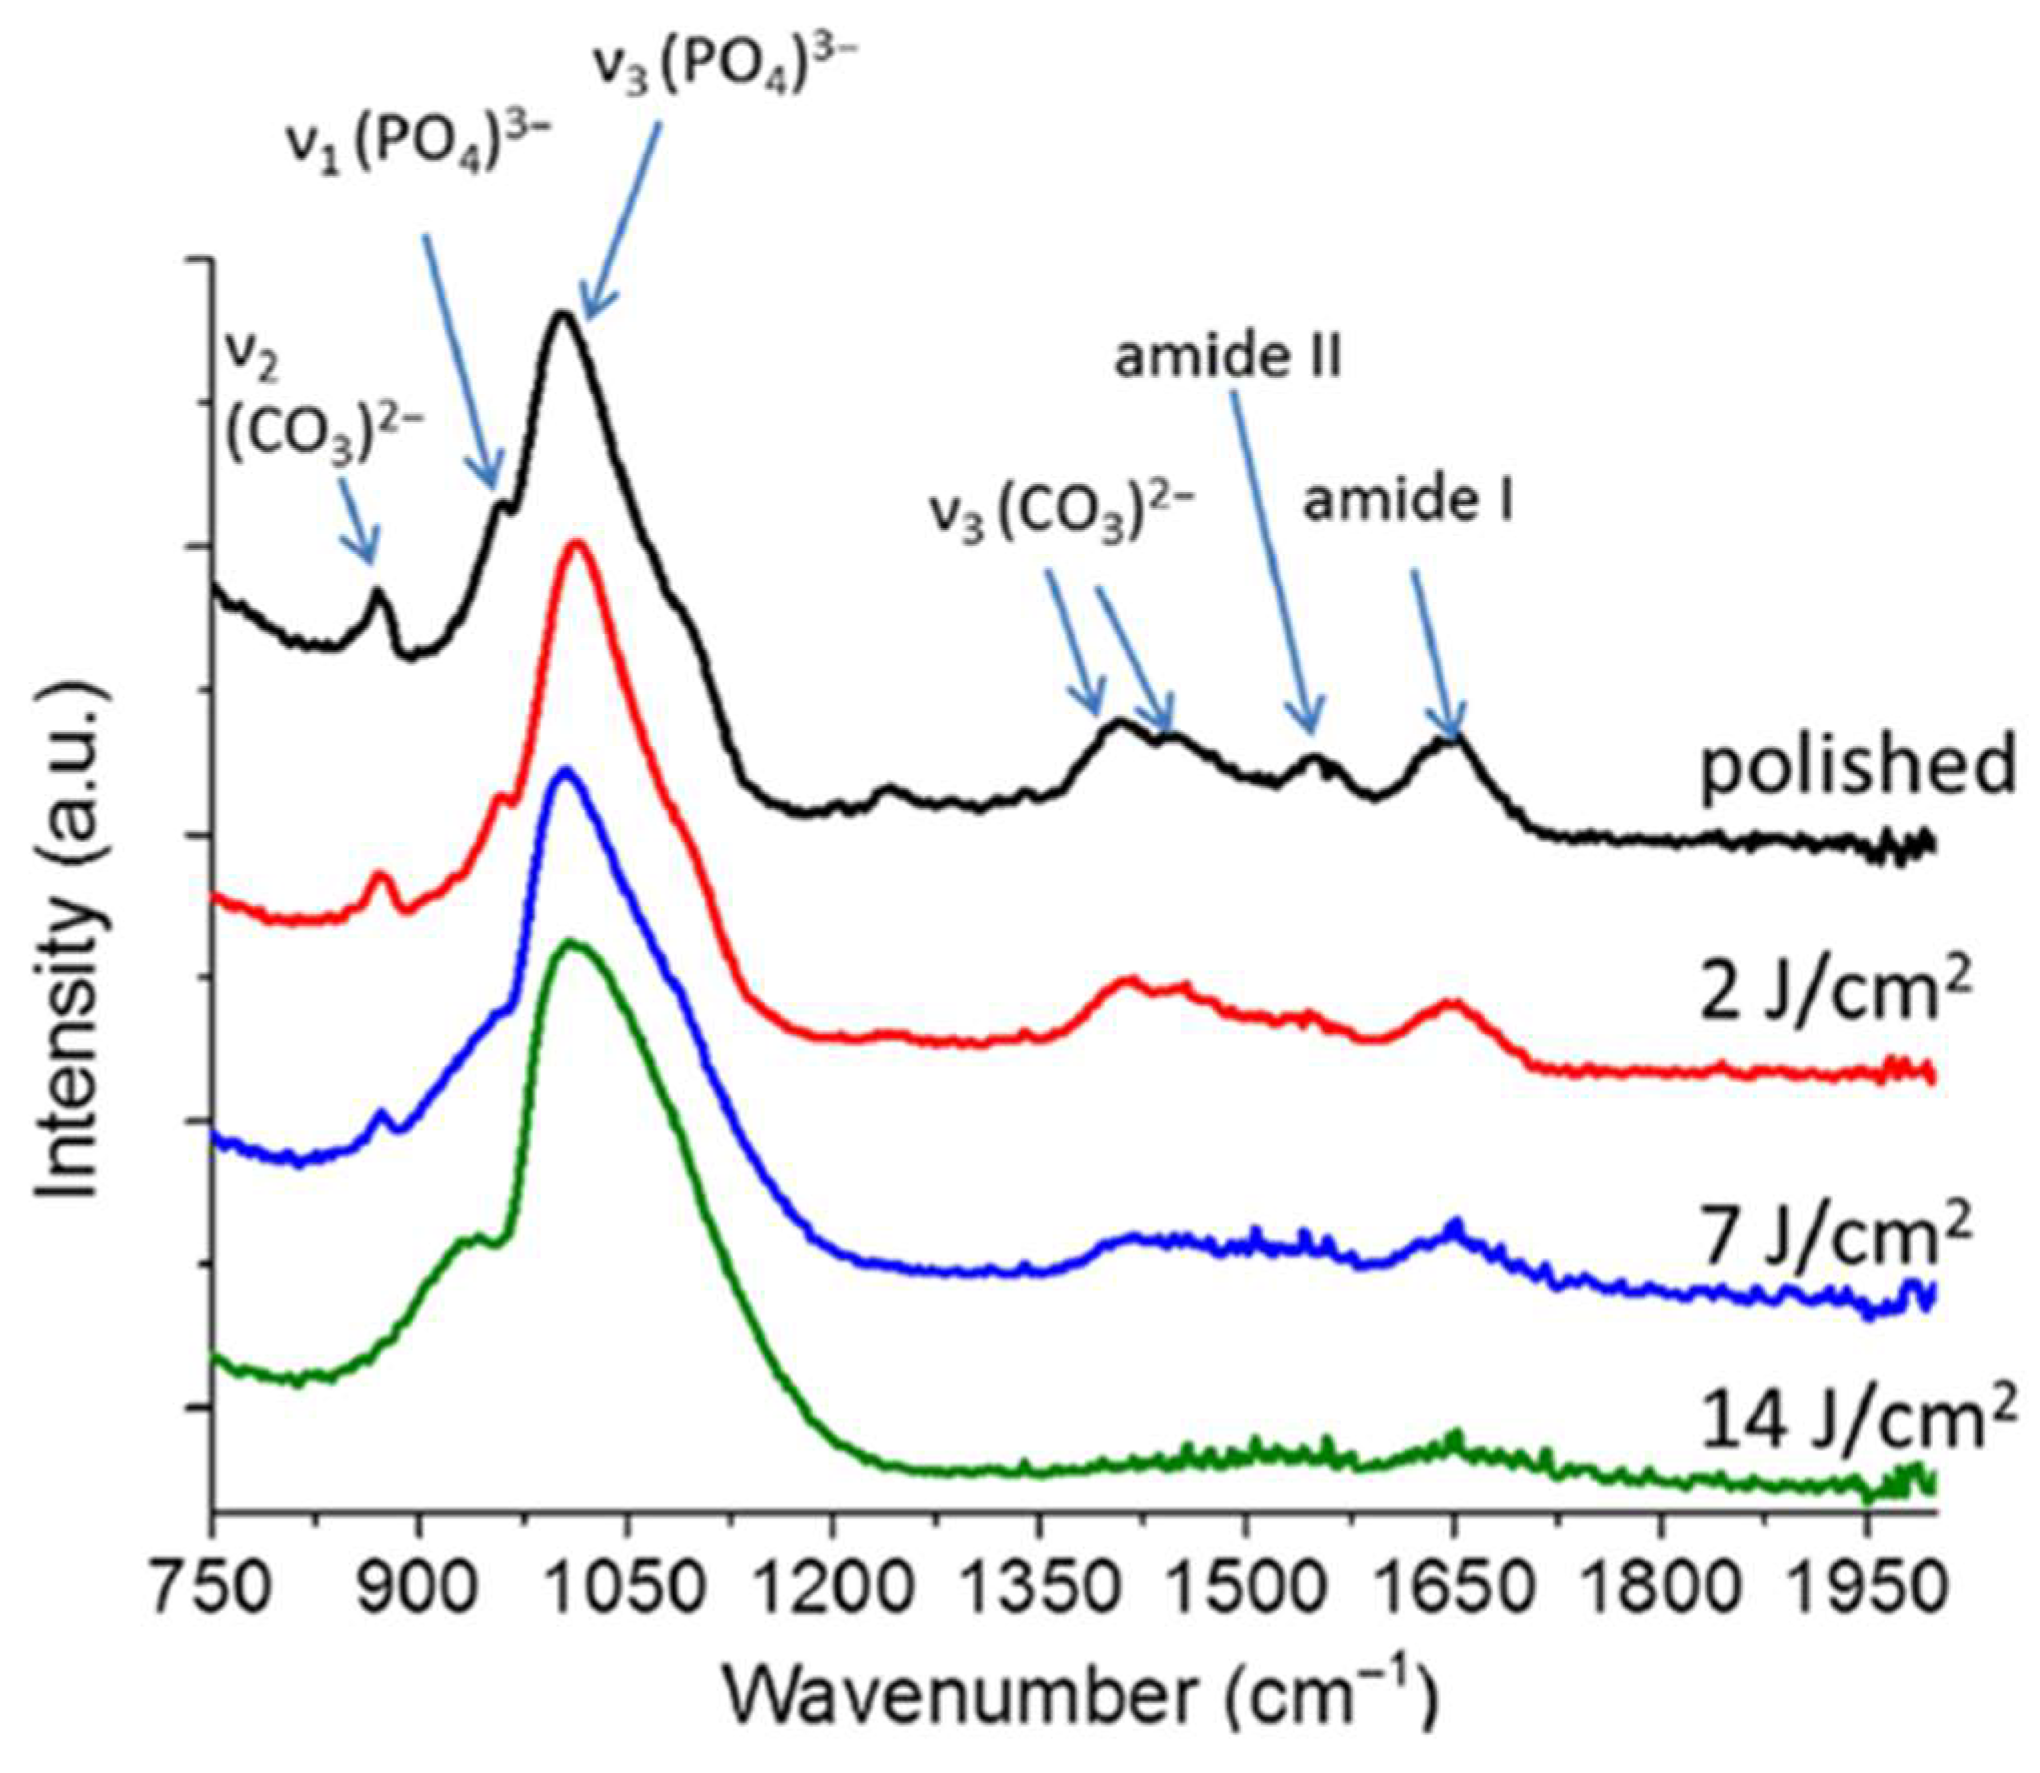
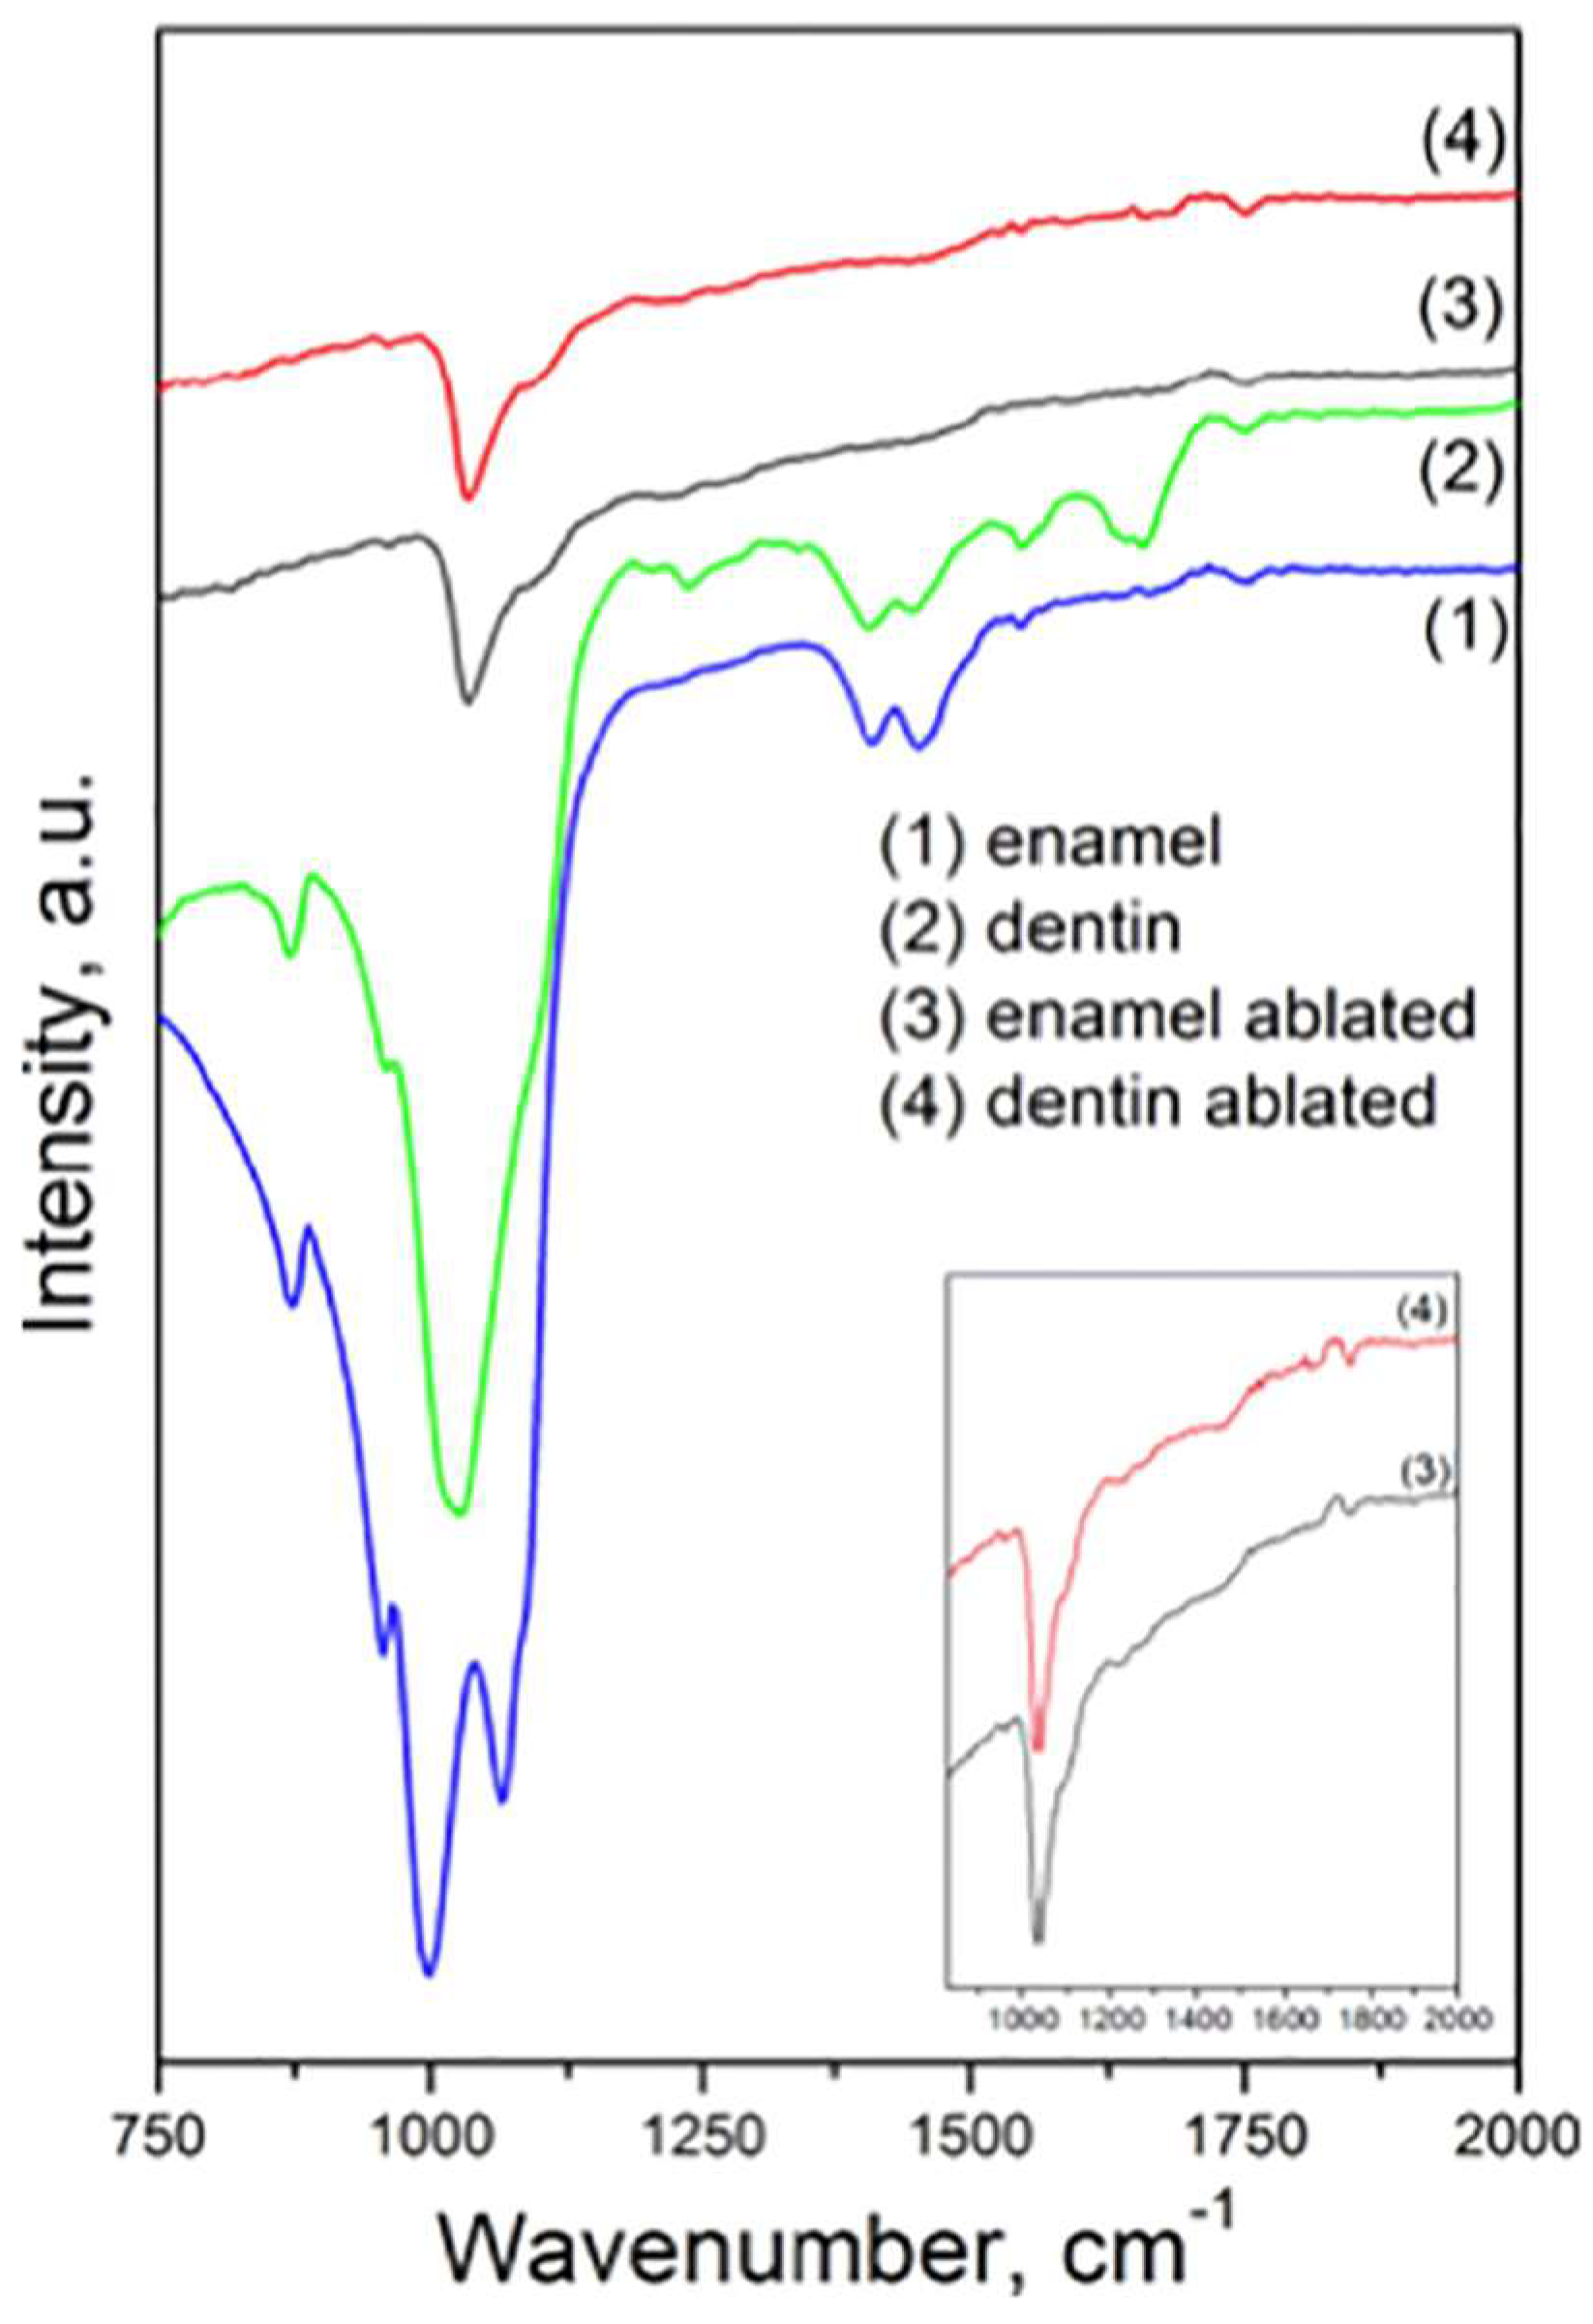
2.1. Representative Results of FT-IR Spectroscopy Investigations

In 2012, Alves et al. used FT-IR spectroscopy to investigate dentin samples before and after laser ablation. In this case, the authors used 2 mm-thick dentin disks cut from human molar teeth and a Yb:KYW chirped-pulse-regenerative amplification laser system for processing the samples. The laser pulse duration was about 500 fs with a wavelength of 1030 nm and a 1 kHz frequency. The cavities were obtained by linearly moving the samples with a scanning velocity of 5 mm/s. Average fluences in a 1–3 J/cm2 range were used [17,36].
In Figure 1, FT-IR spectra of dentin prior and after laser ablation are reported. The spectra were obtained in transmittance mode on samples of dentin conditioned in a diamond cell in the 4000–650 cm−1 range, with a 4 cm−1 spectral resolution and 256 accumulated scans.
In the spectra, the most intense peaks, located at 1045 and 964 cm−1, are associated with PO43−, due to the antisymmetric and symmetric PO stretching modes, respectively. The bands positioned at 1437 and 1456 cm−1 can be attributed to the stretching mode of CO3−2 substituted in B-type PO43− sites and A-type OH- anionic sites, respectively. The band at 872 cm−1 is due to the stretching mode CO3−2. In the spectra, the contributions between 1650 and 1200 cm−1 can be ascribed to the amide group of collagen, the most relevant organic component of dentin. The bands at 1647, 1541, and 1227 cm−1 are also attributed to the amide I (C-O bond), amide II (C-N stretching and N-H deformation modes), and amide III groups of the collagen molecule, respectively. The large band centered at 3320 cm−1 can be ascribed to the hydroxyl group (OH-) and the N-H stretching mode of amide A of collagen. The small contributions at 2920 and 2850 cm−1 generally correspond to C-H bonds of organic compounds. Alves et al. noticed that these contributions can also be related to the presence of surface contaminants in agreement with the results given by their XPS measurements (Refs. [17,36] and references therein). In Table 1, the different FT-IR spectral contributions are reported together with the assignments indicated by the authors.
Alves et al. noticed that laser treatment affects the contributions corresponding to C-H bonds, but the other features present in the spectra are not significantly modified [17,36]. This agrees with their XRD and XPS analyses showing that when laser treatment is performed in optimal conditions, it does not induce significant changes in the chemical composition of dentin [17,36].
Similarly to Refs. [17,36], Le et al. used FT-IR spectroscopy for investigating the changes induced by femtosecond laser treatment on dentin samples [37]. These samples were disks of dentin of about 1.5 mm thickness. A Yb:KYW chirped-pulse-regenerative amplification laser system with a Gaussian beam, a 560-fs pulse duration, a 1030-nm radiation wavelength, and a 1 kHs repetition rate (model s-Pulse HP, Amplitude Systemes, France) was used for surface modification in ambient atmosphere. The laser spot diameter was around 71 μm. The average energy fluences ranged between 2 and 14 J/cm2. The samples were moved with a scanning velocity of 5 mm/s using a computer-controlled XY-stage. The ablated surfaces were obtained by scanning multiple individual lines. After the surface treatment, the samples were carefully rinsed in water. The authors investigated the chemical characteristics of the ablated surfaces by using FT-IR spectroscopy on samples treated with 2, 7, and 14 J/cm2 average energy; in Figure 2, the related spectra are reported. These spectra were obtained in ATR mode with a Nicolet 5700 FTIR spectrometer (Thermo Electron Corporation, Waltham, MA, USA) equipped with a deuterated triglycine sulfate thermoelectrically cooled detector. The FTIR spectra were acquired on the samples after ultrasonication, a treatment used for eliminating the ablation debris layer. The different contributions indicated by Le et al. in their FT-IR spectra detected from their samples are similar to those evidenced by Alves et al. [17], as is evident from Table 1. Differently from Alves et al., Le et al. focused their attention only on the fingerprint region, and they did not notice any contribution from Amide III. From Figure 2, it is possible to notice that the FT-IR spectrum of the samples treated with 2 J/cm2 is analogous to the one of the untreated samples, indicating that low-fluence laser ablation does not alter the chemical constitution of dentin in a significant way. Conversely, laser ablation treatments with higher energy fluences induce changes in dentin, as shown in Figure 2 by the spectra from samples treated with 7 and 14 J/cm2. The most relevant changes regard the signal intensity of the vibrational mode of ν2 CO3- and amides that tend to decrease and disappear with high values of fluences. In addition, the phosphate bands located at 1005 cm−1 and 960 cm−1 are observed to change their shape depending on the different laser treatments. It is interesting to note that the infrared spectrum of the samples treated with the highest energy fluence value is comparable to that of amorphous calcium phosphate. This suggests that laser treatment with high fluence rates causes the significant presence of this compound.
The authors also reported that when the ablation debris is removed with ultrasonication from the samples, the infrared spectra of the samples treated with 7 and 14 J/cm2 present the same characteristics as those of the polished sample (see Figure 5 of Ref. [37]). This means that the ablation process affects only a surface layer that the authors estimated to have a thickness of less than 0.6 μm. The results obtained by Le et al. [14] for the laser treatment with 2 J/cm2 agree with those reported by Alvez et al. [17] who used energy fluences up to 3 J/cm2. The differences obtained in Ref. [37] for samples treated at higher energy fluences can therefore be ascribed to the significant layer of ablation debris that can aggregate in clusters. The morphological characteristics of the debris layer and clusters depend on the energy fluence values. This dependence can be explained by considering the increase in the ablation rate for the higher energy fluences. When this quantity increases, different physical processes occur, and there is an increase in the probability of collisions among particles in the plume, which supports the coalescence in larger clusters. The analysis of FT-IR spectroscopy evidences that the ablation debris layer is mainly composed of amorphous calcium phosphate; no melting processes are present in the energy fluence range considered in the work.
Petrov et al. used a system laser similar to that employed in Refs. [17,37] for preparing ablated surfaces of dentin and enamel [12]. The measurements were performed by using an FT-IR microscope Nicolet iN10 MX (Thermo Scientific Corporation) in ATR mode with a spectral resolution equal to 8 cm−1 in a 400–4000 cm−1 spectral range. They sectioned extracted caries-free human molar teeth with a diamond saw into 2 mm slices perpendicularly to their long axis, obtaining samples with flat areas of enamel and dentin. They used FT-IR spectroscopy to characterize the two components of hard dental tissues. In Table 1, the observed peaks are reported together with their relative assignments. Many of them show the occurrence at the wavenumber position compatible with the previously reported observations made in Refs. [17,37]. Spectral features related to hydroxyapatite are present in both components. For spectra acquired from the dentin area, peaks related to protein content, such as Amide I, II, and III, are evident, as shown in Figure 3 reported from Ref. [12]. Furthermore, the contribution located at 1750 cm−1 and assigned to the C=O bond in the carbonyl group can be noticed in the FT-IR spectrum from dentin.
These features are not present in the spectrum acquired from the enamel region. The crystalline nature of this component is higher than dentin, with this difference resulting in the double structure of the PO4 group. After ablation treatment, the FT-IR spectra of dentin and enamel still show the peaks characteristic of inorganic hydroxyapatite, but the peaks related to the protein component are almost absent. It is worth noting that in this case, the more complex structure of the hydroxyapatite band is lost, confirming the prevalence of amorphous calcium phosphate without changes of phase induced by overheating effects due to laser ablation.
Vibrational spectroscopy could also be used for predicting the femtosecond laser ablation profile in human teeth, as proposed by Loganathan et al. [38]. They used human molar teeth for preparing enamel and dentin slabs; the slabs were cleaned in water using ultrasonication and then stored in distilled water before the laser treatment. For ablating the tooth surface, the authors used an 800 nm, 100 fs, Spitfire Ace Power Amplifier Ti: Sapphire femtosecond laser (Spectra-Physics®, Santa Clara, CA, USA). Ablated grooves were produced by scanning single lines, and the average laser power was varied from 0.1 W to 0.6 W. The scanning speed was 10 mm/s, and a repetition rate equal to 10 kHz was adopted. The ablated samples were cleaned by using ultrasonication in distilled water to remove the ablation debris and then left to dry in the air. FT-IR measurements were performed by using an IC-Agilent Cary 630 FTIR spectrometer at room temperature in the 1500–800 cm−1 spectral range. The spectral features of the dental and enamel samples are analogous to those reported by other authors and summarized in Table 1. In their paper, the authors proposed a correlation between the chemical composition of dentin and enamel obtained by FT-IR measurements and some parameters related to the femtosecond laser ablation process. Quantitative information on the chemical constituents of samples was obtained by considering the area of the different bands present in FT-IR spectra. The areas of the various spectral contributions were estimated by using deconvolution procedures. In Table 2, the experimental conditions used by the different authors for acquiring spectra are summarized.

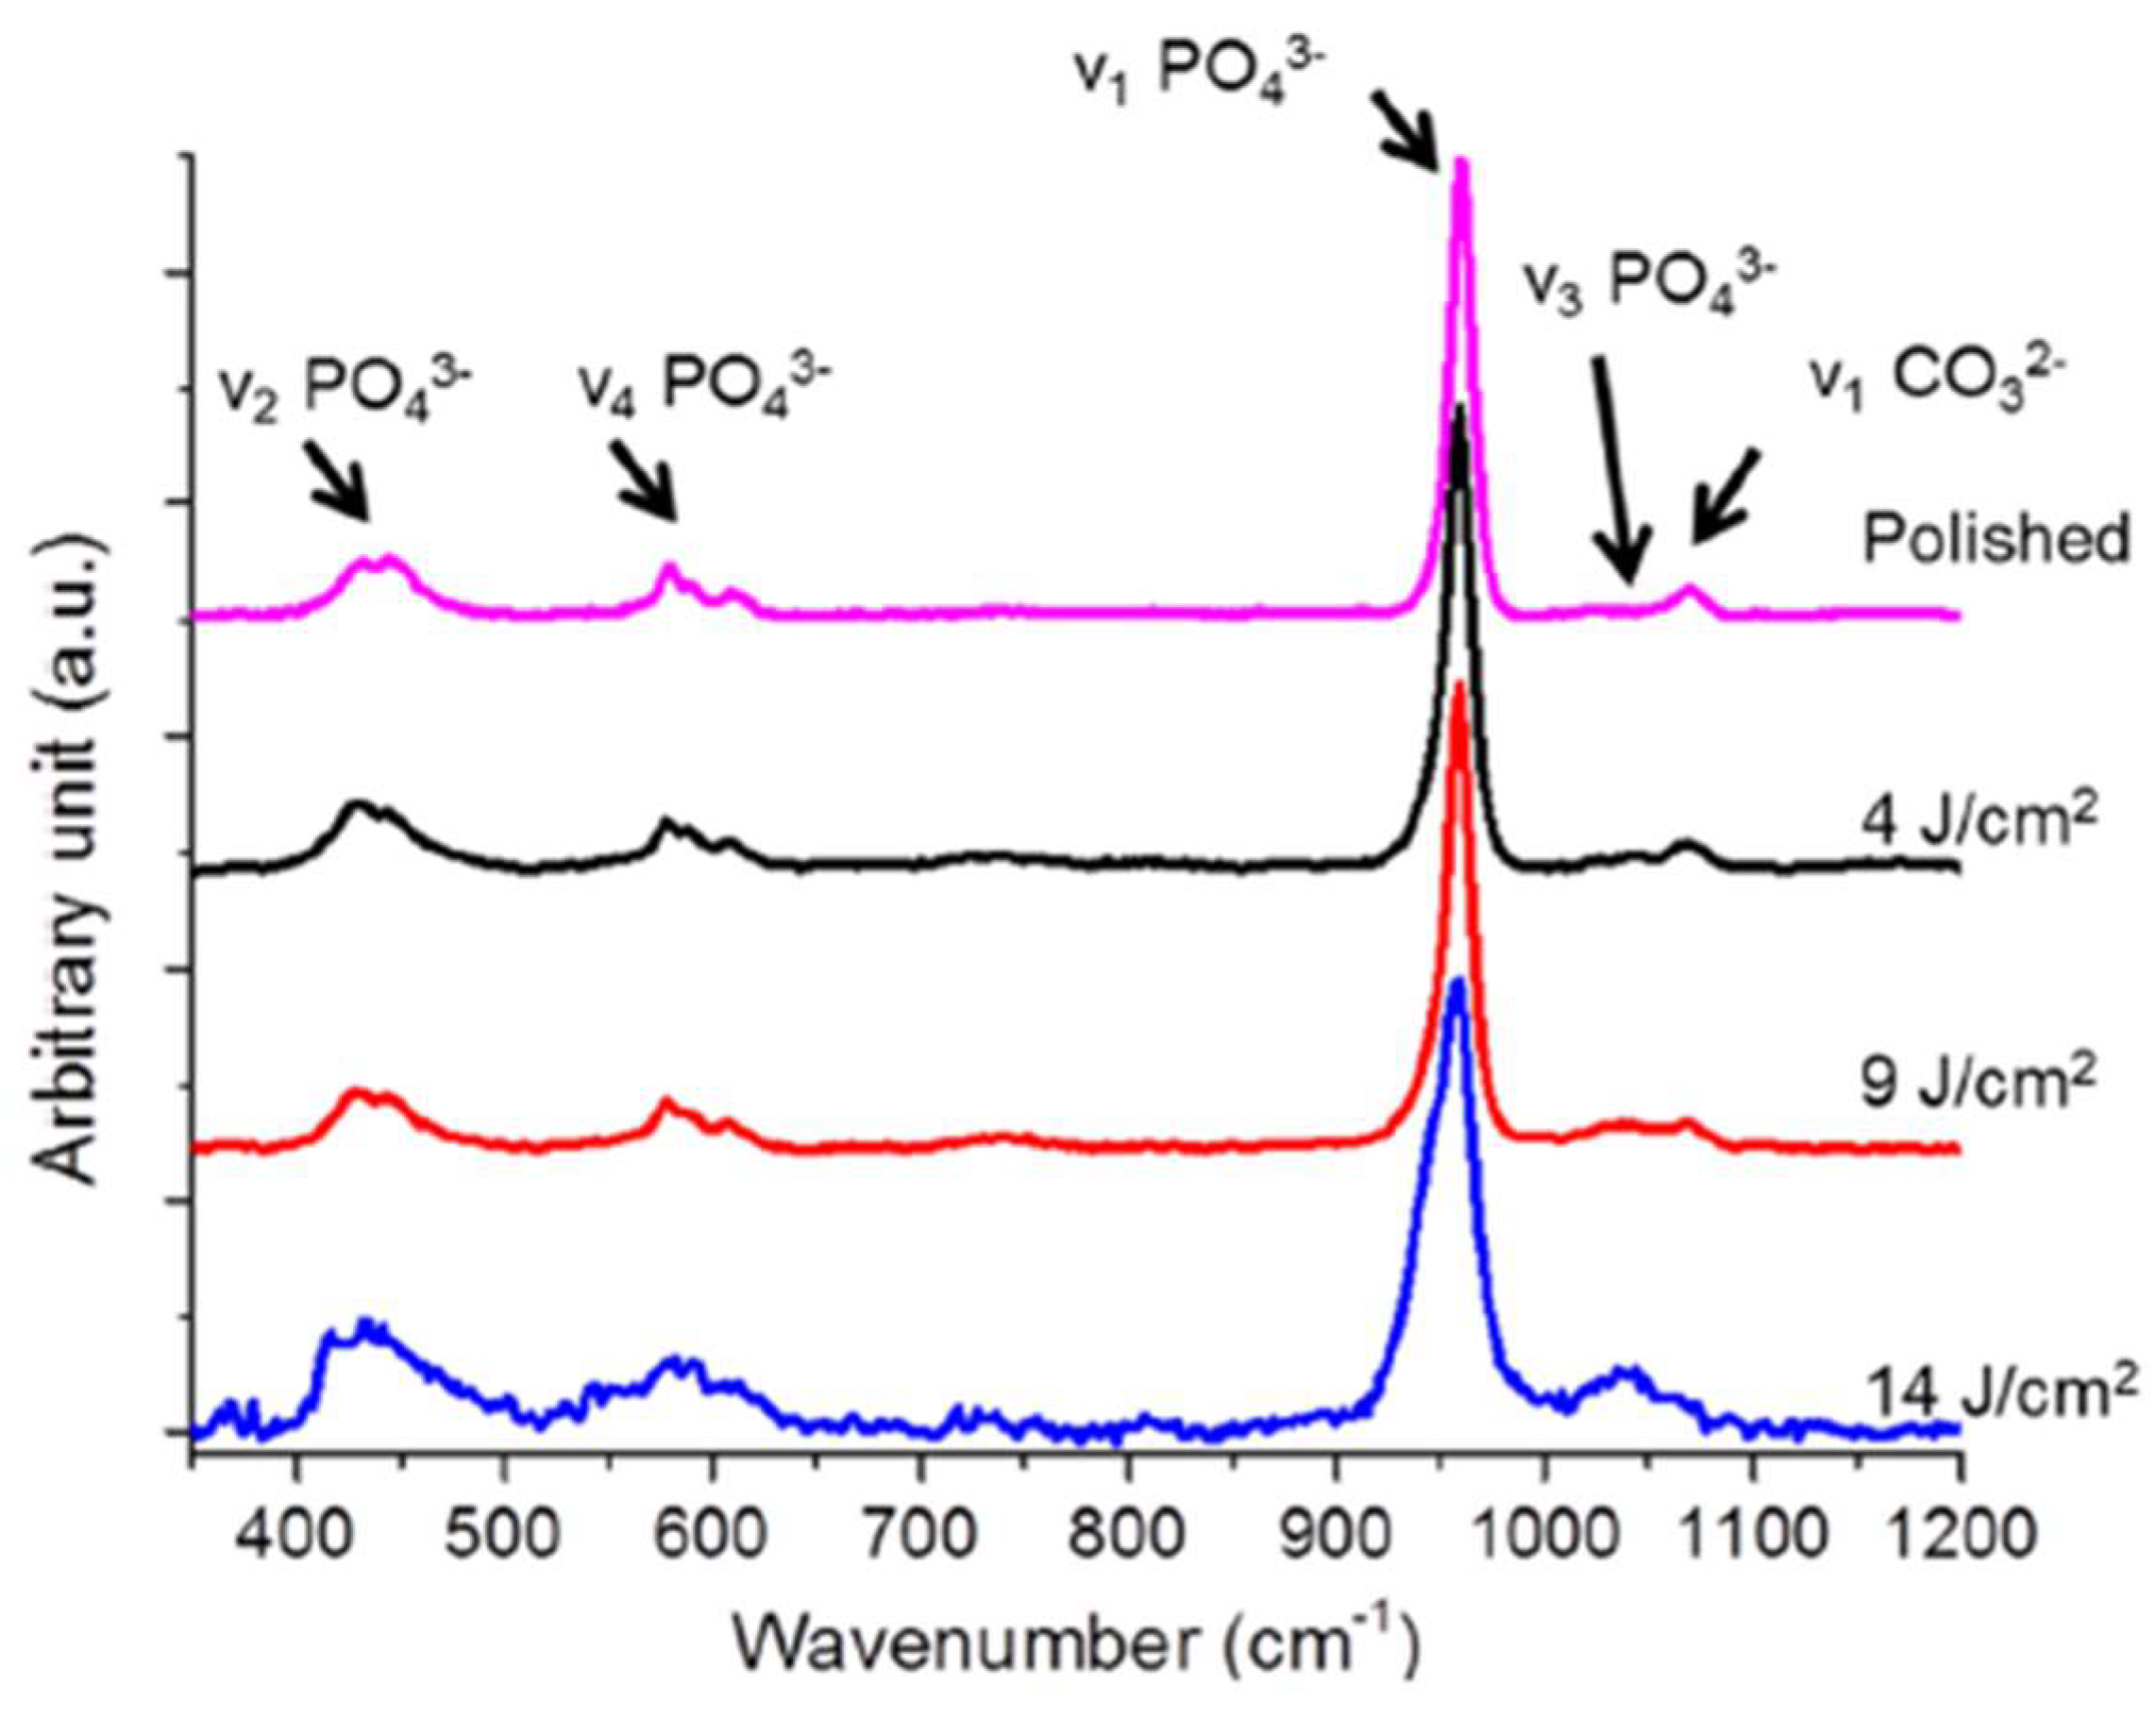
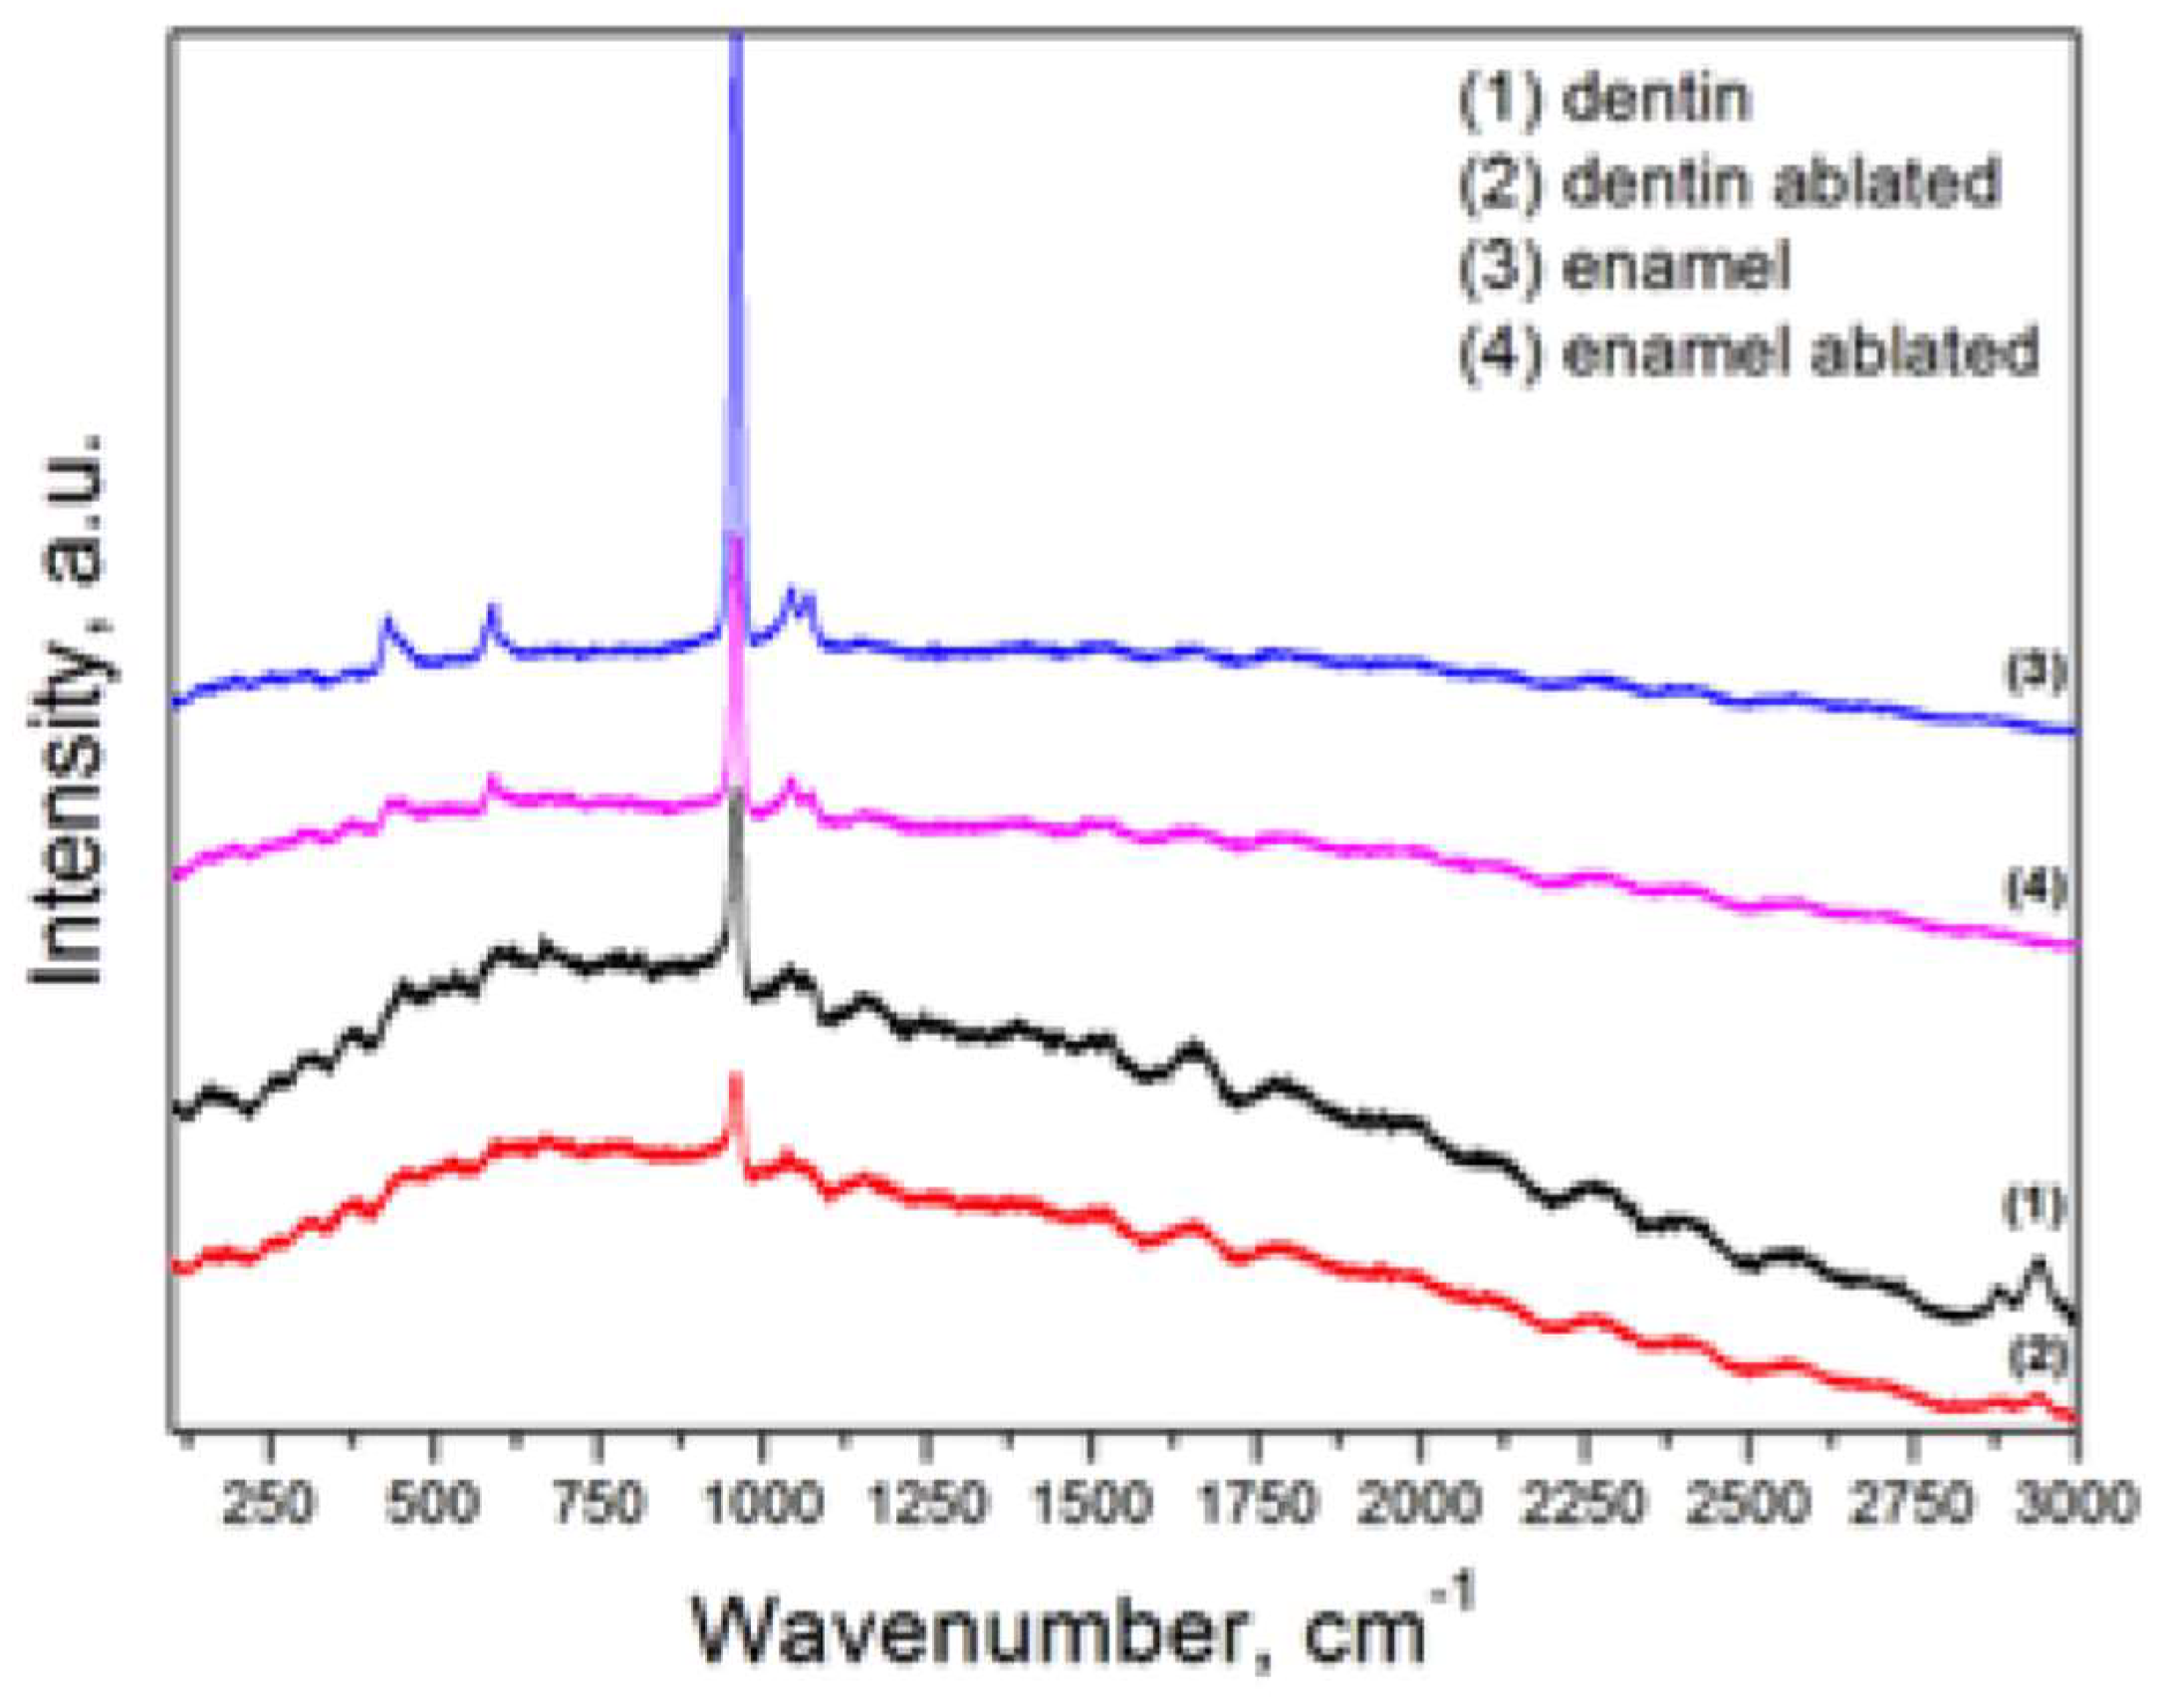
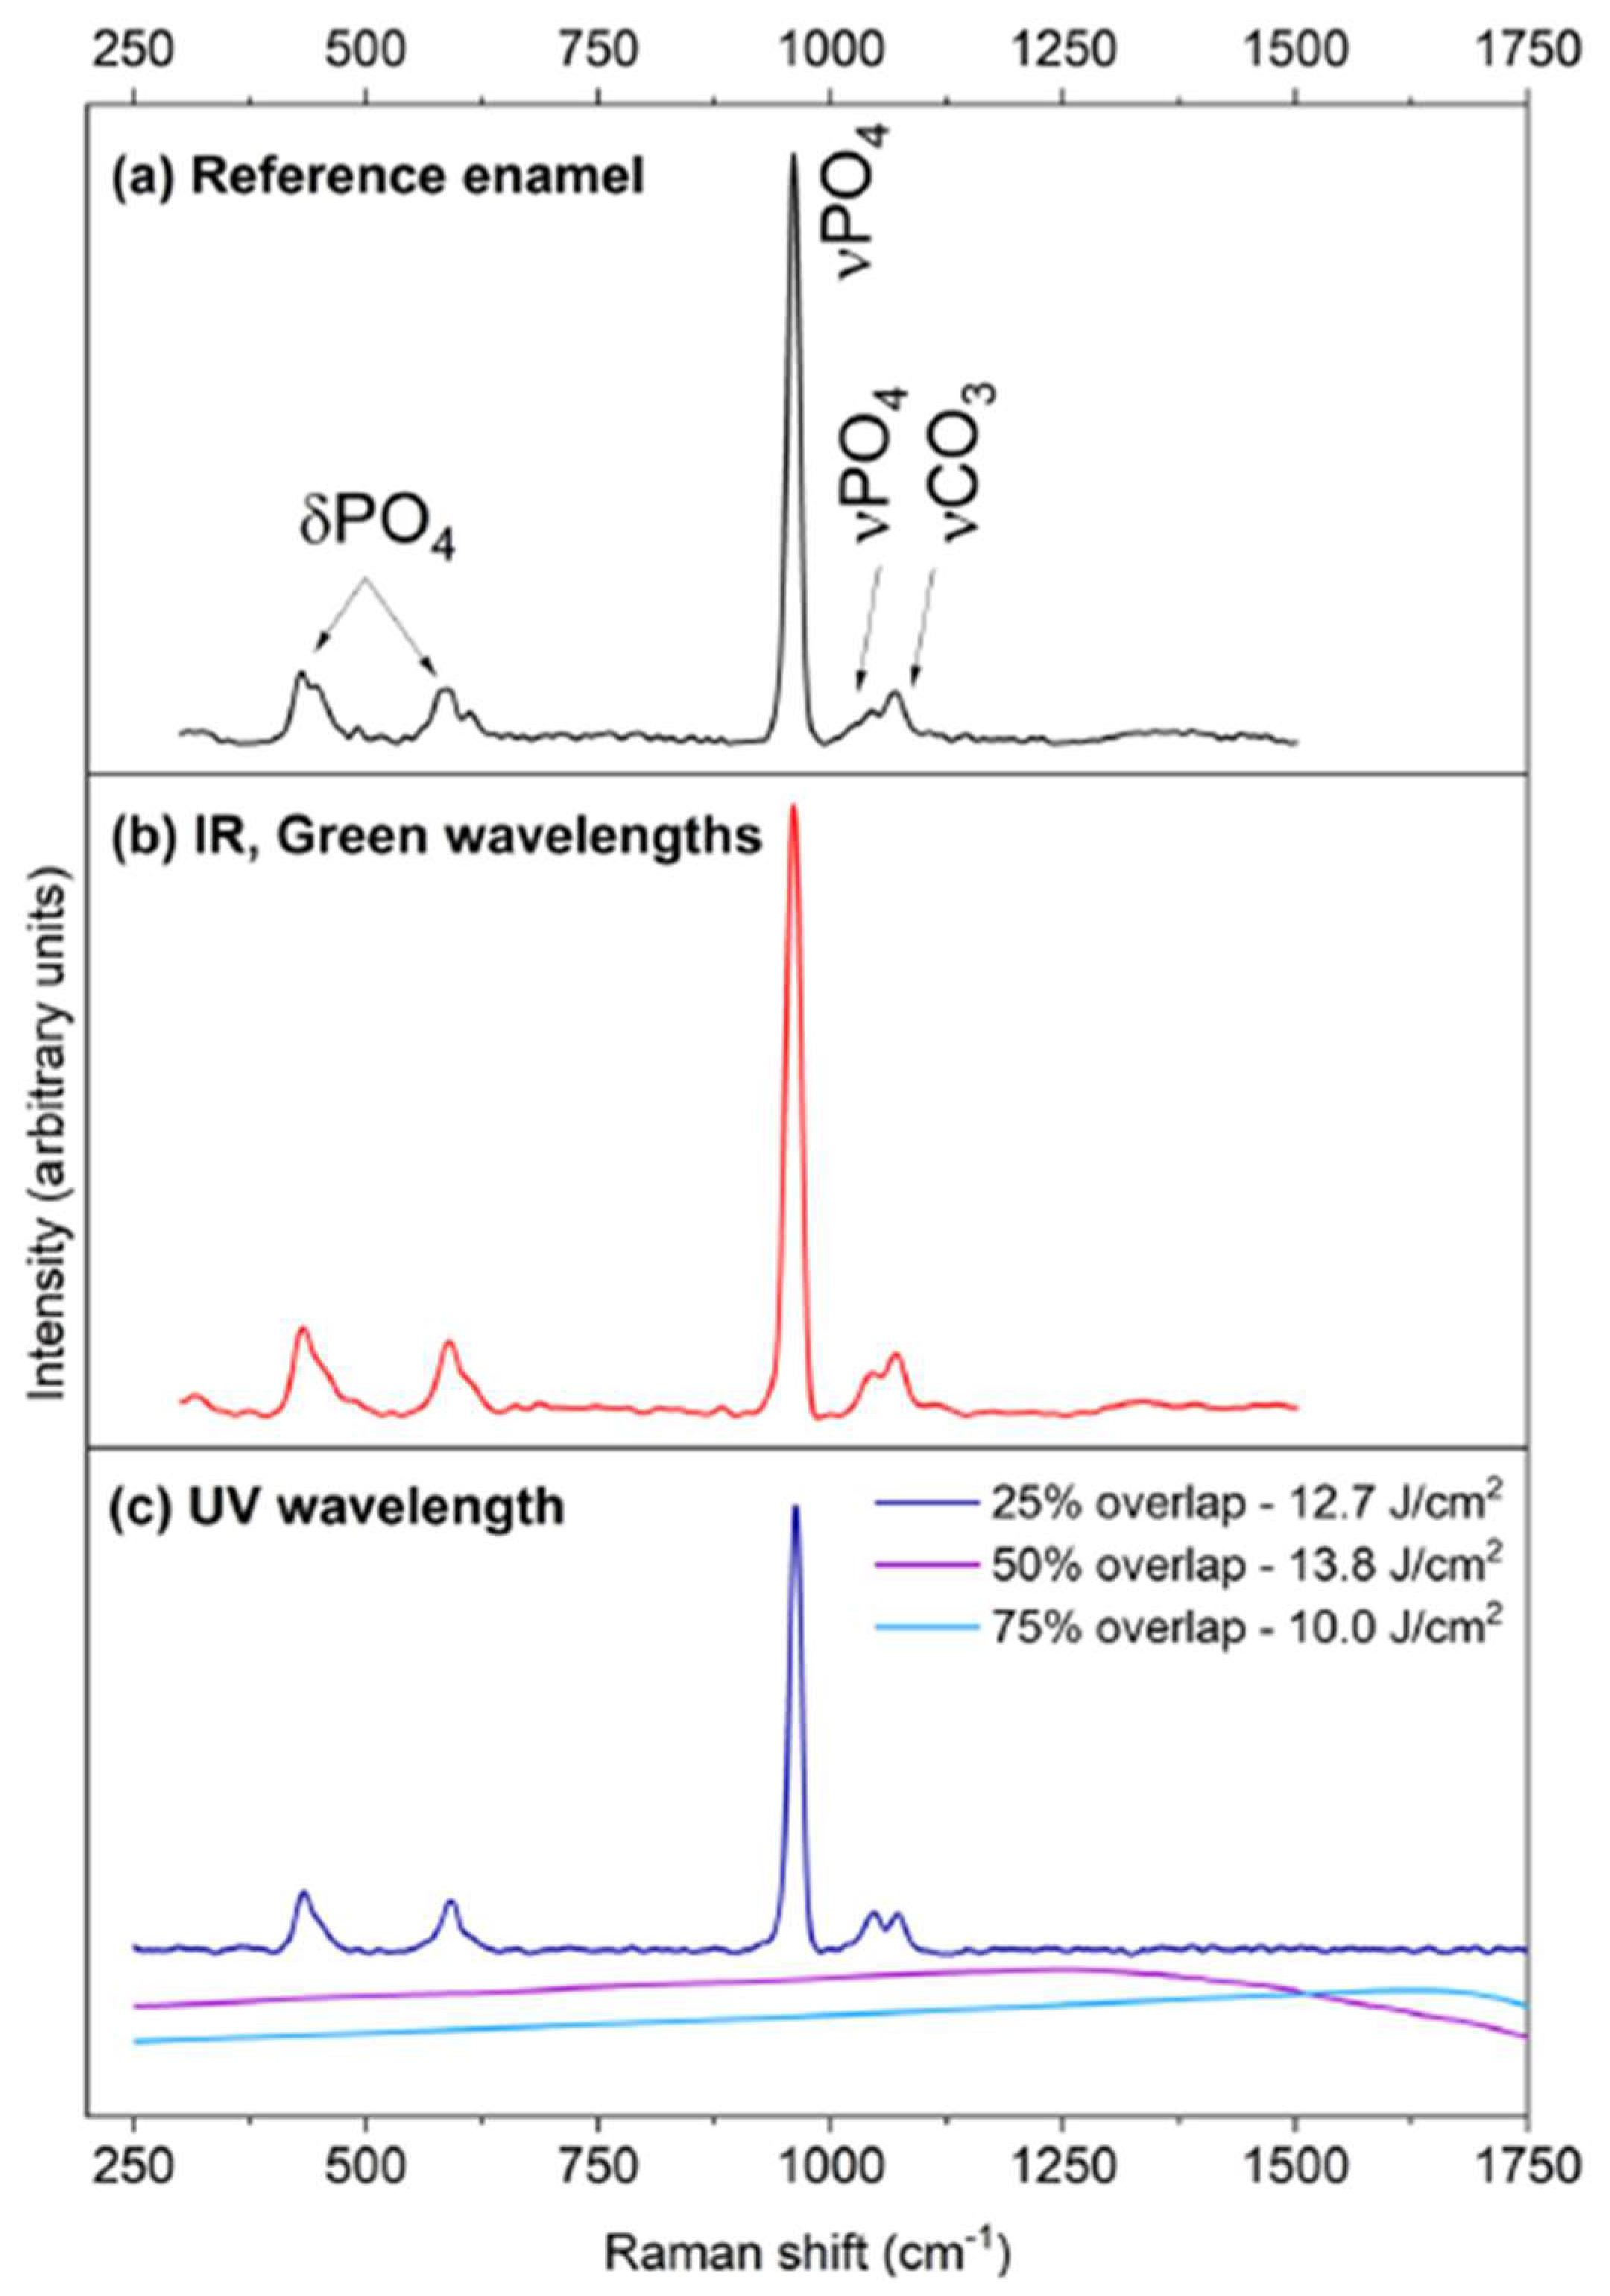
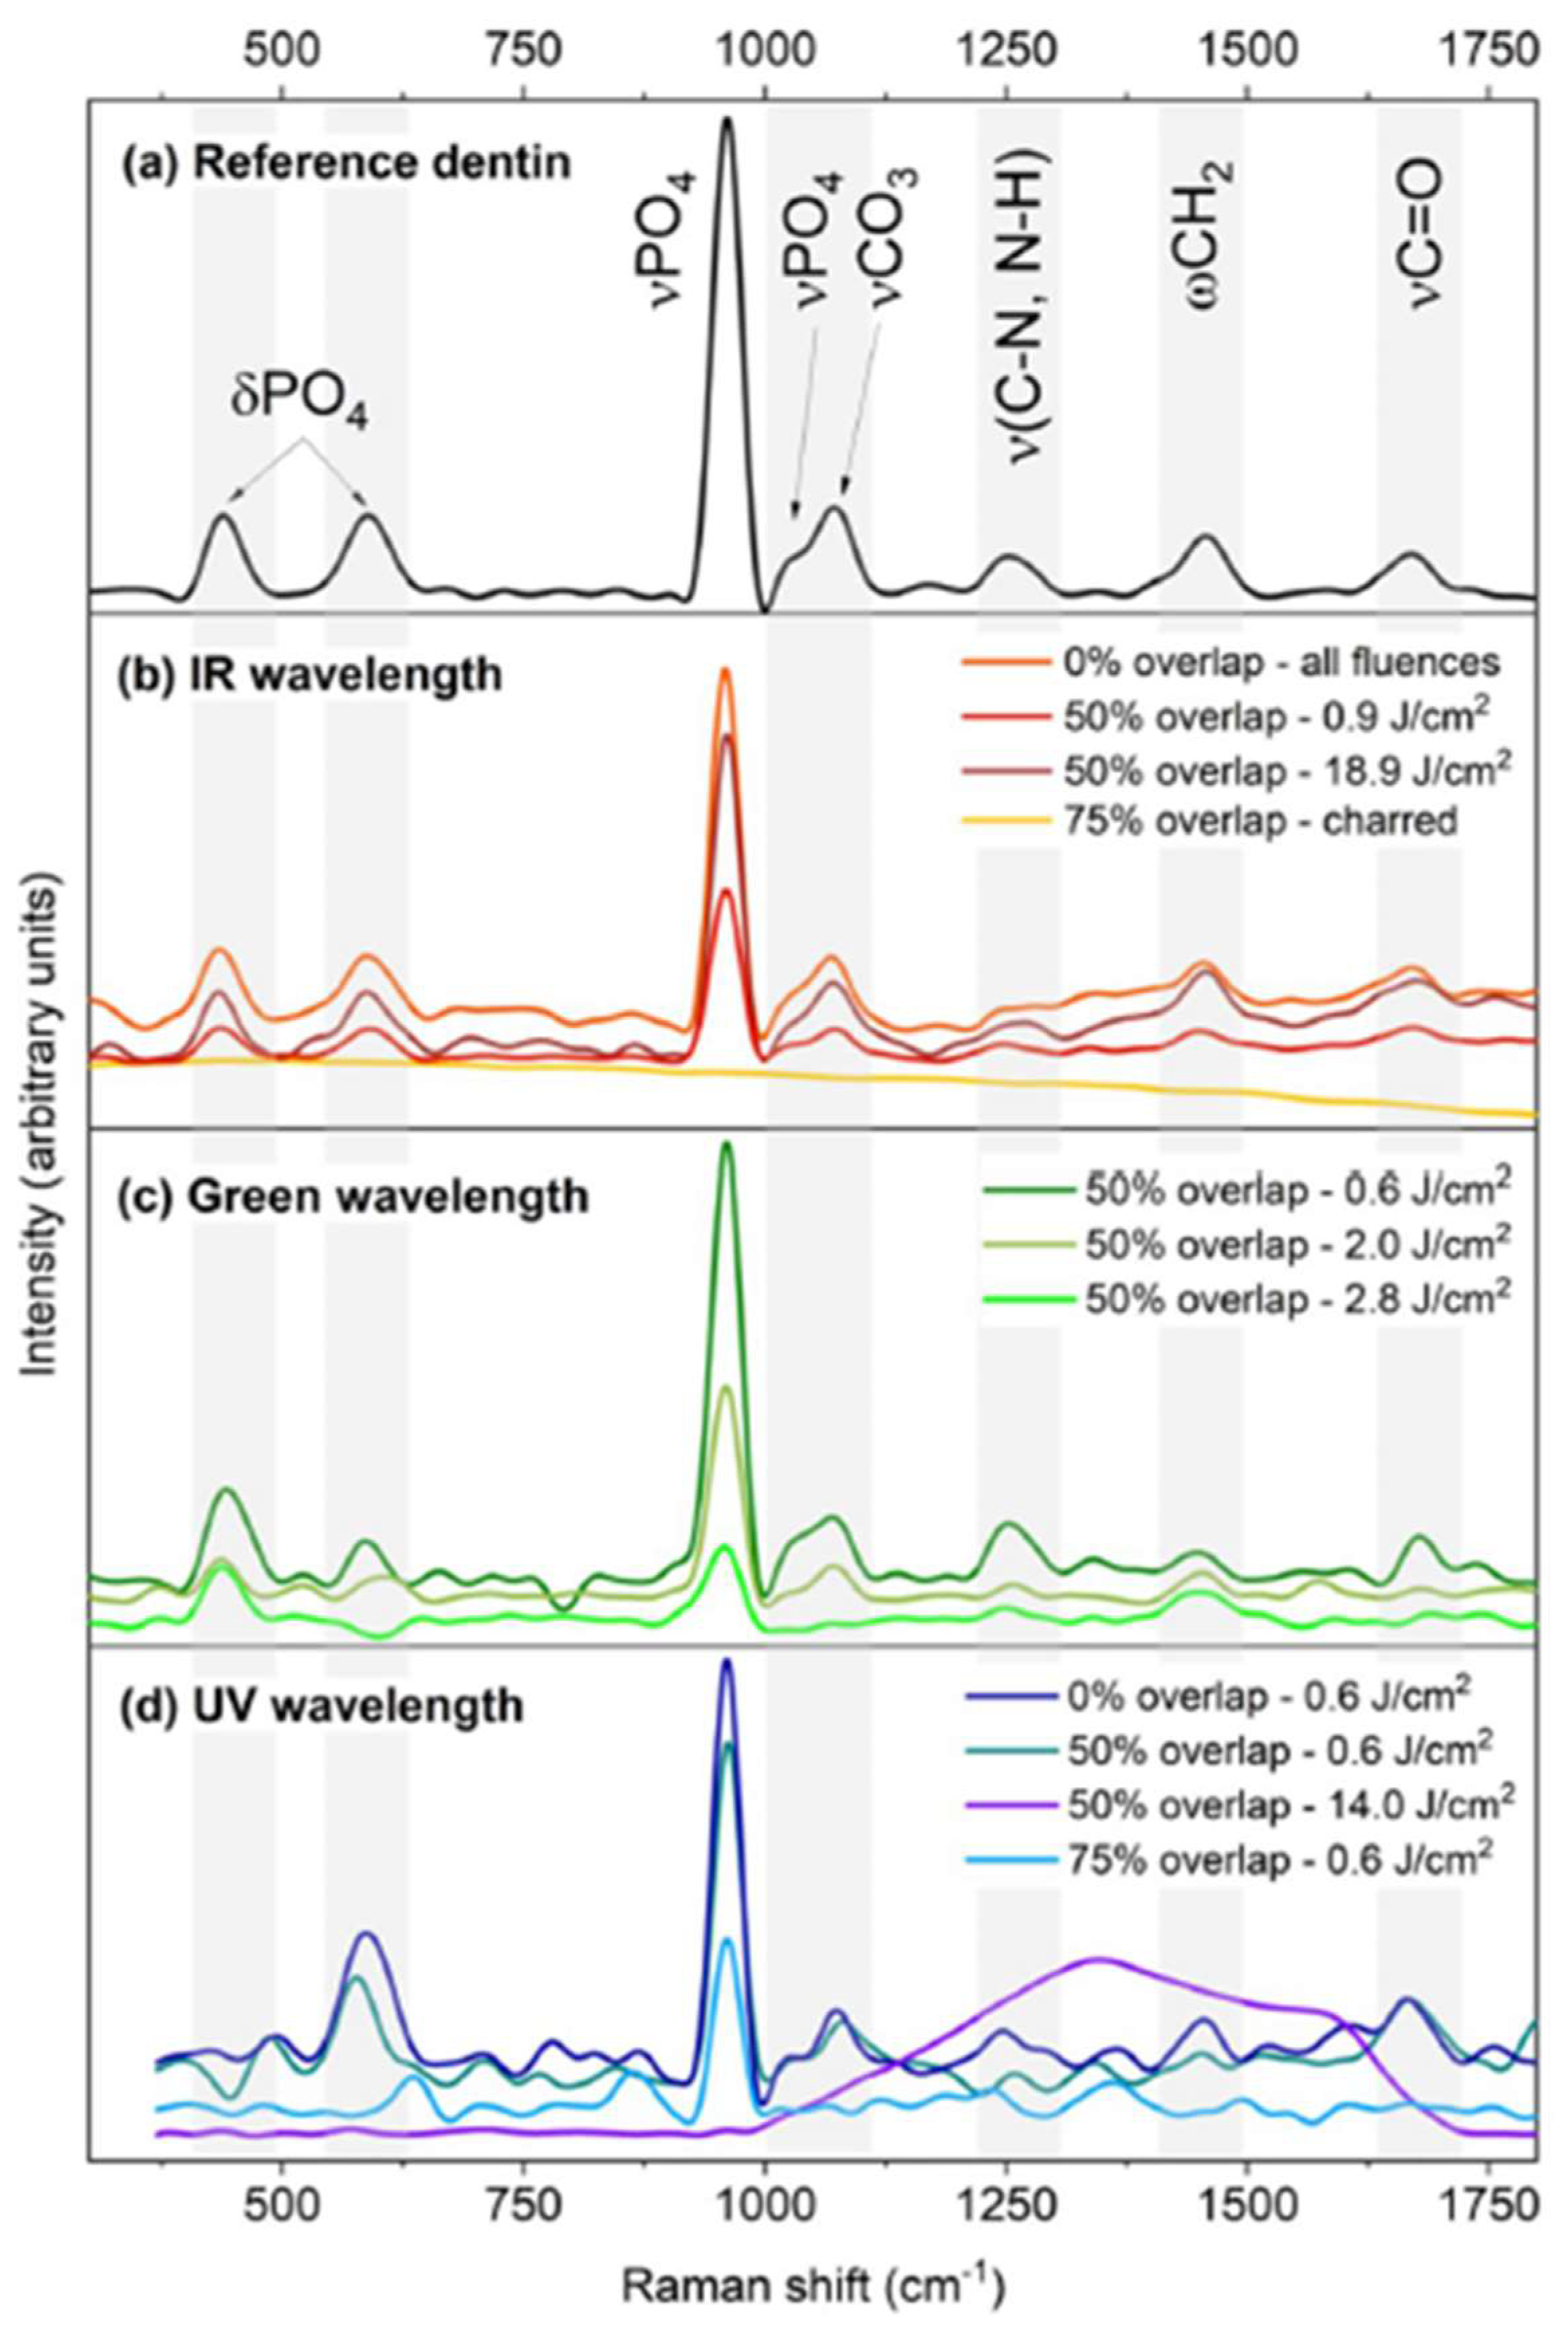
2.2. Representative Results of Raman Spectroscopy Investigations

Raman spectroscopy has been used by adopting a microscopic approach that allows the characterization of biochemical changes induced in a very small area of the samples.
Ji et al. used Raman spectroscopy to investigate the changes induced in dentin samples by treatments with a femtosecond laser source different from the ones used in previously cited papers [3]. The authors used a Ti:Sapphire laser operating at 800 nm with a pulse duration of less than 100 femtoseconds. Energy fluences varying between 0.57 and 3.68 J/cm2 were employed with a repetition rate of 1 kHz. The laser spot size was around 30 μm, and single and multiple pulses were used with a spatial distance between each laser spot equal to 0.10 mm in a row and 0.35 mm in a column to ensure enough space to avoid interference with the different spots. In Figure 8 of ref. [39], the Raman spectra of treated and untreated dentin surfaces are reported. Unfortunately, no details are given on the employed Raman spectrometer and spectra acquisition procedure. The authors focused their attention on the contribution of HA, which is characterized by the symmetric stretching of the PO43− vibrational mode, related to the peak at 960 cm−1. The authors noticed that the intensity of this peak was not altered, confirming that femtosecond laser treatment does not modify the chemical composition of dentine tissues. This evidence supports the validity of femtosecond laser ablation treatment.
The research group of Le et al. previously mentioned in Section 2.1 also reported the results of a study on the femtosecond laser ablation of enamel samples. In this study, they adopted Raman spectroscopy for the investigation of the chemical modifications induced by laser treatment [14]. The Raman analysis was performed using an XploRA® Confocal Raman system (Horiba Scientific, Kyoto, Japan) that used an excitation wavelength equal to 786 nm. A 5-mW laser beam was focused on the sample using a 50× microscope objective. The laser spot diameter was equal to 7 μm. The Raman signals were analyzed using a 1200 g/mm grating, and the spectral resolution was better than 1 cm−1. In this work, enamel samples were cut from extracted human molars by using a low-speed diamond saw and properly polished. The authors prepared the samples the day before the laser treatment and stored them in distilled water at 4 °C. Samples were removed from the water, and the excess water was removed using clean paper tissue before performing laser ablation [14]. The conditions of laser ablation treatment were like those already reported in Section 2.1.
In Figure 4, the Raman spectra collected from untreated and treated samples and normalized to the highest peak located at 960 cm−1 are reported. This peak corresponds to the ν1 vibration mode of the phosphate group PO43− in HA. The peaks positioned at 470, 530, and those in the range between 1025 and 1085 cm−1 can be tentatively assigned to ν2, ν4, and ν3 vibrational modes of the phosphate group according to Refs. [40,41,42]. The peak at 1070 cm−1 is assigned to the ν1 vibration of the carbonate group. It is observed due to the partial substitution of hydroxyl and phosphate anions with the carbonate anion. In Figure 4, it is possible to observe that the relative intensity of the peak located at 960 cm−1 decreases when the energy fluence increases. This trend is indicative of the formation of nanocrystalline and/or amorphous calcium phosphate at the surface of the specimen, as also reported in Refs. [38,40]. Raman measurements performed after ultrasonication of samples still indicated the presence of amorphous calcium phosphate, demonstrating its presence in the resolidified material. In Table 3, all the peaks observed in the Raman spectra of Figure 4 and the related assignments are reported.
Le et al. also analyzed XRD diffractograms collected from the same ablated enamel surfaces, investigated using Raman spectroscopy. There was a substantial agreement between the results of Raman spectroscopy and those of the XRD technique, indicating that the ablation of enamel implicates the melting of hydroxyapatite with a very thin, modified layer, and the thermal damage of the remaining material is negligible [14].
Furthermore, Hikov et al. [11] adopted Raman spectroscopy for investigating dentin and enamel surfaces treated with femtosecond lasers. They used transversal sections (2 mm thick) of human-extracted molars. The specimens were polished with a SiC #1200 grinding paper with water irrigation and subsequently by a 3 μm diamond suspension. The authors used a Satsuma pulsed laser (Amplitude, Pessac, France) with a 1030 nm wavelength and pulse duration of 350 fs. The laser source was characterized by a maximum average power equal to 5 W, a maximum laser pulse energy equal to 10 uJ, and a maximum repetition rate equal to 500 kHz. The system included a scanning system with a maximum speed of 2000 mm/s that was able to move the laser beam in the XY direction. The laser beam was focused on the sample surface by using a telecentric lens that produced a focal spot with a 20 μm diameter. The authors investigated surfaces ablated by employing the maximum laser pulse energy of 10 μJ and then decreased the energy until no traces were obtained on the dentin and enamel surfaces. Effects induced by changes in the scanning velocity were also investigated. The ablated areas were equal to 1 mm2, and a 1 mm depth was reached. Raman measurements were performed using a LabRamAramis micro-Raman spectrometer (Horiba-JobinYvon, Kyoto, Japan) equipped with an excitation laser at 532 nm. The investigated spectral range was equal to 100–3000 cm−1 with a spectral resolution equal to 1 cm−1. The optimal ablation treatment parameters were 10 μJ energy, a 500 mm/s scanning speed, and a 100 kHz repetition rate. In Figure 5, the Raman spectra of dentin and enamel before and after laser ablation acquired by Hikov et al. [11] are reported.
As previously mentioned, the spectra are dominated by the intense and narrow peaks of the P-O vibrational bands of the PO43− phosphate group. This characteristic peak is more intense in the enamel, which is characterized by the higher content and crystallinity of the hydroxyapatite mineral. The authors also described different contributions that are not well-evident in the spectra. In fact, they identified peaks located at 430 and 590 cm−1 that are attributed to the ν2 and ν4 P-O bending vibrations. The authors also indicated the presence of a doublet at 1045/1070 cm−1 due to the vibrations of the C-O bond in CO3. The peak at 1070 cm−1 is due to ν3 C-O stretching and is very near the contribution of the ν3 P-O stretching. The contributions of the amides I, II, and III of collagen are found at 1660, 1520, and 1247 cm−1, respectively. These contributions are evident in the spectra of the dentin, given the higher concentration of organic content in the dentin compared with the enamel. The authors reported the presence of a spectral feature due to the stretching mode of the C=O bond in carbonyl groups at 1780 cm−1. In spectra from ablated and non-ablated dentin, peaks located at 1450, 2882, and 2942 cm−1 can be observed. They are ascribed to C-H bending and the symmetric and antisymmetric C-H stretching of organic content, respectively. The Raman spectra evidence that the laser treatments performed by Hikov et al. [11] do not change the structure of dentin and enamel (spectra 2 and 4 in Figure 5). The peak of the inorganic HA and the faint spectral features due to proteins can still be observed (see Table 3 for a complete list of the observed peaks and related assignments). The Raman spectroscopy results demonstrate the absence of overheating effects in the examined ablated samples. This suggests that the tooth nerves in the pulp cavity of a living tooth would not be damaged.
Recently, Rapp et al. used Raman spectroscopy with two different aims. Firstly, they aimed at defining the optimal laser ablation conditions by using a femtosecond laser operating at 1029 nm [13]. The second purpose was to investigate the effects of the use of different femtosecond laser wavelengths (infrared (1030 nm), green (515 nm), and ultra-violet (343 nm)) in ablation processes [15]. To find the optimal conditions, the researchers used intact or horizontally sectioned healthy human permanent teeth. After preparation, the teeth were sterilized by gamma irradiation (25 kGy) and stored in a dry state. The samples were rehydrated with distilled water for 24 h before laser ablation treatment. In this way, their water content was reported to be in a normal, hydrated state. The laser ablation experiments were performed using a CB3-40W carbide 40W femtosecond laser (Light Conversion, Vilnius, Lithuania) with a laser wavelength equal to 1029 nm and a pulse duration equal to 275 fs. A repetition rate of 100 kHz and pulse energy of 400 μJ were selected. The beam size was around 54 μm, and the beam was scanned across the sample with an 86 m/s speed. All experiments were performed in ambient air at room temperature. Raman spectra were acquired using an InVia Reflex Raman spectrometer (Renishaw, Wotton-under-Edge, Great Britain) and their analysis allowed the investigation of the eventual chemical changes in the tooth structures before and after the laser ablation treatments. Spectra were collected using a laser power of 3.8 mW from a 785 nm near-infrared diode and a grating with 1200 lines/mm. A Peltier-cooled CCD was used to detect the signal. Spectra were acquired in the 300–1800 cm−1 spectral region for dentin and enamel. Further details on the experimental procedures can be found in Ref. [13]. The authors also investigated the dependence of ablation rate, ablation depth, and ablation efficiency on laser fluences (see Figure 2 of Ref. [13]).
In Figure 6, the Raman spectra of untreated and treated surfaces are reported. The spectra of dentin and enamel clearly show the contributions typical of hydroxyapatite. The main contribution is due to the symmetric stretching vibration of the PO4 group in the apatite. In the enamel spectra, the other contributions due to this chemical group are also present, as reported in Table 3. As far as concerns dentin spectra, similar features are present, together with contributions from the organic content. The most relevant contributions are those related to amide I and amide III, located at 1666 and 1241 cm−1, respectively. From Figure 6, it is evident that laser ablation processing does not induce any structural changes in the teeth components, in agreement with the evidence that no shifts and peak broadening are observed [13]. Unfortunately, no precise information about the laser ablation conditions is reported for the samples used for obtaining the Raman spectra reported in Figure 6.
In 2023, Rapp et al. used Raman microscopy to investigate changes occurring in treated enamel and dentin surfaces due to the use of femtosecond lasers working at different wavelengths. The authors performed laser ablation treatments using infrared (1030 nm), green (515 nm), and ultra-violet (343 nm) wavelengths and also investigated different pulse separations to determine the optimal conditions for the accurate removal of dental hard tissues without structural and compositional damage [15]. The laser source was the same as previously described in Ref. [13] and was able to emit the three different abovementioned wavelengths, with the focal spot diameter at FWHM equal to ~16 μm at 1030 nm and 10 μm at 515 and 343 nm. The steps between scanner lines were equal to 5 μm. The authors prepared grooves in the enamel and dentin by changing the spatial overlap between the laser pulses. Overlaps of 25, 50, 75, and 90% of the spot diameter were investigated. Sample preparation procedures and the conditions for Raman spectra acquisition were analogous to those previously described for the same research group.
In Figure 7, Raman spectra for different untreated (panel (a)) and treated enamel samples (panels (b) and (c)) are reported. The observed contributions have already been discussed when analyzing Figure 6a and are summarized in Table 3. The treatment with the IR and green wavelengths (Figure 7b) does not cause any structural change in enamel for all the investigated energy fluences and for the different pulse overlaps from a single shot regime to 50% overlaps. For laser treatments with UV wavelengths, (Figure 7c), no change is present in the Raman spectra when the treatment is carried out in the single pulse regime and at 25% overlap up to 12.7 J/cm2. For energy fluence values greater than this level, all peaks disappeared from the spectra. At 75% pulse overlap and fluences above 10 J/cm2, the authors observed charring using optical microscopy, and this caused spectral features to be completely lost in the Raman spectra. This is clear evidence of serious enamel damage, and those conditions should be avoided to protect enamel structural and biochemical properties.
In Figure 8, the Raman spectra for untreated (panel (a)) and treated dentin samples (panels (b), (c), and (d)) are reported. In panel (a), the most relevant contributions are indicated and assigned (see Table 3 for a complete list of the features). As previously noted for dentin, contributions from organic components are also present.
Figure 8b indicates that for treatments with IR femtosecond laser, the authors do not observe any changes in the spectra at all of the investigated fluences when there is no pulse overlap or at 50% pulse overlap. Modifications of the Raman spectra of dentin are evident for all the investigated laser fluences at 75% pulse overlap. This evidence is confirmed by charring observed with optical microscopy. In this case, all the spectral contributions are completely lost in the spectrum. For laser treatments with green radiation (Figure 8c), the authors observed changes in peak intensity ratios even when low energy fluences are used. The contributions due to organic components are more largely affected by increasing energy fluences when pulse overlap is present. Damages could be avoided by using pulse overlaps of less than 50%. The dentin spectra do not show any changes for all the investigated energy fluences in the absence of a pulse overlap (i.e., working in a single pulse regime). For UV irradiation (Figure 8d), the authors noticed that the low fluence of 0.6 J/cm2 in the single pulse regime (with no pulse overlap) also causes structural changes. In fact, the signal-to-noise ratio decreases, and the peaks are not well resolved in the Raman spectrum. Some of the spectral features related to the organic component of dentin are no longer present. For samples treated with energy fluence equal to 0.6 J/cm2 and a 50% pulse overlap, the dentin is damaged, as evidenced by the absence of the peaks related to organic components (amide I and amide III) and the bending and stretching of carbonate peaks. For energy fluences equal to or higher than 14.0 J/cm2, the peaks related to phosphate and organic are no longer present in the spectra. The large band located in the 1200–1600 cm−1 spectral region indicates the occurrence of carbonization. Serious degradation of dentin samples is observed for 75% of pulse overlap, as indicated by the absence of spectral structures in the Raman spectra. The analysis of UV-treated dentin and enamel samples indicates that UV radiation is not suitable for laser ablation processes, while IR and green wavelengths can ensure the optimal laser ablation of enamel and dentin. In these cases, the laser pulse overlap and energy fluence should be below 50% and 2.0 J/cm2, respectively. Furthermore, for Raman investigations, the experimental conditions used by the different authors for acquiring spectra are summarized in Table 2.

3. Conclusions

In this brief survey, we presented significant examples of FT-IR and Raman spectroscopy applications for monitoring the effects of femtosecond laser ablation treatment, taking advantage of the characteristics of the two abovementioned techniques.
From the results previously reported, it is evident that both techniques can indicate the contributions from the most relevant chemical constituents of ablated dentin and enamel surfaces. Unfortunately, many details useful to critically compare the reported results are omitted in the related papers, as evident from Table 2. However, by considering the typical experimental conditions adopted in FT-IR and Raman spectroscopies, the processes on which these spectroscopies are based, and the results previously reported, it is possible to notice that FT-IR signals are significantly higher than those detected in Raman measurements, but Raman spectra are generally characterized by narrow peaks that increase the selectivity in the identification of the different spectral contributions. Moreover, many commercial FT-IR spectrometers acquire signals from areas that are around 100 × 100 μm2. This makes it difficult to explore small ablated surfaces. Conversely, Raman spectra can explore regions with a spatial resolution of a few μm. It must be remembered that FT-IR can also reach a similar spatial resolution, but in this case, synchrotron radiation sources should be used. As previously stated, FT-IR spectra can only be acquired from dried samples, differently from Raman spectroscopy, which allows the study of samples independently from their hydration state. These considerations suggest that further work is required to take full advantage of these techniques that have already been demonstrated to be effective in verifying that optimal femtosecond laser ablation treatments do not modify the tooth samples’ biochemical composition, confirming the results obtained by means of more time-consuming and demanding techniques, such as XRD and XPS. It is worth noting that vibrational and X-ray-based techniques further validate the actual potentiality of femtosecond laser sources in dentistry.

Supplementary Materials

The following supporting information can be downloaded at: https://www.mdpi.com/article/10.3390/compounds4040036/s1, Basic principles of FT-IR and Raman spectroscopy [43,44,45,46,47,48,49,50,51,52]: S1. Fourier-Transform Infrared Spectroscopy (Figure S1. Schematic image of a Fourier-Transform Infrared spectrometer. Reprinted from Ref. [44] under Open Access conditions). S2. Raman spectroscopy (Figure S2. Schematic image of a micro-Raman spectroscopy experimental set-up. Reprinted from Ref. [44] under Open Access conditions). S3. A comparison between FT-IR and Raman spectroscopies.

Author Contributions

Conceptualization, M.L., M.P., I.D. and G.M.G.; data curation, M.L., M.P., I.D. and G.M.G.; writing, M.L., M.P., I.D. and G.M.G.; writing—review and editing, M.L., M.P., I.D., G.M.G. and U.R. All authors have read and agreed to the published version of the manuscript.

Funding

This research received no external funding.

Data Availability Statement

No new data were created or analyzed in this study. Data sharing is not applicable to this article.

Conflicts of Interest

The authors declare no conflicts of interest.

References

  1. Vogel, A.; Venugopalan, V. Mechanisms of pulsed laser ablation of biological tissues. Chem. Rev. 2003, 103, 577–644. [Google Scholar] [CrossRef] [PubMed]
  2. Liaqat, S.; Qayyum, H.; Rafaqat, Z.; Qadir, A.; Fayyaz, S.; Khan, A.; Jabeen, H.; Muhammad, N.; Khan, M.A. Laser as an innovative tool, its implications and advances in dentistry: A systematic review. J. Photochem. Photobiol. 2022, 12, 100148. [Google Scholar] [CrossRef]
  3. Ionin, A.A.; Kudryashov, S.I.; Samokhin, A.A. Material surface ablation produced by ultrashort laser pulses. Phys. Uspekhi 2017, 60, 149–160. [Google Scholar] [CrossRef]
  4. Walsh, L.J. The current status of laser applications in dentistry. Aust. Dent. J. 2003, 48, 146–155. [Google Scholar] [CrossRef] [PubMed]
  5. George, R. Laser in dentistry-review. Int. J. Dent. Clin. 2009, 1, 13–19. [Google Scholar]
  6. Lagunov, V.L.; Rybachuk, M.; Itthagarun, A.; Walsh, L.J.; George, R. Modification of dental enamel, dentin by an ultra-fast femtosecond laser irradiation: A systematic review. Opt. Laser Technol. 2022, 155, 108439. [Google Scholar] [CrossRef]
  7. He, L.H.; Swain, M.V. Understanding the mechanical behavior of human enamel from its structural and compositional characteristics. J. Mech. Behav. Biomed. Mater. 2008, 1, 18–29. [Google Scholar] [CrossRef]
  8. Gómez de Ferraris, M.E.; Campos Muñoz, A. Histología, Embriología e Ingeniería Tisular Bucodental. In Editorial Médica, 3rd ed.; Panamericana: Madrid, Spain, 2009; pp. 256–331. [Google Scholar]
  9. Beniash, E.; Stifler, C.A.; Sun, C.-Y.; Jung, G.S.; Qin, Z.; Buehler, M.J.; Pupa, U.P.; Gilbert, A. The hidden structure of human enamel. Nat. Commun. 2019, 10, 4383. [Google Scholar] [CrossRef]
  10. Murata, M.; Akazawa, T.; Mitsugi, M.; Arafat, M.; Um, I.W.; Minamida, Y.; Kim, K.W.; Kim, Y.K.; Sun, Y.; Qin, C. Autograft of dentin materials for bone regeneration. In Advances in Biomaterials Science and Biomedical Applications; Pignatello, R., Ed.; IntechOpen: London, UK, 2013; pp. 391–403. [Google Scholar]
  11. Hikov, T.; Pecheva, E.; Montgomery, P.; Antoni, F.; Leong-Hoi, A.; Petrov, T. Precise femtosecond laser ablation of dental hard tissue: Preliminary investigation on adequate laser parameters. J. Phys. Conf. Ser. 2017, 794, 012036. [Google Scholar] [CrossRef]
  12. Petrov, T.; Pecheva, E.; Walmsley, A.D.; Dimov, S. Femtosecond laser ablation of dentin and enamel for fast and more precise dental cavity preparation. Mater. Sci. Eng. C 2018, 90, 433–438. [Google Scholar] [CrossRef]
  13. Rapp, L.; Madden, S.; Brand, J.; Walsh, L.J.; Spallek, H.; Zuaiter, O.; Habeb, A.; Hirst, T.R.; Rode, A.V. Femtosecond laser dentistry for precise and efficient cavity preparation in teeth. Biomed. Opt. Express. 2022, 13, 4559–4571. [Google Scholar] [CrossRef] [PubMed]
  14. Le, Q.T.; Bertrand, C.; Vilar, R. Femtosecond laser ablation of enamel. J. Biomed. Opt. 2016, 21, 065005. [Google Scholar] [CrossRef] [PubMed]
  15. Rapp, L.; Madden, S.; Brand, J.; Maximova, K.; Walsh, L.J.; Spallek, H.; Zuaiter, O.; Habeb, A.; Hirst, T.R.; Rode, A.V. Investigation of laser wavelength effect on the ablation of enamel and dentin using femtosecond laser pulses. Sci. Rep. 2023, 13, 20156. [Google Scholar] [CrossRef] [PubMed]
  16. Sabel, N.; Karlsson, A.; Sjölin, L. XRMA analysis and X-ray diffraction analysis of dental enamel from human permanent teeth exposed to hydrogen peroxide of varying pH. J. Clin. Exp. Dent. 2019, 11, e512–e520. [Google Scholar] [CrossRef]
  17. Alves, S.; Oliveira, V.; Vilar, R. Femtosecond laser ablation of dentin. J. Phys. D Appl. Phys. 2012, 45, 24540. [Google Scholar] [CrossRef]
  18. Shah, D.; Roychowdhury, T.; Bahr, S.; Dietrich, P.; Meyer, M.; Thißen, A.; Linford, M.R. Human tooth, by near-ambient pressure x-ray photoelectron spectroscopy. Surf. Sci. Spectra 2019, 26, 014016. [Google Scholar] [CrossRef]
  19. Loganathan, S.; Santhanakrishnan, S.; Bathe, R.; Arunachalam, M. Prediction of femtosecond laser ablation parameter on human teeth using chemical compositional analysis. Procedia Manuf. 2019, 34, 379–384. [Google Scholar] [CrossRef]
  20. Chen, H.; Li, H.; Sun, Y.C.; Wang, Y.; Lü, P.J. Femtosecond laser for cavity preparation in enamel and dentin: Ablation efficiency related factors. Sci. Rep. 2016, 6, 20950. [Google Scholar] [CrossRef]
  21. Cassimiro-Silva, P.F.; Rego Filho, F.M.G.; Santos Afonso de Melo, L.; Costa Dias, T.J.; Cruz Falcão, C.; Queiroz de Melo Monteiro, G.; Gomes, A.S.L. Effects of femtosecond laser irradiation on the microshear bond strength of sound and demineralized dentin. J. Laser Appl. 2019, 31, 012002. [Google Scholar] [CrossRef]
  22. Liu, Y.; Wang, Y. Proanthocyanidins’ efficacy in stabilizing dentin collagen against enzymatic degradation: MALDI-TOF and FTIR analyses. J. Dent. 2013, 4, 535–542. [Google Scholar] [CrossRef]
  23. Liu, Y.; Yao, X.; Liu, Y.W.; Wang, Y. A Fourier transform infrared spectroscopy analysis of carious dentin from transparent zone to normal zone. Caries Res. 2014, 48, 320–329. [Google Scholar] [CrossRef] [PubMed]
  24. Ortiz-Ruiz, A.J.; de Dios Teruel-Fernández, J.; Alcolea-Rubio, L.A.; Hernández-Fernández, A.; Martínez-Beneyt, Y.; Gispert-Guirado, F. Structural differences in enamel and dentin in human, bovine, porcine, and ovine teeth. Ann. Anat. 2018, 218, 7–17. [Google Scholar] [CrossRef] [PubMed]
  25. Lada, A. Analysis of dentistry cements using FTIR spectroscopy. Sci. Technol. Innov. 2020, 11, 33–39. [Google Scholar] [CrossRef]
  26. France, C.A.M.; Sugiyama, N.; Aguayo, E. Establishing a preservation index for bone, dentin, and enamel bioapatite mineral using ATR-FTIR. J. Archaeol. Sci. Rep. 2020, 33, 10255. [Google Scholar] [CrossRef]
  27. Bistey, T.; Nagy, I.P.; Simò, A.; Hegedus, C. In vitro FT-IR study of the effects of hydrogen peroxide on superficial tooth enamel. J. Dent. 2007, 35, 325–330. [Google Scholar] [CrossRef]
  28. Diez, C.; Rojo, M.Á.; Martín-Gil, J.; Martín-Ramos, P.; Garrosa, M.; Córdoba-Diaz, D. Infrared Spectroscopic Analysis of the Inorganic Components from Teeth Exposed to Psychotherapeutic Drugs. Minerals 2022, 12, 28. [Google Scholar] [CrossRef]
  29. Douchy, L.; Gauthier, R.; Abouelleil-Sayeda, H.; Colon, P.; Grosgogeat, B.; Bosco, J. The effect of therapeutic radiation on dental enamel and dentin: A systematic review. Dent. Mater. 2022, 38, e181–e201. [Google Scholar] [CrossRef]
  30. Seredin, P.; Goloshchapov, D.; Buylov, N.; Nesterov, D.; Kashkarov, V.; Ippolitov, Y.; Ippolitov, I.; Kuyumchyan, S.; Vongsvivut, J. A Study of the Effects of Medical Dental Laser and Diamond Drill on Dentin Tissue during Dental Restoration Based on Spectral Imaging and Multivariate Analysis of Synchrotron FTIR Microspectroscopy Data. Photonics 2023, 10, 881. [Google Scholar] [CrossRef]
  31. Anwar Alebrahim, M.; Krafft, C.; Popp, J. Raman imaging to study structural and chemical features of the dentin enamel junction. IOP Conf. Ser. Mater. Sci. Eng. 2015, 92, 012014. [Google Scholar] [CrossRef]
  32. Gaeta, G.; Riccio, R.; De Rosa, A.; Camerlingo, C.; Lepore, M. A comparative study on dentine/resin interface of lased and unlased tooth cavities by micro-Raman spectroscopy. J. Oral. Laser Appl. 2003, 3, 243–249. [Google Scholar]
  33. Camerlingo, C.; Lepore, M.; Gaeta, G.M.; Riccio, R. Raman spectroscopy on dentin/resin interface of lased and unlased dental samples. In Lasers in Dentistry IX; Rechmann, P., Fried, D., Hennig, T., Eds.; SPIE: St. Bellingham, WA, USA, 2003; Volume 4950, pp. 64–72. [Google Scholar]
  34. Camerlingo, C.; Lepore, M.; Gaeta, G.M.; Riccio, R.; Riccio, C.; De Rosa, A.; De Rosa, M. Er-YAG laser treatments on dentine surface: Micro-Raman spectroscopy and SEM analysis. J. Dent. 2004, 32, 399–405. [Google Scholar] [CrossRef] [PubMed]
  35. Camerlingo, C.; Gaeta, G.M.; Riccio, R.; Rosso, F.; Muscariello, L.; Lepore, M. Micro-Raman Spectroscopy and E-SEM analysis of hybrid layer at the dentin/resin interface of three different composite restorative resins. In Lasers in Dentistry XII; Rechmann, P., Fried, D., Eds.; SPIE: St. Bellingham, WA, USA, 2006. [Google Scholar]
  36. Alves, S.; Vilar, R.; Oliveira, V.; Cangueiro, L.; Almeida, A. Femtosecond laser ablation of dentin. In Proceedings of the ICALEO 2012—31st International Congress on Applications of Lasers and Electro-Optics, Anaheim, CA, USA, 23–27 September 2012; pp. 882–888. [Google Scholar]
  37. Le, Q.T.; Bertrand, C.; Vilar, R. Structural modifications induced in dentin by femtosecond laser. J. Biomed. Opt. 2016, 21, 125007. [Google Scholar] [CrossRef] [PubMed]
  38. Loganathan, S.; Santhanakrishnan, S.; Bathe, R.; Arunachalam, M. FTIR and Raman as a noninvasive probe for predicting the femtosecond laser ablation profile on heterogeneous human teeth. J. Mech. Behav. Biomed. Mater. 2021, 115, 104256. [Google Scholar] [CrossRef] [PubMed]
  39. Ji, L.F.; Li, L.; Devlin, H.; Liu, Z.; Whitehead, D.; Wang, Z.B.; Wang, W.; Jiao, J. Ti:sapphire femtosecond laser interaction with human dental dentine. Surf. Eng. 2011, 27, 749–753. [Google Scholar] [CrossRef]
  40. Weinlaender, M.; Beumer, J.; Kenney, E.B.; Moy, P.K.; Adar, F. Raman microprobe investigation of the calcium phosphate phases of three commercially available plasma-flame-sprayed hydroxyapatite-coated dental implants. J. Mater. Sci. Mater. Med. 1992, 3, 397–401. [Google Scholar] [CrossRef]
  41. Miro, S.; Costantini, J.M.; Bardeau, J.F.; Chateigner, D.; Studer, F.; Balanzat, E. Raman spectroscopy study of damage induced in fluorapatite by swift heavy ion irradiations. J. Raman Spectrosc. 2011, 42, 2036–2041. [Google Scholar] [CrossRef]
  42. Saber-Samandari, S.; Alamara, K.; Saber-Samandari, S.; Gross, K.A. Micro-Raman spectroscopy shows how the coating process affects the characteristics of hydroxylapatite. Acta Biomater. 2013, 9, 9538–9546. [Google Scholar] [CrossRef]
  43. Beć, K.B.; Grabska, J.; Huck, C.W. Biomolecular and bioanalytical applications of infrared spectroscopy: A review. Anal. Chim. Acta 2020, 1133, 150e177. [Google Scholar] [CrossRef]
  44. d’Apuzzo, F.; Nucci, L.; Delfino, I.; Portaccio, M.; Minervini, G.; Isola, G.; Serino, I.; Camerlingo, C.; Lepore, M. Application of Vibrational Spectroscopies in the Qualitative Analysis of Gingival Crevicular Fluid and Periodontal Ligament duringOrthodontic Tooth Movement. J. Clin. Med. 2021, 10, 1405. [Google Scholar] [CrossRef]
  45. Faramarzi, B.; Moggio, M.; Diano, N.; Portaccio, M.; Lepore, M. A Brief Review of FT-IR Spectroscopy Studies of Sphingolipids in Human Cells. Biophysica 2023, 3, 158–180. [Google Scholar] [CrossRef]
  46. Baker, M.J.; Trevisan, J.; Bassan, P.; Bhargava, R.; Butler, H.J.; Dorling, K.M.; Fielden, P.R.; Fogarty, S.W.; Fullwood, N.J.; Heys, K.A.; et al. Using Fourier transform IR spectroscopy to analyze biological materials. Nat. Protoc. 2014, 9, 1771–1791. [Google Scholar] [CrossRef] [PubMed]
  47. Beasley, M.M.; Bartelink, E.J.; Taylor, L.; Miller, R.M. Comparison of transmission FTIR, ATR, and DRIFT spectra: Implications for assessment of bone bioapatite diagenesis. J. Archaeol. Sci. 2014, 46, 16–22. [Google Scholar] [CrossRef]
  48. Errico, S.; Moggio, M.; Diano, N.; Portaccio, M.; Lepore, M. Different experimental approaches for Fourier-Transform infrared spectroscopy applications in biology and biotechnology: A selected choice of representative results. Biotechnol. Appl. Biochem. 2023, 70, 937–961. [Google Scholar] [CrossRef] [PubMed]
  49. Tsuda, H.; Arends, J. Raman spectroscopy in dental research: A short review of recent studies. Adv. Dent. Res. 1997, 11, 539–547. [Google Scholar] [CrossRef]
  50. Butler, H.J.; Ashton, L.; Bird, B.; Cinque, G.; Curtis, K.; Dorney, J.; Esmonde-White, K.; Fullwood, N.J.; Gardner, B.; Martin-Hirsch, P.L.; et al. Using Raman spectroscopy to characterize biological materials. Nat. Protoc. 2016, 11, 664–687. [Google Scholar] [CrossRef]
  51. Pezzotti, G. Raman spectroscopy in cell biology and microbiology. J. Raman Spectrosc. 2021, 52, 2348–2443. [Google Scholar] [CrossRef]
  52. Otel, I. Overall Review on Recent Applications of Raman Spectroscopy Technique in Dentistry. Quantum Beam Sci. 2023, 7, 5. [Google Scholar] [CrossRef]
Figure 1. FT-IR spectra on untreated (a) and treated (b) dentin specimens. Reproduced from Ref. [36] under Open Access conditions.
Compounds 04 00036 g001
Figure 2. FT-IR spectra of polished and dentin samples treated with different laser fluences. Reproduced from Ref. [37] under Open Access conditions.
Compounds 04 00036 g002
Figure 3. FT-IR spectra of untreated and treated dentin and enamel samples. Reprinted from Ref. [12] under Open Access conditions.
Compounds 04 00036 g003
Figure 4. Raman spectra of polished and laser-treated enamel samples. Different laser fluence levels were used for ablation treatment. Reproduced from Ref. [14] under Open Access conditions.
Compounds 04 00036 g004
Figure 5. Raman spectra of enamel and dentin before and after laser treatment obtained with 10 μJ energy, a 500 mm/s scanning speed, and a 100 kHz repetition rate. Reproduced from Ref. [11] under Open Access conditions.
Compounds 04 00036 g005
Figure 6. Raman spectra of (a) treated and untreated enamel; (b) analogous spectra for dentin. Reproduced from Ref. [13] under Open Access conditions.
Compounds 04 00036 g006
Figure 7. Panel (a) Raman spectrum of untreated enamel sample with peak assignments from Ref. [13]; panel (b) Raman spectrum of enamel samples treated with IR and green wavelengths for all the used laser fluences; panel (c) Raman spectra for enamel samples treated with UV wavelength at different laser fluences and line overlap. Reprinted from Ref. [15] under Open Access conditions.
Compounds 04 00036 g007
Figure 8. Panel (a) Raman spectrum of untreated dentin sample with peak assignments from Ref. [13]; panel (b) Raman spectra of dentin samples treated with IR wavelength; panel (c) Raman spectra of dentin samples treated with green wavelengths; panel (d) Raman spectra for dentin samples treated with UV wavelength at different laser fluences and line overlap. Reprinted from Ref. [15] under Open Access conditions.
Compounds 04 00036 g008
Table 1. Characterization of dentin and enamel surfaces by using FT-IR spectroscopy. Abbreviations (HA: hydroxyapatite; ν: stretching; δ: bending).
Dentin Enamel
Peak Position (cm−1)
[17,36]
Peak Position (cm−1)
[14]
Peak Position (cm−1)
[12]
Peak Position (cm−1)
[12]
Assignments
3320 ν OH
ν N-H (Amide A) of collagen
2920
2850
ν C-H of
organic compounds and
contaminants
1750 ν C=O
16471680–16001650absentν C=O
(Amide I) of collagen
15411580–151015501550ν C-N and d N-H
(Amide II) of collagen
14561450 ν3 CO3−2 substituted in
A-type OH
14501450ν3 C-O
14371415 ν3 CO3−2 substituted in
B-type PO43−
14101410d C-O
1227 1237absentAmide III of collagen
10451005 1066ν1 PO43− of HA
Table 2. Experimental conditions for vibrational spectra acquisition for dentin and enamel samples.
Vibrational
Technique
Collection
Geometry
Accumulated
Scans
Spectral
Range and
Resolution
(cm−1)
Investigated
Spatial Area
Refs.
FT-IRTransmission2564000–650;
4
n. a.[17]
ATRn. a.2000–700;
n. a.
n. a.[37]
ATRn. a.4000–400;
8
n. a.[12]
Raman Acquisition
time (s)
Wavenumber shift range
and spectral
resolution
(cm−1)
Laser spot
diameter
(cm−1)
Back
scattering
n. a.700–1000;
n. a.
n. a.[39]
Back
scattering (a)
n. a.300–1200;
1
n. a.[37]
Back
scattering (b)
n. a.100–3000;
1
n. a.[11]
Back
scattering (c)
20300–1800;
n. a.
n. a.[13,15]
(a) Laser wavelength: 786 nm; laser power: 5 mW; surface region thickness: 7 μm. (b) Laser wavelength: 532 nm. (c) Laser wavelength: 785 nm; laser power: 3.8 mW.
Table 3. Characterization of dentin and enamel surfaces by using Raman spectroscopy. Abbreviations (HA: hydroxyapatite; νs: symmetric stretching; νas: antisymmetric stretching; δs: symmetric bending; δas: antisymmetric bending).
DentinEnamel
Peak Position
(cm−1)
[39]
Peak Position
(cm−1)
[11]
Peak Position
(cm−1)
[13,15]
Peak Position
(cm−1)
[14]
Peak Position
(cm−1)
[11]
Peak Position
(cm−1)
[13,15]
Assignments
430434.83 ± 0.33 430427.5 ± 0.4δs PO4
444.5 ± 1.6δs PO4
470 ν2 PO43− of HA
590 590584.72 ± 0.4δas PO4
614.3 ± 0.7 δas PO4
960960 960960959.96 ± 0.02νs PO43− of HA
10451024.55 ± 1.63102510451041.4 ± 2.1νas PO43− of HA
1070 1070.3 ± 0.8C-O bond in CO3
12471240.7 ± 0.1 Amide III
14501455.44 ± 0.70 CH2 wagging
1520 Amide II
16601665.92 ± 0.75 Amide I
1780 ν C=O of carbonyl groups
2882 ν CH of organic group
2942
Disclaimer/Publisher’s Note: The statements, opinions and data contained in all publications are solely those of the individual author(s) and contributor(s) and not of MDPI and/or the editor(s). MDPI and/or the editor(s) disclaim responsibility for any injury to people or property resulting from any ideas, methods, instructions or products referred to in the content.

