Abstract
This research introduces a novel method that integrates both unsupervised and supervised learning, leveraging SimCLR (Simple Framework for Contrastive Learning of Visual Representations) for self-supervised learning along with different pre-trained models to improve microscopic image classification of Babesia parasite in canines. We focused on three popular CNN architectures, namely ResNet, EfficientNet, and DenseNet, and evaluated the impact of SimCLR pre-training on their performance. A detailed comparison of the different variants of ResNet, EfficientNet, and Densenet in terms of classification accuracy and training efficiency is presented. Base models such as different variants of the ResNet, EfficientNet, and DenseNet models were utilized within the SimCLR framework. Firstly, the models were pre-trained on unlabeled images, followed by training classifiers on labeled datasets. This approach significantly improved the robustness and accuracy, demonstrating the potential benefits of combining contrastive learning with conventional supervised techniques. The highest accuracy of 97.07% was achieved by Efficientnet_b2. Thus, detection of Babesia or other hemoparasites in microscopic blood smear images could be automated with high accuracy without using a labelled dataset.
1. Introduction
Medical imaging technologies such as MRI, CT scan, Ultrasonography, microscopic images, etc., are extensively used for the diagnosis and classification of diseases [1]. Traditionally, clinical experts are responsible for analyzing the images to generate diagnostic reports, which poses several challenges, such as the possibility of human error; slow speed of evaluation; lack of concurrency, i.e., one image at a time; and the lack of availability of medical experts in rural areas [2]. The detection of haemoprotozoan in animals is based on manual microscopic examination, which has several disadvantages due to human intervention [3]. However, microscopic imaging remains a staple for diagnosing specific infections and parasitic diseases, especially in veterinary contexts where conditions like babesiosis are prevalent.
Canine babesiosis is a severe tick-borne disease affecting dogs globally, including India, with Assam not excepted [4,5]. This disease, caused by protozoan parasites of the genus Babesia (Apicomplexa, Piroplasmida), can lead to symptoms ranging from fever and lethargy to severe anemia and organ failure, and can be life-threatening if left untreated [6]. There are two major species of canine Babesia, viz., B. canis and B. gibsoni, which are morphologically differentiated based on their size. Morphologically, B. canis is the larger form (4–5 μm in length), which is pyriform in shape, whereas, B. gibsoni is the smaller form (1.5–2.5 μm in lenght) of Babesia that lacks the usual pear-shaped morphology [7]. Early and accurate diagnosis is essential for timely treatment and effective disease management. Traditional diagnostic approaches rely on manual examination of blood smears under a microscope, requiring trained experts to identify infected cells. This method is not only labor-intensive and prone to human error but also limited in accessibility, particularly in rural or resource-constrained areas. In this regard, deep learning algorithms have proven to be highly effective and beneficial for the analysis of biological images [8,9]. Recent advancements in deep learning have shown promise in automating complex tasks, especially in the field of medical imaging, where convolutional neural networks (CNNs) excel at identifying intricate patterns in visual data [10]. Deep learning models have outperformed traditional techniques in various medical applications, including cancer detection [11], pneumonia screening [12], and retinal disease classification [13]. To address these challenges, self-supervised learning (SSL) has emerged as a viable alternative, enabling models to learn valuable feature representations from unlabeled data [14]. SSL methods, such as SimCLR (Simple Framework for Contrastive Learning of Visual Representations) [15], exploit structural patterns in data without the need for labels, making them ideal for settings with limited labeled samples. SimCLR uses contrastive learning, where the model learns to distinguish between positive and negative pairs of images by maximizing similarity within the same sample (positive pairs) and minimizing similarity across different samples (negative pairs). This approach is particularly advantageous in domains like medical imaging, where key features may be subtle and context-dependent. Hence, this study aims to use SimCLR-based contrastive learning with established CNN architectures such as ResNet [16], EfficientNet [17], and DenseNet [18] to enhance model performance on the binary classification of Babesia infection in canine blood samples based on microscopic blood smear images.
2. Materials and Methods
2.1. System Description
All experiments were conducted on Google Colab, equipped with an NVIDIA Tesla V100 GPU, 32 GB of RAM, and an Intel Xeon processor. We used TensorFlow 2.6.0 and PyTorch 1.9.0 as the primary frameworks for implementing and training our models. These resources facilitated efficient handling of large CNN architectures and high-resolution images, critical for deep learning in medical imaging. Figure 1 shows the flow of the SimCLR-based self-supervised learning framework for classification of Babesia-positive or Babesia-negative.
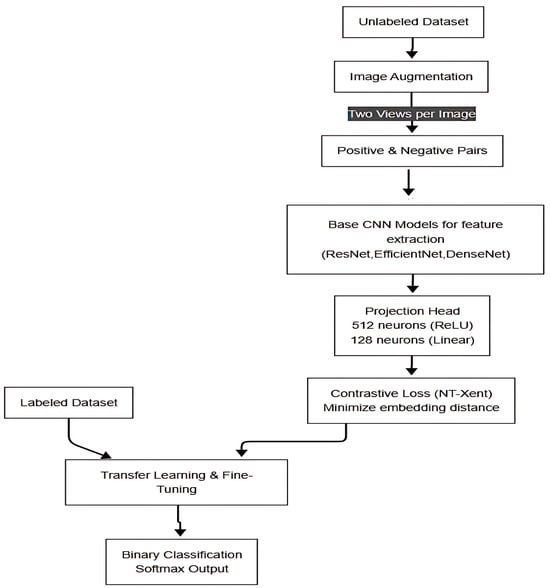
Figure 1.
Proposed SimCLR-based self-supervised learning framework for binary classification of Babesia infection in microscopic blood images.
2.2. Dataset
In this study, the microscopic images of canine RBC with or without the Babesia gibsoni parasite were taken from the dataset as described previously [19]. Briefly, canine babesiosis-suspected blood samples were used to prepare the blood smears on glass slides and observed under microscope to detect the presence or absence of B. gibsoni in RBCs. Then images were captured by a mounted microscope camera. The slide images captured contain many blood cells and these blood cells were cropped by using various preprocessing techniques like resizing, converting to grayscale, removing noise using Gaussian blur, performing morphological operations, and finally contour detection to separate each cell and save them in a directory.
The dataset is organized into two subsets: a labeled dataset for model evaluation and fine-tuning, and an unlabeled dataset for self-supervised pre-training with SimCLR consisting of 512 images. Images in the labeled dataset are separated into two classes: uninfected RBC images are kept in a “negative” directory while infected RBC images are kept in a “positive” directory, with 533 images in each directory.
Standard preprocessing techniques were applied to all images, including resizing to 224 × 224 pixels and normalization using mean = [0.485, 0.456, 0.406] and standard deviation = [0.229, 0.224, 0.225]. To improve generalization, data augmentation was implemented using random resized cropping, horizontal flipping, color jitter, grayscale conversion (p = 0.2), and Gaussian noise injection.
2.3. SimCLR for Contrastive Learning
SimCLR was employed as a self-supervised learning framework to pre-train the base CNN models on the unlabeled dataset. SimCLR’s main objective is to learn feature representations by contrasting augmented views of images, identifying pairs of images that belong to the same sample.
Positive and Negative Pair Formation: Each image was augmented twice, creating two distinct views as a positive pair. Augmented views from different images in a batch were treated as negative pairs, allowing the model to differentiate between individual samples.
Projection Head: After passing the augmented images through the base CNN model (e.g., ResNet, EfficientNet, or DenseNet), the output features were mapped to a lower-dimensional space using a projection head. The projection head consists of a fully connected layer with 512 neurons and ReLU activation, followed by a final linear layer with 128 neurons.
Contrastive Loss (NT-Xent): The primary objective of SimCLR is to minimize the contrastive loss, or NT-Xent (Normalized Temperature-scaled Cross Entropy) loss [20], defined for a positive pair as:
where
- and are the embeddings of the positive pair in the projection space;
- represents cosine similarity between the embeddings;
- is a temperature parameter that controls the concentration of the similarity distribution.
This loss function encourages the model to bring augmented views of the same image closer in the embedding space while pushing apart the views of different images. By learning these representations, the model gains a deeper understanding of cellular features relevant to Babesia infection.
2.4. Model Training
After completing self-supervised pre-training with SimCLR, the CNN models (ResNet, EfficientNet, and DenseNet) were fine-tuned on the labeled dataset for the binary classification task. ResNet tackles the vanishing gradient problem that often trips up deep networks by using something called residual learning. Instead of the layers trying to learn the output directly, they focus on understanding the difference (or residual) between the input and output. This approach helps get around the usual optimization struggles that can hold back traditional deep networks, making it possible to train networks that are really deep—up to 152 layers! With an impressive error rate of just 3.57% on ImageNet, ResNet clinched first place in the ILSVRC 2015 classification task. Plus, it also boosted COCO object detection performance by a huge 28% [21]. An EfficientNet is a group of convolutional neural networks that maintain the best accuracy and efficiency by balancing depth, width, and resolution of the network by employing a compound scaling method. EfficientNet-B0 was scaled to obtain EfficientNet-B1 to B7, by varying the compound coefficient (ϕ) and the scaling coefficients (α, β, γ). EfficientNet also adopts the MBConv architecture of MobileNetV2, which mainly involves the expansion and projection layers, the depthwise convolutions, a squeeze-and-excitation module, and the Swish activation function [22]. The DenseNet architecture improves deep learning efficiency by connecting each layer to all previous layers, enhancing feature reuse, mitigating vanishing gradients, and reducing computational cost. Unlike ResNet, which merely adds residual attachments, DenseNet concatenates feature maps, providing a way for data to flow better with fewer parameters. It is a series of Dense Blocks divided by transition layers. The growth rate (k) regulates feature enlargement. DenseNet had shown the best outcomes for CIFAR-10, CIFAR-100, and SVHN by using much fewer parameters. In comparison with ResNet, DenseNet-121 went up to 25.0% top-1 and 7.8% top-5 error on ImageNet, whereas ResNet-101 had a lower quantity of parameters. That is the reason why it can be a high-power alternative for deep learning tasks [23].
This process involved following steps:
Transfer Learning and Fine-tuning: The learned representations from SimCLR pre-training were used to initialize the models, and a linear classifier head was appended for binary classification (Babesia-positive or Babesia-negative) consisting of a Global Average Pooling (GAP) layer, followed by fully connected layers with ReLU activation and dropout regularization (0.3) to prevent overfitting. The final output layer had two neurons with softmax activation, corresponding to the two classes. Fine-tuning involved supervised training on the labeled data, optimizing the binary cross-entropy loss function.
Hyperparameter Tuning: Hyperparameters, including learning rate, batch size, and dropout rate, were optimized to maximize classification accuracy. Optimization was performed using the Adam optimizer, with an initial learning rate of 3 × 10⁻⁴ and hyperparameters set to β1 = 0.9, β2 = 0.999. The model was trained in batches of 64 images over 10 epochs, with a dynamic learning rate decay mechanism that reduced the learning rate by a factor of 0.1 if validation loss plateaued for five consecutive epochs. An early stopping criterion was implemented to prevent overfitting by monitoring validation loss and terminating training if no improvement was observed over multiple epochs.
Evaluation Metrics: The trained models were evaluated using standard classification metrics, including accuracy, precision, recall, F1-score, specificity, and sensitivity. These metrics provided a comprehensive assessment of each model’s capability to distinguish between Babesia-positive and Babesia-negative samples effectively. A confusion matrix was generated to analyze true positives (TP), false positives (FP), true negatives (TN), and false negatives (FN), providing insights into the model’s classification performance.
2.5. Implementation and Testing
The fine-tuned models were evaluated on the labeled dataset, and performance was tracked over multiple epochs, focusing on classification accuracy and contrastive loss trends. EfficientNet_b2 achieved the highest accuracy, confirming the efficacy of the self-supervised SimCLR pre-training in enhancing the model’s ability to identify Babesia infection in canine blood samples.
3. Results
In this study, 12 different classifiers were trained (Table 1). At first, SimCLR was used to pre-train the models, which is a self-supervising technique, on the unlabeled dataset which consisted of 512 images of positive and negative blood cells. It was observed that all the models showed a steady decrease in contrastive loss during pre-training (Figure 2). Across all models, there is a general downward trend in training loss, indicating learning progress; while all models show similar convergence behavior, the ResNet and EfficientNet models display slightly smoother loss curves compared to the DenseNet architectures. After training on the unlabeled dataset, the models were trained on labeled dataset. The classifier training loss also shows a clear downward trend for all the models (Figure 3). The fluctuations observed in the loss values diminish gradually after the initial phase, though some variance persists across models. Compared to the SimCLR graph, this classifier training loss curve appears smoother and more stable. The classifier accuracy values across different epochs for all the models are shown in (Figure 4). All models demonstrate a sharp increase in accuracy during the first few epochs, after which the accuracy stabilizes and converges. The DenseNet and EfficientNet models show smoother convergence patterns, while the ResNet models also exhibit competitive performance. The results of this study highlighted significant findings in the performance of CNN models pre-trained with SimCLR on the binary classification task of detecting Babesia gibsoni infection in canine blood samples. The study involved the use of three CNN architectures: ResNet, EfficientNet, and DenseNet. Each model was evaluated for accuracy and training efficiency with a focus on comparing individual model performances after SimCLR pre-training.

Table 1.
Accuracy of different classifiers.
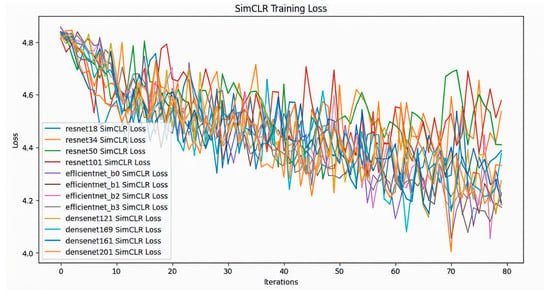
Figure 2.
SimCLR training loss over a series of iterations for different deep learning models including ResNet (resnet18, resnet34, resnet50, resnet101), EfficientNet (efficientnet_b0, efficientnet_b1, efficientnet_b2, efficientnet_b3), and DenseNet (densenet121, densenet161, densenet169, densenet201). The X-axis denotes the number of iterations, indicating the progress of the training process, while the Y-axis represents the loss values, which measure the model’s error during training. Each colored line in the graph represents the SimCLR training loss trajectory of a different deep learning model over multiple iterations.
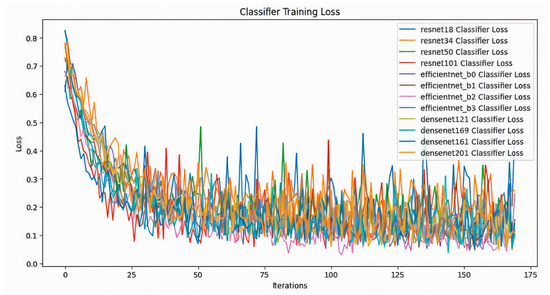
Figure 3.
Classifier training loss comparison across models including ResNet (resnet18, resnet34, resnet50, resnet101), EfficientNet (efficientnet_b0, efficientnet_b1, efficientnet_b2, efficientnet_b3), and DenseNet (densenet121, densenet161, densenet169, densenet201). The X-axis denotes the number of iterations, reflecting the progression of training, while the Y-axis represents the loss value, which indicates the model’s error during training. Each colored line in the graph represents the training loss trajectory of a different deep learning model as it learns to classify data over multiple iterations.
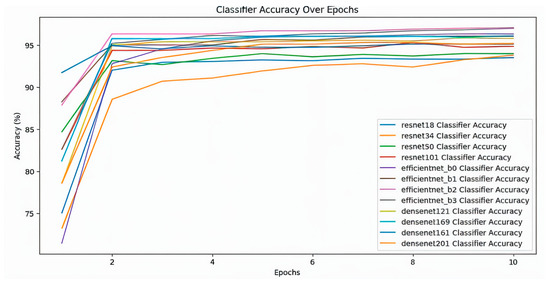
Figure 4.
Classifier accuracy over epochs for different deep learning models, including ResNet (resnet18, resnet34, resnet50, resnet101), EfficientNet (efficientnet_b0, efficientnet_b1, efficientnet_b2, efficientnet_b3), and DenseNet (densenet121, densenet161, densenet169, densenet201). The X-axis represents the number of epochs, indicating how many times the model has seen the entire dataset, while the Y-axis represents classification accuracy as a percentage. Each colored line corresponds to a different model’s accuracy improvement over epochs.
3.1. SimCLR Pre-Training Performance
During pre-training on the unlabeled dataset, SimCLR helped the models develop robust feature representations by contrasting positive pairs (augmented views of the same image) with negative pairs (views of different images). This self-supervised approach enabled the models to learn critical distinctions between infected and healthy blood cells without relying on labeled data. All models showed a steady decrease in contrastive loss during this phase, suggesting successful learning of representative features from the unlabeled images.
3.2. Classification Accuracy
Among the tested models, EfficientNet variants consistently demonstrated higher accuracy rates. Specifically, EfficientNet_b2 achieved the highest accuracy of 97.09% (Table 1), slightly outperforming EfficientNet_b3, which reached 97.00% (Table 1). EfficientNet_b2’s superior performance can be attributed to its efficient scaling and adaptability to the complexity of the blood cell images. This high level of accuracy indicates that EfficientNet_b2 is exceptionally well-suited for the binary classification task of Babesia gibsoni detection, likely due to the effective combination of self-supervised pre-training with SimCLR and the model’s inherent architecture.
3.3. Comparative Analysis Across Models
When compared to the ResNet and DenseNet models, EfficientNet variants showed an overall edge in classification accuracy. The ResNet models achieved a range of 93.53% to 94.84%, with ResNet101 performing the best within this group at 94.84% (Table 1). The DenseNet models performed accurately among its variants at 96.15% (Table 1). The results suggest that while the ResNet and DenseNet architectures performed well, EfficientNet’s architecture—especially the EfficientNet_b2 variant—was particularly effective for this task, likely due to its compound scaling of depth, width, and resolution, which allowed it to capture more nuanced features in the blood cell images.
3.4. Training Loss and Convergence
During the training phase on the labeled dataset, each model demonstrated a clear downward trend in classifier training loss over successive epochs, indicating effective learning and convergence. This trend was particularly prominent for EfficientNet variants, which achieved lower training loss levels compared to the ResNet and DenseNet models. The rapid convergence of EfficientNet_b2 highlights its efficiency in learning discriminative features between infected and healthy samples, further supporting its suitability for this classification task.
3.5. Evaluation Metrics and Confusion Matrix Analysis
To provide a comprehensive assessment, the models were evaluated using accuracy, F1 score, and confusion matrices. The confusion matrix for EfficientNet_b2 revealed a high rate of true positives, correctly identifying Babesia infected samples in 5186 cases. This result suggests not only high accuracy but also strong specificity and sensitivity, essential in medical diagnostics, where false negatives and false positives can have critical consequences. The F1 score for EfficientNet_b2 reinforced this, showing balanced precision and recall, which is crucial for reliable disease detection. The confusion matrix of different classifiers is shown in Figure 5a–l. The comparison presented in Table 2 evaluates the performance of various deep learning models using key metrics such as precision, recall, F1 score, and specificity. EfficientNet-B2 and DenseNet161 are identified as the models with the highest recall values (97.3% and 96.4%, respectively), indicating their ability to identify true positives accurately. On the other hand, models like ResNet34 and ResNet18 exhibit lower recall values (89.9% and 91.6%, respectively), suggesting that they may fail to identify some positive cases. EfficientNet-B2 also leads the models in terms of F1 score (95.9%), indicating strong overall performance in classification. Specificity values are consistent across all models and exceed 90%, signifying their capability to identify negatives accurately. These findings suggest that EfficientNet-B2 and DenseNet161 are good options when high recall and accuracy are required, while ResNet34 may be suitable for less sensitive tasks that can tolerate minor lapses in recall.
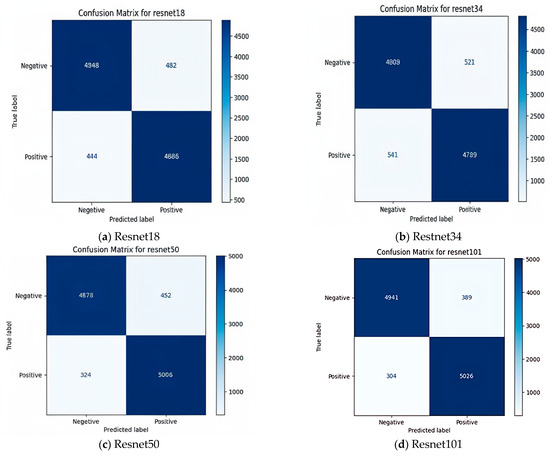
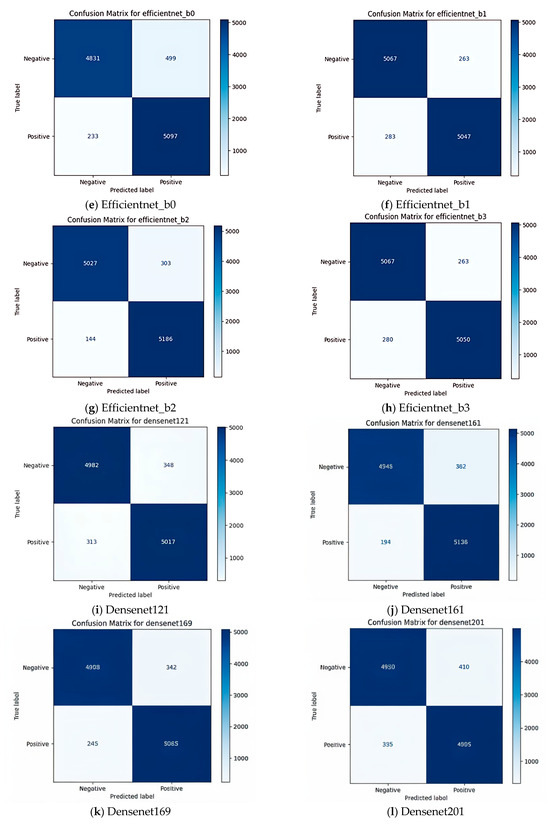
Figure 5.
Confusion matrices of various deep learning models: (a) Resnet18, (b) Restnet34, (c) Resnet50, (d) Resnet101, (e) Efficientnet_b0, (f) Efficientnet_b1, (g) Efficientnet_b2, (h) Eficientnet_b3, (i) Densenet121, (j) Densenet161, (k) Densenet169, (l) Densenet201. In each model, the top-left quadrant represents true negatives (TN), where the model correctly identified negative samples, indicating its ability to recognize non-target cases accurately. The top-right quadrant contains false positives (FP), where negative cases were misclassified as positive. The bottom-left quadrant consists of false negatives (FN), where actual positive cases were incorrectly labeled as negative. Lastly, the bottom-right quadrant shows true positives (TP), where the model correctly identified positive cases, reflecting its effectiveness in detecting target instances.

Table 2.
Performance metrics of deep learning models based on confusion matrix analysis.
4. Discussion
By leveraging the strengths of both self-supervised and transfer learning, our approach trains models on unlabeled blood cell images before fine-tuning them on a smaller labeled dataset. This study demonstrates that this framework, with pre-trained models fine-tuned via SimCLR, offers a significant improvement in accuracy over traditional single-model approaches. This method holds potential not only for canine Babesia gibsoni detection but also for broader applications in medical and veterinary diagnostics where labeled data are scarce. In this study, the CNN models Resnet18, Resnet34, Resnet50, Resnet101, Efficientnet_b0, Efficientnet_b1, Efficientnet_b2, Efficientnet_b3, Densenet121, Densenet169, Densenet161, and Densenet201 were used, and it was observed that EfficientNet_b2 achieved the highest accuracy of 97.09% (Table 1). The results underscore the efficacy of combining self-supervised SimCLR pre-training with CNN architectures, especially EfficientNet, for the task of detecting Babesia gibsoni infection in canine blood samples. The findings suggest that such a framework can serve as a valuable diagnostic tool, particularly in areas where labeled data are limited or where quick, accurate results are needed for timely treatment decisions. EfficientNet_b2’s high performance marks it as a strong candidate for automated diagnostic systems, with potential applications extending beyond Babesia gibsoni to other Babesia spp. (Babesia canis) or other hemoparasites and medical imaging contexts that require precise and accessible diagnostic tools. Pamungkas et al., 2024 [24] develop a malaria detection system based on RBC images using the CNN EfficientNet-B0. The EfficientNet-B0 model achieved a highest accuracy of 97.37% compared to VGG19, MobileNet, Inception, and Xception, whose accuracies reached 96.15%, 95.74%, 95.92%, and 95.83%, respectively. In another research work [25], popular CNN models, such as ResNet (ResNet20 and ResNet56), VGGNet (VGGNet11, VGGNet13, VGGNet16, and VGGNet19), and EfficientNet-B0 were employed for detecting various pulmonary diseases including COVID-19 using a modified EfficientNet (EfficientCovNet), which achieved an accuracy of 96.12%. Fu et al., 2023 [26] proposed a classification network that used self-supervised learning to pre-train the network by integrating the attention mechanism with ResNet for Plasmodium identification. Their model performed exceptionally well, with test accuracy, sensitivity, and specificity reaching 97.8%, 96.5%, and 98.9%, respectively. Mujahid et al., 2024 [27] employed fine-tuned deep learning models such as CNN, VGG-16, DenseNet121, DenseNet169, DenseNet201, Inception V3, ResNet50, EfficientNet-B1, EfficientNet-B7, MobileNet, and MobileNetV2 for Malaria detection, where their proposed model achieved an accuracy of 97.57% with EfficientNet. Kazeminia et al. [28] investigated self-supervised learning (SSL) as a pre-training method for MIL-based AML subtype classification from blood smears. They examined three cutting-edge SSL techniques—SimCLR, SwAV, and DINO—and evaluated how well they performed in comparison to supervised pre-training. Their results demonstrated that SSL-pre-trained encoders can achieve performance comparable to supervised pre-training, highlighting the potential of SSL in weakly labeled medical image analysis scenarios.
5. Conclusions
This study demonstrated the effectiveness of integrating SimCLR-based contrastive learning with CNN architectures for the binary classification of Babesia gibsoni infection in canine blood samples. By leveraging self-supervised learning, the models learned valuable feature representations from unlabeled data, which were further fine-tuned using a smaller labeled dataset. The results revealed that EfficientNet_b2 achieved the highest accuracy for improved diagnostic accuracy. This approach offers a promising pathway for automating medical imaging diagnosis, especially in resource-limited settings where labeled data are scarce. Future work could explore the application of this framework to other parasitic infections and medical conditions to further validate its versatility and robustness.
Author Contributions
D.K.B.: Conceptualization, Investigation, Methodology, Formal Analysis, Software, Writing—Original Draft, Review and Editing; K.B.: Conceptualization, Supervision, Formal Analysis, Writing—Review and Editing; N.N.B.: Conceptualization, Supervision, Resources; A.D.: Investigation, Methodology, Visualization; A.B.: Investigation, Formal Analysis, Writing—Review and Editing; L.B.: Conceptualization, Methodology, Formal Analysis, Writing—Review and Editing. All authors have read and agreed to the published version of the manuscript.
Funding
This research received no external funding.
Institutional Review Board Statement
Not applicable.
Informed Consent Statement
Not applicable.
Data Availability Statement
Data may be provided on request to the corresponding authors.
Acknowledgments
The authors acknowledge the Director of Research (Veterinary) and HoD, Veterinary Clinical Complex, Assam Agricultural University, Khanapara, Guwahati, Assam for providing the facilities to carry out the research work.
Conflicts of Interest
The authors declare no conflicts of interest.
References
- Abhisheka, B.; Biswas, S.K.; Purkayastha, B.; Das, D.; Escargueil, A. Recent trend in medical imaging modalities and their applications in disease diagnosis: A Review. Multimed. Tools Appl. 2023, 83, 43035–43070. [Google Scholar] [CrossRef]
- Li, X.; Zhang, L.; Yang, J.; Teng, F. Role of Artificial Intelligence in Medical Image Analysis: A Review of Current Trends and Future Directions. J. Med. Biol. Eng. 2024, 44, 231–243. [Google Scholar] [CrossRef]
- Maharana, B.R.; Tewari, A.K.; Saravanan, B.C.; Sudhakar, N.R. Important hemoprotozoan diseases of livestock: Challenges in current diagnostics and therapeutics: An Update. Vet. World 2016, 9, 487–495. [Google Scholar] [CrossRef]
- Bhattacharjee, K.; Sarmah, P.C. Prevalence of haemoparasites in pet, working and stray dogs of Assam and North-East India: A Hospital Based Study. Vet. World 2013, 6, 874–878. [Google Scholar] [CrossRef]
- Laha, R.; Bhattacharjee, K.; Sarmah, P.C.; Das, M.; Goswami, A.; Sarma, D.; Sen, A. Babesia infection in naturally exposed pet dogs from a north-eastern state (Assam) of India: Detection by Microscopy and Polymerase Chain Reaction. J. Parasit. Dis. 2014, 38, 389–393. [Google Scholar] [CrossRef]
- Baneth, G.; Mathew, J.S.; Shkap, V.; Macintire, D.K.; Barta, J.R.; Ewing, S.A. Canine hepatozoonosis: Two Disease Syndromes Caused by Separate Hepatozoon spp. Trends Parasitol. 2003, 19, 27–31. [Google Scholar] [CrossRef]
- Laha, R.; Das, M.; Sen, A. Morphology, epidemiology, and phylogeny of Babesia: An Overview. Trop. Parasitol. 2015, 5, 94–100. [Google Scholar] [CrossRef]
- Moen, E.; Bannon, D.; Kudo, T.; Graf, W.; Covert, M.; Van Valen, D. Deep learning for cellular image analysis. Nat. Methods 2019, 16, 1233–1246. [Google Scholar] [CrossRef]
- Gupta, A.; Harrison, P.J.; Wieslander, H.; Pielawski, N.; Kartasalo, K.; Partel, G.; Solorzano, L.; Suveer, A.; Klemm, A.H.; Spjuth, O.; et al. Deep Learning in Image Cytometry: A Review. Cytom. Part A 2019, 95, 366–380. [Google Scholar] [CrossRef]
- Mall, P.K.; Singh, P.K.; Srivastav, S.; Narayan, V.; Paprzycki, M.; Jaworska, T.; Ganzha, M. A comprehensive review of deep neural networks for medical image processing: Recent Developments and Future Opportunities. Healthc. Anal. 2023, 4, 100216. [Google Scholar] [CrossRef]
- Kumar, Y.; Shrivastav, S.; Garg, K.; Modi, N.; Wiltos, K.; Woźniak, M.; Ijaz, M.F. Automating cancer diagnosis using advanced deep learning techniques for multi-cancer image classification. Sci. Rep. 2024, 14, 25006. [Google Scholar] [CrossRef]
- Siddiqi, R.; Javaid, S. Deep Learning for Pneumonia Detection in Chest X-ray Images: A Comprehensive Survey. J. Imaging 2024, 10, 176. [Google Scholar] [CrossRef]
- Choudhary, A.; Ahlawat, S.; Urooj, S.; Pathak, N.; Lay-Ekuakille, A.; Sharma, N. A Deep Learning-Based Framework for Retinal Disease Classification. Healthcare 2023, 11, 212. [Google Scholar] [CrossRef] [PubMed]
- Taherdoost, H. Beyond Supervised: The Rise of Self-Supervised Learning in Autonomous Systems. Information 2024, 15, 491. [Google Scholar] [CrossRef]
- Chen, T.; Kornblith, S.; Norouzi, M.; Hinton, G. A Simple Framework for Contrastive Learning of Visual Representations. arXiv 2020, arXiv:2002.05709. [Google Scholar] [CrossRef]
- Sarwinda, D.; Paradisa, R.H.; Bustamam, A.; Anggia, P. Deep Learning in Image Classification using Residual Network (ResNet) Variants for Detection of Colorectal Cancer. Procedia Comput. Sci. 2021, 179, 423–431. [Google Scholar] [CrossRef]
- Karno, A.S.B.; Hastomo, W.; Surawan, T.; Lamandasa, S.R.; Usuli, S.; Kapuy, H.R.; Digdoyo, A. Classification of cervical spine fractures using 8 variants EfficientNet with transfer learning. Int. J. Electr. Comput. Eng. 2023, 13, 7065–7077. [Google Scholar] [CrossRef]
- Zhu, Y.; Newsam, S. DenseNet for dense flow. In Proceedings of the 2017 IEEE International Conference on Image Processing (ICIP), Beijing, China, 17–20 September 2017; pp. 790–794. [Google Scholar] [CrossRef]
- Baruah, D.K.; Boruah, K. Early Detection of Canine Babesia from Red Blood Cell Images Using Deep Ensemble Learning. J. Electron. Electromed. Eng. Med. Inform. 2024, 6, 509–523. [Google Scholar] [CrossRef]
- Xiao, C.; Han, Y.; Yang, W.; Hou, Y.; Shi, F.; Chetty, K. Diffusion Model-based Contrastive Learning for Human Activity Recognition. IEEE Internet Things J. 2024, 11, 33525–33536. [Google Scholar] [CrossRef]
- He, K.; Zhang, X.; Ren, S.; Sun, J. Deep Residual Learning for Image Recognition. arXiv 2015. [Google Scholar] [CrossRef]
- Tan, M.; Le, Q.V. EfficientNet: Rethinking Model Scaling for Convolutional Neural Networks. arXiv 2019. [Google Scholar] [CrossRef]
- Huang, G.; Liu, Z.; van der Maaten, L.; Weinberger, K.Q. Densely Connected Convolutional Networks. arXiv 2016. [Google Scholar] [CrossRef]
- Pamungkas, Y.; Njoto, E.N.; Eljatin, D.S.; Hardyanti, I.F.; Umamah, T.; Putri, K.J. Implementation of EfficientNet-B0 Architecture in Malaria Detection System Based on Patient Red Blood Cell (RBC) Images. In Proceedings of the 2024 International Conference on Information Technology Research and Innovation (ICITRI), Jakarta, Indonesia, 5–6 September 2024; pp. 123–128. [Google Scholar] [CrossRef]
- Argho, A.G.; Maswood, M.M.S.; Mahmood, M.I.; Mondol, N. EfficientCovNet: A CNN-based approach to detect various pulmonary diseases including COVID-19 using modified EfficientNet. Intell. Syst. Appl. 2024, 21, 200315. [Google Scholar] [CrossRef]
- Fu, M.; Wu, K.; Li, Y.; Luo, L.; Huang, W.; Zhang, Q. An intelligent detection method for plasmodium based on self-supervised learning and attention mechanism. Front. Med. 2023, 10, 1117192. [Google Scholar] [CrossRef]
- Mujahid, M.; Rustam, F.; Shafique, R.; Montero, E.C.; Alvarado, E.S.; de la Torre Diez, I.; Ashraf, I. Efficient deep learning-based approach for malaria detection using red blood cell smears. Sci. Rep. 2024, 14, 13249. [Google Scholar] [CrossRef]
- Kazeminia, S.; Joosten, M.; Bosnacki, D.; Marr, C. Self-Supervised Multiple Instance Learning for Acute Myeloid Leukemia Classification. arXiv 2024, arXiv:2403.05379. [Google Scholar] [CrossRef]
Disclaimer/Publisher’s Note: The statements, opinions and data contained in all publications are solely those of the individual author(s) and contributor(s) and not of MDPI and/or the editor(s). MDPI and/or the editor(s) disclaim responsibility for any injury to people or property resulting from any ideas, methods, instructions or products referred to in the content. |
© 2025 by the authors. Licensee MDPI, Basel, Switzerland. This article is an open access article distributed under the terms and conditions of the Creative Commons Attribution (CC BY) license (https://creativecommons.org/licenses/by/4.0/).