Article

Sex Estimation from Craniofacial Measurements in a Northeastern Thai Skeletal Sample: A Comparative Evaluation of Statistical Classifiers Under Verified Assumption Conditions


by
Natthawadee Wongwad
1,
Chanasorn Poodendaen
1,
Pruet Boonsing
1,
Kaemisa Srisen
1,
Poonikha Namvongsakool
1,
Phongpitak Putiwat
1,
Suthat Duangchit
2,
Worrawit Boonthai
3,
Phatthiraporn Aorachon
4 and
Sitthichai Iamsaard
4,*
1
Department of Anatomy, Faculty of Medical Science, Naresuan University, Phitsanulok 65000, Thailand
2
Department of Physiology, Faculty of Medical Science, Naresuan University, Phitsanulok 65000, Thailand
3
Department of Anthropology, Faculty of Sociology and Anthropology, Thammasat University, Pathum Thani 12120, Thailand
4
Department of Anatomy, Faculty of Medicine, Khon Kaen University, Khon Kaen 40002, Thailand
*
Author to whom correspondence should be addressed.
Forensic Sci. 2026, 6(3), 74; https://doi.org/10.3390/forensicsci6030074
Submission received: 18 July 2026 / Revised: 27 August 2026 / Accepted: 30 August 2026 / Published: 1 September 2026

Abstract

Background/Objective: Sex estimation from cranial remains is essential in forensic biological profile reconstruction, yet systematic comparisons of statistical classifiers under formally verified assumption conditions remain limited in Thai populations. This study aimed to develop and validate sex estimation models from craniofacial measurements in a Northeastern Thai skeletal sample using DFA, BLR, and SVM, and to examine whether distributional assumption violations influence classifier performance and generalizability under holdout validation. Methods: Eight linear craniometric parameters connecting five osteometric landmarks were measured in 300 adult skeletal specimens (150 males, 150 females) from the Unit of Human Bone Warehouse for Research, Khon Kaen University. Specimens were allocated into a training dataset (n = 200) and a holdout dataset (n = 100). Five multivariate model configurations were developed under direct-entry and stepwise parameter-entry strategies. Formal assumption diagnostics included Shapiro–Wilk normality testing, Levene’s test, Box’s M test, and variance inflation factor analysis. Results: All parameters demonstrated excellent interobserver reliability and significant sex-based differences (p < 0.01), with males recording larger mean values throughout. Apparent multivariate accuracy ranged from 78.0% to 85.5%. Holdout validation revealed consistent performance decline across all five configurations, with accuracy reductions of 3.0 to 9.5 percentage points and AUC reductions of 0.042 to 0.079. The stepwise DFA model showed the smallest overall accuracy decline, although this apparent stability reflected an uneven sex-specific trade-off, with a specificity decline offset by a sensitivity gain, while SVM and DFA direct-entry models showed the largest decline. Conclusions: Craniofacial measurements provide moderate discriminatory capacity for sex estimation in Northeastern Thai skeletal remains. Although univariate assumption violations were observed, DFA’s performance remained comparable to BLR and SVM under the present large, balanced sample; multivariate analysis or distributional assumption-free methods offer practical alternatives where violations are present. Apparent performance alone is insufficient to establish forensic reliability, and holdout validation should be regarded as a necessary component of sex estimation model development.

1. Introduction

Sex estimation from skeletal remains is a fundamental component of biological profile reconstruction in forensic anthropology, narrowing the pool of potential matches and providing a critical foundation for subsequent assessments of age, ancestry, and stature [1,2]. Although the pelvis affords the highest diagnostic accuracy, its utility is frequently limited in forensic contexts by fragmentation, decomposition, or incomplete recovery [3,4]. The cranium is therefore commonly employed as an alternative, given its structural robustness, frequency of recovery, and sexually dimorphic characteristics amenable to quantification through craniometric analysis [5]. Cranial morphology is shaped by genetic, environmental, and lifestyle factors, producing population-specific patterns of sexual dimorphism that render direct application of foreign-derived standards inappropriate without local validation [6,7]. Thai skeletal populations exhibit morphological characteristics distinct from Western and East Asian reference collections, underscoring the need for population-specific estimation standards [8].
Among the analytical approaches applied to cranial sex estimation, discriminant function analysis (DFA) remains the most widely used in forensic anthropological practice, producing interpretable linear classification equations readily applicable in casework, with reported accuracies typically ranging from 75% to 90% [5,8,9,10]. DFA constructs a linear combination of predictor variables that maximizes intergroup separation, yielding a discriminant score for classifying unknown individuals. Nevertheless, DFA requires parametric assumptions including univariate normality, homogeneity of covariance matrices, and absence of severe multicollinearity, and remains sensitive to outliers and distributional violations. When unmet, these assumptions may bias discriminant coefficients and increase misclassification rates, undermining the validity of derived functions [11,12]. Despite this, formal assumption verification is inconsistently reported, and many published functions are developed without explicit diagnostic testing. Binary logistic regression (BLR) offers a parametric alternative that models group membership probability without requiring normality or equal covariance matrices, performs reliably with moderate sample sizes, and yields probability-based outputs facilitating transparent forensic interpretation [13,14].
Recent advances have introduced machine learning algorithms to forensic anthropological sex estimation. Support vector machines (SVM) identify an optimal hyperplane that maximizes the margin of separation between groups, enabling the modelling of complex non-linear relationships without distributional assumptions [5,15,16]. Several studies have reported SVM classification performance comparable or superior to DFA and BLR in osteometric contexts, particularly when classical assumptions are violated [14,15]. However, SVM outputs lack the interpretability of regression-based methods, and performance is sensitive to sample size, kernel selection, and feature scaling. Overfitting remains a substantive risk in moderate-sized datasets [17], and external validation against independent samples is therefore essential before forensic deployment [18,19].
Despite growing methodological diversity, systematic comparisons between traditional statistical classifiers and machine learning methods under formally verified assumption conditions remain limited in Thai populations, and many published studies report classification accuracy without evaluating whether DFA parametric requirements are satisfied [10,11]. Data from Northeastern Thailand are additionally scarce, despite evidence that regional morphological variation influences model performance and generalizability in independent samples [20]. The present study therefore aimed to develop sex estimation models from craniofacial measurements in a Northeastern Thai skeletal sample using DFA, BLR, and SVM, and to examine whether distributional assumption violations influence classifier performance and generalizability under holdout validation. Classifier performance was compared using classification accuracy and AUC, formal assumption diagnostics were conducted prior to model development, and classification performance in a holdout dataset was assessed to provide evidence-based guidance for method selection in Thai forensic practice.

2. Materials and Methods

2.1. Sample and Ethical Approval

This cross-sectional study utilized dry skeletal specimens obtained from body donors at the Unit of Human Bone Warehouse for Research (UHBWR), Department of Anatomy, Faculty of Medicine, Khon Kaen University, Northeastern Thailand, with data collection conducted between October 2025 and April 2026. Specimens were eligible for inclusion if they met the following criteria: confirmed sex and age documentation, and age at death of 20 years or older, and absence of pathological or structural alterations affecting cranial morphology, including bone tumors, surgical alteration, postmortem trauma, or any other condition resulting in cranial deformation that could compromise landmark identification or measurement accuracy. A total of 300 adult specimens of known sex were included. Simple random sampling with sex stratification was employed to allocate specimens into a training dataset of 200 specimens (100 males, 100 females) and a holdout dataset of 100 specimens (50 males, 50 females). This balanced design was intended primarily to control for group-size effects when evaluating assumption violations and classifier performance, rather than to reflect the sex composition of real forensic casework, which is typically unknown or imbalanced. To determine the adequacy of the training sample size, a priori power analysis was conducted using the following formula:
n / g r o u p = 2 ( z 1 − α / 2 + z 1 − β ) 2 d 2
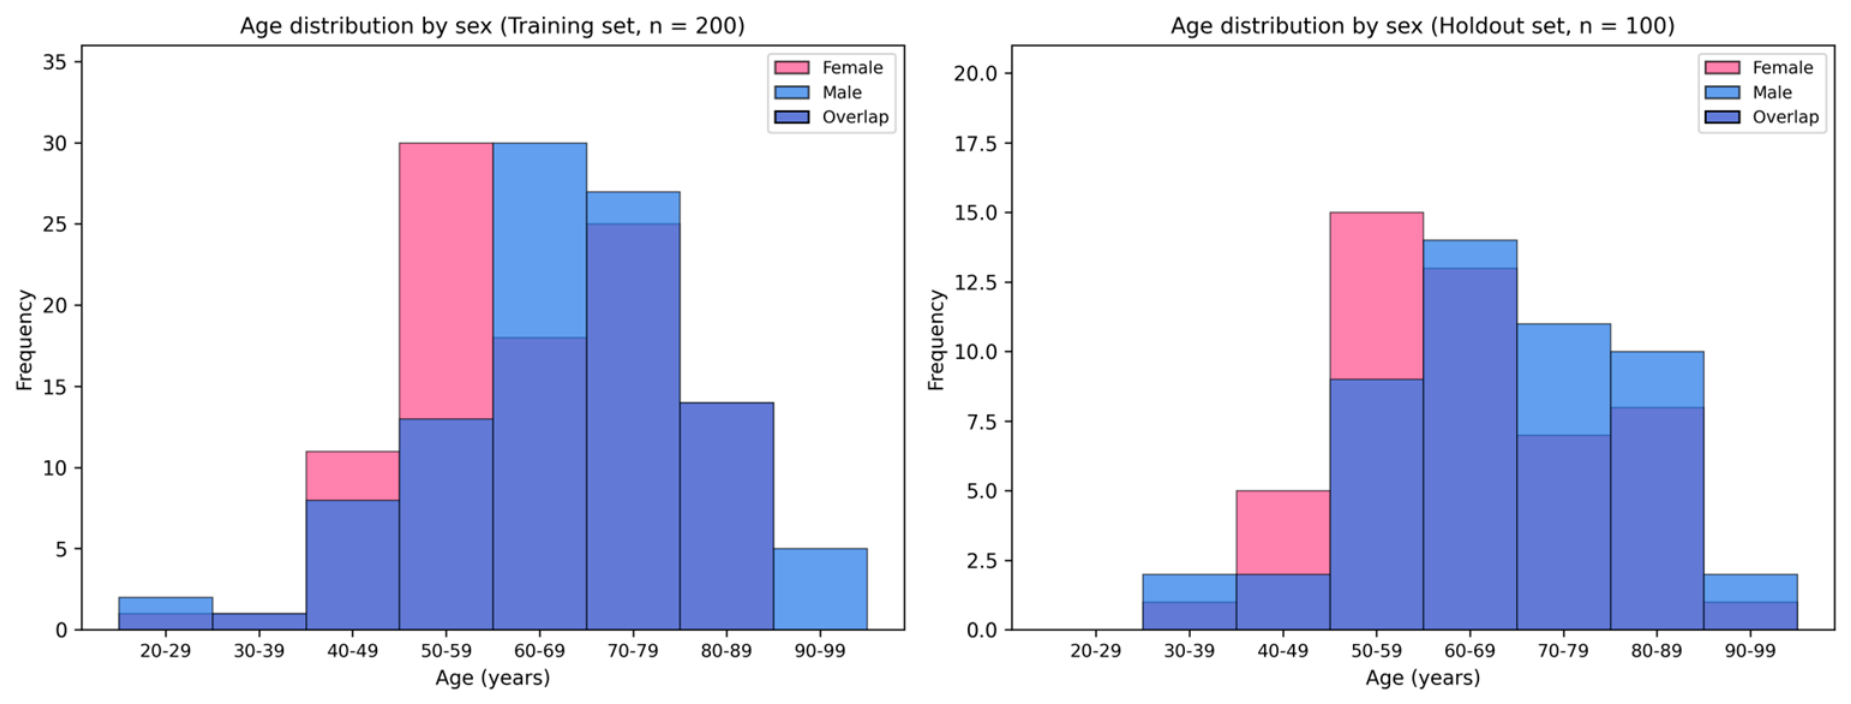
where α = 0.05 (two-tailed), 1 − β = 0.90, and d = 0.50 (medium effect). This indicated a minimum of 85 specimens per group (total N = 170); the training sample (n = 100 per group) exceeded this requirement, achieving 94.0% power. Age at death ranged from 20 to 99 years, with comparable distributions across the training (mean ≈ 65.7 years) and holdout (mean ≈ 66.1 years) samples; age distributions by sex and dataset are presented in Figure 1. Ethical approval was granted on 29 October 2025 by the Khon Kaen University Ethics Committee for Human Research (KKUEC) under the Exemption Determination Regulations (approval number: HE681653), and all specimens were handled in accordance with institutional guidelines for the ethical use of human skeletal material.

2.2. Craniometric Data Collection

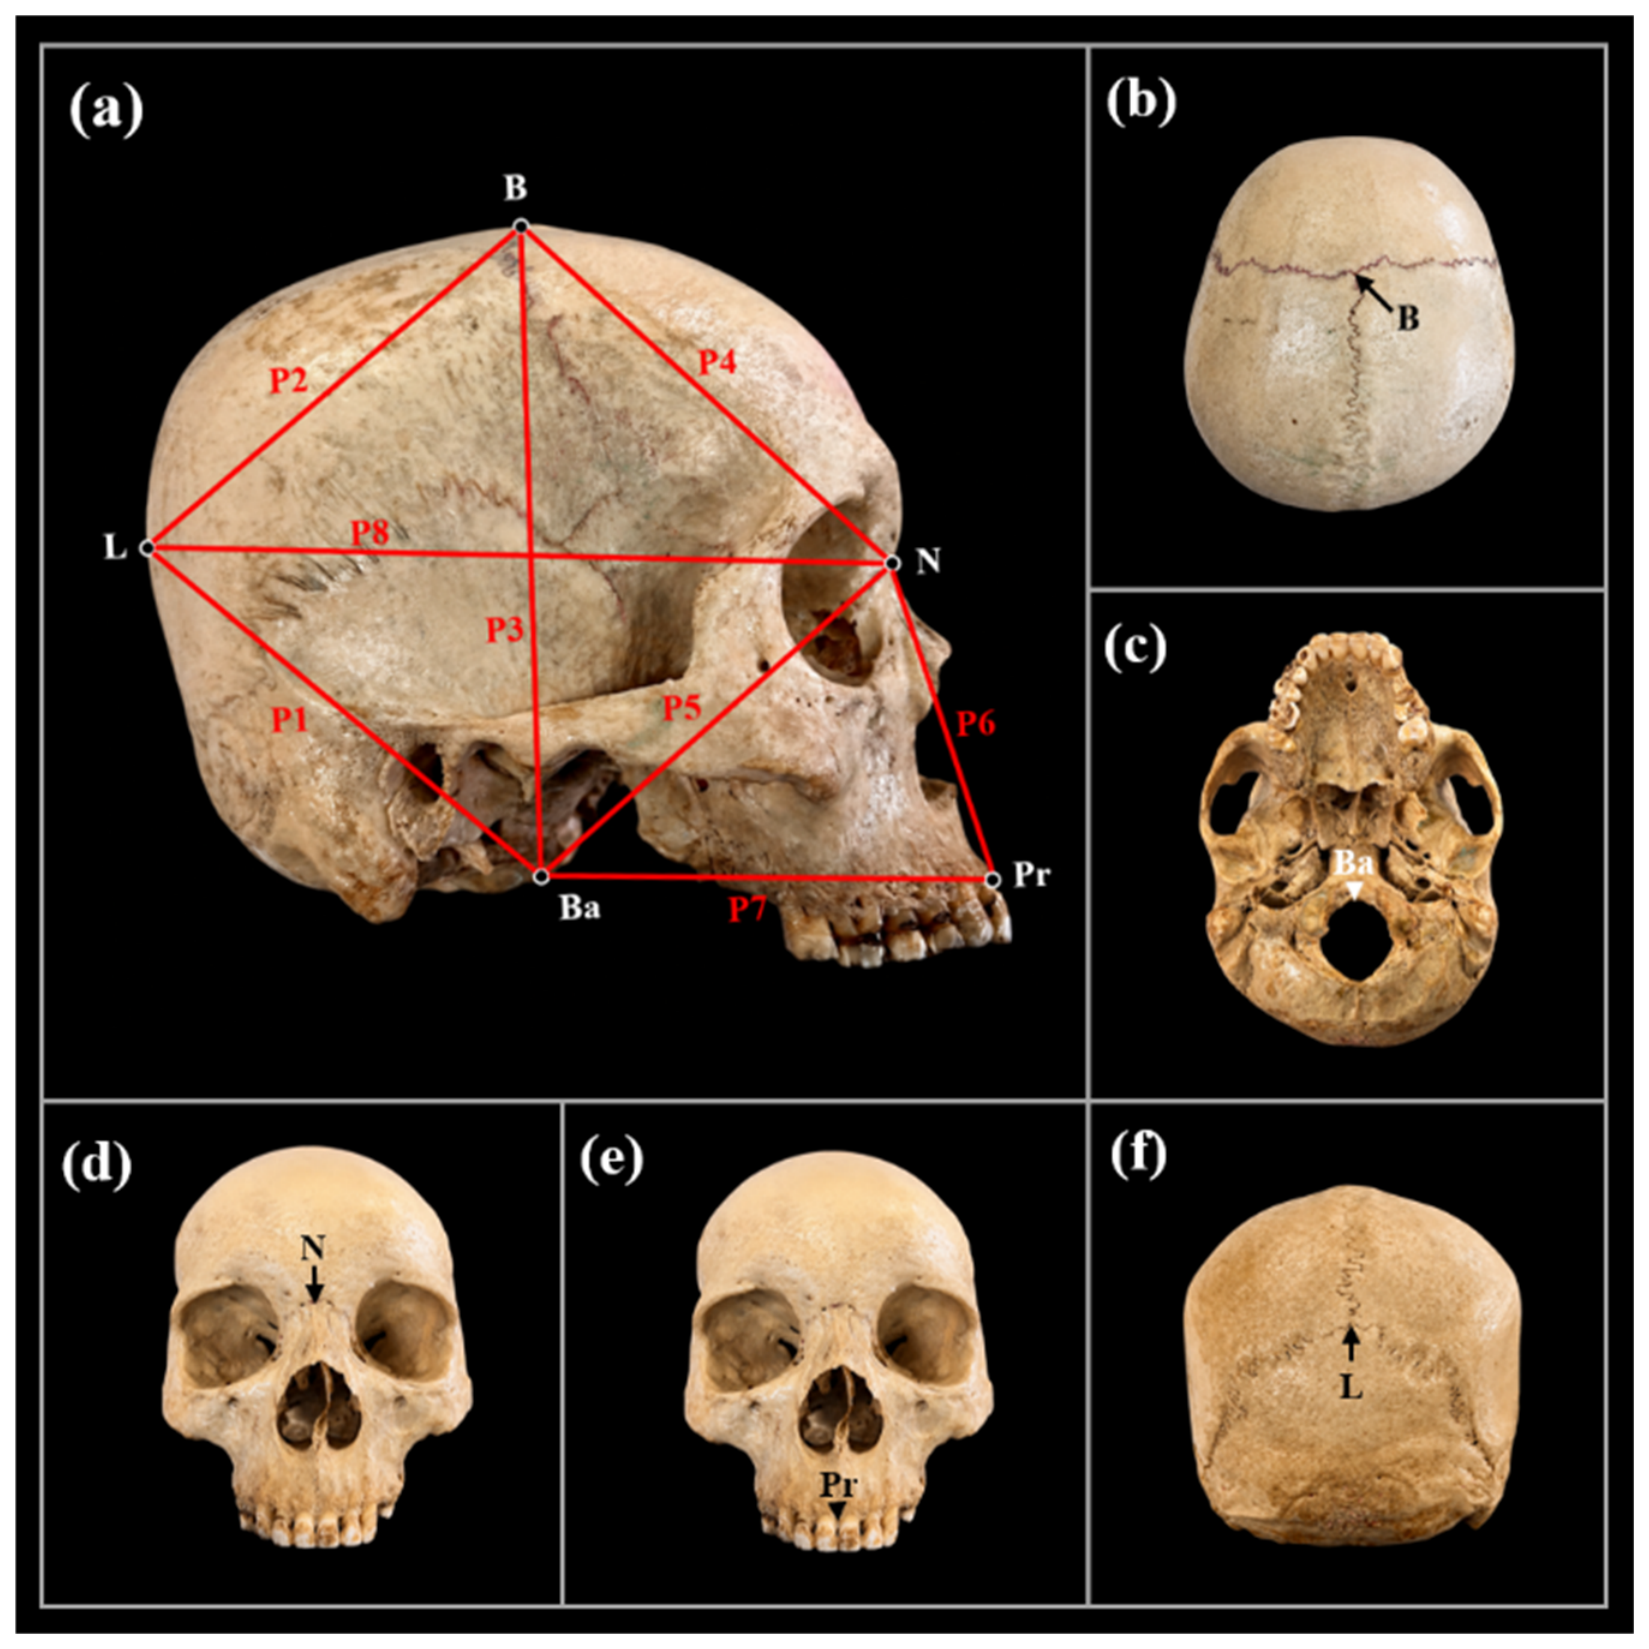
Eight craniofacial morphometric parameters were measured on each specimen (Table 1, Figure 2). P6 and P7 incorporate Prosthion and reflect facial projection, while the remaining six parameters capture broader neurocranial and cranio-basal dimensions, together providing a comprehensive craniofacial profile. All measurements represent linear distances between established osteometric landmarks defined according to standard forensic skeletal data collection protocols [21] and were obtained using a digital spreading caliper and a vernier caliper (Mitutoyo Corporation, Kawasaki, Japan) to the nearest 0.01 mm. Interobserver reliability was assessed by two independent trained observers, each performing a single measurement per parameter on all 300 specimens, using the intraclass correlation coefficient (ICC, two-way mixed-effects model, absolute agreement, single measures). Both observers were blinded to the sex of each specimen during data collection; measurements were performed sequentially according to registration number rather than in randomized order. Intraobserver reliability was not assessed, as each observer measured each specimen only once.

2.3. Statistical Analysis

2.3.1. Statistical Assumption Verification

Measurement reliability and statistical assumptions underlying each classifier were formally evaluated prior to model development using SPSS version 26.0 (IBM Corp., Armonk, NY, USA), with p < 0.05 adopted as the significance threshold. Interobserver reliability was assessed as described in Section 2.2. Univariate normality was assessed using the Shapiro–Wilk test, recommended for samples below 2000 due to its superior statistical power. Homogeneity of variance was assessed using Levene’s test for each predictor variable individually, and homogeneity of the full covariance matrix was examined using Box’s M test; given the known sensitivity of Box’s M to sample size, this result was additionally corroborated by inspection of the log determinants of the group covariance matrices, without formal numerical reporting. Multicollinearity was evaluated primarily using VIF statistics, with VIF > 10 indicating severe multicollinearity, supported by the corresponding Tolerance values, and pooled within-groups correlations examined against r = 0.80. Unlike normality and covariance homogeneity, multicollinearity is reported here as a regression diagnostic rather than a formal distributional assumption, as it does not affect the mathematical validity of the discriminant or logistic function but may influence the stability and interpretability of individual coefficients.

2.3.2. Descriptive Statistics and Sexual Dimorphism

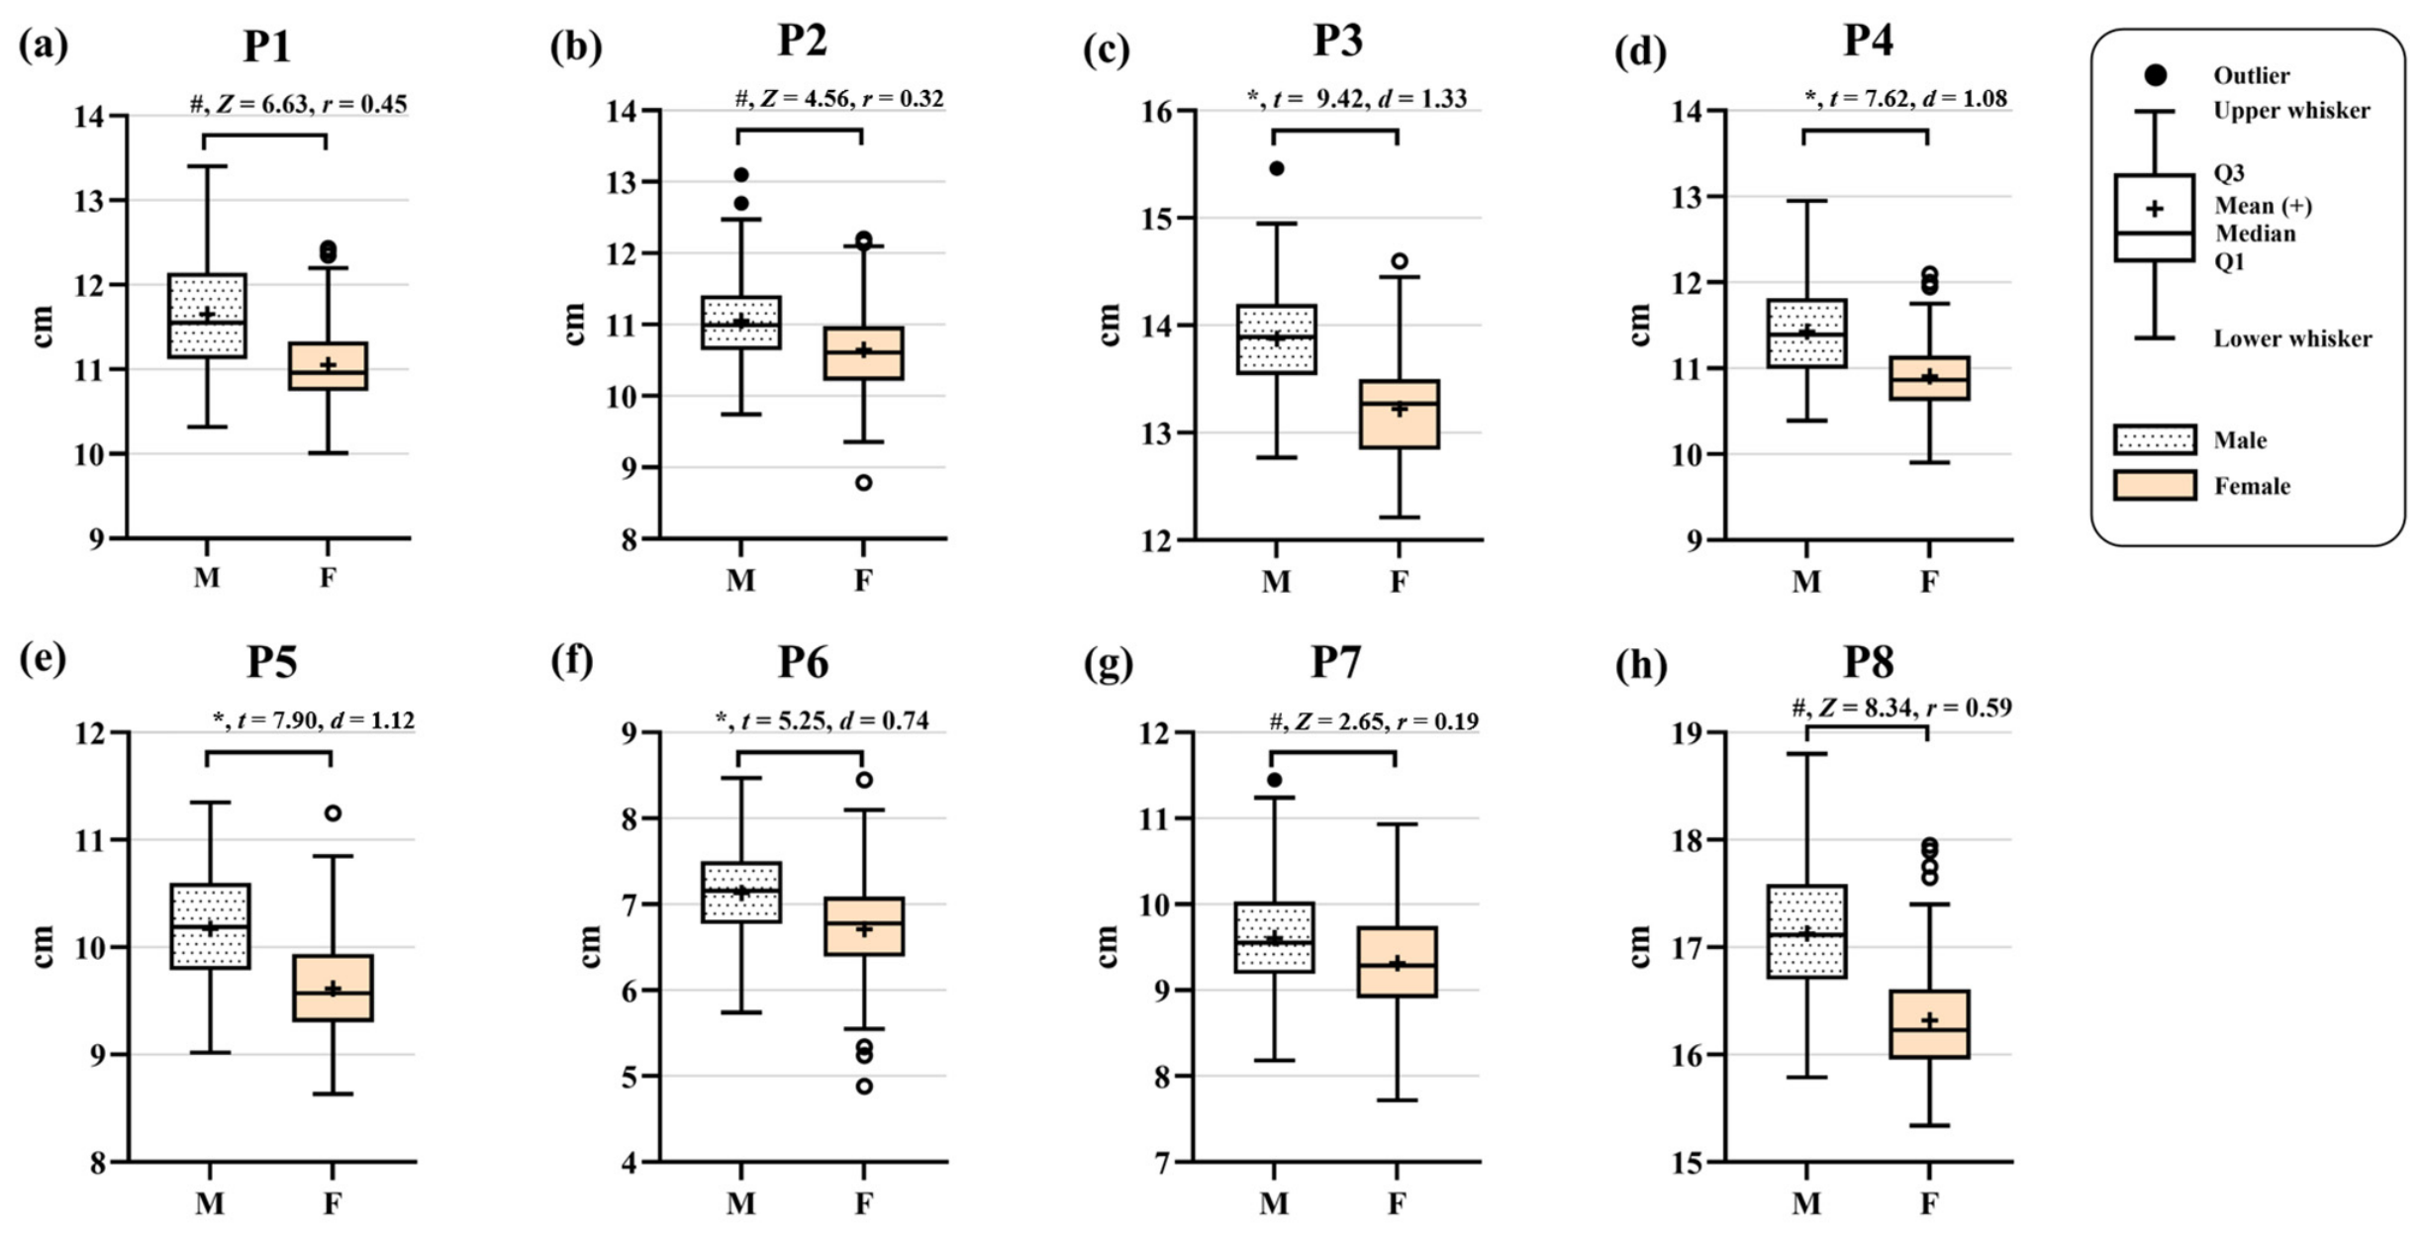
Sex-based differences in each craniometric parameter were examined using independent samples t-test for normally distributed variables and Mann–Whitney U test for variables violating the normality assumption. Test selection was based on sex-specific (within-group) Shapiro–Wilk results rather than the combined sample. A parameter was analyzed non-parametrically if either the male or female subgroup showed a significant departure from normality (p < 0.05). The magnitude of between-sex differences was quantified using Cohen’s d (d) for t-test comparisons, interpreted as small (0.20–0.49), medium (0.50–0.79), or large (≥0.80), and using the rank-biserial correlation coefficient (r) for Mann–Whitney U comparisons, interpreted as small (0.10–0.29), medium (0.30–0.49), or large (≥0.50). Parameters demonstrating large effect sizes were considered to reflect substantial sexual dimorphism and were anticipated to contribute meaningfully to classifier discrimination. Sex-based distributional differences for all parameters are presented as box plots with mean difference annotations.

2.3.3. Classifier Development

Sex estimation models were developed using three classifiers applied to both univariate and multivariate configurations of the eight craniometric parameters. In the univariate approach, each parameter was entered independently to assess individual discriminatory capacity, whereas the multivariate approach considered all parameters simultaneously with variable selection applied where applicable. Discriminant function analysis (DFA) and binary logistic regression (BLR) were performed using SPSS version 26.0 (IBM Corp., Armonk, NY, USA), with each classifier developed under direct entry (all eight parameters entered simultaneously) and stepwise selection. DFA stepwise selection was based on Wilks’ Lambda criterion with equal prior probabilities; BLR stepwise selection used the forward likelihood ratio method. Apparent classification accuracy (test-on-train) was reported for all classifier configurations to enable fair comparison across DFA, BLR, and SVM. Rather than relying on internal resampling methods such as k-fold cross-validation, which re-use the same sample pool and may therefore retain optimism bias, generalizability was instead assessed through validation on a genuinely unseen holdout sample (n = 100), reserved entirely from model development. Standardized coefficients and odds ratios were additionally reported for both BLR configurations. Support vector machine (SVM) classification was performed using Orange version 3.39 (Bioinformatics Laboratory, University of Ljubljana, Ljubljana, Slovenia) on the full eight-parameter set only, as SVM has no stepwise variable-selection analog. Hyperparameter optimization used grid search over four kernel functions (linear, polynomial, radial basis function, and sigmoid) and C evaluated over {0.1, 1.0, 10.0, 100.0}. Features were standardized prior to model training. The optimal kernel and C value were selected based on the highest apparent (training-set) accuracy across the grid combination, consistent with the apparent-performance reporting approach applied to DFA and BLR. This identified the radial basis function kernel with C = 1.0 as optimal for final model development. The holdout dataset played no role at any stage of hyperparameter selection or model training and was reserved exclusively for independent performance evaluation.

2.3.4. Performance Evaluation

Classifier performance was evaluated using a consistent set of metrics comprising overall classification accuracy (CA), sex-specific sensitivity (male accuracy) and specificity (female accuracy), area under the receiver operating characteristic curve (AUC) with 95% confidence intervals, and the Matthews correlation coefficient (MCC) as a balanced metric robust to variations in class distribution. Male was specified as the positive target category throughout this study: for BLR and SVM, a predicted probability greater than 0.50 indicated male classification; for DFA, given equal group sizes (n = 100 per sex), the sectioning point corresponded to a discriminant score of 0, with positive scores classified as male. Performance metrics were computed for both univariate and multivariate classifier configurations across DFA, BLR, and SVM on the training dataset (n = 200) to evaluate apparent model fit. Holdout validation was conducted for all five multivariate model configurations: direct entry and stepwise parameter sets for DFA and BLR, and the full-parameter-set model for SVM. Univariate models were excluded from holdout validation, as validation efforts were directed toward multivariate configurations offering sufficient discriminatory performance for practical forensic application. Each trained multivariate model was applied directly to the holdout dataset (n = 100) without retraining, to assess out-of-sample classification performance. The difference between training and holdout performance (Δ) was reported for each metric as an index of model stability, with smaller values indicating greater classification consistency across datasets. Comparisons among classifiers and parameter-entry strategies, both on the training and holdout datasets, were based on point-estimate differences in accuracy and AUC; formal paired statistical comparisons (e.g., McNemar’s or DeLong’s tests) were not conducted, and numerically small differences between configurations should therefore not be interpreted as evidence of meaningful superiority. To further characterize the precision of these estimates, particularly given the modest holdout subgroup size (n = 50 per sex), 95% CIs were computed using the Wilson score method and bootstrap resampling from reconstructed confusion matrices.

3. Results

3.1. Measurement Reliability and Statistical Assumption Testing

All eight cranial parameters demonstrated excellent inter-observer reliability when assessed by two trained observers across all 300 specimens. ICC values (two-way mixed-effects model, absolute agreement, single measures) ranged from 0.967 (P6) to 0.993 (P8), with narrow 95% confidence intervals across all parameters, confirming the consistency and reproducibility of the measurement protocol prior to subsequent analyses.
Shapiro–Wilk test results, evaluated separately within each sex subgroup, indicated significant departures from normality for P1, P2, P7, and P8 in at least one subgroup (p < 0.05; Table 2); these four parameters were accordingly analyzed using the Mann–Whitney U test. The remaining parameters, P3, P4, P5, and P6, satisfied normality in both subgroups and were analyzed using the independent samples t-test. Levene’s test indicated homogeneity of variances for most parameters; however, significant heterogeneity was observed for P1 (p = 0.002) and P4 (p = 0.008). As P1 was analyzed using the Mann–Whitney U test, which assumes neither normality nor homogeneity of variance, this violation required no further correction; for P4, Welch’s t-test was applied to account for unequal variances. All parameters were retained for subsequent analyses, as parametric classifiers have demonstrated robustness to mild distributional violations under balanced group designs and adequate sample sizes.
Pooled within-groups Pearson correlation coefficients ranged from 0.091 (P1–P2) to 0.703 (P5–P7), with notably high correlations also observed between P3 and P5 (r = 0.673) and between P4 and P8 (r = 0.660); no pairwise correlation among the eight parameters exceeded r = 0.80. VIF values ranged from 1.568 (P6) to 11.244 (P8), with P8 exceeding the conventional threshold of 10, indicating severe multicollinearity by this criterion. This elevated VIF reflects diffuse collinearity across several parameters rather than a strong pairwise relationship, consistent with the absence of any pairwise correlation exceeding r = 0.80. As multicollinearity primarily affects coefficient stability rather than classification accuracy, P8 was retained in all classifier models, consistent with evidence that moderate-to-severe multicollinearity does not necessarily compromise classifier discriminatory performance. This multicollinearity finding reflects a regression diagnostic rather than a violated statistical assumption, and therefore did not, by itself, preclude the retention of P8 in subsequent classifier development. Box’s M test additionally confirmed homogeneity of the full covariance matrix across sex groups (Box’s M = 45.094, approximate F = 1.199, df = 36, 131,915.728, p = 0.192). Together, these results formally confirm covariance homogeneity among sex groups and characterize the multicollinearity structure among parameters; multivariate normality itself was not directly tested in this study.

3.2. Sexual Dimorphism and Effect Size

Sex-based differences were statistically significant across all eight craniofacial parameters (p < 0.01), with males consistently recording larger mean values than females. Independent samples t-test was applied for P3, P4, P5, and P6, based on normality satisfied within both sex subgroups; Welch’s t-test was used for P4 to account for unequal variances. Mann–Whitney U test was applied for P1, P2, P7, and P8, which exhibited significant departures from normality within at least one sex subgroup. Effect sizes, expressed as Cohen’s d for t-test comparisons and as r for Mann–Whitney U comparisons, ranged from small to large across all parameters. Among parameters analyzed by Mann–Whitney U test, P8 demonstrated the largest effect (r = 0.59), while P7 returned the smallest (r = 0.19). Among parameters analyzed by t-test, P3 showed the largest effect (d = 1.33), while P6 returned the smallest (d = 0.74). Sex-based distributional differences and effect sizes for all parameters are presented as box plots in Figure 3.

3.3. Univariate and Multivariate Classification Performanc

3.3.1. Univariate Models

Univariate classification performance for DFA, BLR, and SVM across all eight cranial parameters is presented in Table 3. P8 and P3 consistently yielded the highest performance across all three classifiers, with accuracies ranging from 76.0% to 78.0% and AUC values between 0.802 and 0.841. P7 and P6 demonstrated the lowest accuracy overall, with values as low as 56.5% and 59.0%, respectively, while P7 and P2 recorded the lowest AUC values. DFA and BLR produced identical AUC values for every univariate parameter, as both methods yield monotonically equivalent predicted score rankings when applied to a single predictor, rendering their discriminatory capacity indistinguishable at the univariate level; this equivalence does not extend to multivariate configurations, where the two methods differ in their parameter weighting algorithms. SVM AUC values were consistently lower than those of DFA and BLR across all eight parameters. MCC values followed a similar pattern across methods, with P8 and P3 yielding the highest values and P7 and P6 the lowest. Sensitivity and specificity values varied more noticeably across methods within individual parameters, particularly for P2, P7, and P8, where SVM showed comparatively higher sensitivity but lower specificity relative to DFA and BLR.

3.3.2. Multivariate Models

Multivariate classification accuracy ranged from 78.0% to 85.5% across the five model configurations, with corresponding AUC values ranging from 0.884 to 0.926. The SVM model, evaluated using the full eight-parameter set, achieved the highest accuracy and AUC among all configurations, while the stepwise DFA model (four parameters) yielded the lowest. Full classification metrics, including sensitivity, specificity, MCC, and 95% CI for AUC, are presented for each classifier and parameter-entry strategy in Table 4. Detailed statistical output and discriminant/logistic equations for DFA and BLR, and the saved SVM model, are provided in Supplementary Materials Tables S1 and S2, File S1, respectively.

3.4. Holdout Validation

Holdout validation using the holdout dataset (n = 100; 50 males, 50 females) yielded classification accuracy ranging from 74.0% to 76.0% across the five multivariate model configurations, with corresponding AUC values ranging from 0.842 to 0.870. The spread in accuracy across classifiers was 2.0 percentage points under holdout evaluation, compared with 7.5 percentage points during training (78.0–85.5%). Holdout accuracy and AUC were lower than the corresponding training-sample (apparent) values for all five models, with accuracy reductions (Δ) ranging from 3.0 to 9.5 percentage points and AUC reductions ranging from 0.042 to 0.079. The smallest reduction in accuracy was observed for the DFA stepwise model, and the largest reductions were observed for the DFA direct entry and SVM models. Each model was applied to the holdout dataset without retraining, using the discriminant and logistic equations and the saved SVM model reported in Supplementary Materials Tables S1 and S2, File S1. Full performance metrics for the training, holdout, and Δ comparisons across all five models are presented in Table 5.

4. Discussion

The present study confirmed statistically significant differences between sexes in all eight craniofacial parameters, with males exhibiting larger mean values than females across all parameters, consistent with the pattern of male-larger craniofacial dimensions widely reported in metric sex estimation studies [8,10]. Among the three classifiers applied to the full eight-parameter set, apparent performance was broadly comparable, indicating similar discriminatory capacity among DFA, BLR, and SVM under equivalent parameter conditions; apparent performance was reported throughout for cross-classifier comparability, as outlined in the Methods. Holdout validation, however, revealed a consistent decline in performance across all five configurations, with accuracy reductions of 3.0 to 9.5 percentage points and AUC reductions of 0.042 to 0.079. Beyond this overall decline, the spread in accuracy across the five configurations contracted from 7.5 percentage points during training (78.0–85.5%) to just 2.0 percentage points under holdout evaluation (74.0–76.0%), suggesting that much of the apparent differentiation among classifiers reflected training-sample-specific variation rather than genuine, generalizable differences in discriminatory capacity, although this narrowing was not evaluated using formal paired statistical tests and should be interpreted with appropriate caution. This gap was most pronounced for the direct entry configurations of DFA and SVM and least pronounced for the stepwise DFA model in overall accuracy, despite the latter’s lowest apparent performance during training and a disproportionate specificity decline offset by a sensitivity gain; this inverse relationship was less evident for BLR, whose stepwise configuration excluded only a single parameter relative to direct entry. Notably, this pattern occurred despite several parameters violating univariate normality and variance homogeneity, while multivariate assumptions remained satisfied at the level of the combined parameter set, as established earlier, a relationship examined further below.
The apparent classification accuracy achieved in the present study can be situated within both a Thai-specific and a broader international context. Within the Thai population, a stepwise discriminant function derived from 25 standard cranial measurements achieved a higher accuracy of 91.4% [8], a difference plausibly attributable to its broader anatomical scope relative to the present study’s restriction to eight linear craniofacial measurements alone. A more directly comparable study, conducted on a Thai sample from the same institutional collection using CT-derived craniofacial measurements and comparing DFA, SVM, and RF, reported accuracies of 84.0 to 85.7% [10], a range broadly consistent with the present findings and suggesting that a limited set of linear craniofacial measurements provide discriminatory capacity comparable to more extensive CT-derived craniofacial measurements within the same population. At a broader international level, reported classification accuracies for craniometric sex estimation vary considerably across populations, imaging modalities, and classification methods, ranging from approximately 78% to 97% (Table 6) [8,9,10,22,23,24,25,26,27,28], a pattern related in part to measurement modality, with CT-derived measurements generally yielding higher accuracy than direct measurement of dry skeletal material; the present study, derived from dry skeletal specimens, accordingly falls toward the lower-to-middle portion of this range, consistent with accuracies reported for other dry-bone-based studies. Although the accuracies summarized in Table 6 are generally derived from training-sample performance, the cited studies differ not only in population and measurement modality but also in the classification method applied (e.g., DFA, logistic regression, or various machine learning approaches) and in the internal validation strategy used, such as cross-validation, which is not uniformly reported across studies; direct comparison of accuracy values should therefore be made with caution. Taken together, this body of comparative evidence indicates that reported accuracy in craniometric sex estimation is shaped by multiple interacting factors, including the classification method employed, the anatomical location and number of parameters measured, and the population under study, underscoring the need for careful methodological consideration in the development and validation of any sex estimation model, as examined further below.
At the univariate level, several parameters exhibited violations of normality and variance homogeneity, as established in Section 3.1. Despite DFA being the only classifier among the three that formally requires multivariate normality, its apparent performance was comparable to that of BLR and SVM, neither of which carries this distributional requirement. This comparison, however, cannot establish that the violations had no effect on DFA specifically, as it reflects performance across different classifiers rather than a direct counterfactual test of DFA with and without the violations; DFA’s performance in their absence remains unknown. The observed pattern is nonetheless consistent with the recognized robustness of discriminant analysis to moderate departures from normality when group sizes are equal and sufficiently large [29], a condition satisfied in the present training sample of equally sized groups; the comparatively large sample size may further have mitigated the influence of univariate non-normality, consistent with evidence that parametric methods become increasingly robust to distributional violations as sample size increases [29,30]. Separately, the multivariate assumption of homogeneity of covariance matrices, a distinct requirement critical to DFA’s classification function, was satisfied, indicating that the univariate violations observed did not extend to this separate multivariate property [29]. Taken together, these findings suggest that, in datasets of comparable size and group balance, moderate univariate assumption violations may be addressed in practice not through data transformation or variable exclusion alone, but by confirming that the relevant multivariate assumptions remain satisfied, and by ensuring adequately sized and balanced groups, before assuming such violations carry no substantive consequence for classifier validity [10,11].
Although assumption violations exerted limited apparent effect on classifier performance, a more substantial threat to generalizability arose from the number of parameters retained in model construction. For DFA, the direct entry configuration achieved higher apparent accuracy during training than the stepwise configuration, but exhibited a substantially larger decline upon holdout validation; a comparable decline was observed for SVM, evaluated only under the full eight-parameter set. This pattern illustrates that substantial parameter reduction, even when associated with lower apparent performance, may stabilize overall accuracy upon holdout validation [18], though the accompanying sex-specific trade-off in the stepwise DFA model suggests this stability should be interpreted with caution given the modest holdout subgroup size. Notably, this relationship was not observed for BLR: its stepwise configuration, retaining seven of eight parameters, achieved apparent accuracy comparable to its direct entry configuration and exhibited a holdout decline closer to that of its direct entry model than to the more substantially reduced DFA stepwise model, suggesting that the stabilizing benefit of parameter reduction depends on its extent, and that excluding a single parameter may be insufficient to confer a comparable effect. More broadly, these findings underscore that neither formal assumption satisfaction nor favorable apparent performance is sufficient to establish that a model will perform comparably on holdout samples. Stepwise selection identifies the variable combination yielding the highest discriminatory power within a given sample; because several parameters in this study were correlated, this combination may vary across populations or samples. The parameters retained in the stepwise DFA and BLR models should therefore be interpreted as an empirically favorable combination for this sample, rather than a biologically optimal subset of craniometric predictors for sex estimation. Several skull-based sex estimation studies using Northeastern Thai skeletal samples have reported classification accuracy ranging from 75.0% to 85.0% [10,31], performance levels that internal validation alone would suggest as suitable for practical application. The present findings demonstrate that comparable apparent and cross-validated performance can still correspond to a meaningful decline when applied to truly unseen data, reinforcing the necessity of independent validation as a standard component of forensic sex estimation model development [5,7,32].
Several practical implications for the development of forensic sex estimation equations follow from these considerations. In datasets with comparatively large and balanced samples [29], the limited apparent impact of univariate assumption violations observed here suggests that such violations may carry limited practical consequence for classification performance; this should not, however, be generalized to studies with smaller samples, for which formal assumption testing remains necessary [29,30]. Where univariate violations are present, multivariate analysis offers a practical alternative, since multivariate assumptions are evaluated at the level of the combined parameter set and may be satisfied even when individual parameters are not. This approach, however, warrants an important caveat: incorporating a larger number of parameters does not guarantee that a resulting model will generalize to independent samples, a risk the present findings illustrate directly. Beyond overfitting risk, the practical cost of measuring a larger parameter set may not be justified by performance gains that fail to persist under holdout validation, and may further limit the feasibility of the resulting equation for routine forensic casework [33,34]. Collectively, these considerations suggest that the choice of parameter set should be guided not solely by apparent classification performance, but by a balance among assumption-related considerations, demonstrated generalizability, and practical applicability, a balance the present study sought to illustrate through its combined assessment of assumption verification, model parsimony, and holdout validation. It is also worth noting that all specimens came from a single skeletal collection representing one Northeastern Thai population. Since craniofacial morphology can differ across populations, the derived equations and saved models may not perform equally well elsewhere and should be re-validated on an independent sample before being applied to other populations. Furthermore, specimens with pathological conditions or inadequate preservation were excluded during sample selection, and age effects on craniometric dimensions were not separately examined. Practitioners applying these equations to forensic casework involving such specimens should recognize that the reported accuracy may not directly extend to cases falling outside these sample characteristics, and should interpret results accordingly.

5. Conclusions

This study evaluated sex estimation from craniofacial measurements in a Northeastern Thai skeletal sample, comparing DFA, BLR, and SVM under direct-entry and stepwise parameter-entry strategies, with formal assumption diagnostics conducted prior to classifier development. Apparent classification accuracy ranged from 78.0% to 85.5%, with broadly comparable performance across classifiers on the training sample. Although univariate assumption violations were observed for four parameters, DFA’s performance remained comparable to BLR and SVM under the present large and balanced sample, though this comparison cannot rule out an effect specific to DFA; multivariate analysis or distributional assumption-free methods offer practical alternatives where violations are present. Holdout validation revealed consistent performance decline across all five configurations, most pronounced for DFA and SVM direct-entry models (Δ = −9.5%) and least pronounced overall for the stepwise DFA model (Δ = −3.0%, though with an uneven sex-specific pattern), despite the latter’s comparatively modest apparent accuracy. These findings indicate that apparent performance alone is insufficient to establish forensic reliability, and that holdout validation on a genuinely unseen sample should be regarded as a necessary step in model development. The stepwise DFA equation, requiring only four measurements, represents a promising parsimonious model; however, given its holdout accuracy of 75% and comparatively lower female classification performance (specificity = 72%), further validation is warranted before recommending its use in casework. The present findings are specific to a Northeastern Thai dry bone sample and should not be extended to other populations without independent validation.

6. Limitation of Study

Several limitations of the present study should be acknowledged. First, the sample was drawn exclusively from the UHBWR skeletal collection at Khon Kaen University, representing a Northeastern Thai population. The training and holdout sets consisted of entirely separate specimens, with no overlap between the two groups; however, both were drawn from this same institutional collection rather than from independent sources. More broadly, application of the derived equations to other Thai regional populations or non-Thai groups should not be undertaken without prior independent validation, as regional morphological variation may affect model performance. Second, while univariate assumption violations were observed for four parameters, their apparent impact on classifier performance was limited under the present sample size and group balance conditions; the generalizability of this observation to studies with smaller samples, greater imbalance, or more severe violations cannot be assumed. Third, all measurements were obtained from dry skeletal specimens using a specific set of eight cranial parameters; direct comparison of the reported accuracies with models derived from CT or other imaging modalities, or with studies employing different craniometric parameter sets, should be made with caution, as both measurement modality and parameter selection independently influence classification performance. Fourth, the SVM kernel and C value were selected using apparent training-set accuracy across the grid combination; this selection process may introduce a degree of optimism bias beyond that of the single-model DFA and BLR configurations, and likely contributes to the comparatively larger performance decline observed for SVM on the holdout dataset. Fifth, potential age-related effects on craniometric measurements and classifier performance were not formally examined. Additionally, the stability of stepwise variable selection was not formally tested; as noted in the Discussion, the parameter sets retained by the stepwise DFA and BLR models may not be stable across samples or populations.

Supplementary Materials

The following supporting information can be downloaded at: https://www.mdpi.com/article/10.3390/forensicsci6030074/s1, Table S1: Discriminant function coefficients and classification accuracy for sex estimation models; Table S2: Binary logistic regression coefficients and classification accuracy for sex estimation models; Supplement File S1: Saved model SVM.

Author Contributions

Conceptualization, C.P., S.I., W.B. and S.D.; methodology, P.B., W.B. and S.D.; software, P.B. and S.D.; validation, N.W. and S.D., formal analysis, N.W., C.P., P.B., P.P. and S.D.; investigation, C.P., P.B., K.S., P.N., P.P., S.I., P.A. and S.D.; resources, S.I. and P.A.; data curation, N.W., P.N., P.P. and P.A.; writing—original draft preparation, N.W. and S.D.; writing—review and editing, C.P., K.S., P.P., S.I. and W.B.; visualization, N.W.; supervision, C.P.; project administration, C.P. and S.I.; funding acquisition, C.P. All authors have read and agreed to the published version of the manuscript.

Funding

This research received no external funding.

Institutional Review Board Statement

This investigation received ethical approval from the Center for Ethics in Human Research, Khon Kaen University (HE681653), 29 October 2025.

Informed Consent Statement

This study utilized skeletal specimens from the osteological collection at Khon Kaen University, Thailand. Individual informed consent was not required for this study.

Data Availability Statement

All data analyzed during the present study are available from the corresponding author on reasonable request.

Acknowledgments

The authors gratefully acknowledge the Unit of Human Bone Warehouse for Research (UHBWR), Department of Anatomy, Faculty of Medicine, Khon Kaen University, for providing access to the skeletal specimens used in this study. We extend our deepest respect and gratitude to the body donors whose selfless contributions to medical science made this research possible. Their generosity in donating their remains continues to advance knowledge in forensic anthropology and contribute to the benefit of society. During the preparation of this work the authors used Claude Sonnet 4.6 for sentence refinement, grammatical verification, and minor translation. After using this tool/service, the authors reviewed and edited the content as needed and take full responsibility for the content of the published article.

Conflicts of Interest

The authors declare no conflicts of interest.

References

  1. Cunha, E.; Cattaneo, C. Forensic anthropology and forensic pathology. In Forensic Anthropology and Medicine; Schmitt, A., Cunha, E., Pinheiro, J., Eds.; Humana Press: Totowa, NJ, USA, 2006. [Google Scholar]
  2. Poodendaen, C.; Klaikran, S.; Maihong, A.; Choompoo, N.; Duangchit, S.; Boonthai, W.; Tangsrisakda, N.; Arun, S.; Chaimontri, C.; Iamsaard, S. Biological sex and stature estimations from dry sternum: A population-specific study in Northeastern Thais. Forensic Sci. Int. Rep. 2025, 11, 100419. [Google Scholar] [CrossRef] [Scilit]
  3. Baca, K.; Bridge, B.; Snow, M. Three-dimensional geometric morphometric sex determination of the whole and modeled fragmentary human pubic bone. PLoS ONE 2022, 17, e0265754. [Google Scholar] [CrossRef] [Scilit] [PubMed]
  4. Toneva, D.; Nikolova, S.; Agre, G.; Fileva, N.; Milenov, G.; Zlatareva, D. Evaluating the effectiveness of coxal bone measurements for sex estimation via machine learning. Biology 2025, 14, 866. [Google Scholar] [CrossRef] [Scilit] [PubMed]
  5. Wang, X.; Liu, G.; Wu, Q.; Zheng, Y.; Song, F.; Li, Y. Sex estimation techniques based on skulls in forensic anthropology: A scoping review. PLoS ONE 2024, 19, e0311762. [Google Scholar] [CrossRef] [Scilit] [PubMed]
  6. Flis, W.; Wróbel, M.; Teul, I.; Branicki, W.; Wronka, I. Interpopulation variation in facial sexual dimorphism: A review with implications for forensic anthropology and medicine. Folia Morphol. 2025, 84, 871–880. [Google Scholar] [CrossRef] [Scilit] [PubMed]
  7. Phetnui, P.; Poodendaen, C.; Choompoo, N.; Srisen, K.; Iamsaard, S.; Chaiyamoon, A.; Arun, S.; Berkban, T.; Duangchit, S. Independent validation of population-specific equations for sex and stature estimation from the humerus in Northeastern Thailand. Forensic Sci. 2026, 6, 1. [Google Scholar] [CrossRef] [Scilit]
  8. Mahakkanukrauh, P.; Sinthubua, A.; Prasitwattanaseree, S.; Ruengdit, S.; Singsuwan, P.; Praneatpolgrang, S.; Duangto, P. Craniometric study for sex determination in a Thai population. Anat. Cell Biol. 2015, 48, 275–283. [Google Scholar] [CrossRef] [Scilit] [PubMed]
  9. Meral, O.; Meydan, R.; Toklu, B.B.; Kaya, A.; Karadayi, B.; Acar, T. Estimation of sex from computed tomography images of skull measurements in an adult Turkish population. Acta Radiol. 2022, 63, 1513–1521. [Google Scholar] [CrossRef] [Scilit] [PubMed]
  10. Duangchit, S.; Kirisattayakul, W.; Twinprai, P.; Maikong, N.; Twinprai, N.; Witchathrontrakul, J.; Mahajanthavong, T.; Pitirith, C.; Lamai, K.; Aorachon, P.; et al. Sex estimation from CT-derived craniofacial measurements in Thai adults: Comparative performance of discriminant function analysis, support vector machine, and random forest with forensic case application examples. Forensic Sci. 2026, 6, 35. [Google Scholar] [CrossRef] [Scilit]
  11. Bartholdy, B.P.; Sandoval, E.; Hoogland, M.L.P.; Schrader, S.A. Getting rid of dichotomous sex estimations: Why logistic regression should be preferred over discriminant function analysis. J. Forensic Sci. 2020, 65, 1685–1691. [Google Scholar] [CrossRef] [Scilit] [PubMed]
  12. Carvallo, D.; Retamal, R. Sex estimation using the proximal end of the femur on a modern Chilean sample. Forensic Sci. Int. Rep. 2020, 2, 100077. [Google Scholar] [CrossRef] [Scilit]
  13. Baer, E.; La Valley, A.S.H.; Kyriakou, X.P. Assessment of sexual dimorphism in the humerus among a Greek Cypriot population using binary logistic regression and linear discriminant analysis. Forensic Sci. Med. Pathol. 2025, 21, 736–744. [Google Scholar] [CrossRef] [Scilit] [PubMed]
  14. Duangchit, S.; Poodendaen, C.; Phetnui, P.; Tasu, P.; Boonthai, W.; Tangsrisakda, N.; Iamsaard, S. Sex determination and stature estimation using logistic and linear regression models: A population-specific study of tibia and fibula in Northeastern Thais. Transl. Res. Anat. 2025, 40, 100420. [Google Scholar] [CrossRef] [Scilit]
  15. Toneva, D.; Nikolova, S.; Agre, G.; Zlatareva, D.; Hadjidekov, V.; Lazarov, N. Machine learning approaches for sex estimation using cranial measurements. Int. J. Leg. Med. 2021, 135, 951–966. [Google Scholar] [CrossRef] [Scilit] [PubMed]
  16. Knecht, S.; Santos, F.; Ardagna, Y.; Alunni, V.; Adalian, P.; Nogueira, L. Sex estimation from long bones: A machine learning approach. Int. J. Leg. Med. 2023, 137, 1887–1895. [Google Scholar] [CrossRef] [Scilit] [PubMed]
  17. Nikita, E.; Nikitas, P. On the use of machine learning algorithms in forensic anthropology. Leg. Med. 2020, 47, 101771. [Google Scholar] [CrossRef] [Scilit] [PubMed]
  18. Tasu, P.; Duangchit, S.; Srisen, K.; Choompoo, N.; Boonsing, P.; Wongwad, N.; Tangsrisakda, N.; Chaiyamoon, A.; Aorachon, P.; Iamsaard, S.; et al. Sex estimation from mandibular 3D morphometry in a Thai population: A comparative machine learning approach with independent model validation. Transl. Res. Anat. 2026, 43, 100495. [Google Scholar] [CrossRef] [Scilit]
  19. Duangchit, S.; Imkrajang, N.; Boonthai, W.; Tangsrisakda, N.; Innoi, S.; Iamsaard, S.; Poodendaen, C. Sex and stature estimation from scapular measurements: Development and independent validation in Northeastern Thai population. Forensic Sci. 2025, 5, 66. [Google Scholar] [CrossRef] [Scilit]
  20. Ferrell, M.J.; Schultz, J.J.; Adams, D.M. Sex estimation research trends in forensic anthropology between 2000 and 2022 in five prominent journals. J. Forensic Sci. 2024, 69, 1138–1154. [Google Scholar] [CrossRef] [Scilit] [PubMed]
  21. Langley, N.R.; Meadows Jantz, L.; Ousley, S.D.; Jantz, R.L.; Milner, G. Data Collection Procedures for Forensic Skeletal Material 2.0; University of Tennessee and Forensic Anthropology Center: Knoxville, TN, USA, 2016. [Google Scholar]
  22. Ramamoorthy, B.; Pai, M.M.; Ullal, S.; Prabhu, L.V. Discriminant function analysis of craniometric traits for sexual dimorphism and its implication in forensic anthropology. J. Anat. Soc. India 2019, 68, 260–268. [Google Scholar] [CrossRef] [Scilit] [PubMed]
  23. Zhan, M.J.; Cui, J.H.; Zhang, K.; Chen, Y.J.; Deng, Z.H. Estimation of stature and sex from skull measurements by multidetector computed tomography in Chinese. Leg. Med. 2019, 41, 101625. [Google Scholar] [CrossRef] [Scilit] [PubMed]
  24. Sassi, C.; Picapedra, A.; Álvarez-Vaz, R.; Martins Schmidt, C.; Ulbricht, V.; Daruge Júnior, E.; Francesquini Júnior, L. Sex determination in a Brazilian sample from cranial morphometric parameters—A preliminary study. J. Forensic Odontostomatol. 2020, 38, 8–17. [Google Scholar] [PubMed]
  25. Toneva, D.H.; Nikolova, S.Y.; Agre, G.P.; Zlatareva, D.K.; Hadjidekov, V.G.; Lazarov, N.E. Data mining for sex estimation based on cranial measurements. Forensic Sci. Int. 2020, 315, 110441. [Google Scholar] [CrossRef] [Scilit] [PubMed]
  26. Berezowski, V.; Rogers, T.; Liscio, E. Evaluating the morphological and metric sex of human crania using 3-dimensional (3D) technology. Int. J. Leg. Med. 2021, 135, 1079–1085. [Google Scholar] [CrossRef] [Scilit] [PubMed]
  27. Cekdemir, Y.E.; Mutlu, U.; Karaman, G. Estimation of sex using morphometric measurements performed on cranial computerized tomography scans. Radiol. Med. 2021, 126, 306–315. [Google Scholar] [CrossRef] [Scilit] [PubMed]
  28. Salmanipour, A.; Memarian, A.; Tofighi, S.; Vahedifard, F.; Khalaj, K.; Shiri, A.; Azimi, A.; Hajipour, R.; Sadeghi, P.; Motamedi, O. Prediction of sex, based on skull CT scan measurements in Iranian ethnicity by machine learning-based model. Forensic Imaging 2023, 33, 200549. [Google Scholar] [CrossRef] [Scilit]
  29. Tabachnick, B.G.; Fidell, L.S. Using Multivariate Statistics, 7th ed.; Pearson: New York, NY, USA, 2022. [Google Scholar]
  30. Casella, G.; Berger, R.L. Statistical Inference, 2nd ed.; Duxbury Press: Pacific Grove, CA, USA, 2002. [Google Scholar]
  31. Berkban, T.; Iamsaard, S.; Lapyuneyong, N.; Tasu, P.; Poodendaen, C.; Srisen, K.; Boonthai, W.; Duangchit, S. Sex determination by using discriminant function analyses from the Northeastern-Thai occipital bones. Int. J. Morphol. 2024, 42, 1195–1199. [Google Scholar] [CrossRef] [Scilit]
  32. Poodendaen, C.; Choompoo, N.; Namvongsakool, P.; Linlad, S.; Chalermrerm, J.; Duangchit, S.; Boonthai, W.; Iamsaard, S.; Aorachon, P.; Putiwat, P. External validation of femoral sex estimation equations: Evidence supporting population-specific standards in forensic anthropology. Transl. Res. Anat. 2025, 41, 100445. [Google Scholar] [CrossRef] [Scilit]
  33. Klales, A.R.; Lesciotto, K.M. Reevaluating skeletal sex estimation practices in forensic anthropology. J. Forensic Sci. 2025, 70, 825–834. [Google Scholar] [CrossRef] [Scilit] [PubMed]
  34. Krishan, K.; Chatterjee, P.M.; Kanchan, T.; Kaur, S.; Baryah, N.; Singh, R.K. A review of sex estimation techniques during examination of skeletal remains in forensic anthropology casework. Forensic Sci. Int. 2016, 261, 165.e1–165.e8. [Google Scholar] [CrossRef] [Scilit] [PubMed]
Figure 1. Age distribution by sex for the training and holdout datasets. Histograms show the frequency distribution of age (in 10-year intervals) by sex for the training dataset (left, n = 200) and the holdout dataset (right, n = 100). Bars indicate frequency counts for females (pink) and males (blue), with the region of overlap between sexes shown in blended color (dark blue/purple).
Forensicsci 06 00074 g001
Figure 2. Craniofacial measurement landmarks and parameters. (a) Lateral view illustrating the eight linear measurements (P1–P8) connecting Bregma (B), Lambda (L), Nasion (N), Basion (Ba), and Prosthion (Pr). (b) Superior view showing Bregma. (c) Inferior view showing Basion. (d) Anterior view showing Nasion. (e) Anterior view showing Prosthion. (f) Posterior view showing Lambda.
Forensicsci 06 00074 g002
Figure 3. Box plots of sex-based distributions for the eight craniofacial parameters (P1–P8): (a) P1, basion–lambda; (b) P2, lambda–bregma; (c) P3, bregma–basion; (d) P4, bregma–nasion; (e) P5, basion–nasion; (f) P6, nasion–prosthion; (g) P7, basion–prosthion; (h) P8, lambda–nasion. * Significant difference by independent samples t-test (P3, P4, P5, P6), effect size as Cohen’s d. # Significant difference by Mann–Whitney U test (P1, P2, P7, P8), effect size as r. Hollow circles denote outliers for females; filled circles denote outliers for males.
Forensicsci 06 00074 g003
Table 1. Cranial morphometric parameters and their osteometric landmark definitions.
CodeDefinition
P1Linear distance between basion and lambda (Ba–L)
P2Linear distance between lambda and bregma (L–B)
P3Linear distance between bregma and basion (B–Ba)
P4Linear distance between bregma and nasion (B–N)
P5Linear distance between basion and nasion (Ba–N)
P6Linear distance between nasion and prosthion (N–Pr)
P7Linear distance between basion and prosthion (Ba–Pr)
P8Linear distance between lambda and nasion (L–N)
Table 2. Univariate assumption testing for cranial measurements.
ParameterS-W CombinedS-W MaleS-W FemaleLevene’s
P10.000 *0.037 *0.015 *0.002 *
P20.0950.029 *0.033 *0.521
P30.2110.6320.0850.842
P40.011 *0.1660.4330.008 *
P50.046 *0.5680.1150.071
P60.4940.9140.4240.619
P70.3800.030 *0.9620.876
P80.031 *0.5090.003 *0.433
Note: Values represent p-values from Shapiro–Wilk (S-W) normality test and Levene’s test for homogeneity of variance. * p < 0.05 indicates assumption not satisfied. A parameter was analyzed non-parametrically in subsequent sex-comparison analyses if either sex subgroup showed a significant departure from normality.
Table 3. Univariate classification performance of DFA, BLR, and SVM.
ParameterMethodAccuracySensitivitySpecificityMCCAUC (95% CI)
P1DFA69.062.076.00.3840.760 (0.695–0.826)
BLR69.564.075.00.3920.760 (0.695–0.826)
SVM67.564.071.00.3510.749 (0.681–0.817)
P2DFA62.557.068.00.2520.687 (0.613–0.761)
BLR64.060.068.00.2810.687 (0.613–0.761)
SVM59.573.046.00.1970.623 (0.546–0.700)
P3DFA77.075.079.00.5400.831 (0.775–0.887)
BLR77.075.079.00.5400.831 (0.775–0.887)
SVM77.573.082.00.5520.810 (0.750–0.870)
P4DFA73.568.079.00.4730.773 (0.708–0.838)
BLR71.568.075.00.4310.773 (0.708–0.838)
SVM73.067.079.00.4630.738 (0.669–0.807)
P5DFA70.568.073.00.4110.786 (0.724–0.849)
BLR70.568.073.00.4110.786 (0.724–0.849)
SVM67.562.073.00.3520.774 (0.709–0.839)
P6DFA60.060.060.00.2000.700 (0.628–0.772)
BLR60.060.060.00.2000.700 (0.628–0.772)
SVM59.057.061.00.1800.675 (0.601–0.749)
P7DFA56.556.057.00.1300.609 (0.531–0.686)
BLR56.556.057.00.1300.609 (0.531–0.686)
SVM57.562.053.00.1510.552 (0.472–0.632)
P8DFA76.073.079.00.5210.841 (0.786–0.897)
BLR78.077.079.00.5600.841 (0.786–0.897)
SVM77.586.069.00.5580.802 (0.741–0.863)
Table 4. Multivariate sex classification performance by classifier and parameter-entry strategy.
ClassifierParameter SetAccuracySensitivitySpecificityMCCAUC (95% CI)
(Method) (%)(Male, %)(Female, %)
DFA (direct entry)P1–P883.582.085.00.6700.917 (0.879–0.955)
DFA (stepwise)P3, P6, P7, P878.073.083.00.5630.884 (0.838–0.930)
BLR (direct entry)P1–P882.582.083.00.6500.919 (0.883–0.956)
BLR (stepwise)P1, P2, P3, P4, P6, P7, P883.585.082.00.6700.915 (0.877–0.954)
SVM (full entry)P1–P885.586.085.00.7100.926 (0.892–0.961)
Note: MCC = Matthews correlation coefficient; AUC = area under the receiver operating characteristic curve; CI = confidence interval.
Table 5. Multivariate classification performance: training versus holdout validation.
ClassifierDatasetAccuracy (%)
(95% CI)
Sensitivity (%)
(95% CI)
Specificity (%)
(95% CI)
MCC
(95% CI)
AUC
(95% CI)
DFA (direct entry)Training83.5
(77.7–88.0)
82.0
(73.3–88.3)
85.0
(76.7–90.7)
0.670
(0.567–0.770)
0.917
(0.879–0.955)
Holdout74.0
(64.6–81.6)
72.0
(58.3–82.5)
76.0
(62.6–85.7)
0.480
(0.302–0.646)
0.870
(0.798–0.942)
Δ−9.5−10.0−9.0−0.190−0.047
DFA (stepwise)Training78.0
(71.8–83.2)
73.0
(63.6–80.7)
83.0
(74.5–89.1)
0.563
(0.444–0.672)
0.884
(0.838–0.930)
Holdout75.0
(65.7–82.5)
78.0
(64.8–87.2)
72.0
(58.3–82.5)
0.501
(0.329–0.663)
0.842
(0.764–0.920)
Δ−3.0+5.0−11.0−0.062−0.042
BLR (direct entry)Training82.5
(76.6–87.1)
82.0
(73.3–88.3)
83.0
(74.5–89.1)
0.650
(0.539–0.750)
0.919
(0.883–0.956)
Holdout76.0
(66.8–83.3)
78.0
(64.8–87.2)
74.0
(60.4–84.1)
0.520
(0.342–0.682)
0.867
(0.795–0.939)
Δ−6.5−4.0−9.0−0.130−0.052
BLR (stepwise)Training83.5
(77.7–88.0)
85.0
(76.7–90.7)
82.0
(73.3–88.3)
0.670
(0.563–0.771)
0.915
(0.877–0.954)
Holdout75.0
(65.7–82.5)
76.0
(62.6–85.7)
74.0
(60.4–84.1)
0.500
(0.321–0.661)
0.862
(0.789–0.935)
Δ−8.5−9.0−8.0−0.170−0.053
SVM
(full entry)
Training85.5
(80.0–89.7)
86.0
(77.9–91.5)
85.0
(76.7–90.7)
0.710
(0.612–0.801)
0.926
(0.892–0.961)
Holdout76.0
(66.8–83.3)
82.0
(69.2–90.2)
70.0
(56.2–80.9)
0.524
(0.350–0.683)
0.847
(0.773–0.921)
Δ−9.5−4.0−15.0−0.186−0.079
Note: MCC = Matthews correlation coefficient; AUC = area under the receiver operating characteristic curve; CI = confidence interval. Sensitivity denotes the male correct-classification rate (male accuracy) and specificity denotes the female correct-classification rate (female accuracy). Δ rows show point-estimate differences (Holdout − Training) without CI.
Table 6. Summary of reported sex estimation accuracy from craniometric studies across populations.
Author, YearPopulationn (M/F)SpecimenMethodAccuracy (%)
Mahakkanukrauh et al., 2015 [8]Northern Thai100/100Dry boneDFA91.4
Ramamoorthy et al., 2019 [22]Indian45/25CT imageDFA97.1
Zhan et al., 2019 [23]Chinese200/182CT imageDFA89.3
Sassi et al., 2020 [24]Brazilian101/86Dry boneLR78.5
Toneva et al., 2020 [25]Bulgarian151/207CT imageML91.9
Berezowski et al., 2021 [26]American20/203D modelLDA90.0
Cekdemir et al., 2021 [27]Caucasian309/307CT imageLR94.7
Meral et al., 2022 [9]Turkish300/300CT imageDFA88.0
Salmanipour et al., 2023 [28]Iranian118/81CT imageML89.0
Duangchit et al., 2026 [10]NE Thai150/150CT imageDFA85.7
Present studyNE Thai100/100Dry boneML(SVM)85.5
Note: DFA = discriminant function analysis; LR = logistic regression; LDA = linear discriminant analysis; ML = machine learning. NE Thai = Northeastern Thai. Accuracy values reflect the highest-performing classifier reported in each respective study. Validation strategies varied across studies and were not consistently specified; accuracy values should therefore be compared with caution.
Disclaimer/Publisher’s Note: The statements, opinions and data contained in all publications are solely those of the individual author(s) and contributor(s) and not of MDPI and/or the editor(s). MDPI and/or the editor(s) disclaim responsibility for any injury to people or property resulting from any ideas, methods, instructions or products referred to in the content.