Article

Investigating Bounding Box, Landmark, and Segmentation Approaches for Automatic Human Barefoot Print Classification on Soil Substrates Using Deep Learning

1
Department of Mechanical, Energy and Industrial Engineering, Botswana International University of Science and Technology (BIUST), Private Bag 16, Palapye 10071, Botswana
2
WildTrack Inc., Nicholas School of the Environment, Duke University, Box 90329, Durham, NC 27708, USA
*
Author to whom correspondence should be addressed.
Forensic Sci. 2025, 5(4), 56; https://doi.org/10.3390/forensicsci5040056
Submission received: 12 September 2025 / Revised: 23 October 2025 / Accepted: 29 October 2025 / Published: 31 October 2025

Abstract

Background/Objectives: This study investigated the use of artificial intelligence (AI) to identify and match barefoot prints belonging to the same individual on soft and sandy soil substrates. Recognizing footprints on soil is challenging due to low contrast and variability in impressions. Methods: We introduce Deep Learning Footprint Identification Technology (DeepFIT), based on a modified You Only Look Once (YOLOv11s) algorithm, using three methods, namely, Bounding Box (BBox), 16 anatomical landmarks, and automatically segmented outlines (Auto-Seg). An Extra Small Detection Head (XSDH) was added to improve feature extraction at smaller scales and enhance generalization through multi-scale supervision, reducing overfitting to specific spatial patterns. Results: Forty adults (20 males, 20 females) participated, with 600 images per individual. As the number of individuals in model training increased, the BBox model’s accuracy declined, resulting in misclassification on the test set. The average performance accuracy across both substrates was 77% for BBox, 90% for segmented outlines, and 96% for anatomical landmarks. Conclusions: The landmark method was the most reliable for identifying and matching barefoot prints on both soft and sandy soils. This approach can assist forensic practitioners in linking suspects to crime scenes and reconstructing events from footprint evidence, providing a valuable tool for forensic investigations.

1. Introduction

Technologies for identifying individual barefoot prints have advanced to support forensic investigations, where recognizing footprints belonging to a specific individual is critical [1]. An individual’s barefoot print is created when the friction ridges and weight-bearing areas of the foot are in contact with the surface. Therefore, where it is necessary to track individuals walking barefoot, the footprints left behind are key to successful identification [2]. Identifying and analyzing these footprints is critical for crime scene reconstruction, surveillance, and security. Furthermore, the evidence collected from suspected footprints can yield vital information, such as the age [3], sex [4], and height [5] of a perpetrator, victim, or suspect, although not with 100% certainty [6].
The goal of this study is to achieve accurate classification of barefoot prints belonging to the same individual on soft and sandy soil substrates (see Figure 1) using deep neural networks. Such capability would support positive suspect or victim identification in forensic and security investigations.
Automated recognition of barefoot prints on soil substrates remains understudied, hindering timely forensic investigations and behavioral interpretation [7].
The prevalence of barefoot walking is declining in urban areas owing to modernization and evolving lifestyles. However, soil covers the rest of the natural environment where other human activities occur, such as outdoor activities, military operations, wildlife conservation, and antipoaching activities [8,9]. In urban areas, criminals often refrain from wearing footwear due to the noise they create [10]. This makes it essential for investigators to analyze barefoot impressions left behind as potential evidence. Common crimes traced through barefoot prints include homicides and crime scenes involving sexual assaults [11]. Therefore, identified barefoot prints can serve as forensic evidence to support legal action following an arrest. Current methods for identifying barefoot prints rely on manual measurements, digital software analysis, footprint scanning techniques, and metric grid assessments, which can be labor-intensive and susceptible to human error. Manual methods require significant expertise and may not handle large datasets.
Footprint Identification Technology (FIT) is a system that combines morphometric analysis and statistical methods to identify individual animals based on their footprints. FIT has been widely used in wildlife conservation for tracking and identification [12,13]. Drawing from this approach, our study integrates expert-guided morphometric principles (during supervised machine learning development) with deep learning into a single analytical pipeline for human footprint identification. We refer to this approach as DeepFIT, which highlights the combined use of deep learning and footprint morphometrics. DeepFIT builds on FIT principles but adapts them to human footprints, providing a scalable and semi-automated method for identifying barefoot impressions on soil substrates.
Barefoot prints were captured as images and processed through a convolutional neural network. It is worth noting that various deep learning models are available as open-source, ‘off-the-shelf’ packages that can be modified and directly employed for various applications through transfer learning [14,15,16,17].
The specific aims of the study are stated as follows. First is to integrate three complementary features, namely BBox, anatomical landmarks, and automatically segmented outlines, to enable accurate identification of footprints directly from soil substrates. Second is to use a semi-automated approach to identify sixteen anatomical landmarks, combining expert annotation with automatic detection. Third is to incorporates a deep learning architecture to capture fine morphometric details critical to differentiating individuals. Lastly, to use a novel adaptation of the Segment Anything model (SAM) to extract precise and reproducible footprint outlines, ensuring consistency across large datasets.

2. Related Work

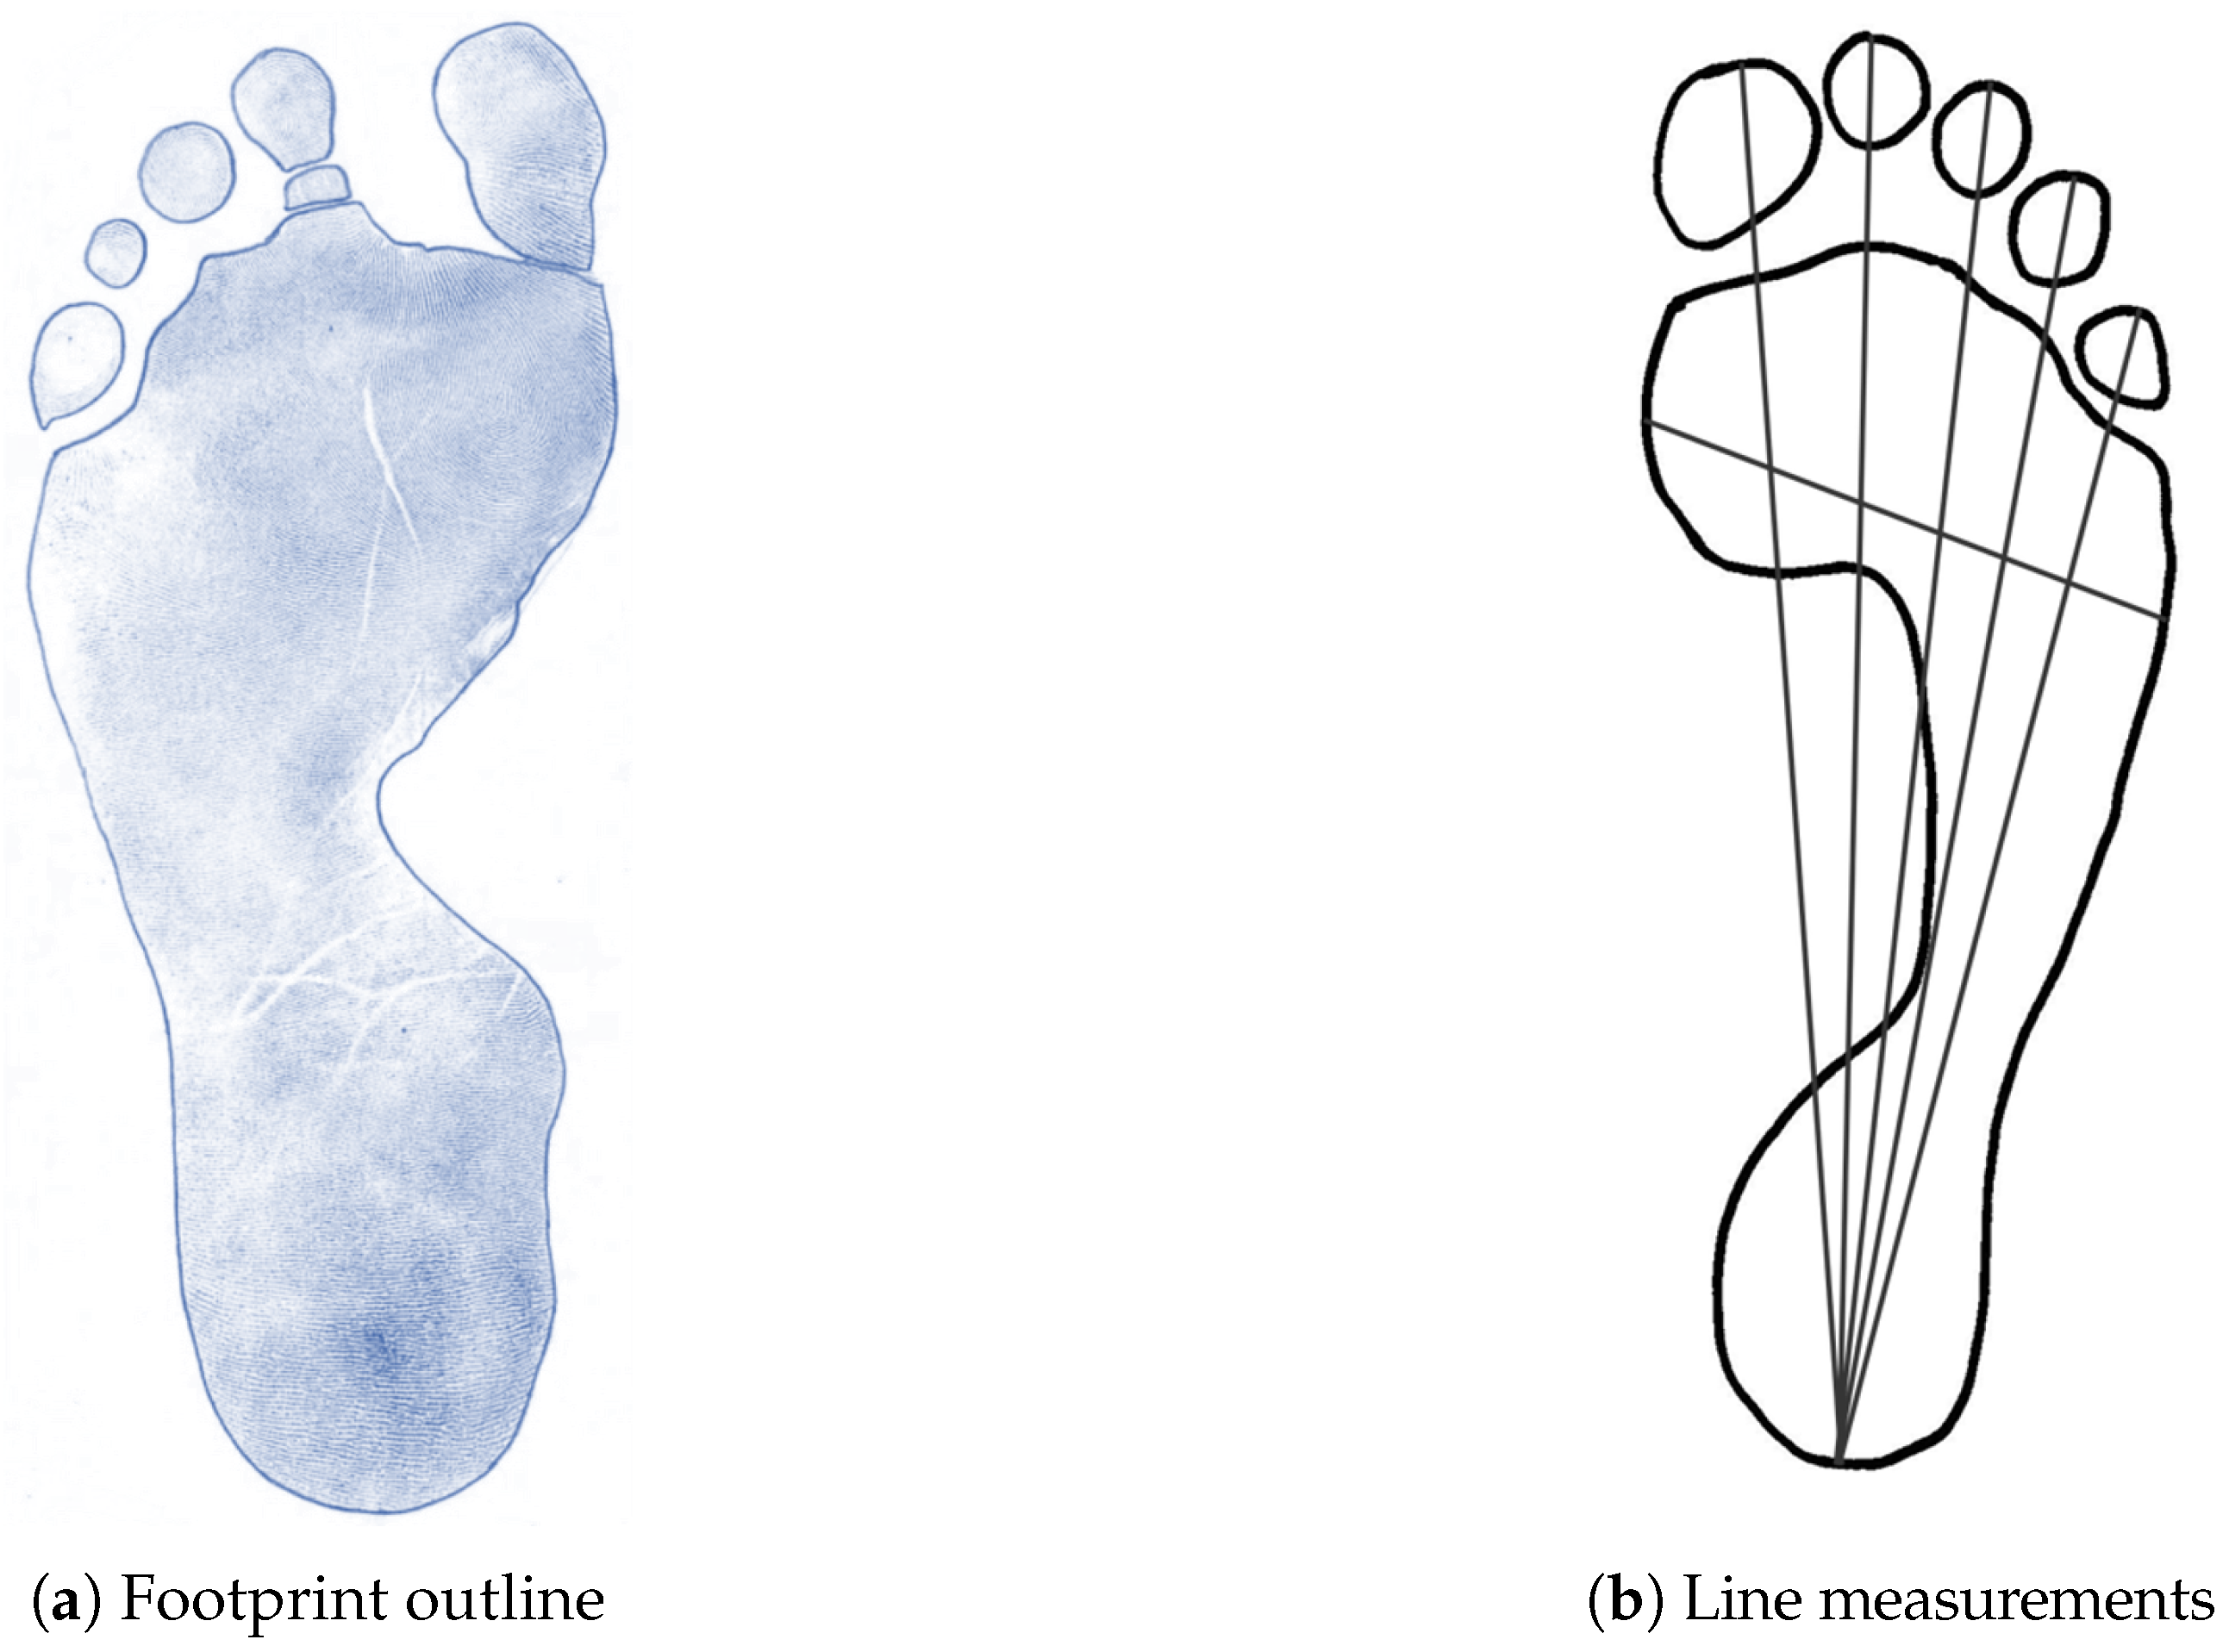
The current literature on barefoot print analysis suggests that various manual methods have historically been used for barefoot print identification [18,19]. These methods can be categorized into two main groups, as shown in Figure 2, those that rely on the outline morphology of the footprint, and those that depend on line measurements of anatomical features [20,21]. Existing traditional methods include the Gunn method [22], which involves drawing lines from the heel of a footprint to the tip of each toe. Another line was drawn across the most medial and lateral parts of the foot ball. This concept involves manually measuring lines for future comparisons. The other technique is Robbins [23], which comprises of two methods. The first step involved drawing a diagonal lines from the pternion landmark to the tip of each toe. The second requires drawing parallel lines that are perpendicular to the baseline, extending from the rearmost part of the heel to the tip of each toe. Consequently, to analyze the barefoot impression, length, width, and angular measurements are manually extracted and recorded. The optical centre method [24] is implemented by drawing circles at the centre of the heel and centre of each of the five toes. The Gunn method [22] is then employed to connect the centroid of the heel to the five toes.
It is clear that the methods described above mainly rely on manual measurements of specific key landmarks. This approach requires repeated subjective assessment of landmark point positions, making it unreliable and susceptible to human errors, which can lead to inconsistent results, whereas our method reduces human involvement to only the training data, after which the model automatically places the landmarks. Traditional manual methods struggle with large data sets and hence require more time for comparison and evaluation, which is labor-intensive and impractical. In contrast, our method efficiently handles data and can analyze details that may be overlooked by the naked eye.
In addition to the methods mentioned above, some are based on the barefoot outline, such as the Overlay Method [25], which relies on manual tracing of the footprint outline using a transparent acetate sheet. This method does not involve line measurements. In contrast, our deep learning approach utilizes a BBox as a prompt to segment anything model to extract precise geometric outlines, while an XSDH enhances feature learning for morphometric analysis. Similarly, Domjanic et al. [26] captured and analyzed barefoot landmarks using a scanner and geometric analysis software to assess foot shape variation. Automated approaches have been introduced to improve reliability. In 2012, Reel [27] developed a more reliable method for extracting length, breadth, and angular measurements from scanned prints. The process involved utilizing automated GNU Image Manipulation Program (GIMP, version 2.10.36, The GIMP Development Team, Berkeley, CA, USA).
Due to the limitations of traditional methods, deep learning has been increasingly applied to footprint analysis with promising accuracy. The study [28] used YOLOv4 to identify left and right footprints of individuals with cerebral palsy (CP) on plantar pressure images, achieving 99% accuracy. This high performance can be attributed to the nature of the dataset, which provides clear and standardized images with minimal background interference. In contrast, our study uses soil-based footprints with variability, low contrast, and noise, making recognition even more challenging. Chen et al. [29] developed a Triple Generalized Inverse Neural Network (TGINN) to classify data from smart insoles, achieving 82% accuracy. Similarly, Keatsamarn et al. [30] used optical sensors to extract pressure images for CNN-based analysis, achieving 92.69% accuracy.
Both approaches benefit from structured, sensor-based inputs collected under controlled conditions, unlike natural footprints on soil, which are influenced by uncontrolled environmental factors and lack the consistency and precision of sensor-acquired data. The study [31] used CNNs to determine sex from 2D barefoot footprints, achieving around 90% accuracy, with landmarks and ridge patterns clearly visible. However, such 2D images are captured under standard conditions and inherently preserve anatomical details that are often missing or obscured in soil-based prints, as they suffer from surface distortions and incomplete impressions, making identification more challenging. In our approach, we introduce 16 automated landmarks, five of which are placed in the centroids of the toes, allowing the model to learn discriminative features even from distorted or low-contrast soil prints.
BEng et al. [32] applied a score-based likelihood ratio framework on clear, high-feature visibility prints for forensic analysis. While their aproach is effective under ideal conditions, such approaches may not generalize to natural soil impressions that exhibit inconsistencies. Shen et al. [33] proposed a YOLOv8-StarNet backbone for footprints collected on a white sheet, achieving 73.6%, while Ibrahimoglu et al. [34] used ink and scanners, reaching 99%. These setups provide high-contrast, well-defined images, which facilitate feature extraction and reduce background noise compared to footprints collected in natural soil environments. Jin et al. [35] developed a deep-learning algorithm that captures footprint contours without leveraging anatomical landmarks, which may limit its robustness when dealing with degraded or incomplete prints.
It is evident that the materials and techniques used in the collection and analysis of barefoot prints have become increasingly sophisticated, including the use of pressure sensors, smart insoles, and 3D scans as summarized in Table 1. However, these approaches remain largely confined to controlled environments.
Therefore, direct comparisons of accuracy with these methods can be misleading, as they involve different data types and conditions that are not representative of natural soil-based footprints. Our study addresses this critical gap by systematically investigating BBox, automated landmark, and segmentation approaches for classifying barefoot prints on natural soil. Unlike previous methods limited to controlled settings, our approach demonstrates the ability of deep learning to extract and analyze morphometric features from images captured under challenging real-world conditions. Thus, the key contributions of this study can be summarized as follows:
  • This study is the first to investigate barefoot print classification through deep learning using a bounding box (BBox), anatomical landmarks, and automatic segmented outlines on the soil substrate.
  • Developed a method that automates the identification of 16 anatomical landmarks by integrating manual annotation with automatic identification using a DeepFIT network.
  • Introduce a DeepFIT architecture with an extra small detection head (XSDH) to enhance the model’s ability to capture fine details that are critical for precise morphometric analysis, which can be crucial for differentiating between individuals.
  • This paper presents a novel application of the Segment Anything model, utilizing a BBox as a prompt to automatically extract precise footprint outlines, ensuring consistency and reproducibility across large datasets.
  • This is the only study that automatically identifies a set of footprints (left and right) on the soil substrate by correlating them based on similar morphometric features and labeling them as belonging to one individual.

3. Materials and Methods

3.1. Methodology Description

This section outlines a supervised learning approach for identifying and classifying human barefoot prints on two types of soil substrates [36]. To enhance generalization, the models were trained on a combined dataset of barefoot prints on soft and sandy soils to learn the robust features of both substrates. We also trained on a dataset of different soil substrates to assess the impact of soil structure on performance. Furthermore, we retained the BBox as a foundational element while exploring the influence of 16 landmark points and Auto-Seg methods to further improve accuracy and adaptability. Based on previous results using manual methods [37],we hypothesize that this approach enables automatic classification, more precise delineation, and analysis of barefoot print characteristics.
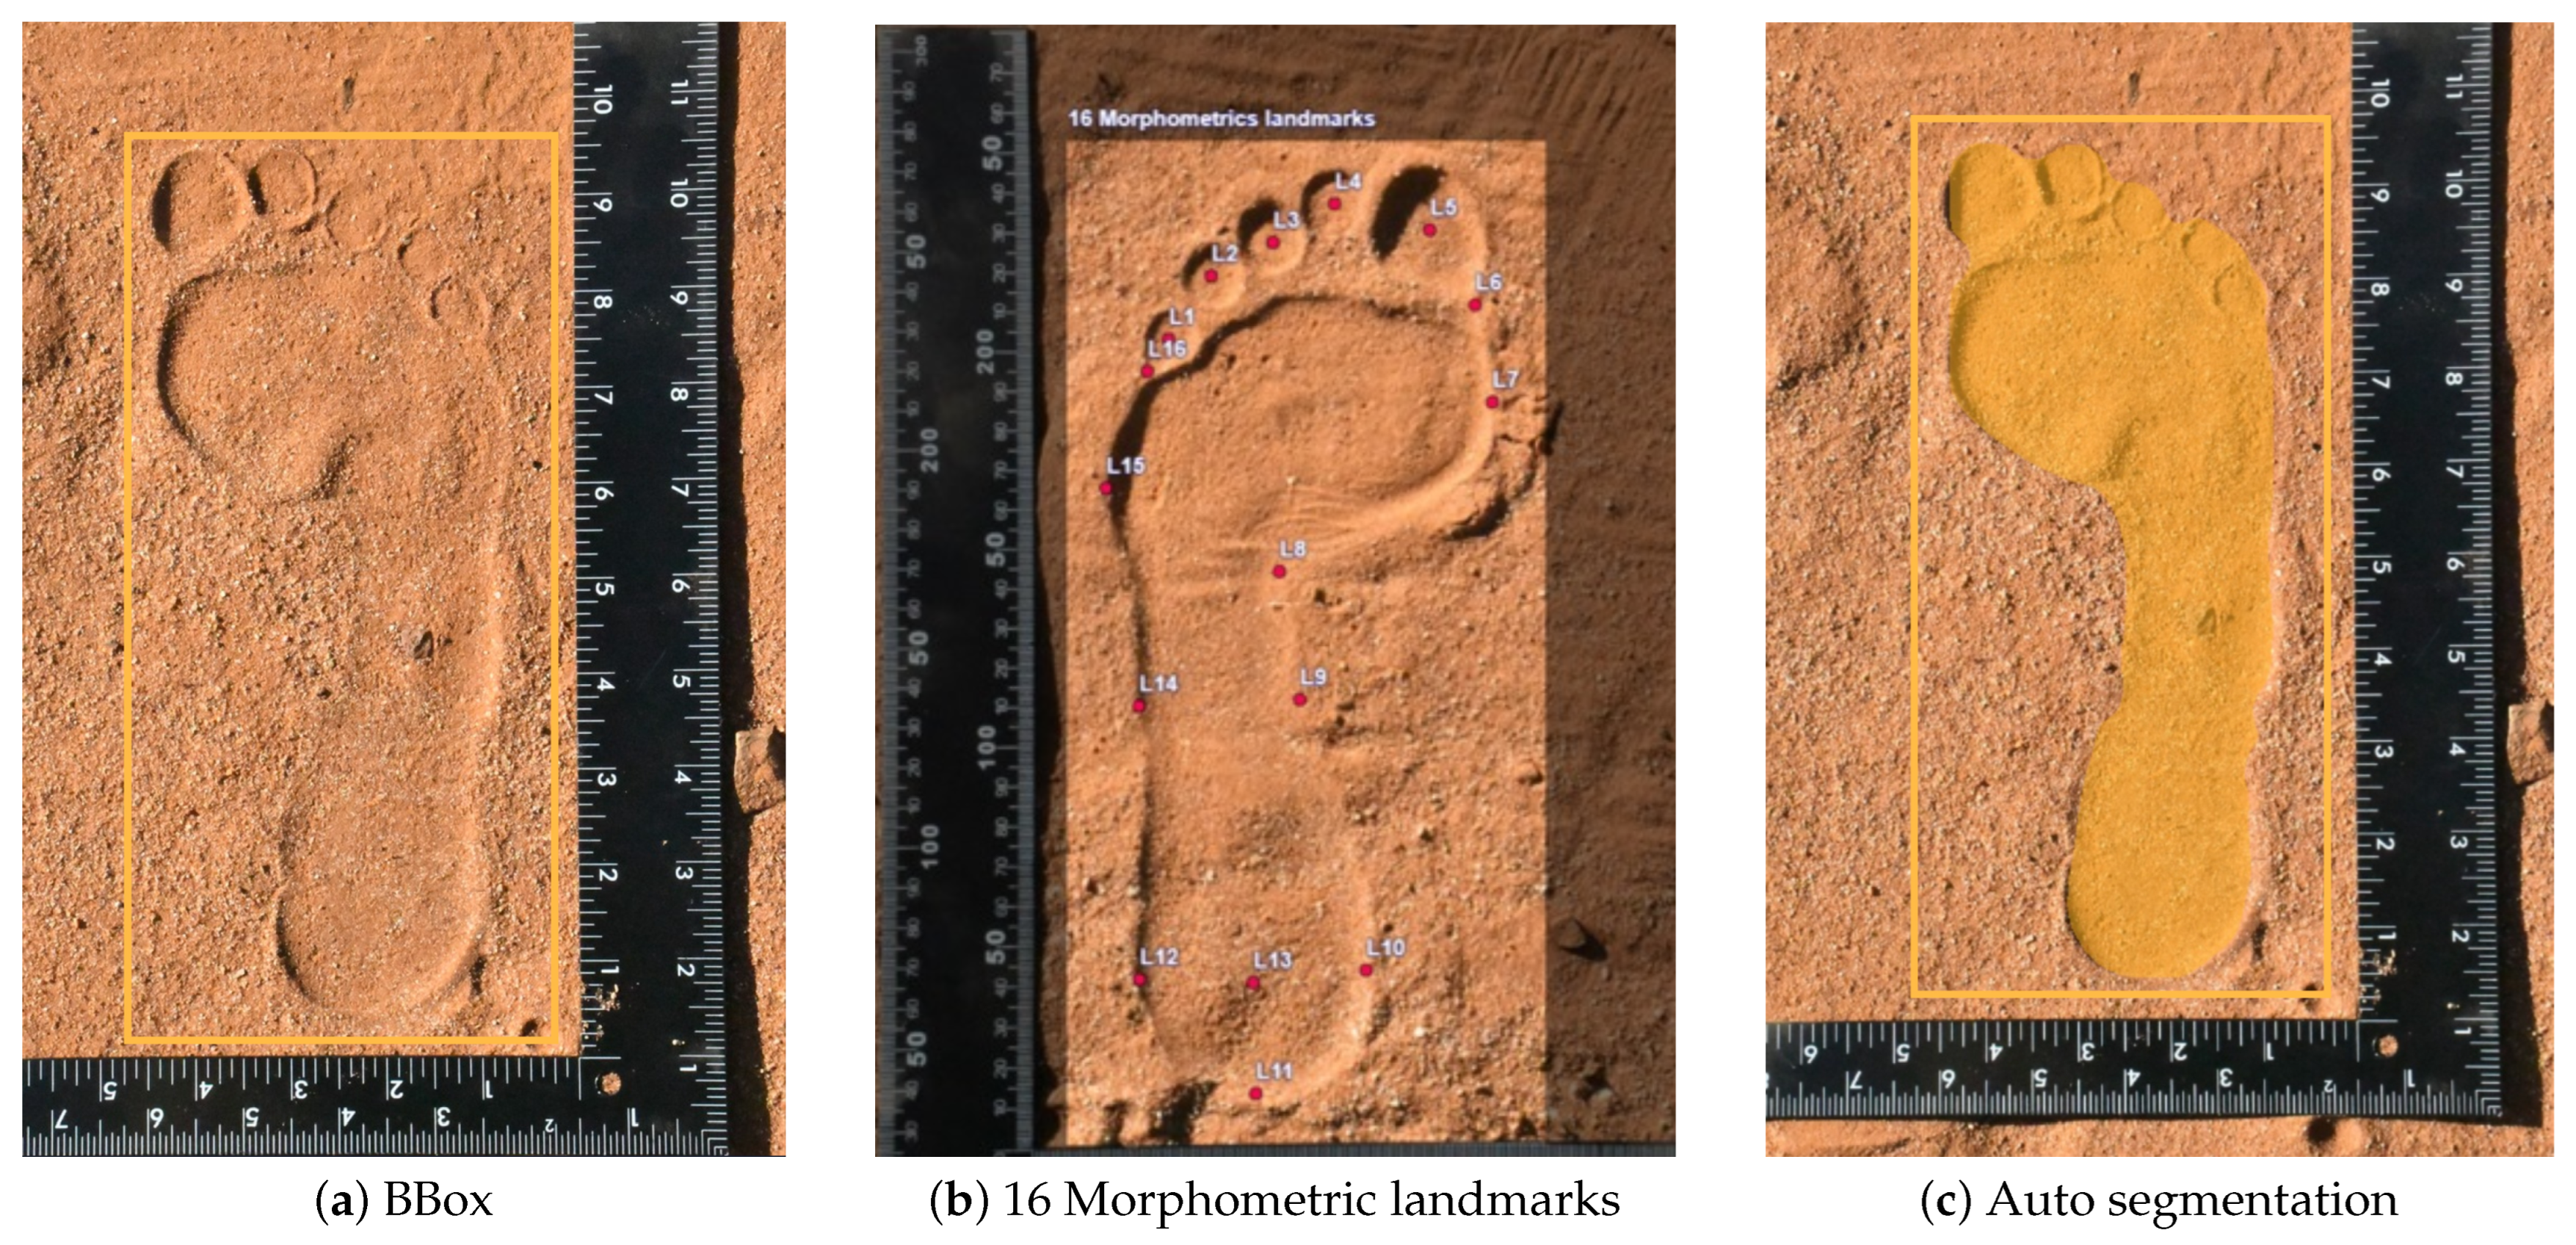
By retaining BBox, as shown in Figure 3a, we created a consistent baseline for comparison, allowing us to assess the inclusion of 16 landmark points, Figure 3b, and Auto-Seg, as shown in Figure 3c, influences the overall performance and accuracy of footprint identification and classification. To systematically assess the impact of increasing the number of subjects, we evaluated performance in two critical groups: a small group (2–10 individuals) and a larger group (11–40 individuals). This allows us to analyze how scalability influences identification accuracy. DeepFIT models process input images resized to 640 × 640 pixels. However, the aspect ratio of the footprints remained unchanged [29].

3.2. DeepFIT Morphometric Landmark Method

Human barefoot prints provide well-defined morphometric landmarks suitable for the DeepFIT landmark-based method [30]. The 2-dimensional pixel coordinates x l and y l of the (16) landmarks, are shown in Figure 3b, and Table 2, were selected based on key anatomical characteristics of the footprint. These landmarks correspond to crucial points that are vital for determining the shape, orientation, and unique characteristics of the footprint. The selected landmarks were annotated and trained for automatic geometric morphometric analysis to ensure that they accurately captured the most pertinent features for precise footprint identification.
An expert in Footprint Identification Technology (FIT), specializing in animal track morphology [12,13], empirically guided and supervised the placement of sixteen repeatable landmarks on anatomically relevant regions of the human barefoot print to capture key morphological features. Although primarily used in animal track identification, the same principles have been applied to human barefoot prints on the soil substrate. Furthermore, forensic podiatric studies informed the placement of landmarks to ensure alignment with established methodologies in human footprint analysis. These landmarks were used to train the network based on 40 individual footprints labeled accordingly. The model learns the distinct configurations and spatial orientations of the landmarks associated with the barefoot print of a particular individual. During inference of new images, the network analyzes the detected footprint landmarks and searches for the closest features of a barefoot print in the model. From the closest features, the classification output associates the input image to a particular individual among the 40 subjects.
To illustrate this, we first define I R w × h × 3 as an image of barefoot prints and L R N L × 3 as a tensor of N L given the barefoot print landmarks to be found. Each element L contains the image coordinates x l and y l of a landmark l, along with the probability of correct identification of landmark p l . In some cases, landmark detection may involve ambiguity, such as when the footprint is unclear or difficult to detect. The probability helps quantify this uncertainty, allowing the model to predict the landmark location even if it is not perfectly certain. Therefore
L l = x l y l p l , l = 1 , 2 , , N L .
It is necessary to determine a mapping f from the provided image I R w × h × 3 to the landmarks tensor L R N L × 3 . Given the input image I and the landmark tensor L, the goal is to determine a mapping function f such that.
f : I L .
The overall confidence score for all the combined landmarks is given by
Average   Confidence   Score = 1 N L l = 1 N L p l .
The landmark loss function uses the mean squared error (MSE), which minimizes the squared Euclidean distance between the predicted ( x ^ l , y ^ l ) and the ground truth ( x l , y l ) coordinates [38].
The loss function L to optimize during training is obtained by
L = 1 N L l = 1 N L α ( x l x ^ l ) 2 + ( y l y ^ l ) 2 + β ( p l p ^ l ) 2
where
-
x l and y l are the true coordinates of landmark l,
-
x ^ l and y ^ l are the predicted coordinates,
-
p l is the true probability of correct identification,
-
p ^ l is the predicted probability,
-
N L is the number of landmarks (16 landmarks), and α and β are jointly optimized without explicit weighting (i.e., α = β = 1), and are governed by the gradient magnitude and task-specific dynamics as described in [39,40].

3.3. DeepFIT Auto-Segmentation Based Method

The segmentation process automatically generates the shape outline of the barefoot print, from which the 2D coordinates ( x l , y l ), that define the segment are extracted. We utilized the Segment anything model (SAM) model to automatically extract segments, thereby avoiding extensive manual labeling and minimizing human subjectivity [41]. The SAM model framework automatically generates pixel-level regions of different objects within an image [42]. Consistent with Domjanic et al. [26], who characterized the barefoot print outline using 85 landmarks, this study demonstrates that the outline remains a reliable feature for classification. However, instead of relying on a fixed set of 85 landmarks, our method extracts the outline through Auto-Seg, and effectively captures an unlimited number of points. This allowed for more detailed representation of the footprint shape without predefining the most significant landmarks in the outline. We provide the BBox annotations as prompts for the SAM model, enabling it to generate a segmentation outline based on coordinate data.
The Repeat Annotation feature (Roboflow) enabled reuse of existing annotations across similar images, reducing manual labeling time, and ensuring consistency. Subsequently, the SAM-generated landmarks are converted into a format compatible with the DeepFIT network. The network learns shape outline features from 40 individuals for future comparison with unseen data. Automating these processes significantly improves the efficiency and accuracy of barefoot print analysis, offering a powerful tool for forensic and biometric applications. The segmentation model presented in Figure 4 can be expressed as follows. Given an image I R w × h × 3 , the SAM generates a segmentation mask S R w × h , where each pixel represents the probability of belonging to the footprint. Let O R N O × 2 denote a set of N O coordinates that outline the shape of the barefoot prints, automatically extracted from the segmentation mask. The mapping function f SAM which transforms image I into outline coordinates O can be expressed as
f SAM : I S O
where
  • S = SAM ( I ) , represents the segmentation mask produced by the Segment Anything Model from image I,
  • O = Contour ( S ) , and represents the set of coordinates that define the contour of the footprint, derived from segmentation S.

3.4. DeepFIT Network Structure

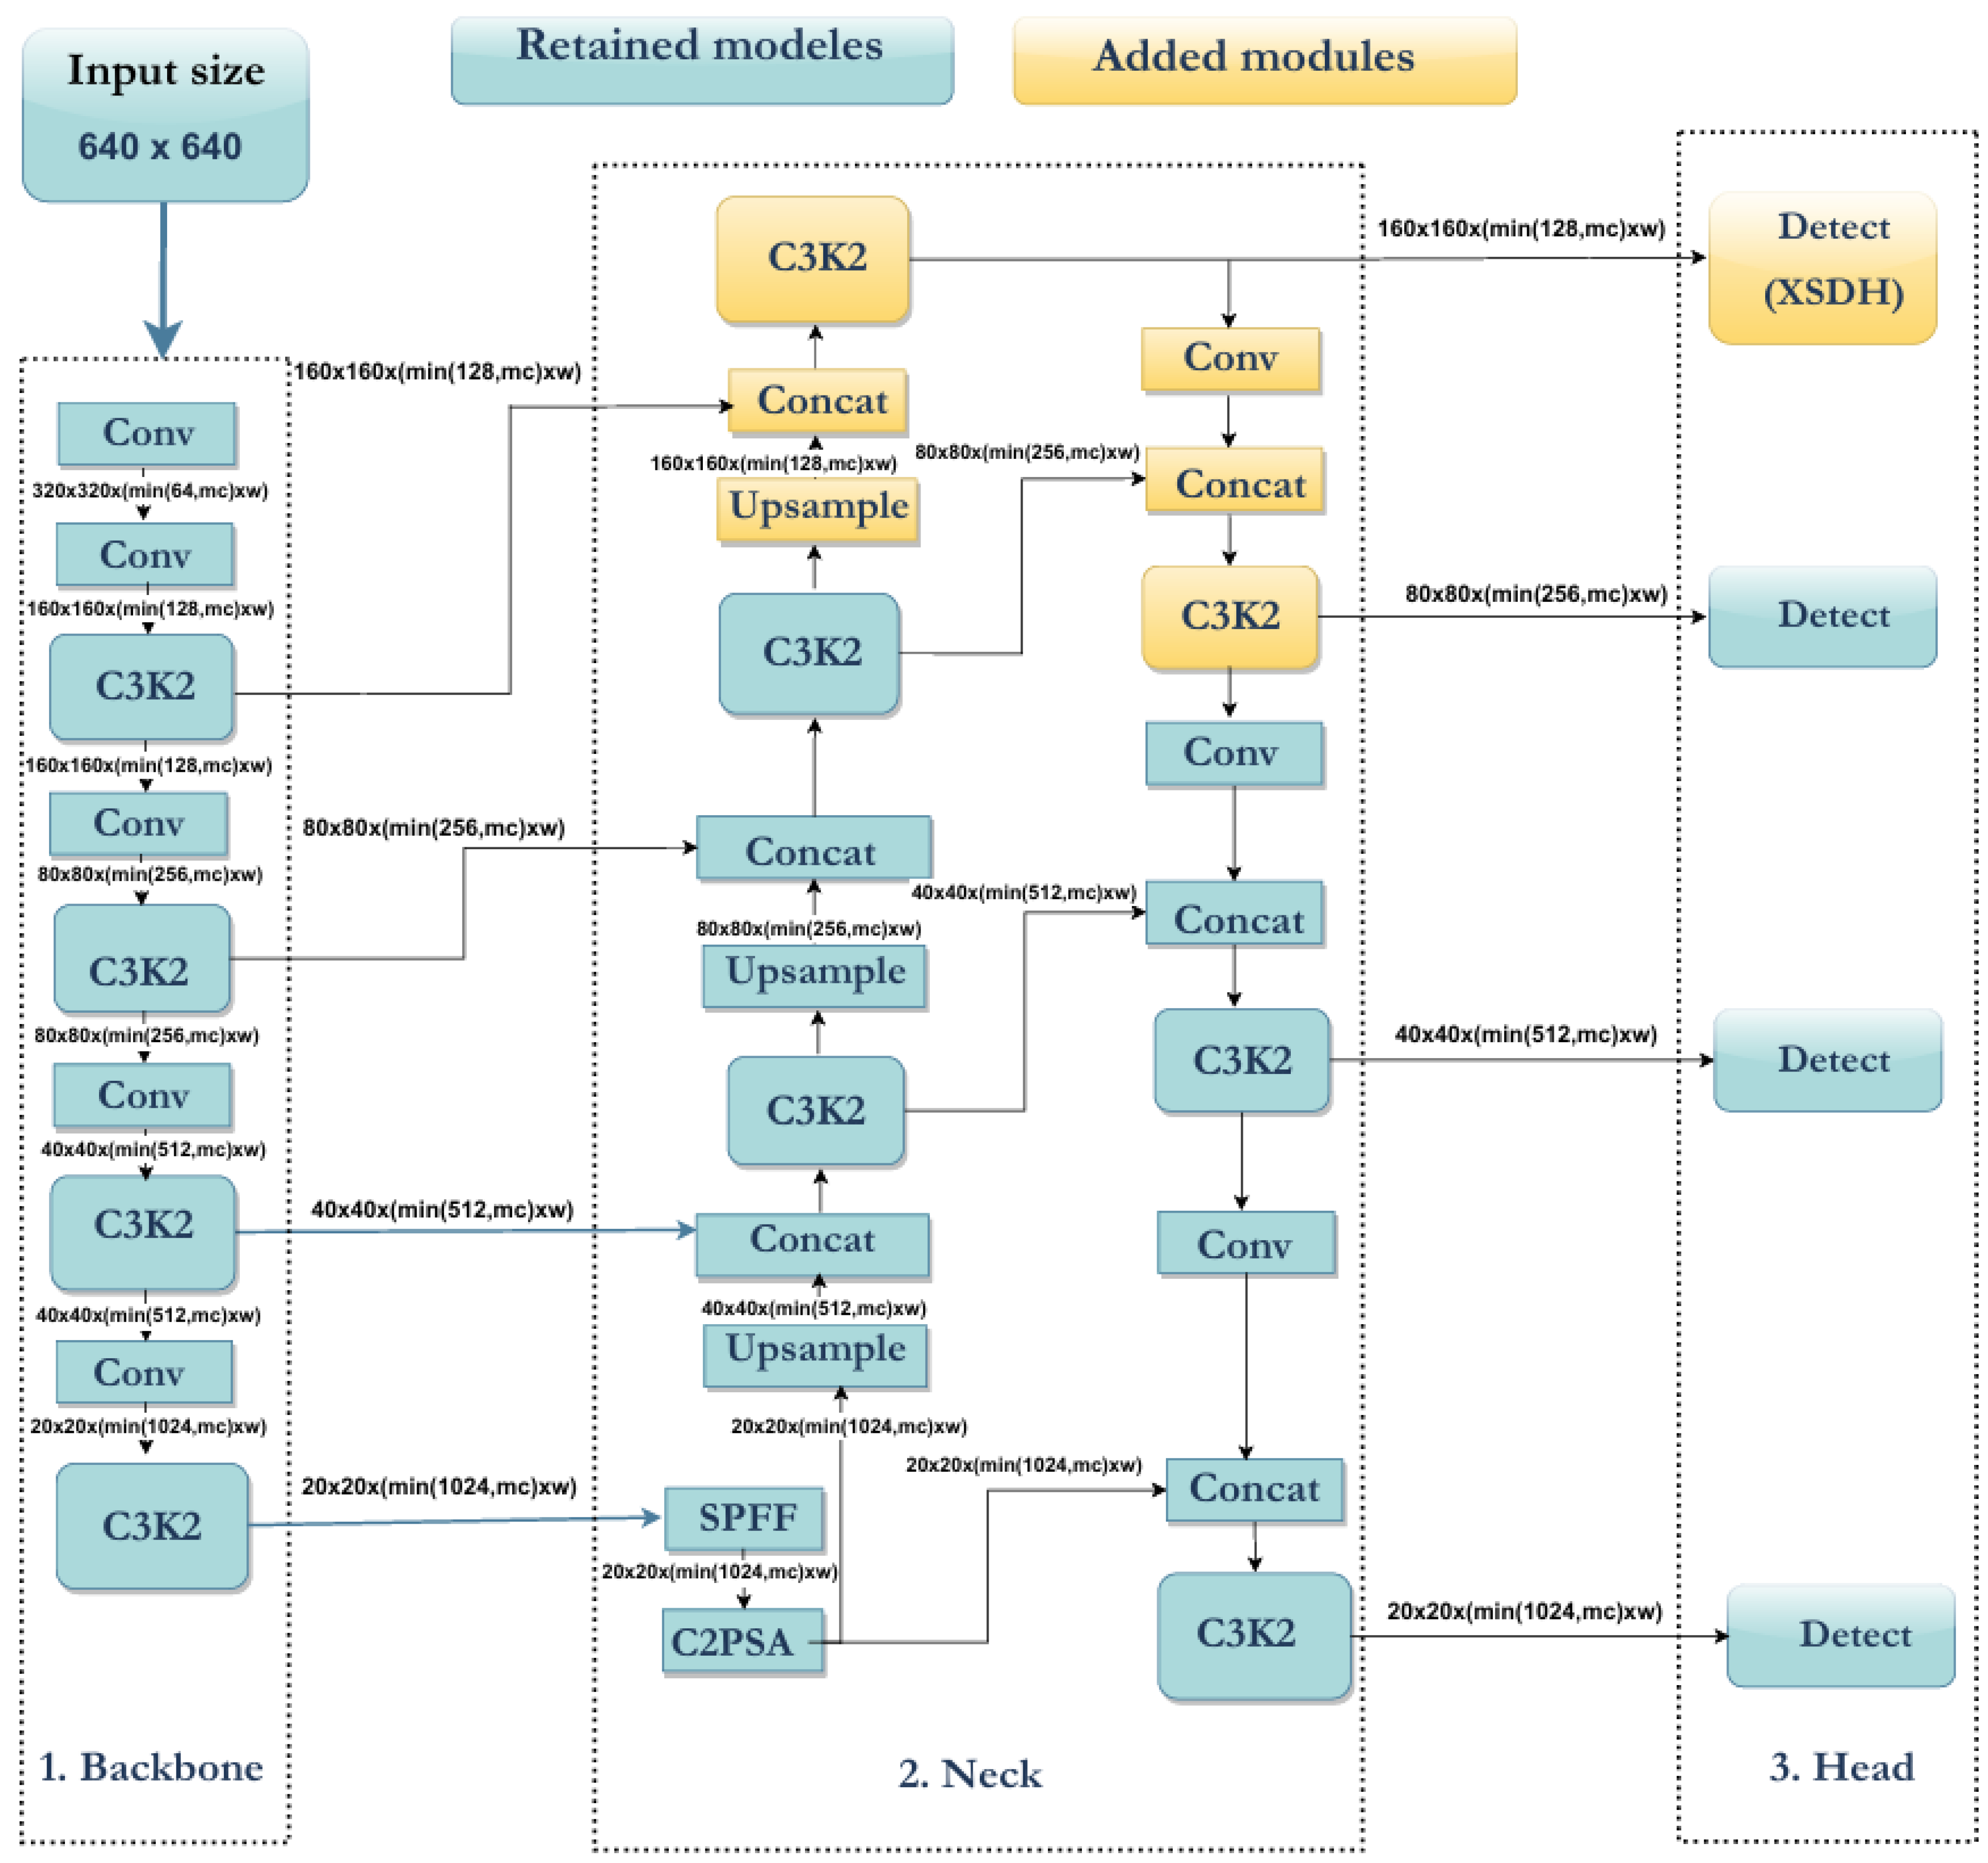
This section presents the DeepFIT architecture as shown in Figure 5, which is based on an improved version of the YOLOv11 small model, to effectively classify barefoot prints on soil substrates. YOLO is an object detection algorithm that processes the entire image in a single pass to detect objects and their locations [44]. The selected version offers a balance between speed and accuracy and is ideal for practical applications such as real-time drone surveillance [45]. The network is primarily composed of three components: backbone, neck, and head. The backbone employs a convolution that starts the network by automatically resizing the input image to 640 × 640, thereby decreasing the system’s computational demands. Furthermore, the backbone extracts features from the raw image data by employing a CNN to generate multiscale feature maps. DeepFIT also uses strided convolutions for downsampling, reducing complexity, and helping mitigate overfitting by promoting more generalizable features. The neck integrates features at various scales and transmits them to the head for prediction.
Four C3K2 (Cross Stage Partial with kernel size 2) modules, a building block used in YOLO for feature extraction, were employed in the DeepFIT model neck to replace the standard modules for upsampling, enhancing the model’s ability to capture multiscale objects [46]. Furthermore, the C3K2 module integrates the C2PSA (Convolutional block with Parallel Spatial Attention) module, located behind the SPPF (Spatial Pyramid Pooling Fast) layer, to further improve feature extraction. The SPPF is used in the backbone or neck of the YOLO architecture to make the network better at recognizing objects of different sizes, without increasing computational power [47]. Finally, the head acts as a prediction mechanism for identifying the left and right barefoot prints that belong to an individual by assimilating features. Therefore, the DeepFIT model generates feature maps of four different dimensions at the head layer: (160 × 160, 80 × 80, 40 × 40, and 20 × 20). These feature maps contain information on the location, classification, and confidence levels. By default, the YOLOv11 architecture has three detection heads that handle BBox regression and object classification [46].

3.5. Extra Small Detection Head (XSDH)

To enhance the identification and classification of barefoot prints on soil substrates, we augmented the default architecture by incorporating an XSDH. This additional head operates on high-resolution feature maps to capture fine-grained details, thereby enabling the differentiation of subtle toe prints from a complex background. Losses from the XSDH are computed independently and integrated with those from other detection heads in a weighted sum, ensure effective optimization. The detection head (XSDH) uses the following weighted loss function:
L XSDH = λ box L box + λ obj L obj + λ cls L cls
where λ box = 0.05 , λ obj = 1.0 , and λ cls = 0.5 are fixed weights as described in [46]. These values ensure stable optimization between:
  • L box : GIoU loss for BBox regression
  • L obj : Binary cross-entropy for objectness prediction
  • L cls : Binary cross-entropy for class prediction

4. Experimental Process

4.1. Dataset

Currently, there is no publicly available dataset for benchmarking, therefore, we developed a custom dataset by collecting clear barefoot prints on soft and sandy soil substrates. There were 40 participants, comprising 20 men and 20 women, all Botswana citizens living in Palapye at the time of the study, who voluntarily participated in the data collection process. The participants were between 16 and 40 years of age and had no known lower limb deformities. The volunteers provided standing-barefoot print impressions on both soft and sandy soil substrates. The distance between the camera stand and the human foot was 2 m.
There were 600 images per person, with 300 images for soft substrate and 300 images for sand substrate. For each substrate type, 150 images were taken of the left footprint and another 150 images of the right footprint. In total, 24,000 images of left and right footprints were collected. Data collection was performed several times to complete the target of 600 images per person and to accommodate different environmental conditions, especially lighting and the substrate type.
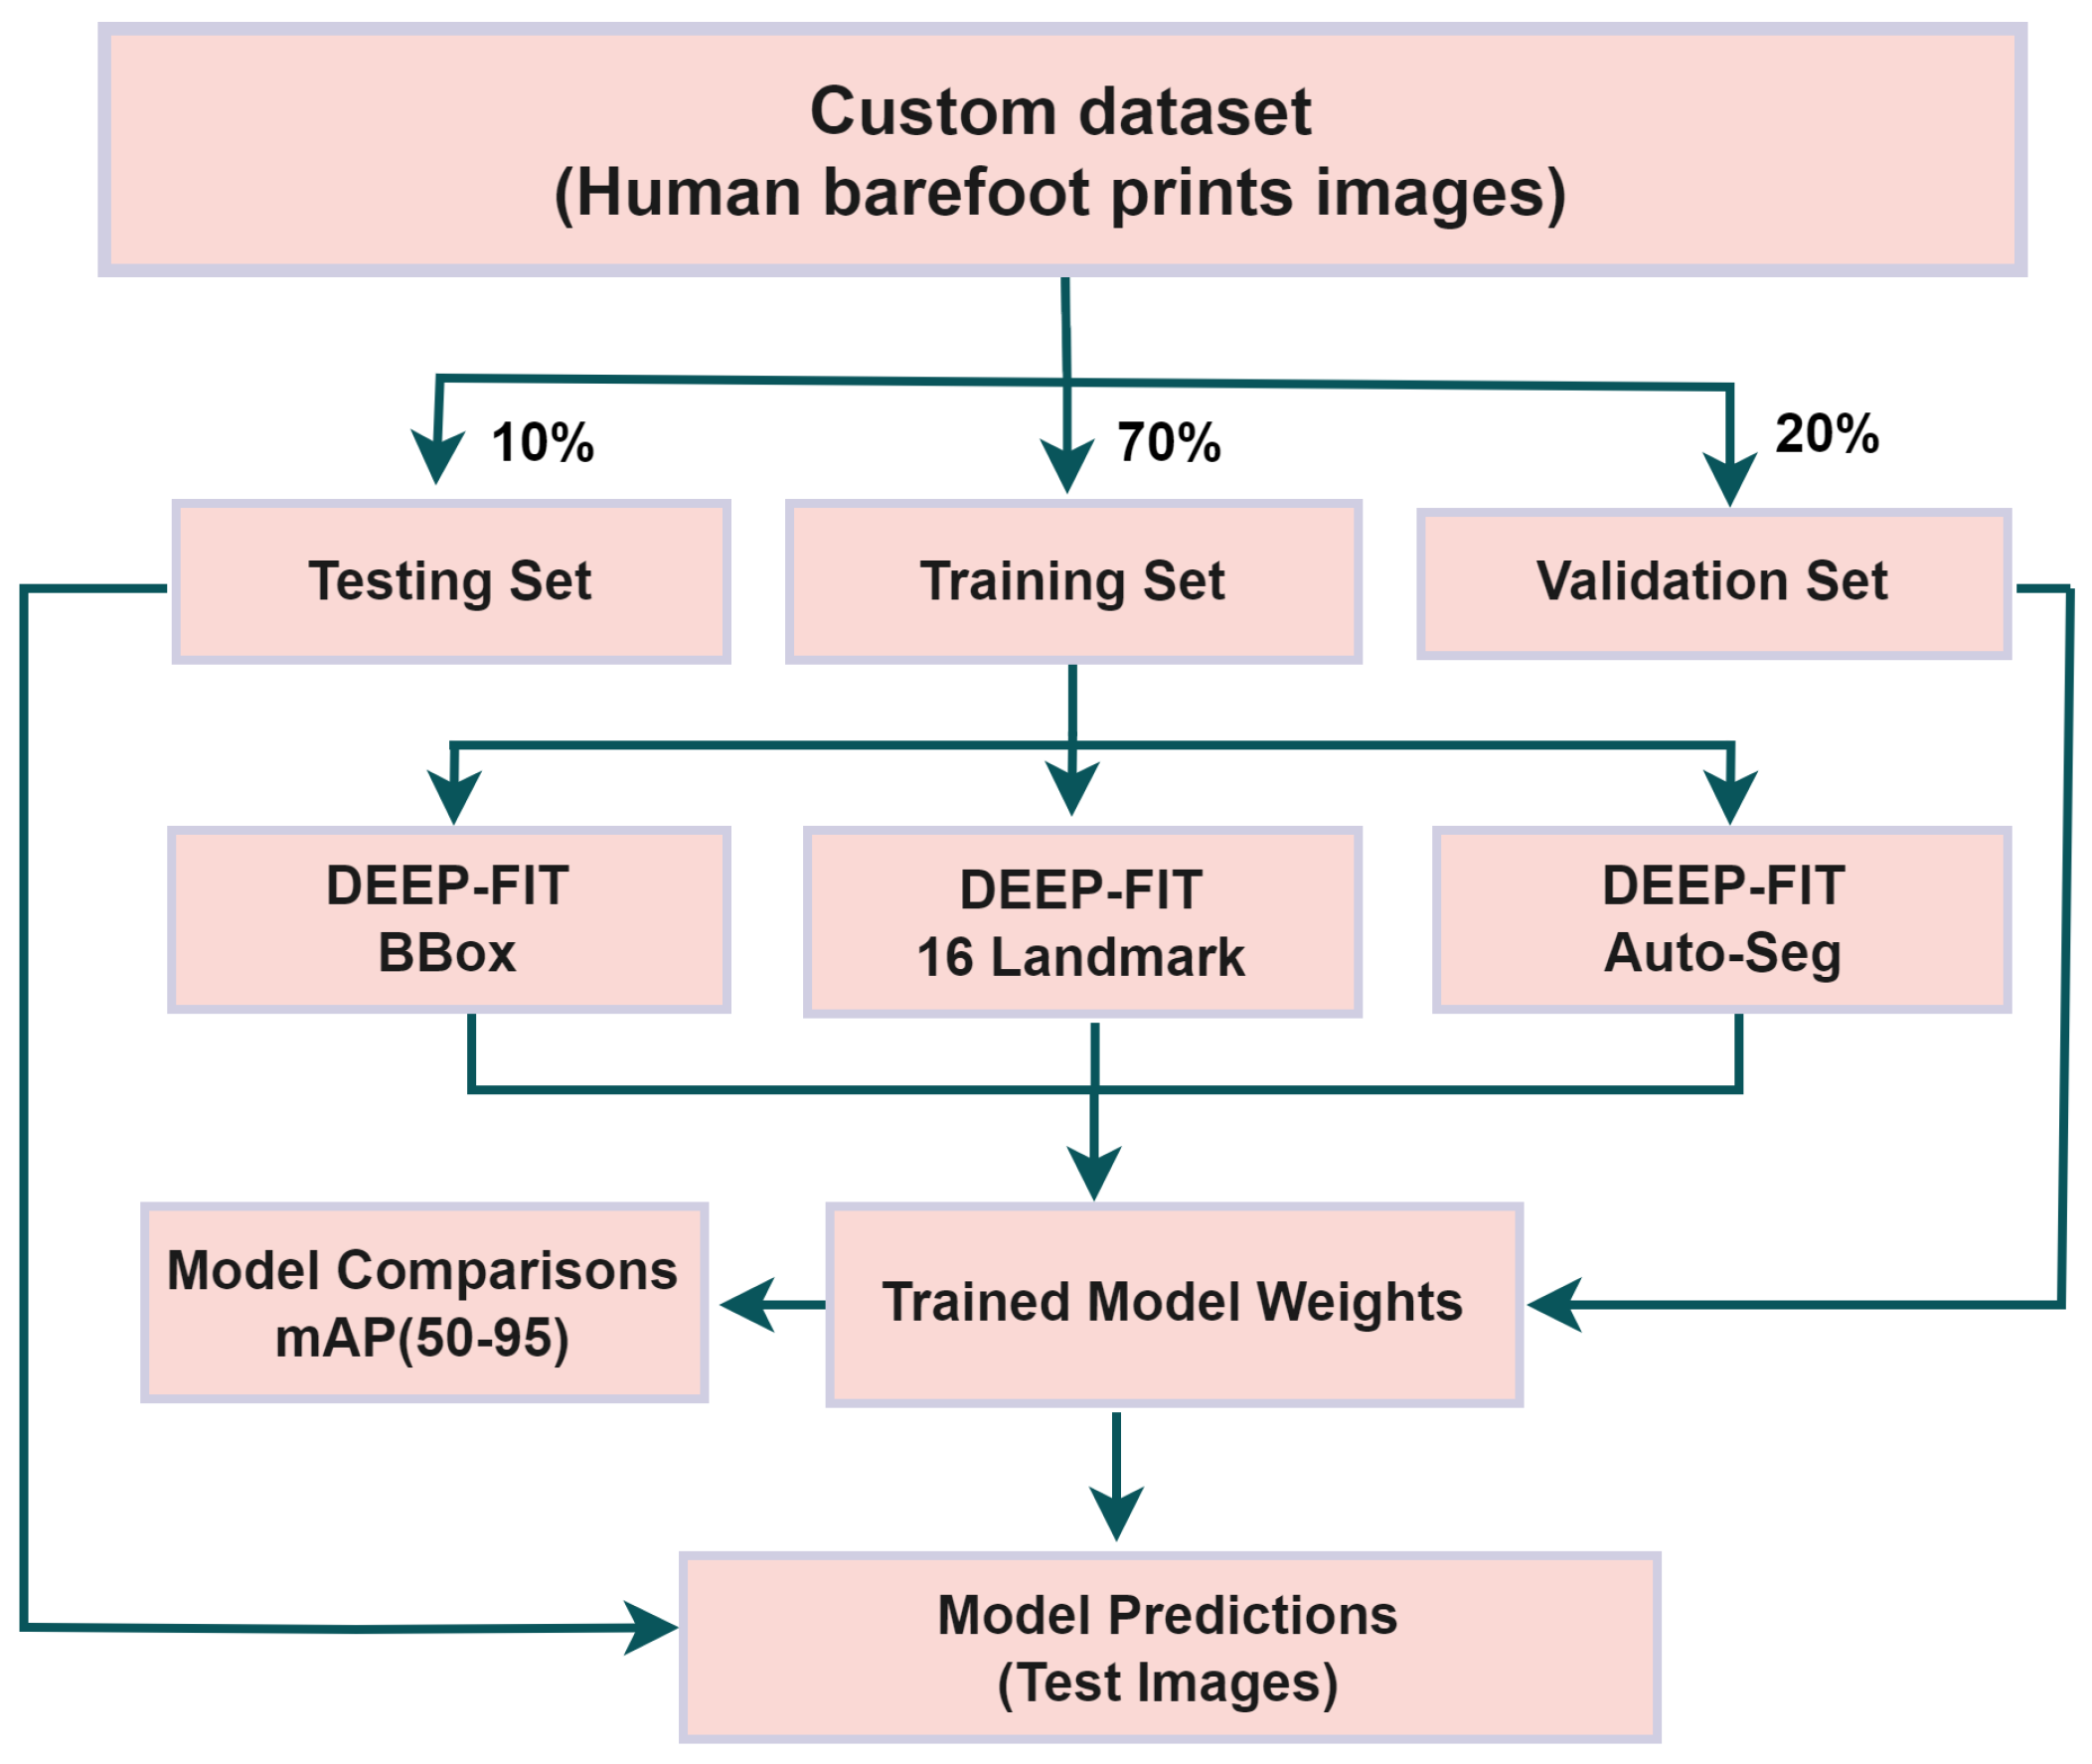
We employed a 70/20/10 split with subject-level stratification to ensure all prints from the same individual were confined to a single set, preventing data leakage and overfitting. Figure 6 shows the splits in the data set. The DeepFIT model was evaluated on an independent test set of barefoot prints to assess the proposed techniques rigorously.

4.2. Hyperparameters and Training Environment

The experiments were conducted on a Windows system equipped with an NVIDIA RTX 2080 Ti GPU, utilizing the PyTorch framework to process the collected barefoot dataset. The training of the DeepFIT models incorporated several essential hyperparameters to optimize both the computational efficiency and model performance. To prevent overfitting, a weight decay of 0.0005 is applied. An initial learning rate of 0.001 was chosen to address dataset complexity, mitigate training instability, and achieve optimal convergence [48,49]. The model was then trained for 240 epochs to ensure effective convergence. Table 3, provides an overview of the primary hyperparameters used during the training process.

4.3. Performance Matrics

The performance of the DeepFIT models was evaluated using standard object detection evaluation metrics, including the precision (P), recall (R), mean average precision (mAP), and F1 score. We chose mAP50-95, computed over an IoU threshold range of 0.5 to 0.95, because it offers a more rigorous evaluation of both localization and accuracy. Equations (7)–(11) illustrate how these are calculated.
IoU = Area   of   Overlap Area   of   Union
Precision = True   Positives True   Positives + False   Positives
Recall = True   Positives True   Positives + False   Negatives
mAP = 1 | IoU   thresholds | IoU   thresholds Average   Precision   ( AP )
F 1   Score = 2 × Precision × Recall Precision + Recall

5. Experimental Analysis

5.1. Model Training Analysis

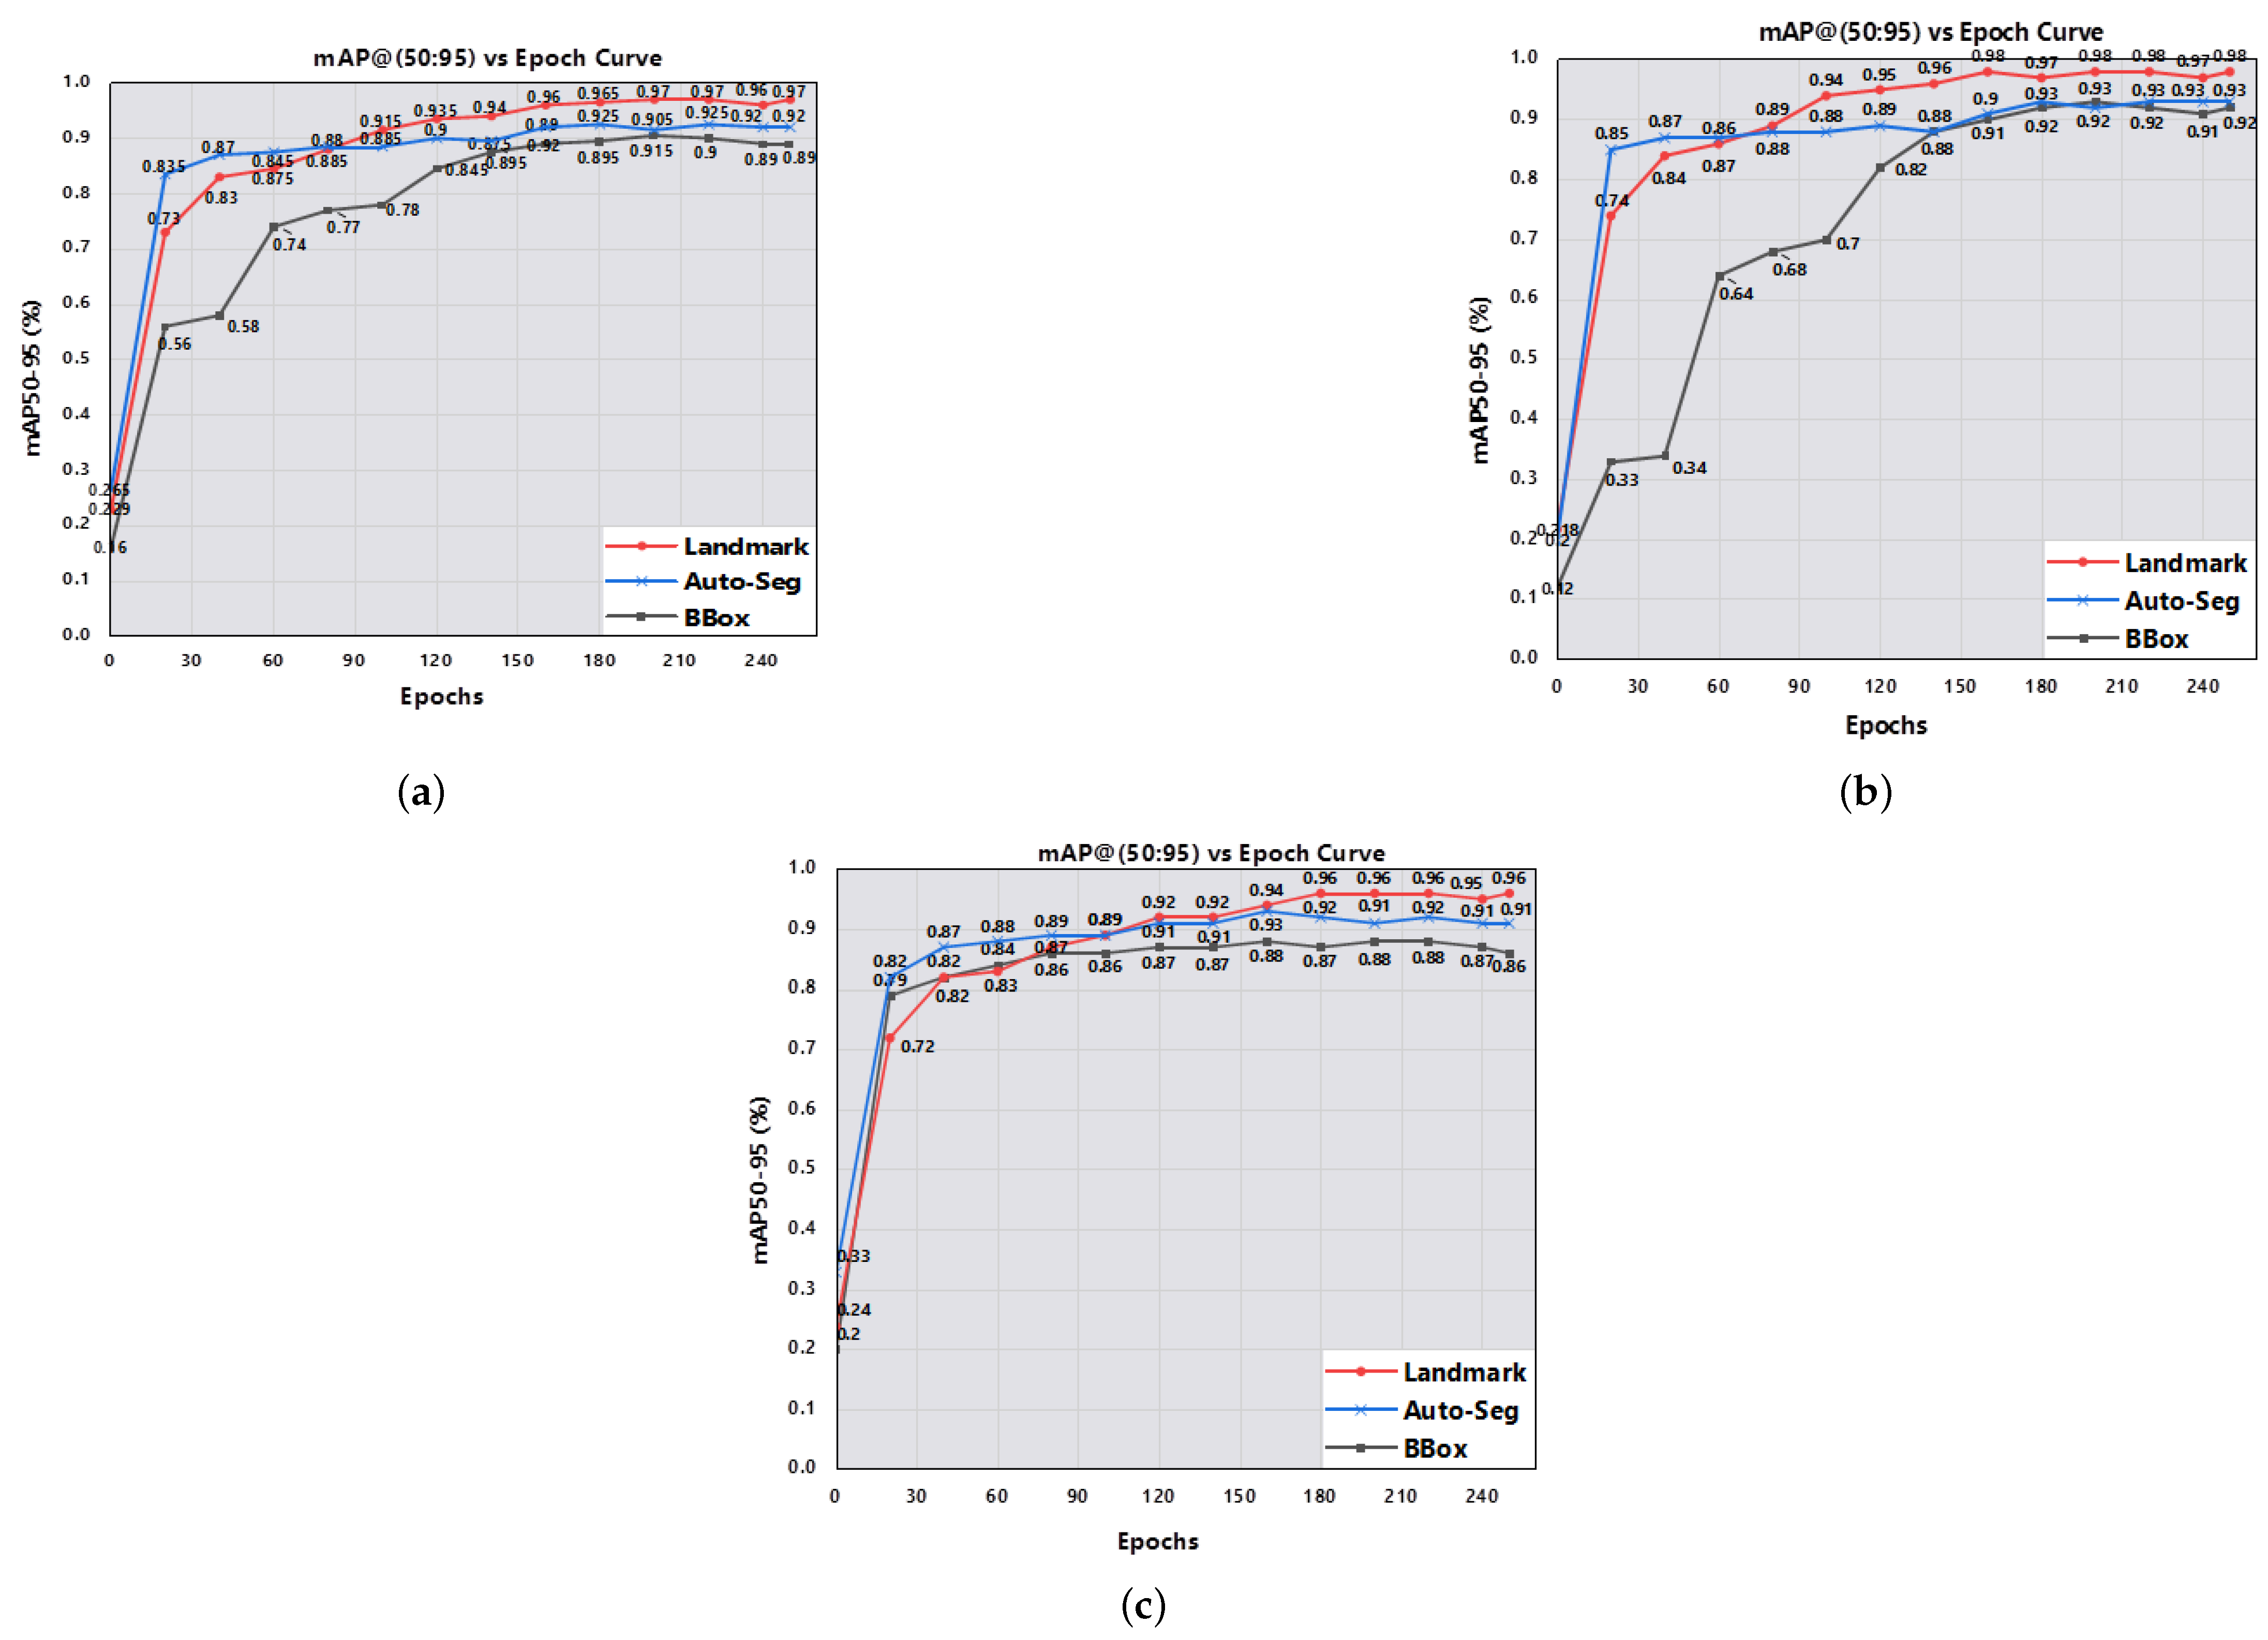
The training process was evaluated by recording the mAP50–95 curve. Figure 7 shows the mAP50–95 training curves for the DeepFIT models, with the horizontal axis indicating the number of training epochs. In all training scenarios, the mAP of the DeepFIT landmark model remained consistently higher after 150 epochs, indicating effective performance across all substrate types. This demonstrates superior generalization capabilities and greater learning stability compared with other approaches. The training and validation curves stabilized around 240 epochs, which was sufficient for fine-tuning the model on the barefoot print dataset comprising 40 subjects.
To enhance the model’s generalization capability and robustness, augmented variants of the training images were generated using the Roboflow interface [50]. These techniques involved synthetically expanding the training dataset by applying stochastic transformations to the input images, such as geometric rotations, horizontal flips, and image adjustments in brightness [51,52]. Exposure to this diverse set of augmented samples reduces the risk of overfitting to the original data distribution and promotes improved generalization performance on previously unseen inputs, enabling the model to more accurately recognize objects under real-world conditions, such as varying soil substrates.

5.2. Ablation Experimental Results

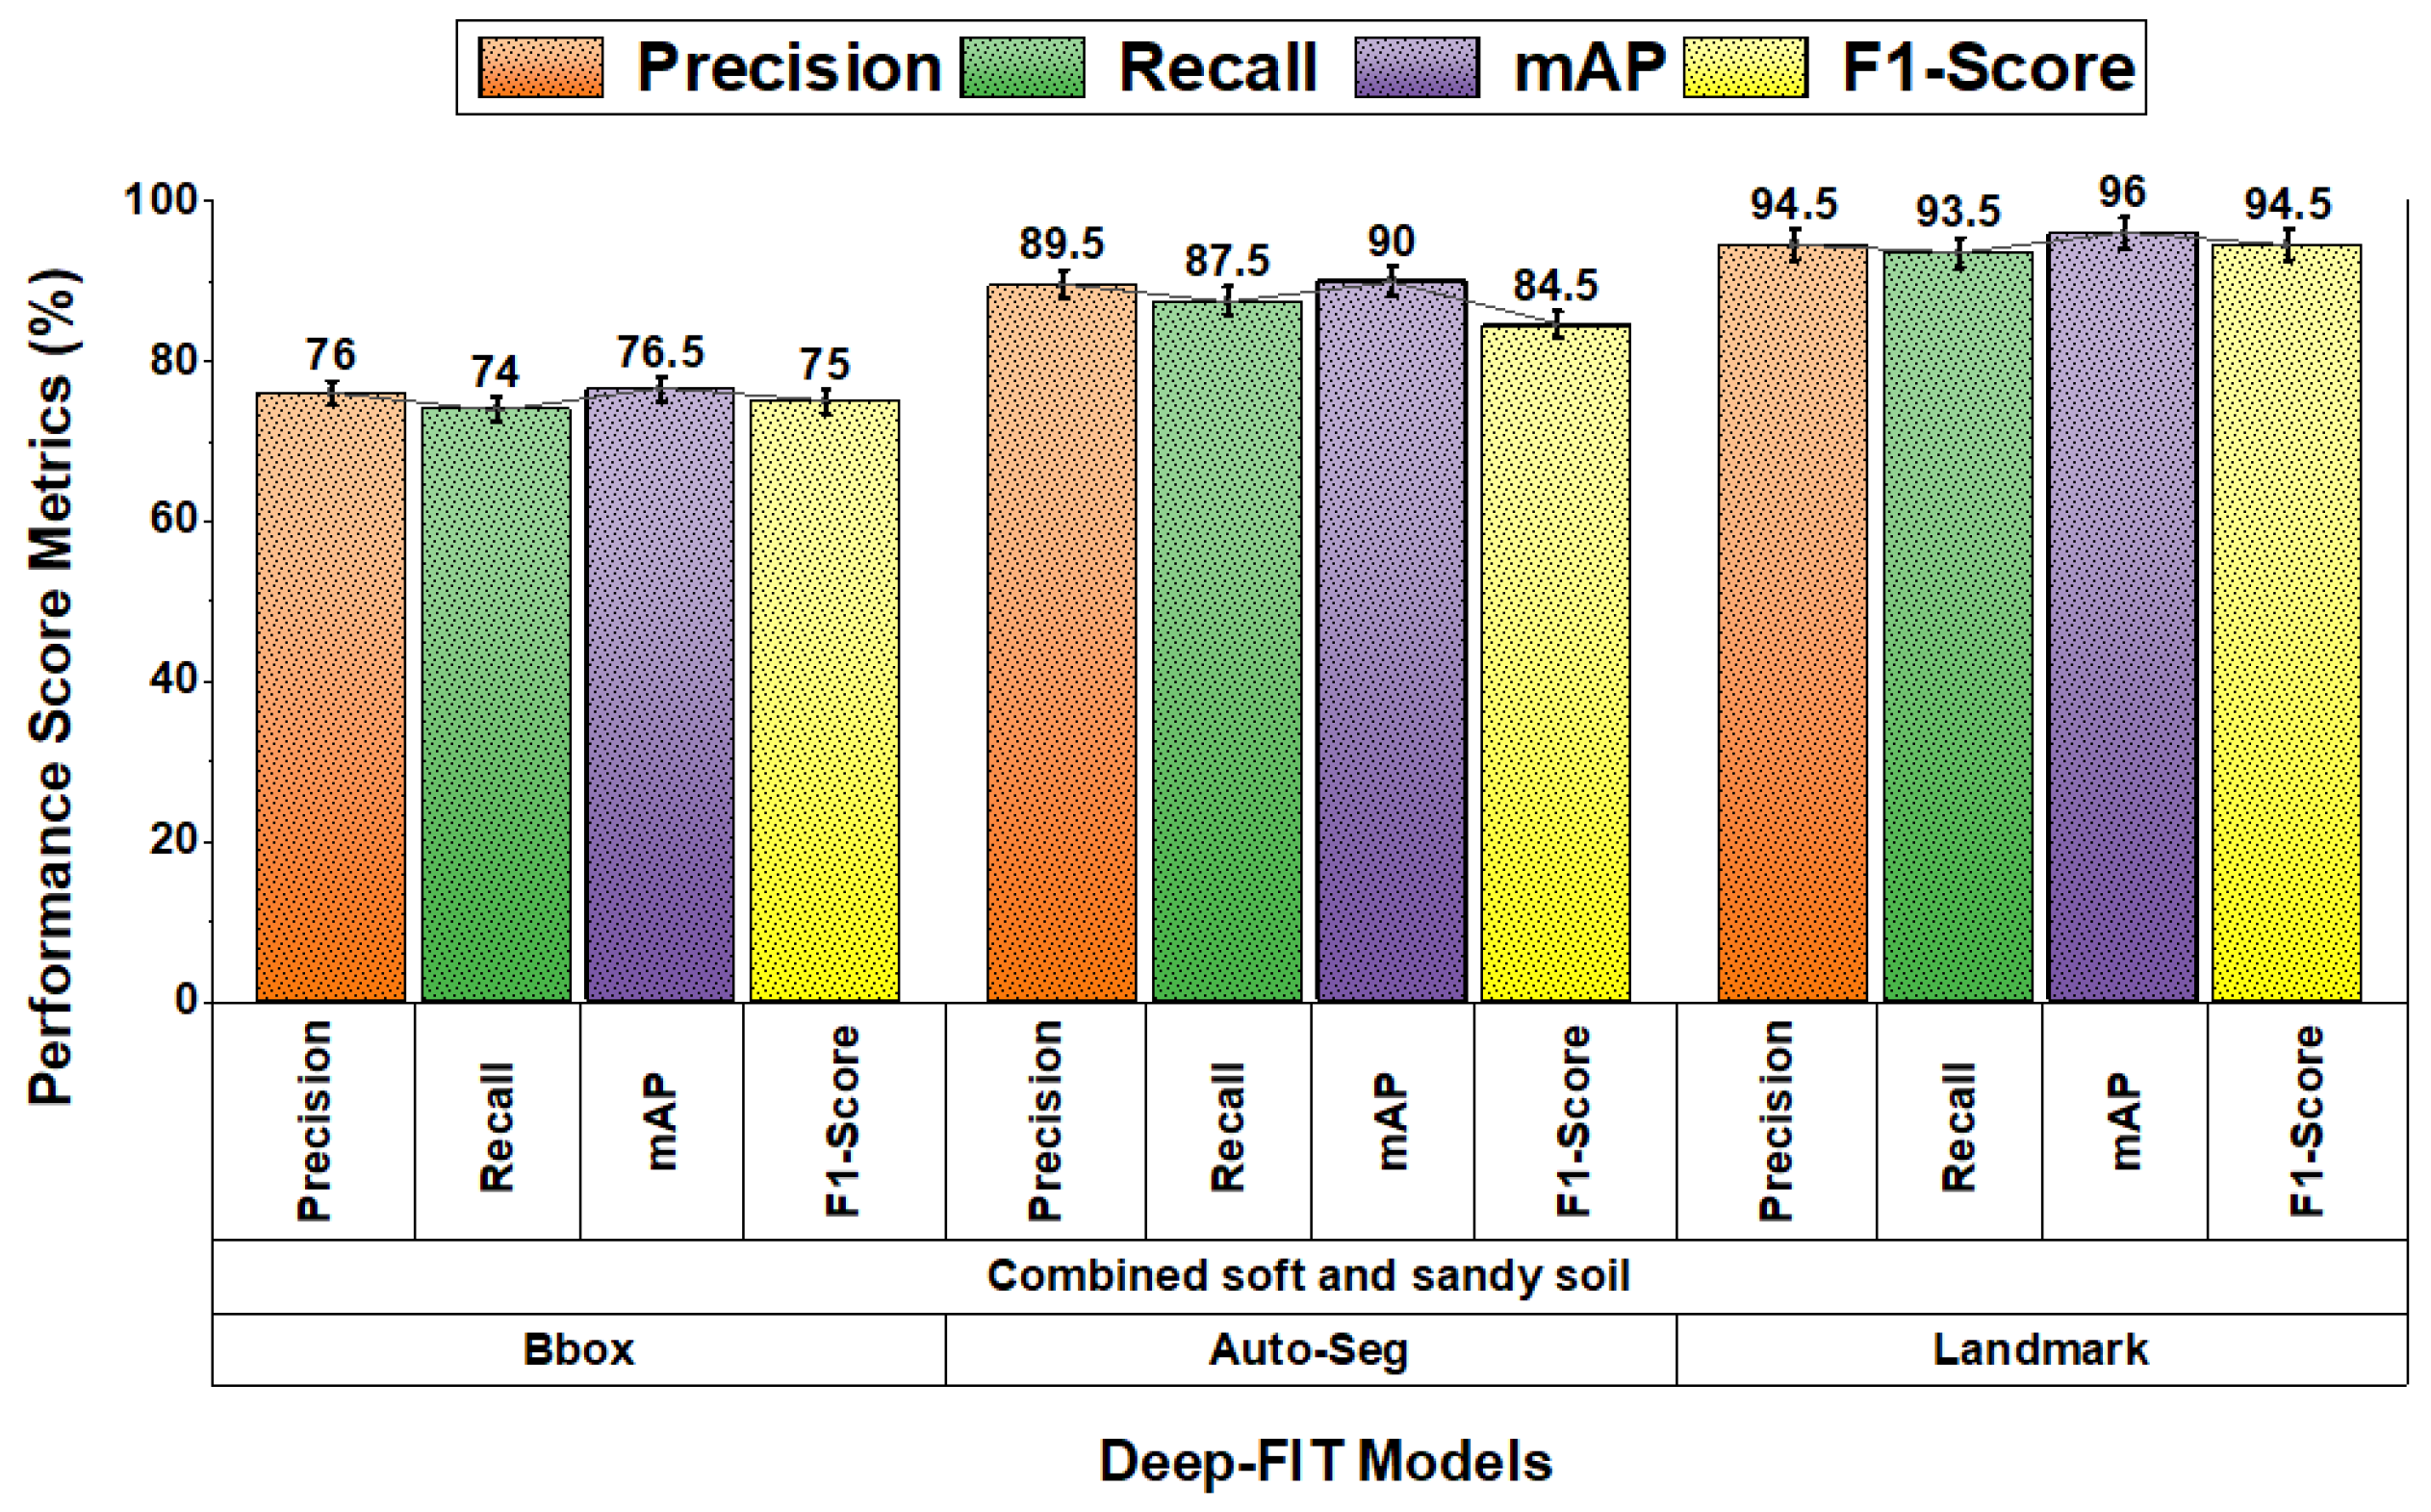
This section presents the ablation experiments to evaluate the impact of each added module on the baseline model. Starting with the default YOLOv11s architecture, we integrated an XSDH for enhanced small-scale feature detection, a segmentation head for capturing the footprint outline, and a set of 16 morphometric landmarks for detailed anatomical representation. Figure 8 shows the overall performance of the DeepFIT models on combined soft and sandy soil substrates with all the modules included. It is evident that the landmark model achieved the highest accuracy of 96%, demonstrating improved generalization and enhanced capability to operate under various real-world conditions.
Table 4, summarizes the quantitative improvements achieved for each module enhancement. The results indicate that integrating the XSDH module into the baseline model led to a minimal improvement of less than 1%, suggesting that BBox alone is inadequate for attaining high accuracy for the reliable classification of a set of barefoot print belonging to an individual on the soil substrate. Therefore, introducing the auto-segmentation head improved the accuracy of the BBox model by 11%, and the subsequent addition of the XSDH module led to a further 2% increase, resulting in an overall accuracy of 90%. This suggests that the combination of segmentation and XSDH enhances the model’s ability to capture subtle footprint features, thereby improving classification accuracy. Moreover, the addition of the landmark head led to a substantial improvement of 12.7%, and the subsequent integration of the XSDH module further enhanced the accuracy by 7%, resulting in an overall classification accuracy of 96%. This show that the combination of morphometric landmarks with XSDH is highly effective for distinguishing between individual barefoot prints.
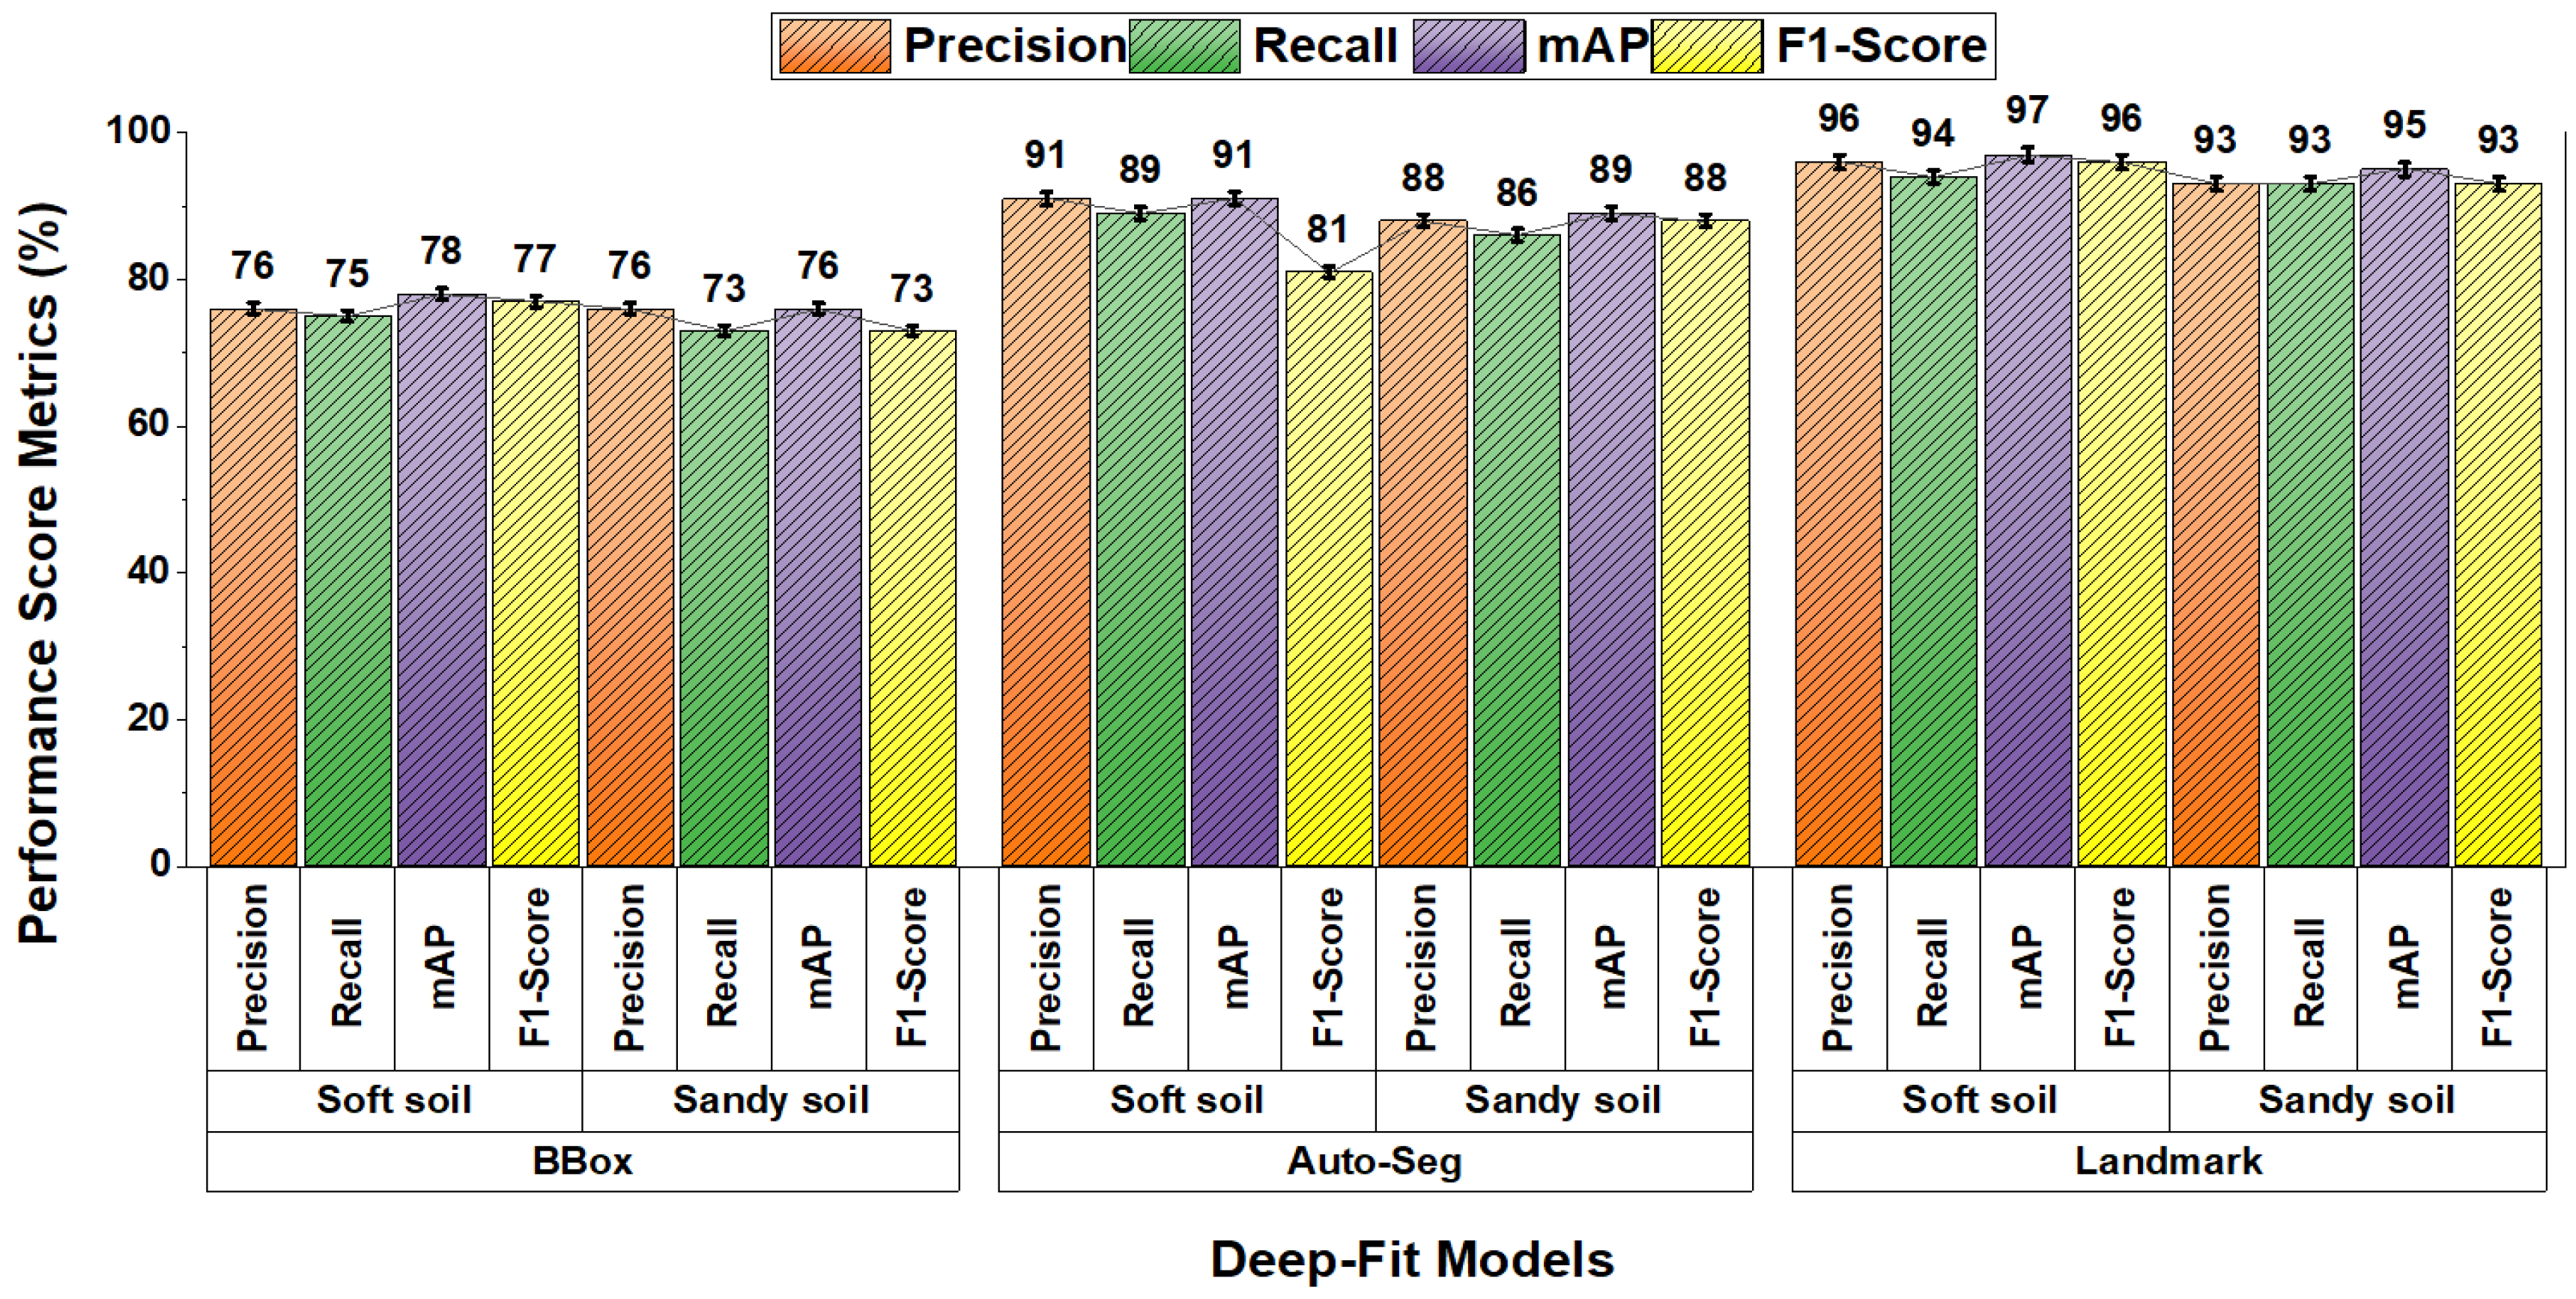
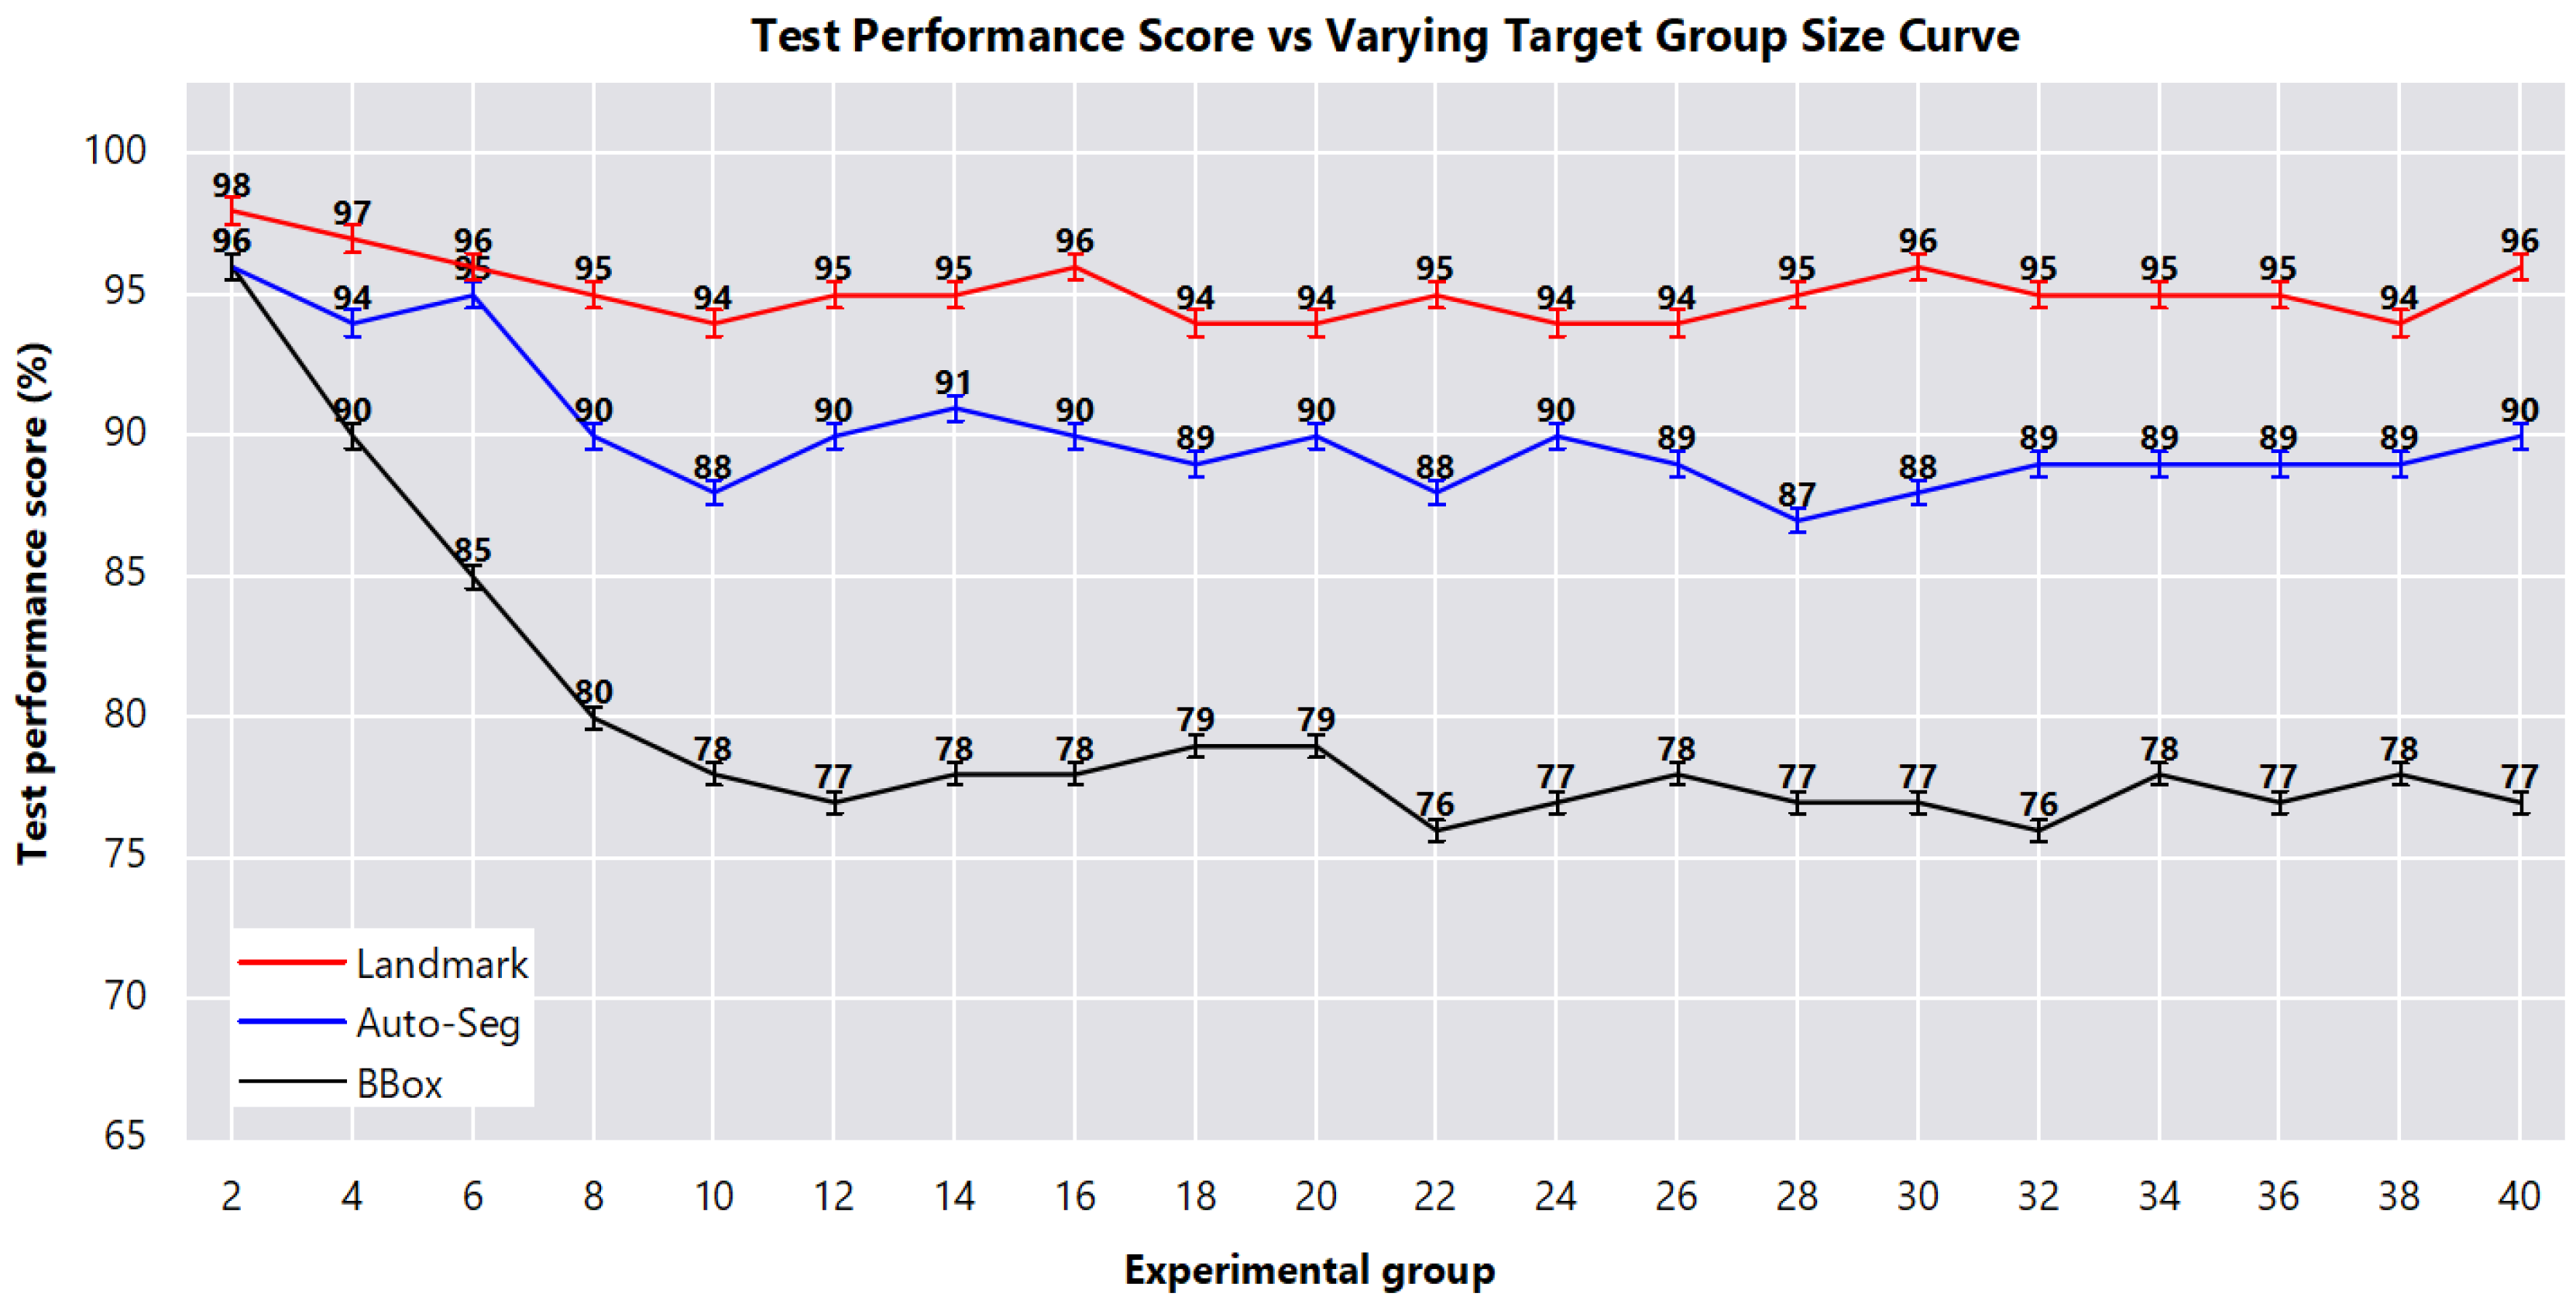
Table 5, presents the quantitative performance metrics (Precision, Recall, mAP, and F1-score) of the three DeepFIT methods on both soil types. To provide a clearer visual interpretation of these results, Figure 9 illustrates the same metrics graphically, highlighting the relative differences between the methods and the types of soils. In soft soil, the landmark model achieved the highest mAP at 97%, followed by the segmentation model at 91%, and BBox model at 78%. On sandy soil substrates, the performance dropped across all models, with landmarks attaining 95%, segmentation at 89%, and BBox at 76%. These results demonstrate that the proposed enhancements effectively address the limitations of the baseline model, leading to a significantly improved performance across both soft and sandy soil substrates. Figure 10 illustrates the performance of the DeepFIT for various group sizes. The results indicated that the BBox method experienced a decline in accuracy when the number of individuals exceeded eight, whereas the landmark and segmentation methods maintained consistently high accuracies. This suggests that the landmark method, in particular, demonstrates robustness to increasing the group size.

5.3. Statistical Analysis

To statistically validate the observed performance differences between the proposed DeepFIT methods, a paired sample t-test was performed on the mean average precision (mAP) results obtained from the test set. This analysis aimed to determine whether the observed improvements among the BBox, Auto-Seg, and Landmark methods were statistically significant, thus confirming the reliability of the comparative performance trends.
The p value < 0.05 was considered statistically significant. The results are presented in Table 6. A paired-sample t-test was conducted to compare the mean AP performance between the three methods. Results showed that the AutoSeg method ( M = 90.1 , S D = 2.29 ) performed significantly better than the BBox method ( M = 76.8 , S D = 5.41 ), t ( 19 ) = 16.94 , p < 0.001 . The Landmark method ( M = 96.3 , S D = 1.49 ) achieved significantly higher APs than both the AutoSeg method [ t ( 19 ) = 9.18 , p < 0.001 ] and the BBox method [ t ( 19 ) = 14.04 , p < 0.001 ], indicating superior performance.

5.4. Sample Visualization of Experimental Results for Two Target Groups

In this subsection, we present the qualitative results and performance analysis for the small target group and the large target group.

5.4.1. Performance Analysis on Small Target Groups (2–10 Individuals)

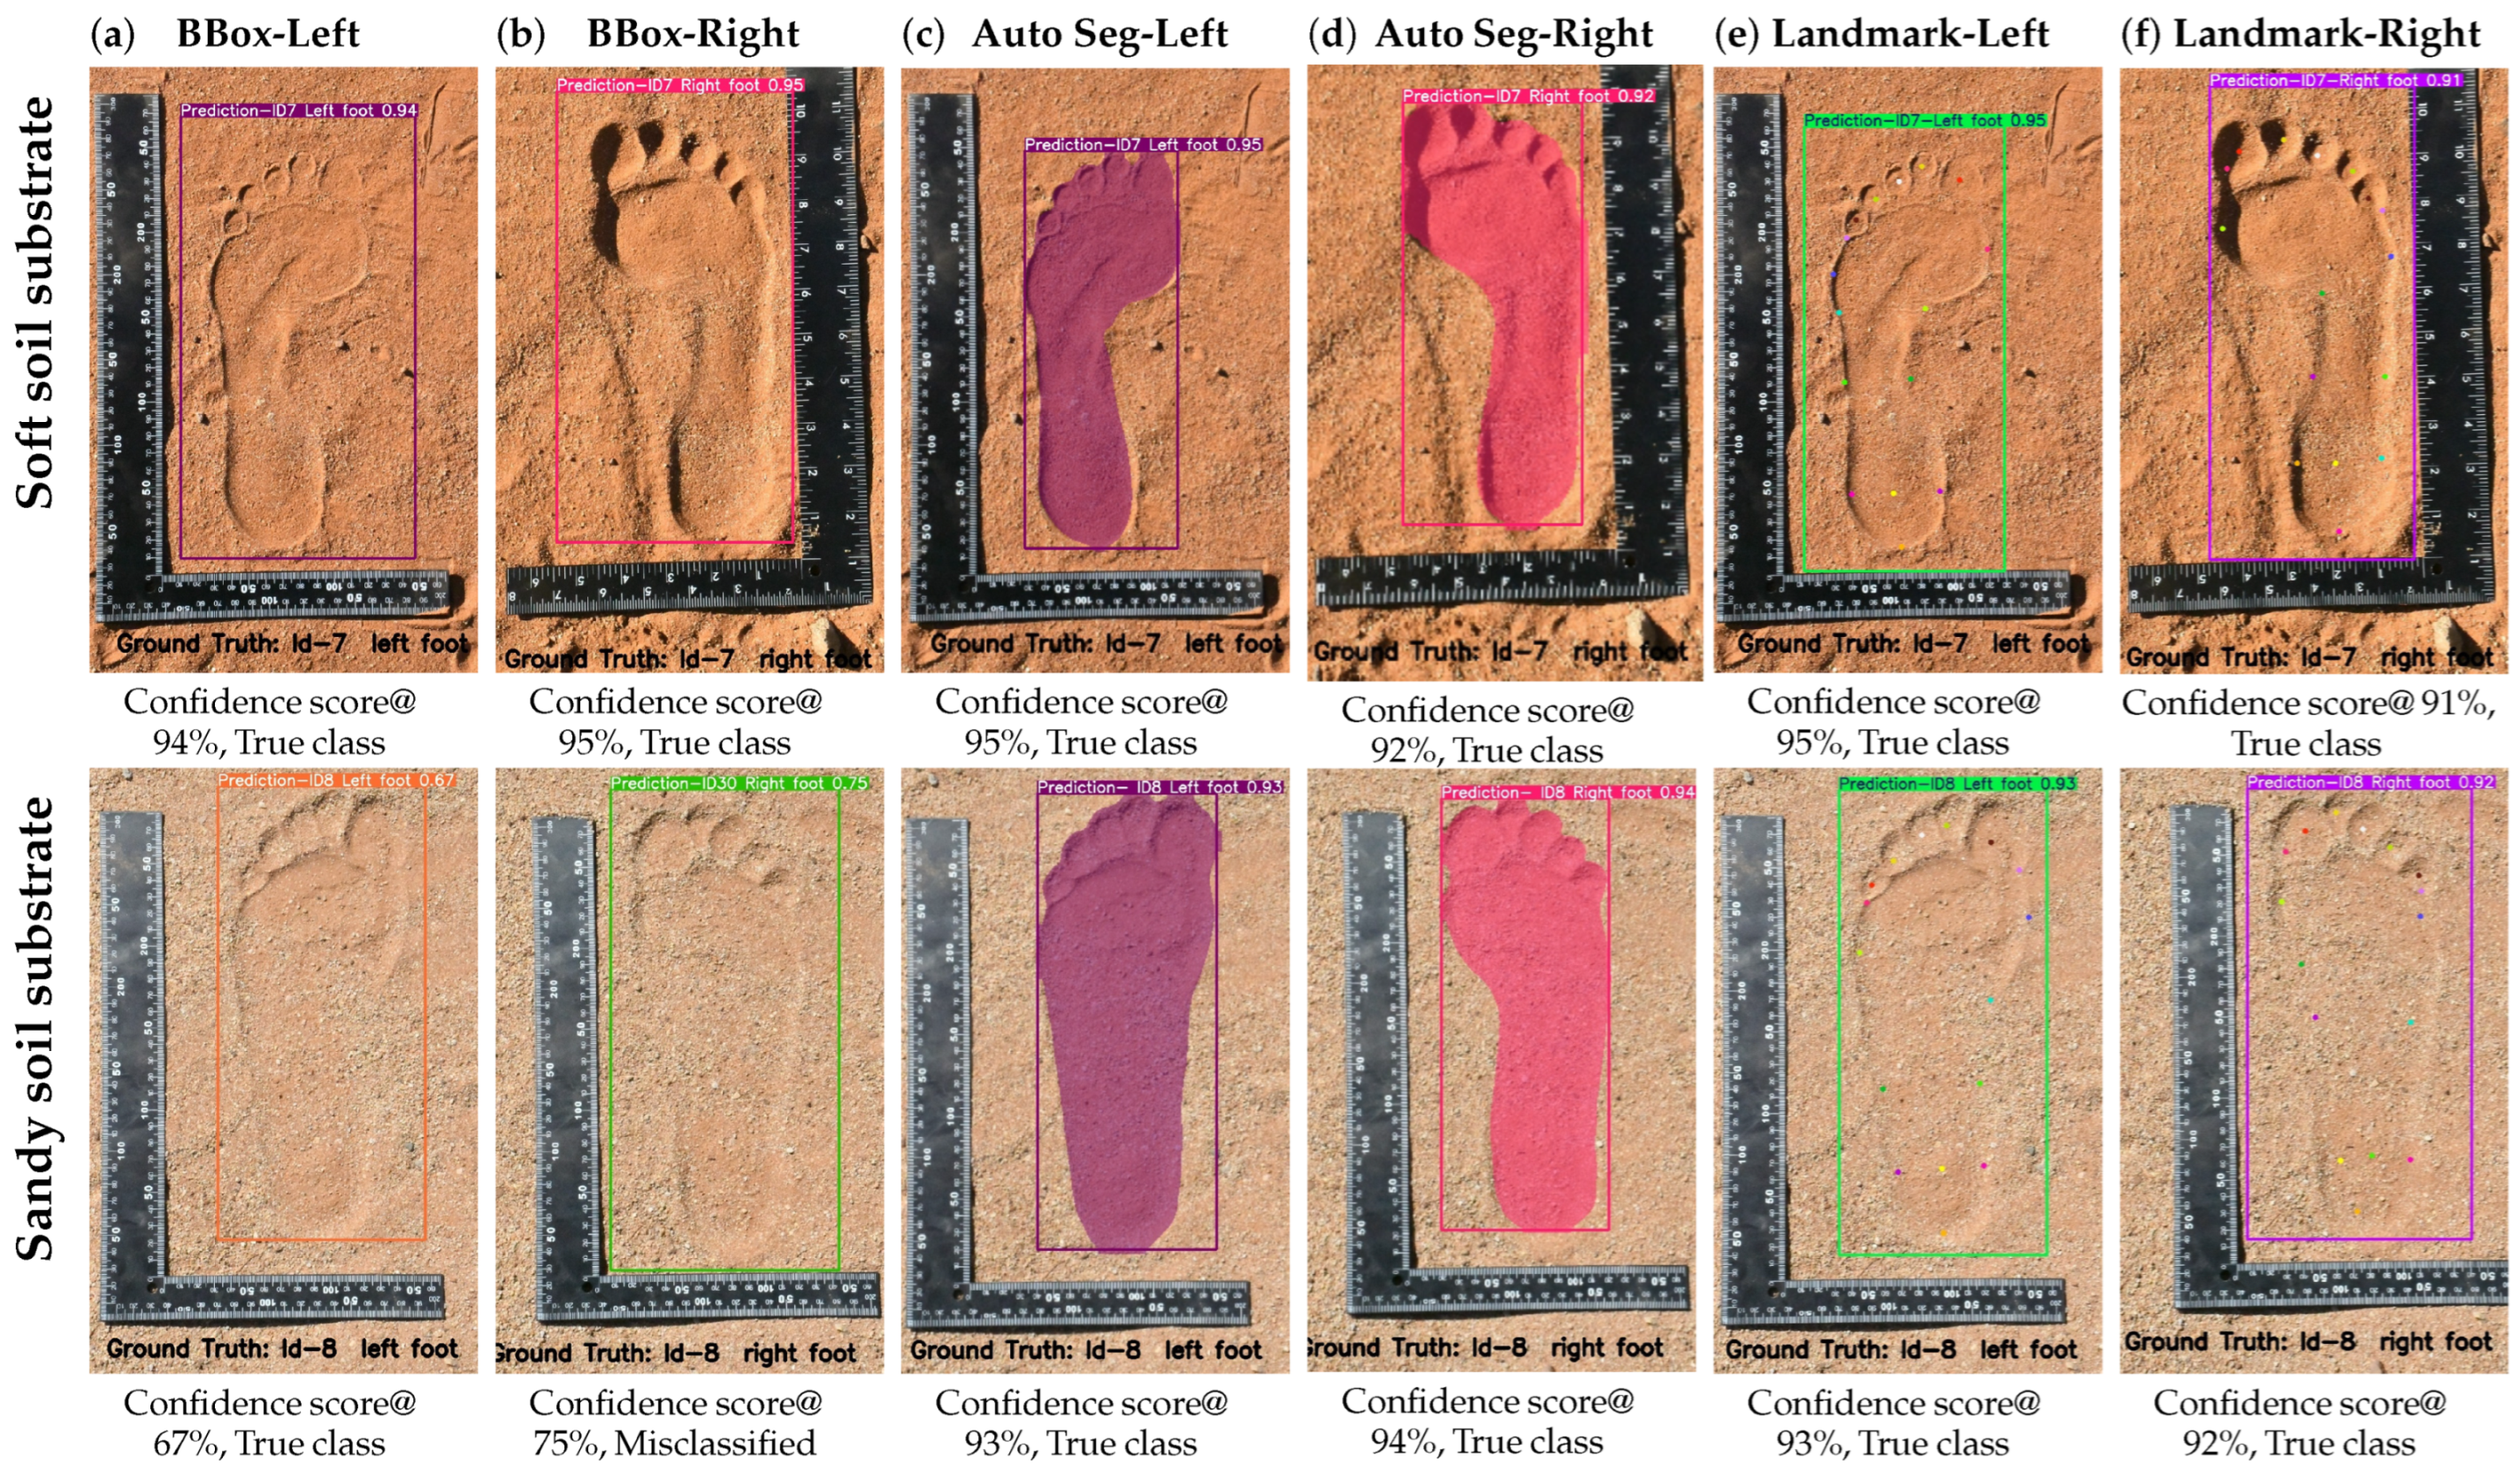
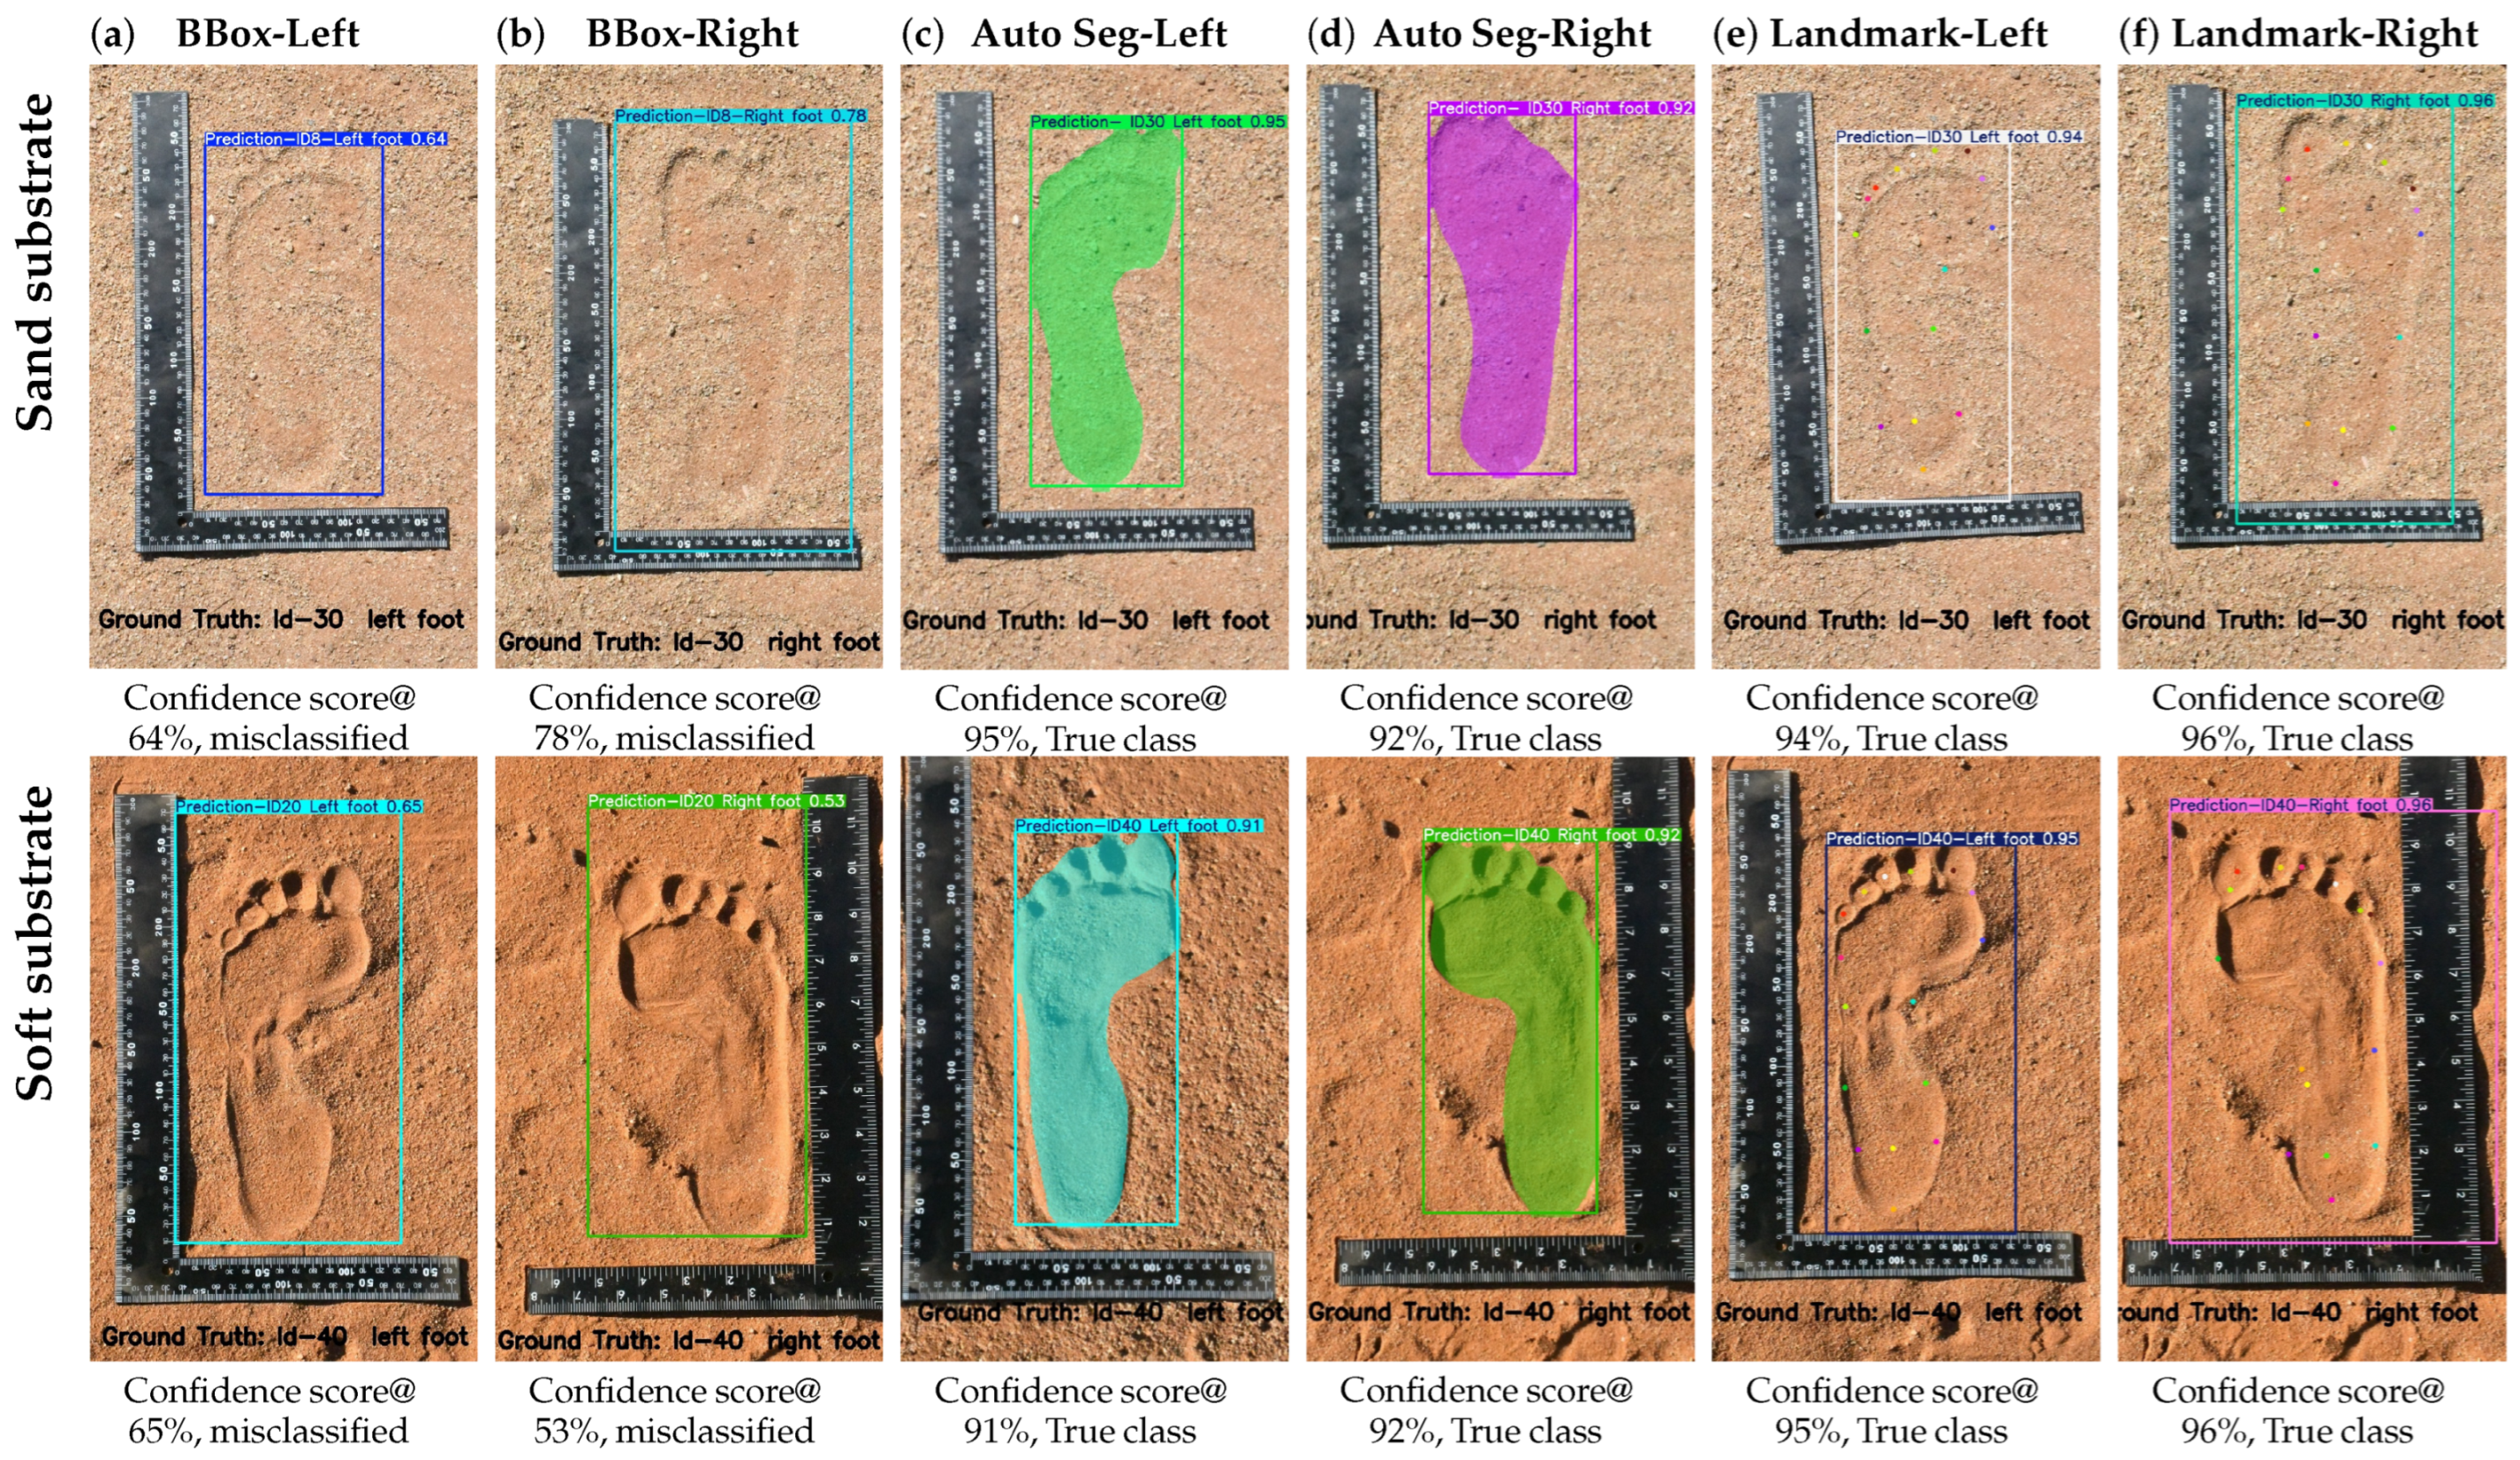
To better illustrate the capabilities of the DeepFIT models in identifying barefoot prints on soil substrates, we analyzed and highlighted the specific scenarios where the BBox baseline model started to decline in accuracy and misclassified individual barefoot prints. The results are presented in Figure 11, for the small groups and Figure 12 for the larger groups. Columns (a) and (b) depict the BBox predictions, columns (c) and (d) illustrate the auto-seg predictions, and columns (e) and (f) display the landmark predictions for the left and right footprints respectively. In the first scenario depicted in Figure 11, for the small target group, all models demonstrated excellent performance, indicating reliable and correct predictions across a small data set. This is because, with a smaller dataset, the variability in footprint shapes is relatively low. Consequently, the model could capture the distinguishing characteristics of barefoot prints and learn consistent features. However, BBox began to exhibit some misclassification when there were up to eight (8) individuals in the dataset, especially on the sandy soil substrate. In contrast, auto-seg and landmark maintain a strong performance across a larger dataset. This indicates that as the number of subjects increases beyond 8, the performance of the BBox method deteriorated completely. This observed performance degradation underscores the limitations of the BBox method as the subject group size increases. This also indicates that the BBox’s reliance on a simple rectangular box for localization becomes less effective as the data increases.

5.4.2. Performance Analysis on Large Target Groups (11–40 Individuals)

The Auto-Seg and landmark methods achieved high confidence scores exceeding 92%, and consistently maintained accurate prediction classes, even when tested on large datasets of 30–40 individuals. In contrast, the BBox method suffers from a significant drop in accuracy, dropping to as low as 53% as shown in Figure 12. This is because as the number of individuals increases, the variability in the shape, size, and orientation of the footprint also increases. The BBox model, which relies primarily on a rectangular box to define the enclosed footprint, may struggle to account for these variations, leading to misclassifications. Thus it may not capture finer details, such as toe positioning or print contours. Therefore, as the size of the group increases and footprints overlap more frequently, this lack of precision hampers its ability to accurately distinguish between individuals. Landmark and auto-seg models perform well because they capture detailed, localized features, making them more robust and precise in handling diverse and complex datasets.

6. Discussion

This study explored the potential of deep learning techniques to accurately classify, and match left and right barefoot prints belonging to the same individual, with a particular focus on soft and sandy soil substrates. The DeepFIT framework was evaluated using three approaches, namely BBox, auto-segmentation, and landmark method designed to examine the influence of morphometric features and soil conditions on classification performance. The inclusion of landmarks and auto-segmentation, inspired by earlier manual techniques such as the optical center method [24] and the overlay method [25], improved accuracy and consistency compared to the BBox baseline method. Enhancements to the DeepFIT architecture, notably the introduction of XSDH, further improved the capture of fine morphometric details critical for distinguishing between individuals on soil substrates.
Our results demonstrate that the DeepFIT landmark approach is highly effective for classifying barefoot prints on both soft and sandy soil substrates, achieving an impressive accuracy of 96%, followed by the auto-seg method with an accuracy of 90% and the BBox at 77%. Discussion of the methods applied in this study and the impact of the soil substrates unfolds in four subsections. The first section analyzes the baseline model, which relies solely on bounding-box detection, highlighting its strengths and inherent limitations. The second focuses on the auto-seg method, highlighting its capability to automatically extract and analyze the unique characteristics of barefoot print contour outlines with greater precision. The third section explored the landmark-based approach, emphasizing its ability to capture detailed anatomical features for improved footprint classification. Finally, we discuss the impact of soil substrates on footprint analysis, examining how various soil textures affect footprint visibility and feature extraction.

6.1. Performance Analysis of the DeepFIT BBox Baseline Method

In this study, BBox, which is the baseline model, demonstrated its effectiveness in identifying and classifying barefoot prints within a smaller target group of up to eight individuals, achieving confidence scores of up to 94% on test images (see Figure 11). In contrast, for larger groups, the test accuracy dropped significantly to as low as 53% as shown in Figure 12. This can be attributed to the increased variations in footprint morphology, making it more challenging for the model to learn the distinguishing features. It can be deduced that the BBox has certain limitations, as it fails to capture detailed shape information, such as precise contours or specific key points on the barefoot prints. These features are crucial for morphometric analysis and individual differentiation, particularly in forensic and biometric applications [53].
The absence of these features may also lead to considerable amounts of negative space within the BBox, which contains irrelevant background pixels that do not assist in the footprint analysis [54]. Consequently, this can cause the model to process extraneous information, which can introduce noise and diminish the effectiveness of feature extraction. Despite these limitations, BBox is essential as it serves as a baseline model against which more advanced methods, such as landmark detection and Auto-Seg, can be evaluated. In addition, by localizing a barefoot print within a defined area (e.g., x, y, width, height), BBox can assist in tracking footprints across frames over time, enabling individual behaviour recognition.

6.2. Performance Analysis of the DeepFIT Auto-Seg Method

The Auto-Seg configuration significantly improved footprint delineation and classification accuracy compared to the BBox baseline method. By learning precise footprint boundaries, it achieved a test accuracy of 91% on soft soil and 89% on sandy soil, confirming its ability to generalize well under variable soil conditions as shown in Figure 9. The method was also robust in both small and large groups as shown in Figure 10. This approach aligns well with the observations made by traditional forensic specialists described in [11,25,55], that adults have unique geometric foot shape impressions that are not affected by time or aging. The Auto-Seg method surpasses previous works [14,56,57], by eliminating manual footprint tracing, resulting in a more efficient, autonomous, and less subjective process. This is because physical footprint matching requires comprehensive evaluation of various attributes, including overall foot size, heel shape, ball width, toe position, and ridge contours, all of which require careful analysis and inspection. The conclusion is then drawn on the basis of the similarities and differences captured during the comparison of these features.
In contrast to the works mentioned above and their limitations, this study leverage the power of deep learning, to rapidly analyze barefoot prints from simple photographic images, improving efficiency and reducing human bias in the process.
In addition, our investigation provides new insights into the accuracy levels when conditions that influence footprint creation, such as the soil substrate, are altered. In a work similar to this study, a field scientist [26] utilized 85 morphometric landmarks and semilandmarks to extract shape coordinates, which were then calculated using Generalized Procrustes Analysis and statistically analyzed. The footprints were scanned using a Pedus laser foot scanner, with a total of four scans per person: two for the left foot and two for the right foot. Although this study have established a strong foundation in geometric morphometrics using Euclidean distances for landmark analysis, our method offers greater efficiency by automating the process, enabling faster analysis without extensive manual intervention. This automation enhances reproducibility and enables more efficient processing of large datasets compared to manual methods.
It is also evident that our method accurately traces the boundaries, ensuring that the extracted key regions contain valuable morphometric information, which serves as the basis for feature analysis and recognition.

6.3. Performance Analysis of the DeepFIT Landmark Method

The landmark method achieved test accuracy of 97% on soft soil and 95% on sandy soil substrates, with an average test accuracy of 96%, outperforming all other DeepFIT models. These results were consistent across both small and large groups (see Figure 11 and Figure 12), demonstrating the model’s robustness and reliability in classifying individual barefoot prints. The use of landmark points improved the model’s ability to learn individual-specific geometric features, leading to superior generalization and reduced false positives.
While the study [16] placed landmarks at the tips of the toes and heel using linear measurements on inked acetate sheets, an environment that lacks the complexities of natural substrates. Our approach strategically positioned landmarks at the toe centroids and heel to address challenges such as ghosting and indistinct edges on sandy soils, enhancing robustness to variations in soil texture and visibility [14,49,58]. Compared with traditional manual methods [16,17] that require extensive human interpretation, the DeepFIT landmark method demonstrated automation, consistency, and scalability for large datasets.
Among these, the Optical Centre Method [24] is the most conceptually similar to the landmark-based DeepFIT approach, as it also utilizes centroids of the toes and heel. However, its manual implementation limits its utility. This allows our method to excel precisely where the Optical Centre Method falters on imperfect, real-world soil substrates. Despite these differences, the DeepFIT landmark method demonstrates potential to replace manual techniques, offering reliable and efficient automated landmark identification while reducing inconsistencies. To our knowledge, few studies have applied deep learning for barefoot classification using landmarks in natural environments; hence, this work bridges the gap between laboratory research and real-world forensic evidence.

6.4. Effect of Soil Substrates and Other Factors on the Classification of Barefoot Prints

This section evaluates the effect of soil substrates on the accuracy and reliability of DeepFIT models in barefoot print classification by analyzing how substrate properties influence feature extraction and recognition performance. Studies [59,60] have shown that variations in soil composition, moisture content, and texture significantly influence footprint impressions, with softer substrates generally producing clearer and deeper prints. Based on these insights, we hypothesized that DeepFIT models would perform better under soft soil conditions. As illustrated in Figure 9, all models exhibited superior performance in soft soil because of more detailed and finer anatomical characteristics, whereas the non-cohesive characteristics of sandy soil led to shallower and less defined footprints, which complicate the extraction of features [61]. However, it is evident that the landmark method performed well on both substrates, with an average mAP of 96%, precision of 95% (indicating the fewest positive errors), and an F1-score of 95%, demonstrating its high reliability. The second-best performance metrics were from auto-seg, followed by BBox, which is the baseline method, as shown in Figure 9.
We observed that heavier persons have more clearly defined footprints than lighter ones. The most probable explanation to this difference is that the extra weight of heavier persons affords deeper soil impressions because of the larger force exerted on the ground. A similar observation was made by [62] who reported that increased weight enhances footprint visibility on certain soil substrates. While soft soil yields clearer features, it is prone to erosion, whereas sand is more stable but generates less distinct features. Examining these variations could offer valuable insights, especially for forensic or morphometric analyses, where maintaining consistency across different substrates is crucial for accurate comparison and identification.
We strongly encourage practitioners and field scientists to extend this research by testing additional substrates not covered in this study. Although our study focused on soft and sandy soils, the proposed DeepFIT framework could leverage transfer learning for other soil types, such as clay or dust. Pre-trained models on one substrate could be fine-tuned with a small dataset from another substrate, enabling efficient adaptation while reducing the need for extensive retraining. This approach could enhance model generalization across diverse environmental conditions and support broader forensic applications.

7. Study Limitations

This study presents several limitations that must be acknowledged. First, the DeepFIT architecture was primarily fine-tuned and modified, and there may be limitations in fully controlling the interaction between these components. Furthermore, the model’s generalizability could not be fully assessed due to a lack of publicly available benchmark datasets encompassing diverse soil substrates. Second, model accuracy also depends on the precise identification of barefoot prints, which can be affected by environmental variability and the absence of ridge details essential for morphometric analysis. Finally, the optimal landmark-based method requires expert knowledge for selecting landmarks during training before it can automatically classify and match barefoot prints belonging to the same individual.

8. Conclusions and Future Direction

The current study demonstrated that integrating morphometric landmarks and foot shape into deep learning models offers a more effective classification approach. Two key anatomical features of the barefoot conditions were examined: 16 anatomical landmarks and the automatically segmented ridge contours of the footprint. These features play a crucial role in distinguishing the left and right footprints of individuals, as demonstrated in the study population. Notably, the DeepFIT landmark-based approach demonstrated high effectiveness, achieving an accuracy of 96%, making it a precise and reliable method for footprint identification on soft and sandy soil substrate. The spatial arrangement of these landmarks captures the critical morphological variations, reinforcing their significance in the classification. Additionally, the DeepFIT Auto-Seg approach showed promising results at 90%, further supporting the potential of deep learning for robust footprint analysis. To achieve unbiased barefoot feature extraction, it is crucial to minimize human influence by utilizing deep learning for automated predictions. This reduces the subjectivity and enhances the consistency, reliability, and reproducibility of the analysis.
In summary, all models, including BBox, could identify footprints on soil substrates. However, the main limitation of the BBox approach is its tendency to decrease the accuracy and misclassify footprints as the number of individuals increases. This diminishes its reliability and makes it a less recommended method for precise footprint identification for various group sizes. The qualitative and quantitative results presented in this paper prove that deep learning is better than traditional methods and provides acceptable results in pattern recognition. Future research could investigate the incorporation of more substrates through transfer learning to improve the capacity to adaptively identify morphometric landmarks and segmentation characteristics in different soil types. Additionally, there may be opportunities to explore a combination of landmark-based and Auto-Seg methods, assuming that the architecture permits such integration.

Author Contributions

Conceptualization, data curation, methodology, software, validation, writing—original draft preparation, formal analysis, W.M., R.S.J.J., Z.C.J., S.K.A., O.M. and T.P.; funding acquisition, investigation, resources, R.S.J.J.; editing, visualization, Z.C.J.; project administration, review and editing T.P.; supervision, R.S.J.J., O.M. and S.K.A. All authors have read and agreed to the published version of the manuscript.

Funding

Research was sponsored by the U.S Army Research Office under Grant W911NF-23-1-0293. The views and conclusions are those of the authors and do not represent official policies of the Army Research Office or the U.S Government.

Institutional Review Board Statement

On behalf of the Human Ethics Research Committee, I hereby give ethical approval in respect of the undertakings contained in the above-mentioned project and research instrument(s). Should any other instruments be used, these require separate authorization. The researcher may therefore commence with the research as from the date of this certificate, using the reference number HREC-12. The study was approved by Human Ethics Research Committee of Botswana International University of Science and Technology (protocol code: HREC-12, approval date: 10 August 2023) for studies involving humans.

Informed Consent Statement

Informed consent was obtained from all subjects involved in the study.

Data Availability Statement

The authors will liaise with the Human Ethics Research Committee for guidance on the ethical implications and best practices for providing the research data. Once the manuscript is published, the data may be provided ONLY upon request. The research community will be provided with a license agreement to sign, stating that they will not in any manner distribute or use the data for commercial purposes.

Acknowledgments

The authors acknowledge the BIUST Human Research Ethics Committee for granting the required permits to conduct the human experiments. We are grateful to the Botswana Defence Force for providing the resources necessary to carry out this research, and the U.S. Army for the financial support. Finally, we sincerely thank all the volunteers who participated in the barefoot print data collection on soil substrates.

Conflicts of Interest

The authors declare that they have no known competing financial interests or personal relationships that could have appeared to influence the work reported in this paper.

Abbreviations

The following abbreviations are used in this manuscript:
DeepFITDeeplearning Footprint Identification Technology
XSDHExtra Small Detection Head
C3k2Cross-Stage Partial Structure with Convolution 3 and kernel size 2
SPPFSpatial Pyramid Pooling Fast
AutoSegAutomatic Segmentation
CNNConvolutional Neural Network

References

  1. Khokher, R.; Singh, R.C. Footprint-Based Personal Recognition Using Scanning Technique. Indian J. Sci. Technol. 2016, 9, 1–10. [Google Scholar] [CrossRef]
  2. Osisanwo, F.; Adetunmbi, A.O.; Álese, B.K. Barefoot Morphology: A Person Unique Feature for Forensic Identification. In Proceedings of the 9th International Conference on Internet Technology and Secured Transactions (ICITST), London, UK, 8–10 December 2014; IEEE: Piscataway, NJ, USA, 2014; pp. 356–359. [Google Scholar]
  3. Atamturk, D.; Duyar, I. Age-related factors in the relationship between foot measurements and living stature and body weight. J. Forensic Sci. 2008, 53, 1296–1300. [Google Scholar] [PubMed]
  4. Abledu, J.K.; Abledu, G.K.; Offei, E.B.; Antwi, E.M. Determination of sex from footprint dimensions in a Ghanaian population. PLoS ONE 2015, 10, e0139891. [Google Scholar]
  5. Reel, S.; Rouse, S.; Obe, W.V.; Doherty, P. Estimation of stature from static and dynamic footprints. Forensic Sci. Int. 2012, 219, 283-e1. [Google Scholar] [CrossRef]
  6. Khan, H.B.M.A.; Moorthy, T.N. Stature Estimation from the Anthropometric Measurements of Foot Outline in Adult Indigenous Melanau Ethnics of East Malaysia by Regression Analysis. Sri Lanka J. Forensic Med. Sci. Law 2014, 4, 2. [Google Scholar] [CrossRef]
  7. D’Août, K.; Meert, L.; Van Gheluwe, B.; De Clercq, D.; Aerts, P. Experimentally Generated Footprints in Sand: Analysis and Consequences for the Interpretation of Fossil and Forensic Footprints. Am. J. Phys. Anthropol. 2010, 141, 515–525. [Google Scholar]
  8. Kelemework, A.; Abebayehu, A.T.; Amberbir, T.A.; Agedew, G.; Asmamaw, A.A.; Deribe, K.D.; Davey, G. “Why Should I Worry, Since I Have Healthy Feet?” A Qualitative Study Exploring Barriers to Use of Footwear among Rural Community Members in Northern Ethiopia. BMJ Open 2016, 6, e010354. [Google Scholar]
  9. Main, M. African Adventurer’s Guide: Botswana; Penguin Random House South Africa: Cape Town, South Africa, 2012. [Google Scholar]
  10. Palla, S.; Shivajirao, A. Anthropometric examination of footprints in South Indian population for sex estimation. Forensic Sci. Int. Rep. 2024, 9, 100354. [Google Scholar] [CrossRef]
  11. Mukhra, R.; Krishan, K.; Kanchan, T. Bare footprint metric analysis methods for comparison and identification in forensic examinations: A review of literature. J. Forensic Leg. Med. 2018, 58, 101–112. [Google Scholar] [CrossRef]
  12. Tucker, J.M.; King, C.; Lekivetz, R.; Murdoch, R.; Jewell, Z.C.; Alibhai, S.K. Development of a Non-Invasive Method for Species and Sex Identification of Rare Forest Carnivores Using Footprint Identification Technology. Ecol. Inform. 2024, 79, 102431. [Google Scholar]
  13. Kistner, F.; Tulowietzki, J.; Slaney, L.; Alibhai, S.; Jewell, Z.; Ramosaj, B.; Pauly, M. Enhancing Endangered Species Monitoring by Lowering Data Entry Requirements with Imputation Techniques as a Preprocessing Step for the Footprint Identification Technology (FIT). Ecol. Inform. 2024, 82, 102676. [Google Scholar] [CrossRef]
  14. Krishna, S.T.; Kalluri, H.K. Deep Learning and Transfer Learning Approaches for Image Classification. Int. J. Recent Technol. Eng. 2019, 7, 427–432. [Google Scholar]
  15. Montalbo, F.J.P. A Computer-Aided Diagnosis of Brain Tumors Using a Fine-Tuned YOLO-Based Model with Transfer Learning. KSII Trans. Internet Inf. Syst. 2020, 14, 4816–4834. [Google Scholar]
  16. Situ, Z.; Teng, S.; Liao, X.; Chen, G.; Zhou, Q. Real-Time Sewer Defect Detection Based on YOLO Network, Transfer Learning, and Channel Pruning Algorithm. J. Civ. Struct. Health Monit. 2024, 14, 41–57. [Google Scholar] [CrossRef]
  17. Tinao, P.; Jamisola, R.S., Jr.; Mpoeleng, D.; Bennitt, E.; Mmereki, W. Automatic Animal Identification from Drone Camera Based on Point Pattern Analysis of Herd Behaviour. Ecol. Inform. 2021, 66, 101485. [Google Scholar]
  18. Yamashita, A.B. Forensic Barefoot Morphology Comparison. Can. J. Criminol. Crim. Justice 2007, 49, 647–656. [Google Scholar] [CrossRef]
  19. Burrow, J.G.; Kelly, H.D.; Francis, B.E. Forensic Podiatry—An Overview. J. Forensic Sci. Crim. Investig. 2017, 5, 1–8. [Google Scholar] [CrossRef]
  20. Vernon, W.; Reel, S.; Howsam, N. Examination and Interpretation of Barefoot Prints in Forensic Investigations. Res. Rep. Forensic Med. Sci. 2020, 1–14. [Google Scholar]
  21. Kennedy, R.B.; Yamashita, A.B. Barefoot Morphology Comparisons: A Summary. J. Forensic Ident. 2007, 57, 383. [Google Scholar]
  22. Gunn, N. Old and New Methods of Evaluating Footprint Impressions by a Forensic Podiatrist. Br. J. Podiatr. Med. Surg. 1991, 3, 8–11. [Google Scholar]
  23. Robbins, L.M.; Gantt, R. Footprints: Collection, Analysis, and Interpretation; Charles C Thomas Publisher: Springfield, IL, USA, 1985. [Google Scholar]
  24. Kennedy, R.B.; Pressman, I.S.; Chen, S.; Petersen, P.H.; Pressman, A.E. Statistical Analysis of Barefoot Impressions. J. Forensic Sci. 2003, 48, JFS2001337. [Google Scholar] [CrossRef]
  25. Smerecki, C.J.; Lovejoy, C.O. Identification via Pedal Morphology. Int. Crim. Police Rev. 1985, 40, 186–190. [Google Scholar]
  26. Domjanic, J.; Fieder, M.; Seidler, H.; Mitteroecker, P. Geometric Morphometric Footprint Analysis of Young Women. J. Foot Ankle Res. 2013, 6, 27. [Google Scholar] [CrossRef] [PubMed]
  27. Reel, S.M.L. Development and Evaluation of a Valid and Reliable Footprint Measurement Approach in Forensic Identification. Ph.D. Thesis, University of Leeds, Leeds, UK, 2012. [Google Scholar]
  28. Liau, A.P.B.-Y.; Jan, Y.-K.; Tsai, J.-Y.; Akhyar, F.; Lin, C.-Y.; Subiakto, R.B.R.; Lung, C.-W. Deep Learning in Left and Right Footprint Image Detection Based on Plantar Pressure. Appl. Sci. 2022, 12, 8885. [Google Scholar] [CrossRef]
  29. Chen, L.; Jin, L.; Li, Y.; Liu, M.; Liao, B.; Yi, C.; Sun, Z. Triple Generalized-Inverse Neural Network for Diagnosis of Flat Foot. In Proceedings of the 2019 Chinese Control Conference (CCC), Guangzhou, China, 27–30 July 2019; IEEE: Piscataway, NJ, USA, 2019; pp. 8594–8599. [Google Scholar] [CrossRef]
  30. Keatsamarn, T.; Pintavirooj, C. Footprint Identification Using Deep Learning. In Proceedings of the 2018 11th Biomedical Engineering International Conference (BMEiCON)*, Chiang Mai, Thailand, 21–24 November 2018; IEEE: Piscataway, NJ, USA, 2018; pp. 1–4. [Google Scholar]
  31. Budka, M.; Bennett, M.R.; Reynolds, S.C.; Barefoot, S.; Reel, S.; Reidy, S.; Walker, J. Sexing White 2D Footprints Using Convolutional Neural Networks. PLoS ONE 2021, 16, e0255630. [Google Scholar] [CrossRef]
  32. BEng, Y.Y.; Tang, Y.; MEng, J.C.; MEng, X.Z. Score-based likelihood ratios for barefootprint evidence using deep learning features. J. Forensic Sci. 2025, 70, 98–116. [Google Scholar] [CrossRef]
  33. Shen, Y.; Jiang, X.; Zhao, Y.; Xie, W. Barefoot Footprint Detection Algorithm Based on YOLOv8-StarNet. Sensors 2025, 25, 4578. [Google Scholar] [CrossRef]
  34. İbrahimoğlu, N.; Osmani, A.; Ghaffari, A.; Günay, F.B.; Çavdar, T.; Yıldız, F. FootprintNet: A Siamese network method for biometric identification using footprints. J. Supercomput. 2025, 81, 714. [Google Scholar] [CrossRef]
  35. Jin, Y. Algorithm of personal recognition based on multi-scale features from barefoot footprint image. Forensic Sci. Technol. 2022, 47, 587–592. [Google Scholar]
  36. Cunningham, P.; Cord, M.; Delany, S.J. Supervised Learning. In Machine Learning Techniques for Multimedia: Case Studies on Organization and Retrieval; Springer: Berlin/Heidelberg, Germany, 2008; pp. 21–49. [Google Scholar]
  37. Vandaele, R.; Aceto, J.; Muller, M.; Péronnet, F.; Debat, V.; Wang, C.W.; Huang, C.T.; Jodogne, S.; Martinive, P.; Geurts, P.; et al. Landmark Detection in 2D Bioimages for Geometric Morphometrics: A Multi-Resolution Approach. Sci. Rep. 2018, 8, 538. [Google Scholar] [CrossRef]
  38. Jiang, C.; Mu, X.; Zhang, B.; Xie, M.; Liang, C. YOLO-Based Missile Pose Estimation under Uncalibrated Conditions. IEEE Access 2024, 12, 112462–112469. [Google Scholar] [CrossRef]
  39. Chen, D.; Chen, Y.; Ma, J.; Cheng, C.; Xi, X.; Zhu, R.; Cui, Z. An Ensemble Deep Neural Network for Footprint Image Retrieval Based on Transfer Learning. J. Sens. 2021, 2021, 6631029. [Google Scholar] [CrossRef]
  40. Cao, Z.; Hidalgo, G.; Simon, T.; Wei, S.E.; Sheikh, Y. OpenPose: Realtime Multi-Person 2D Pose Estimation Using Part Affinity Fields. IEEE Trans. Pattern Anal. Mach. Intell. 2019, 43, 172–186. [Google Scholar] [CrossRef] [PubMed]
  41. Zou, X.; Yang, J.; Zhang, H.; Li, F.; Li, L.; Wang, J.; Wang, L.; Gao, J.; Lee, Y.J. Segment Everything Everywhere All at Once. Adv. Neural Inf. Process. Syst. 2023, 36, 19769–19782. [Google Scholar]
  42. Kirillov, A.; Mintun, E.; Ravi, N.; Mao, H.; Rolland, C.; Gustafson, L.; Xiao, T.; Whitehead, S.; Berg, A.C.; Lo, W.Y.; et al. Segment Anything. In Proceedings of the IEEE/CVF International Conference on Computer Vision, Paris, France, 2–3 October 2023; pp. 4015–4026. [Google Scholar]
  43. Moorthy, T.N.; Sulaiman, S.F.B. Individualizing Characteristics of Footprints in Malaysian Malays for Person Identification from a Forensic Perspective. Egypt. J. Forensic Sci. 2015, 5, 13–22. [Google Scholar] [CrossRef]
  44. Redmon, J.; Divvala, S.; Girshick, R.; Farhadi, A. You Only Look Once: Unified, Real-Time Object Detection. In Proceedings of the IEEE Conference on Computer Vision and Pattern Recognition (CVPR), Las Vegas, NV, USA, 27–30 June 2016; pp. 779–788. [Google Scholar]
  45. Ali, M.L.; Zhang, Z. The YOLO Framework: A Comprehensive Review of Evolution, Applications, and Benchmarks in Object Detection. Computers 2024, 13, 336. [Google Scholar] [CrossRef]
  46. Khanam, R.; Hussain, M. YOLOv11: An overview of the key architectural enhancements. arXiv 2024, arXiv:2410.17725. [Google Scholar] [CrossRef]
  47. Gong, S.; Yu, W.; Chen, J.; Qi, D.; Lu, J. SN-YOLO: A Super Neck Algorithm Based on YOLO11 for Traffic Object Detection. In Proceedings of the International Conference on Computer Vision, Robotics, and Automation Engineering (CRAE 2025), Shanghai, China, 27–29 June 2025; SPIE: Bellingham, WA, USA, 2025; Volume 13790, pp. 95–101. [Google Scholar]
  48. Misbah, M.; Khan, M.U.; Kaleem, Z.; Muqaibel, A.; Alam, M.Z.; Liu, R.; Yuen, C. MSF-GhostNet: Computationally-Efficient YOLO for Detecting Drones in Low-Light Conditions. IEEE J. Sel. Top. Appl. Earth Obs. Remote Sens. 2024, 18, 3840–3851. [Google Scholar] [CrossRef]
  49. Liu, C.; Tao, Y.; Liang, J.; Li, K.; Chen, Y. Object Detection Based on YOLO Network. In Proceedings of the 2018 IEEE 4th Information Technology and Mechatronics Engineering Conference (ITOEC), Chongqing, China, 14–16 December 2018; pp. 799–803. [Google Scholar]
  50. Kukartsev, V.V.; Ageev, R.A.; Borodulin, A.S.; Gantimurov, A.P.; Kleshko, I.I. Deep Learning for Object Detection in Images: Development and Evaluation of the YOLOv8 Model Using Ultralytics and Roboflow Libraries. In Proceedings of the Computer Science On-Line Conference; Springer Nature: Cham, Switzerland, 2024; pp. 629–637. [Google Scholar]
  51. Alhussainan, N.F.; Ben Youssef, B.; Ben Ismail, M.M. A Deep Learning Approach for Brain Tumor Firmness Detection Based on Five Different YOLO Versions: YOLOv3–YOLOv7. Computation 2024, 12, 44. [Google Scholar] [CrossRef]
  52. Ryu, S.E.; Chung, K.Y. Detection Model of Occluded Object Based on YOLO Using Hard-Example Mining and Augmentation Policy Optimization. Appl. Sci. 2021, 11, 7093. [Google Scholar] [CrossRef]
  53. DiMaggio, J.A.; Vernon, W. Forensic Podiatry Principles and Human Identification. In Forensic Podiatry: Principles and Methods; Humana Press: Totowa, NJ, USA, 2011; pp. 13–24. [Google Scholar] [CrossRef]
  54. Chan, S.; Zheng, J.; Wang, L.; Wang, T.; Zhou, X.; Xu, Y.; Fang, K. Rotating Object Detection in Remote-Sensing Environment. Soft Comput. 2022, 26, 8037–8045. [Google Scholar] [CrossRef]
  55. Nakajima, K.; Mizukami, Y.; Tanaka, K.; Tamura, T. Footprint-Based Personal Recognition. IEEE Trans. Biomed. Eng. 2000, 47, 1534–1537. [Google Scholar] [CrossRef] [PubMed]
  56. Liu, H.; Ding, N.; Lin, S.; Lv, H.; Liu, X. Research on the Measurement Method of Barefoot Footprint Similarity. In Proceedings of the International Conference on Statistics, Data Science, and Computational Intelligence (CSDSCI 2022), Qingdao, China, 19–21 August 2022; SPIE: Bellingham, WA, USA, 2023; Volume 12510, pp. 112–118. [Google Scholar]
  57. Howsam, N.; Bridgen, A. A comparative study of standing fleshed foot and walking and jumping barefootprint measurements. Sci. Justice 2018, 58, 346–354. [Google Scholar] [CrossRef] [PubMed]
  58. Bennett, M.R.; Morse, S.A. Human Footprints: Fossilised Locomotion? Springer: Dordrecht, The Netherlands, 2014; Volume 216. [Google Scholar]
  59. Wiseman, A.L.A.; De Groote, I. One Size Fits All? Stature Estimation from Footprints and the Effect of Substrate and Speed on Footprint Creation. Anat. Rec. 2022, 305, 1692–1700. [Google Scholar] [CrossRef]
  60. Marty, D.; Strasser, A.; Meyer, C.A. Formation and Taphonomy of Human Footprints in Microbial Mats of Present-Day Tidal-Flat Environments: Implications for the Study of Fossil Footprints. Ichnos 2009, 16, 127–142. [Google Scholar] [CrossRef]
  61. Bates, K.T.; Savage, R.; Pataky, T.C.; Morse, S.A.; Webster, E.; Falkingham, P.L.; Ren, L.; Qian, Z.; Collins, D.; Bennett, M.R.; et al. Does footprint depth correlate with foot motion and pressure? J. R. Soc. Interface 2013, 10, 20130009. [Google Scholar] [CrossRef]
  62. Hatala, K.G.; Wunderlich, R.E.; Dingwall, H.L.; Richmond, B.G. Interpreting Locomotor Biomechanics from the Morphology of Human Footprints. J. Hum. Evol. 2016, 90, 38–48. [Google Scholar] [CrossRef]
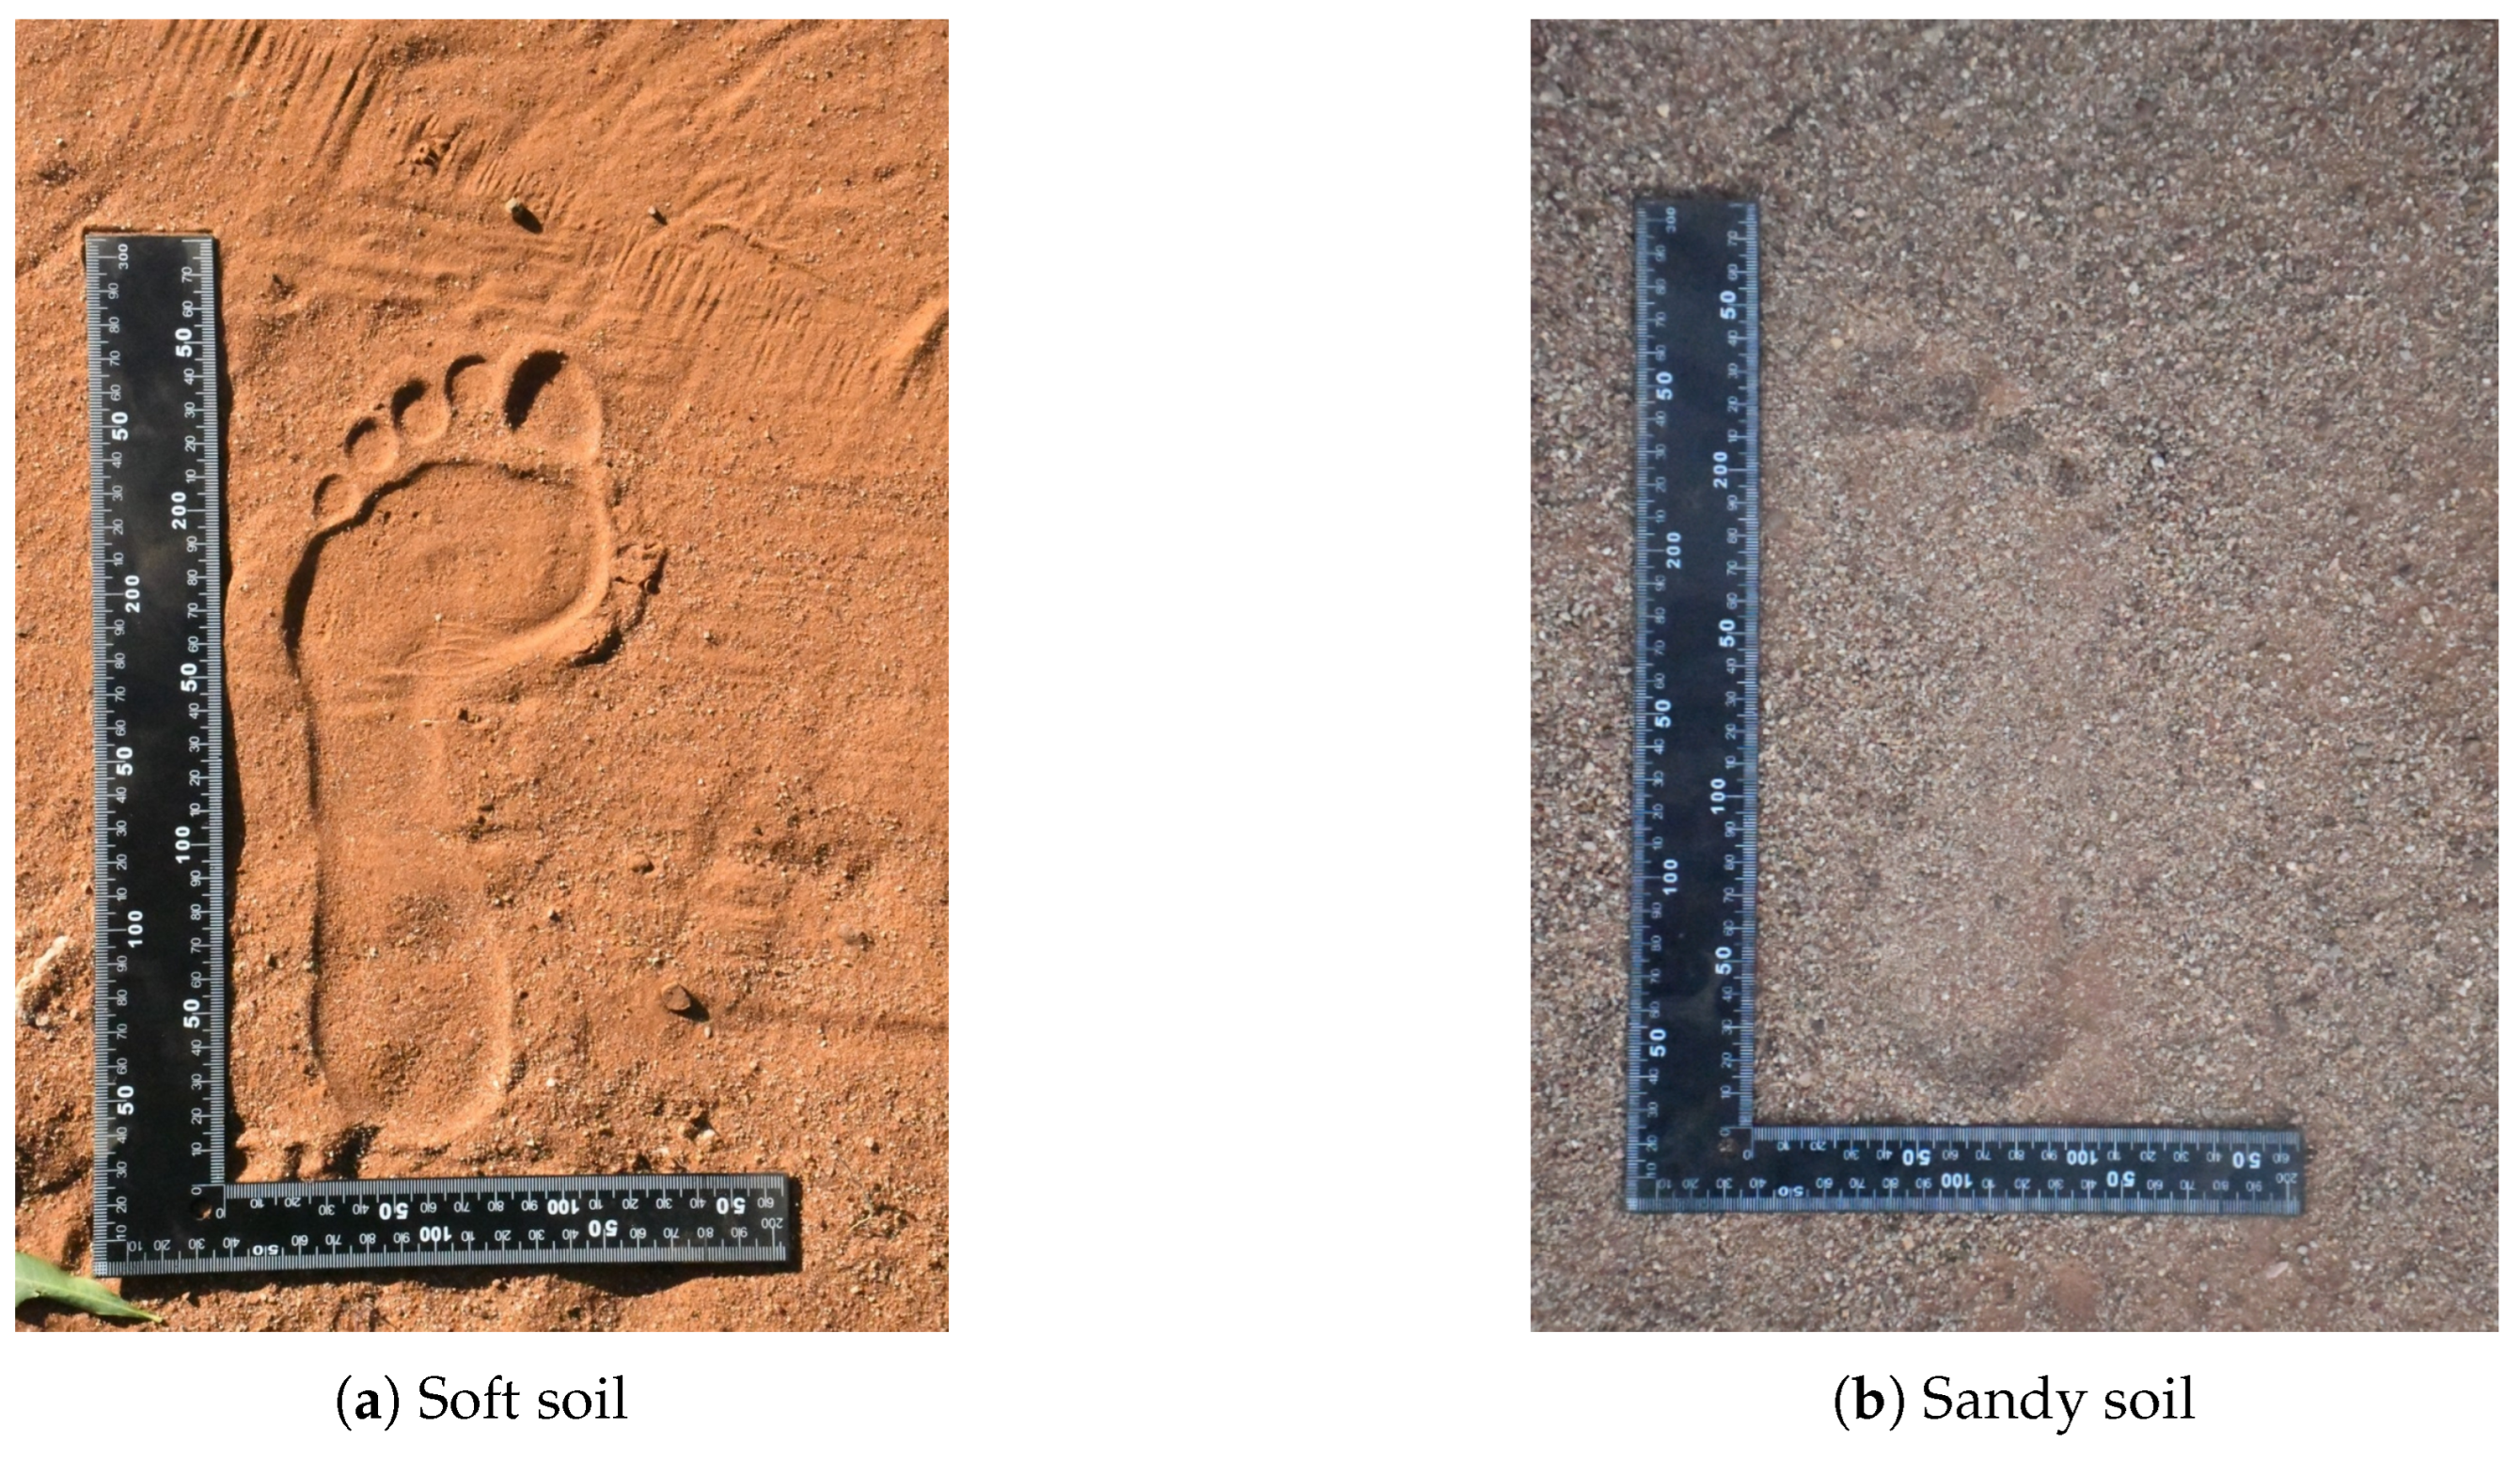
Figure 1. Images of human barefoot prints showing (a) soft soil substrate, and (b) sandy soil substrate considered in this study to identify a set of footprints belonging to an individual.
Forensicsci 05 00056 g001
Figure 2. Illustration of traditional footprint analysis methods. (a) presents the Overlay method based on outline shape analysis [25]; (b) Gunn method of measurements [22].
Forensicsci 05 00056 g002
Figure 3. Illustrates the three methods employed for human barefoot classification using the DeepFIT network: (a) presents the BBox that encapsulates the barefoot print for localization and serves as the basis for comparison, (b) demonstrates the sixteen (16) morphometric landmarks incorporated for geometric morphometric analysis, and (c) illustrates the automatically segmented footprint outline within the BBox for detailed shape analysis.
Forensicsci 05 00056 g003
Figure 4. Implementation flow of the auto-segmentation approach: The Segment Anything Model (SAM) [43] is utilized with a BBox prompt to automatically extract the footprint outline, followed by classification using the DeepFIT network.
Forensicsci 05 00056 g004
Figure 5. Architecture of the proposed DeepFIT model based on the modified YOLOV11s network which incorporates XSDH head and other operations, implemented using the PyTorch library (version 2.1.0; Meta AI, Menlo Park, CA, USA). The barefoot image is fed into the network, passing through the backbone and neck, ultimately resulting in four-scale predictions output [45].
Forensicsci 05 00056 g005
Figure 6. Flowchart depicting the model training, validation, and testing sets on custom human barefoot prints dataset of 40 subjects using the DeepFIT network.
Forensicsci 05 00056 g006
Figure 7. Training accuracy of the three DeepFIT models plotted at 30-epoch intervals, highlighting the learning dynamics while reducing unnecessary noise. All models were trained on a dataset of 40 subjects, representing the main target group of this study. Consistent convergence is observed across all models at approximately 120 epochs. (a) Soft and sandy soil combined: Landmark and Auto-Seg demonstrate rapid convergence, and the BBox demonstrates slower convergence. (b) Soft soil only: Landmark and Auto-Seg demonstrate rapid convergence, and the BBox demonstrates slower convergence. (c) Sandy soil only: All DeepFIT models demonstrate rapid convergence @ 35 epoch.
Forensicsci 05 00056 g007
Figure 8. Overall performance evaluation of the DeepFIT models on a test set combining soft and sandy soil substrates, based on a dataset of 40 subjects representing the primary target group of this study.
Forensicsci 05 00056 g008
Figure 9. Performance evaluation of the DeepFIT models conducted separately on soft and sandy soil test sets independently, each based on a dataset of 40 subjects.
Forensicsci 05 00056 g009
Figure 10. The performance of three investigated techniques was assessed on both soft and sandy soil substrates, with results from these two conditions combined. The DeepFIT Landmark method (red) exhibited the highest accuracy, reaching 99% for smaller groups, and consistently delivered correct classifications across various group sizes. The DeepFIT auto-Seg method (blue) attained accuracy of up to 94%, demonstrating promising results across various group sizes. In contrast, the BBox method (black) performed well for smaller groups (up to six individuals) but showed a decline in accuracy below 80%, resulting in misclassifications, while the other two methods maintained accurate classifications.
Forensicsci 05 00056 g010
Figure 11. Sample experimental results for small target group (2–10 individuals), with one sample from the soft substrate and one from the sandy substrate. The columns (a,b) represent the BBox only, (c,d) represent the BBox + auto-seg + XSDH, and (e,f) represent the BBox + 16 landmarks + XSDH. The BBox method begins to misclassify and shows a decline in accuracy starting at 8 individuals, as evidenced in the second row for sandy soil.
Forensicsci 05 00056 g011
Figure 12. Sample experimental results for large target group (11–40 individuals), with one test sample from the soft substrate and one from the sandy substrate. The columns (a,b) represent the BBox only, (c,d) represent the BBox + auto-seg + XSDH, and (e,f) represent the BBox + 16 landmarks + XSDH. The BBox method completely misclassify and deteriorates in accuracy.
Forensicsci 05 00056 g012
Table 1. Different scenarios where barefoot print datasets are collected and analyzed using deep learning.
StudyMethodMediumFeatures UsedDataset SizeAccuracyRemarks
[28]YOLOv4Pressure scannerPlantar pressure974 images99%Barefoot pressure images are collected for cerebral palsy patient
[29]TGINNSmart insoleFlat foot835 images82%Flat foot dataset collected using smart insole
[30]CNNOptical sensorFoot pressure13 indiv.92.69%Footprint images using optical sensor system with information generated by foot pressure
[31]CNNInkless padFriction ridges2800 images90%Standing footprint collected using inkless pad system for sex classification
[32]Likelihood
ratios
2D inkless
scan system
Gray scale
barefoot prints
3000 indiv. &
54,118 footprints
98.4%
 
Barefoot prints are collected using 2D inkless
scan system as evidence for court use
[33]YOLOv8
StarNet
White sheet
 
RGB footprints
 
300 indiv. &
2400 images
73%
 
Barefoot prints are collected using a digital
camera for recognition
[34]Footprint
Net
Capture of
inked prints
Intensity spectral
variation
220 indiv. &
2200 images
99%
 
Barefoot prints are captured using a scanner
for biometric recognition
[35]ResNet50Ink and
scanned images
Shape contour
features
10,000 indiv. &
16 images each
96.2%
 
Barefoot prints are scanned and inked for
personal recognition
Our
study
DeepFIT auto
segmentation
Soft and sandy
soil substrate
Segmented
outlines
40 indiv. &
22,000 images
90%
 
Barefoot print images are collected on soil
substrate using a camera for identification.
Our
study
DeepFIT
landmark
Soft and sandy
soil substrate
16 landmark
points
40 indiv. &
22,000 images
96%
 
Barefoot print images are collected on soil
substrate using a camera for identification.
Note: CNN, Convolutional Neural Networks; DeepFIT, Deeplearning Footprint Identification Technology; TGINN, Triple Generalized-Inverse Neural Network; YOLO, You Only Look Once.
Table 2. Description of the 16 Landmarks on Human Barefoot Impressions.
LandmarkDescription of Landmark
L1Centre of 1st toe
L2Centre of 2nd toe
L3Centre of 3rd toe
L4Centre of 4th toe
L5Centre of 5th toe
L6Head of 1st metatarsal
L7Right ball width landmark
L8Right instep curvature landmark
L9Right instep width landmark
L10Right heel width landmark
L11The most backward and prominent point of the heel
L12Left heel width landmark
L13centre of the heel landmark
L14Left instep width landmark
L15Left ball width landmark
L16Head of 5st metatarsal
Table 3. Key Hyperparameters for the DeepFIT Model Training.
LandmarkDescription of Landmark
Learning rate η = 0.001
Batch size16
Momentum0.99
Weight decay0.0005
Epochs240
Table 4. Ablation experiment showing the impact of each component on DeepFIT’s accuracy.
Experiment IDModel VariantBBoxLandmarksSegmentationXSDHmAP50-95 (%)
1Baseline BBox76.3
2Baseline BBox + XSDH77
3Baseline BBox + Segmentation88
4Baseline BBox + Segmentation & XSDH90
5Baseline BBox + Landmark89
6Baseline BBox + Landmark & XSDH96
Table 5. Performance comparison of the three DeepFIT methods on two soil types using Precision, Recall, mAP, and F1-score.
Soft Soil
MethodPrecision (%)Recall (%)mAP (%)F1-Score (%)
BBox76757877
Auto-Seg91899181
Landmark96949796
Sand Soil
MethodPrecision (%)Recall (%)mAP (%)F1-Score (%)
BBox76737673
Auto-Seg88868988
Landmark93939593
Table 6. Comparison between DeepFIT methods by using the Paired t-test.
MethodMean APStd DevComparisont-Valuep-ValueSignificant p < 0.05
BBox76.85.41BBox vs. Auto-Seg−16.94 6.35 × 10 13 Yes
BBox vs. Landmark−14.04 1.75 × 10 11 Yes
Auto-Seg90.12.29Auto-Seg vs. Landmark−9.18 2.04 × 10 8 Yes
Landmark96.31.49(already shown above)
Disclaimer/Publisher’s Note: The statements, opinions and data contained in all publications are solely those of the individual author(s) and contributor(s) and not of MDPI and/or the editor(s). MDPI and/or the editor(s) disclaim responsibility for any injury to people or property resulting from any ideas, methods, instructions or products referred to in the content.