
Linking Seasonal Temperature Variations with Laboratory-Derived Development Data for Chrysomya rufifacies (Macquart): A Case for Myiasis


Abstract
1. Introduction
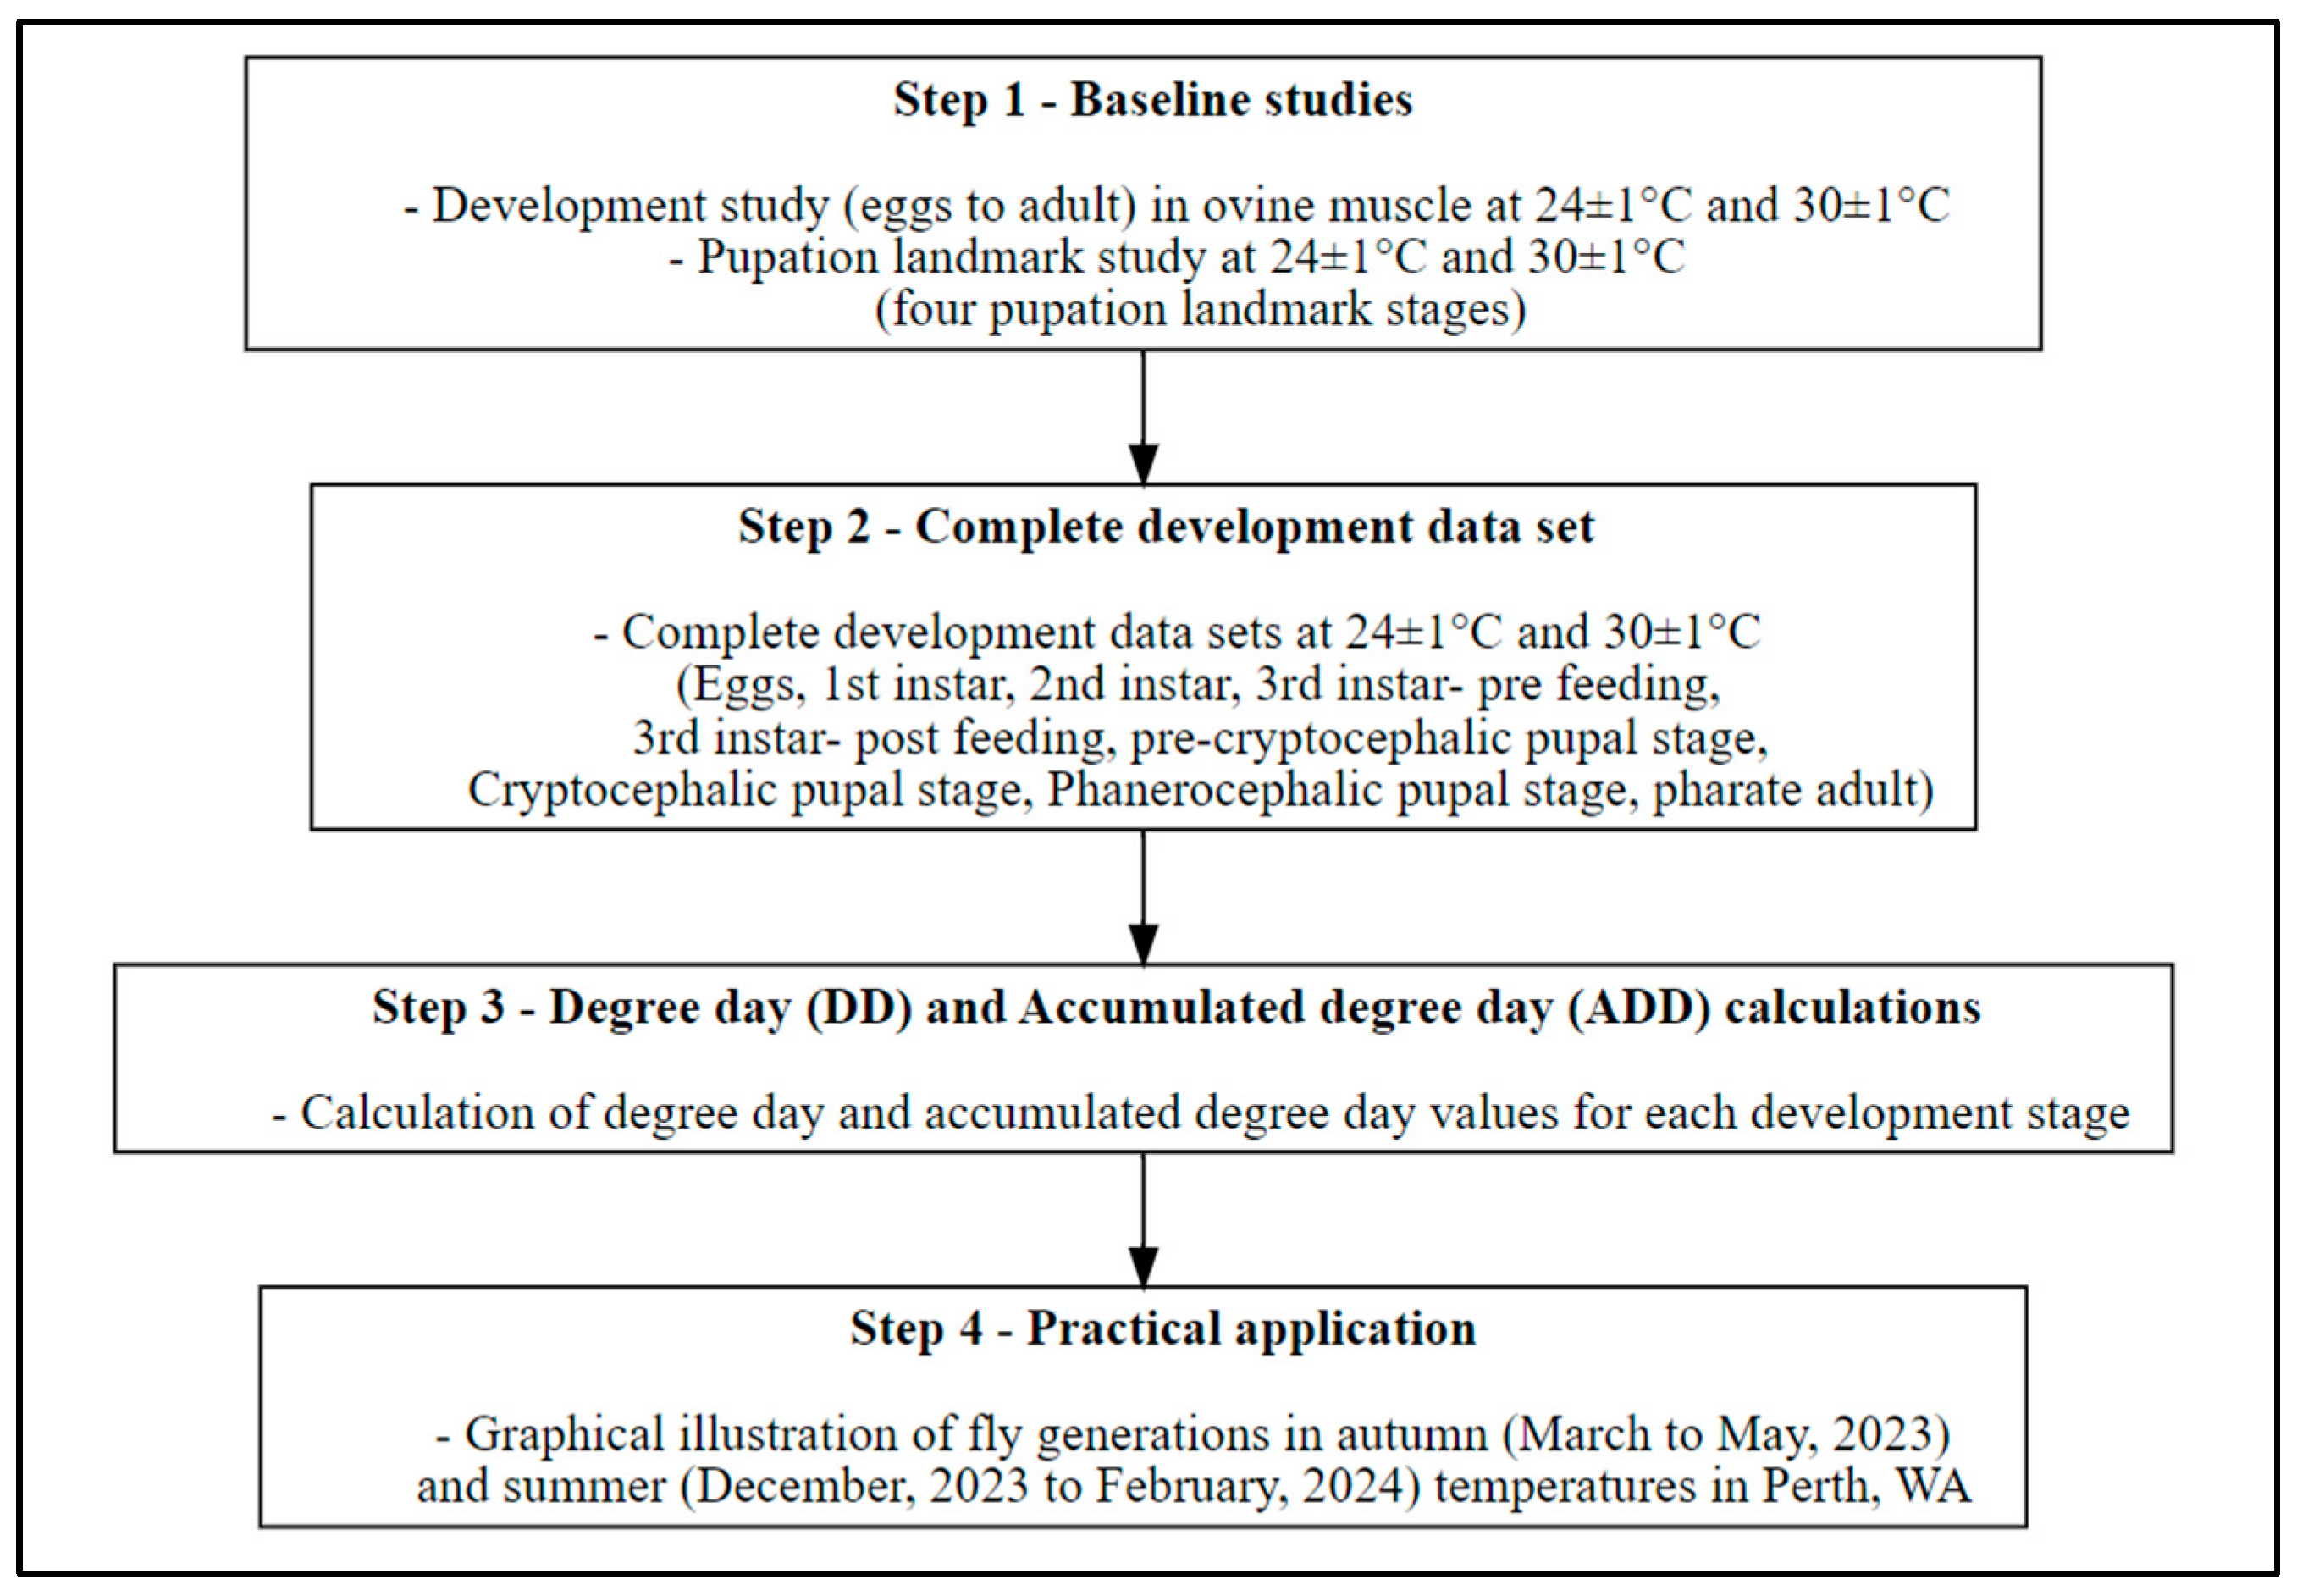
2. Materials and Methods
2.1. Step 1—Baseline Studies
2.1.1. Development Study
2.1.2. Pupation Landmark Study
2.2. Step 2—Complete Development Data Sets
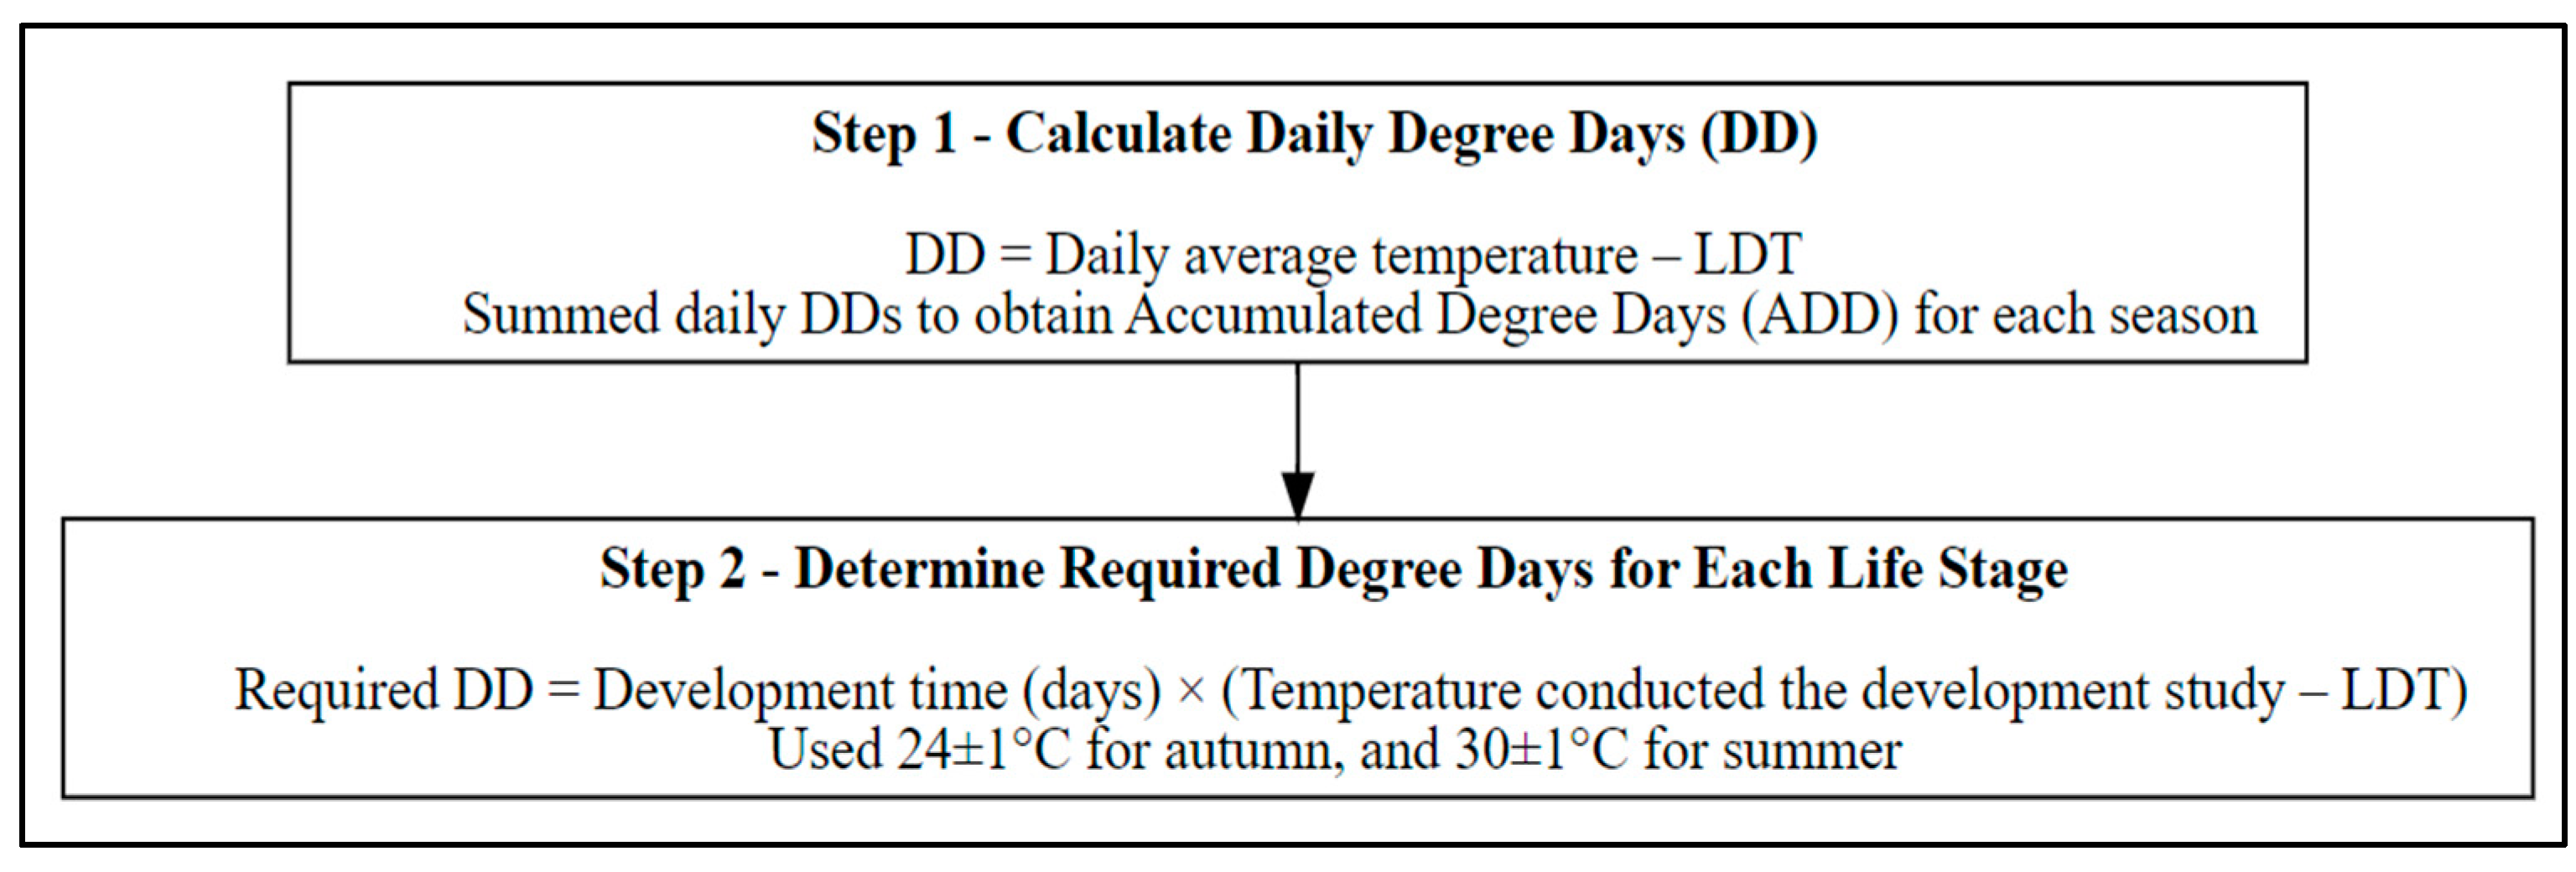
2.3. Step 3—Degree Day (DD) and Accumulated Degree Day (ADD) Calculations
2.4. Step 4—Practical Application
3. Results
3.1. Development Study
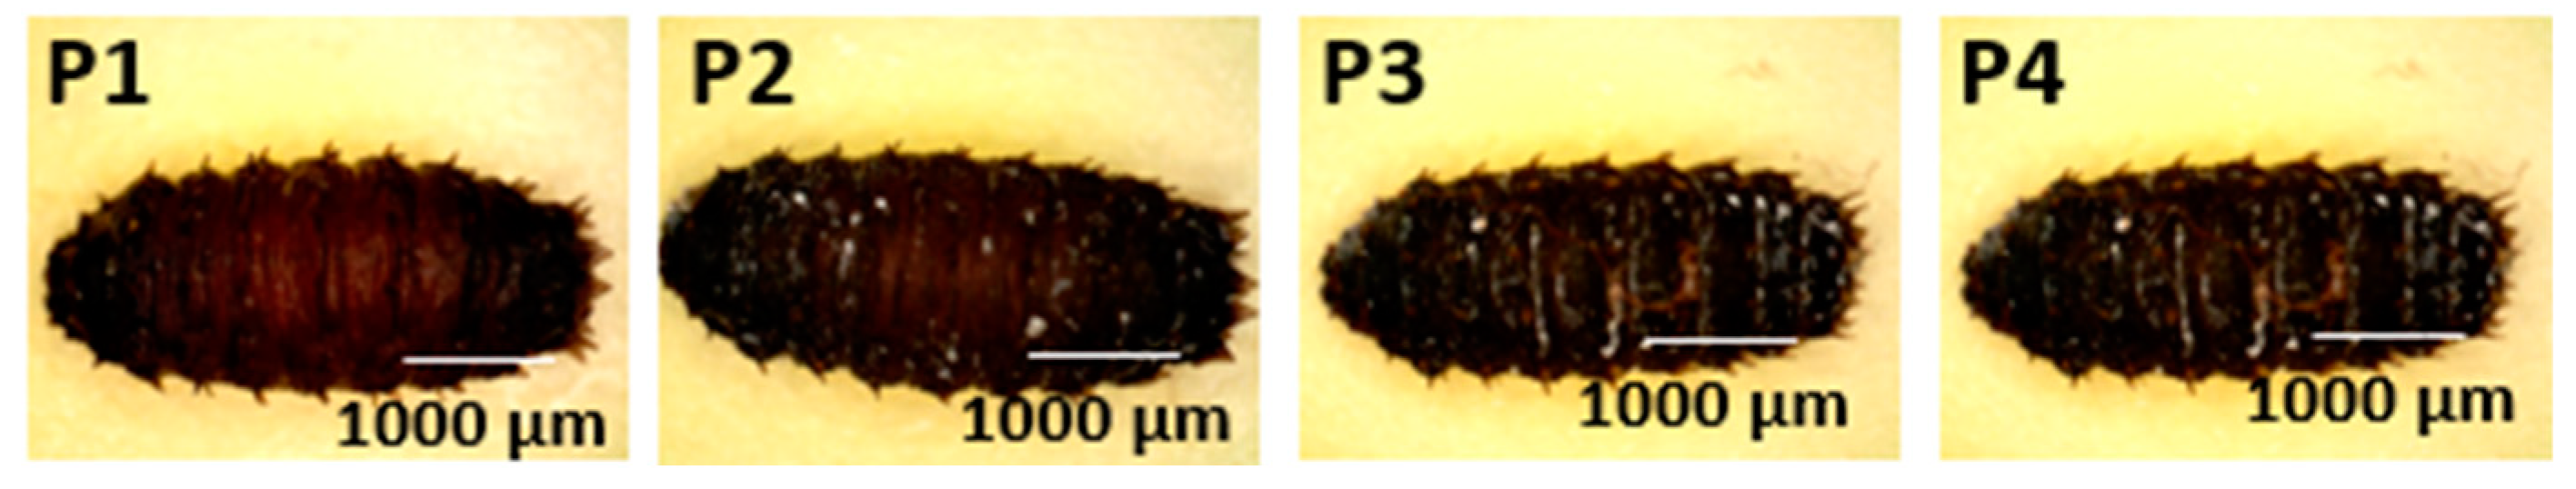
3.2. Pupation Landmarks
- Puparium (Figure 3: Character 1)
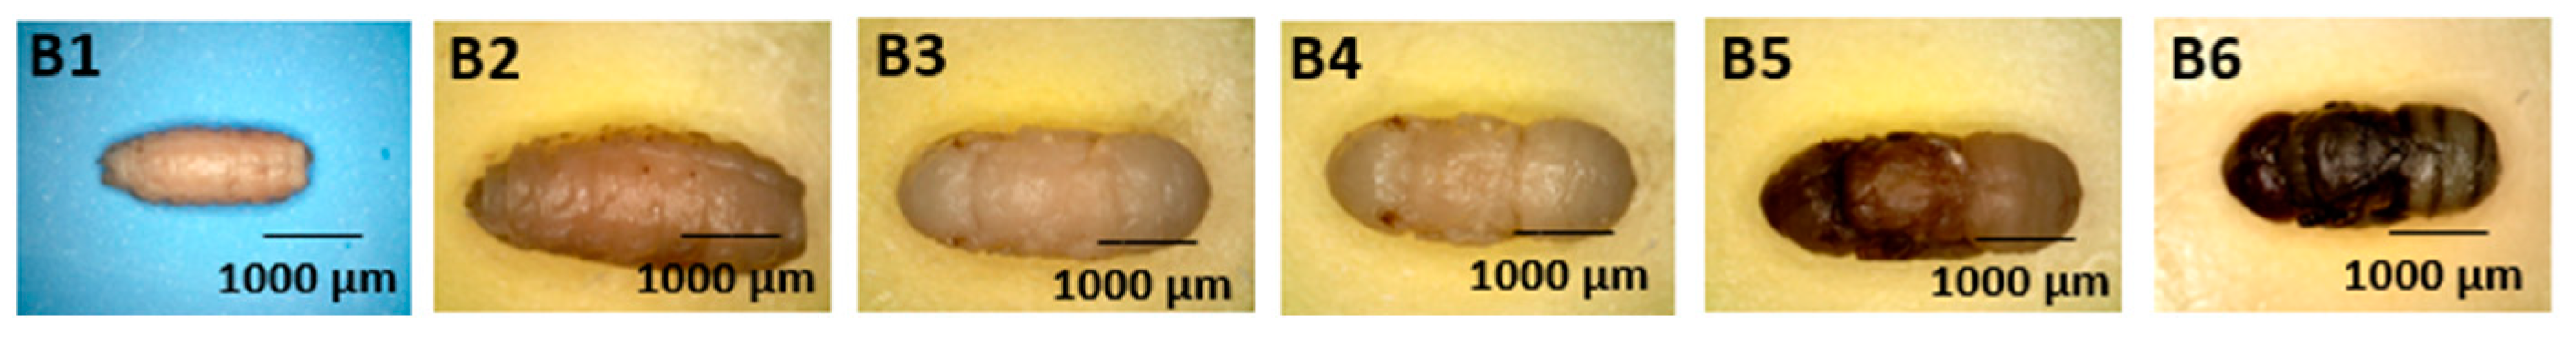
- Body Segments (Figure 4: Character 2)
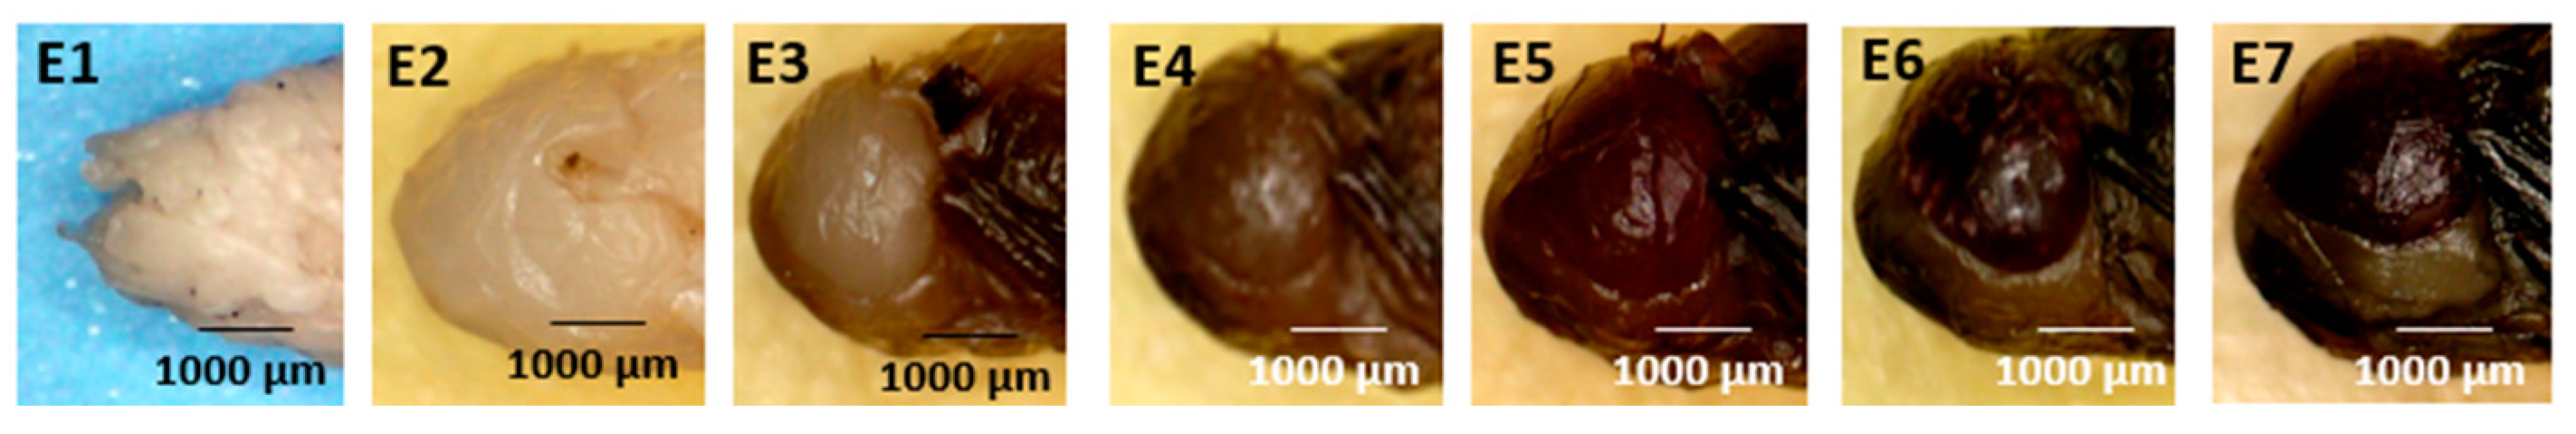
- Compound Eye (Figure 5: Character 3)
- Antennae (Figure 6: Character 4)

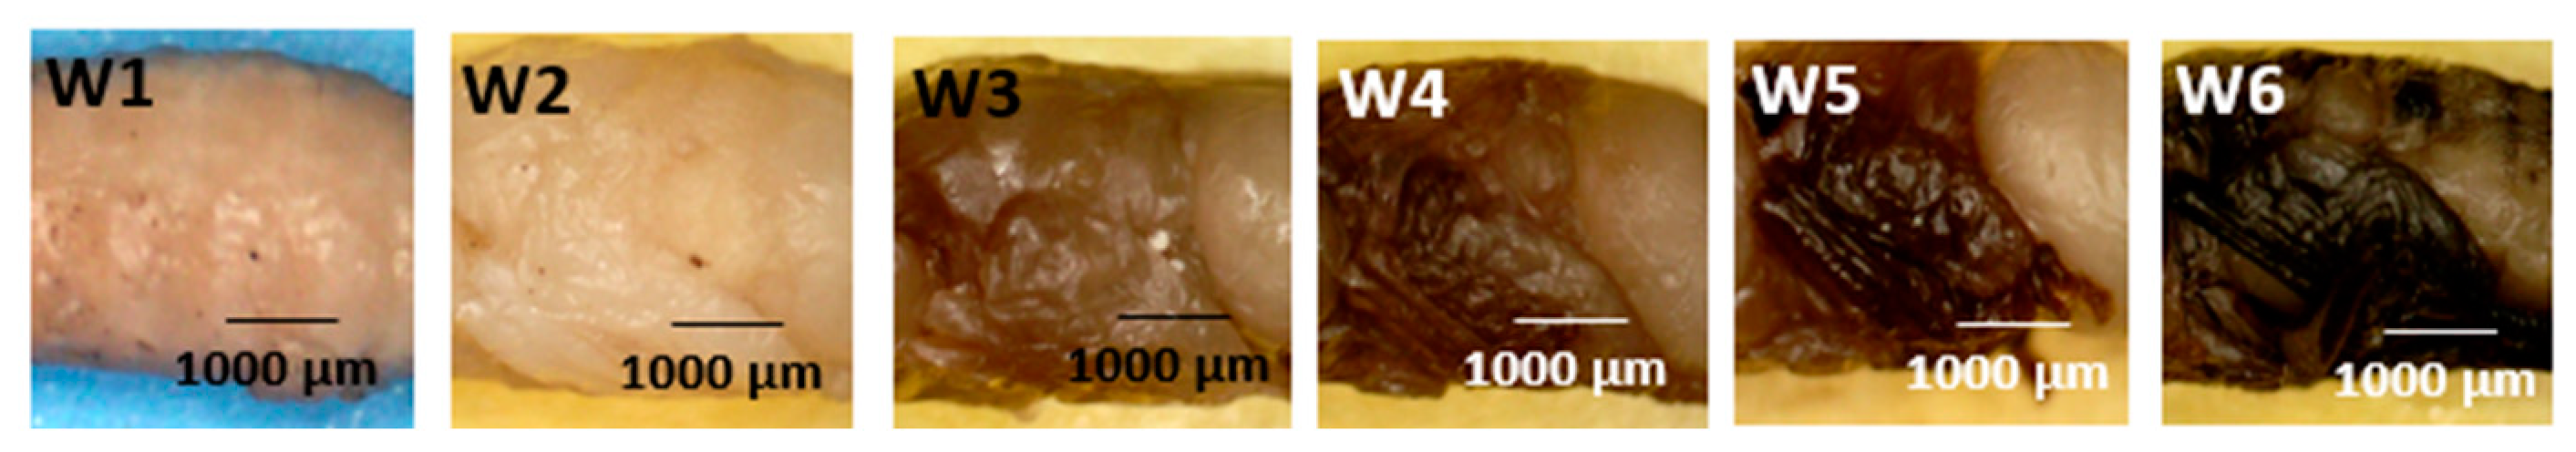
- Wings (Figure 7: Character 5)
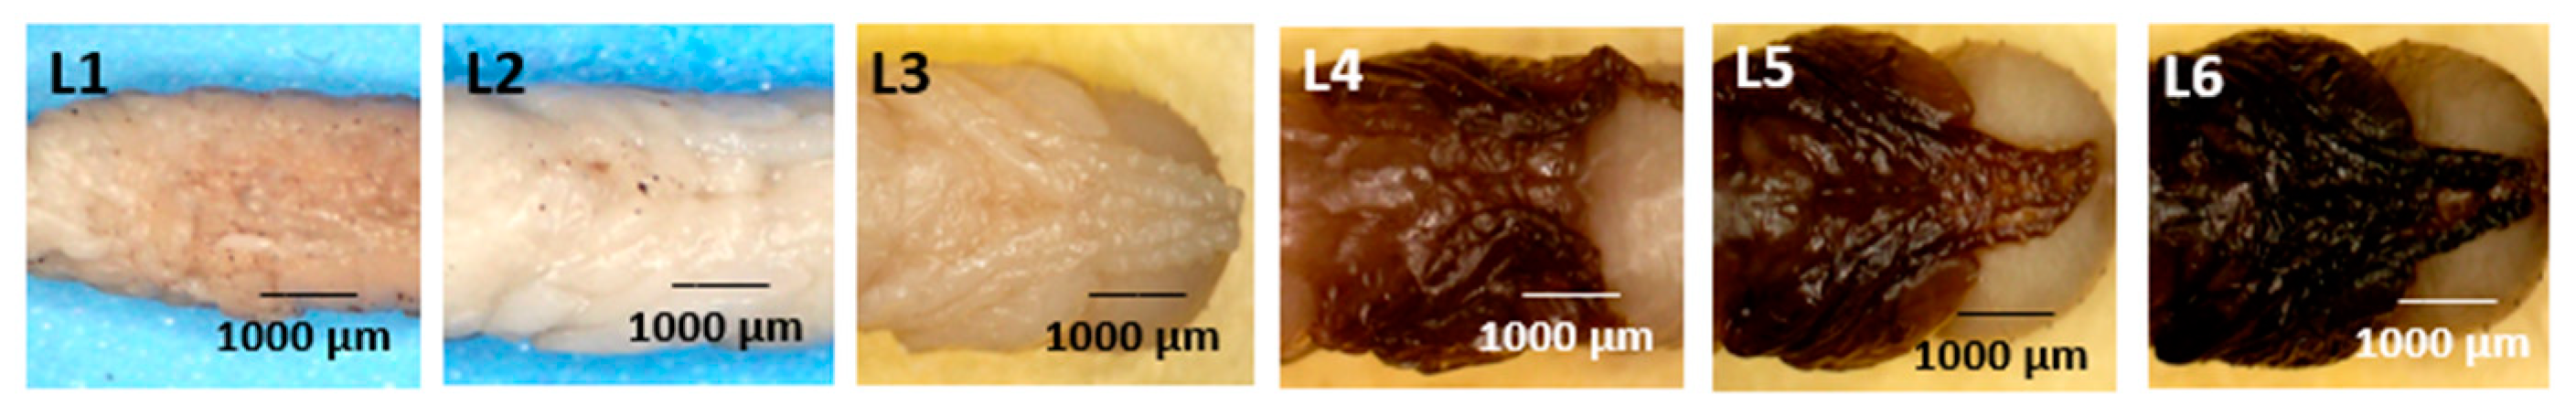
- Legs (Figure 8: Character 6)
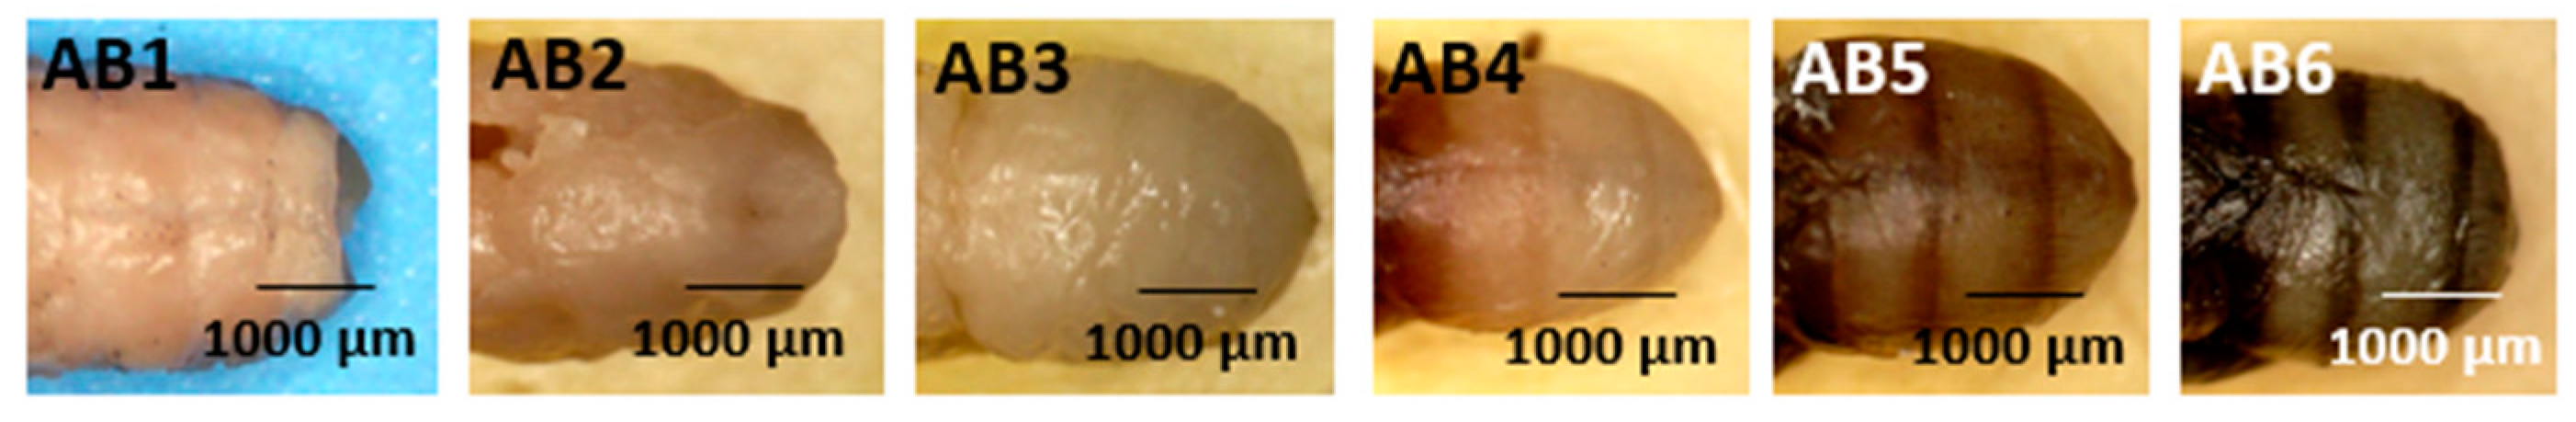
- Abdomen (Figure 9: Character 7)

| Age (D) | 24 ± 1 °C | ||||||
|---|---|---|---|---|---|---|---|
| Puparium (Figure 3) | Body Segmentation (Figure 4) | Compound Eye (Figure 5) | Antennae (Figure 6) | Wings (Figure 7) | Legs (Figure 8) | Abdomen (Figure 9) | |
| 0.00 | P1 | B1 | E1 | A1 | W1 | L1 | AB1 |
| 0.33 | P2 | B2 | E2 | A2 | W2 | L2 | AB2 |
| 0.66 | P2 | B3 | E2 | A3 | W2 | L2 | AB2 |
| 1.00 | P3 | B4 | E3 | A4 | W3 | L3 | AB3 |
| 1.33 | P3 | B4 | E3 | A4 | W3 | L3 | AB3 |
| 1.66 | P3 | B4 | E3 | A4 | W3 | L3 | AB3 |
| 2.00 | P3 | B4 | E3 | A4 | W3 | L3 | AB3 |
| 2.33 | P3 | B4 | E3 | A4 | W3 | L3 | AB3 |
| 2.66 | P3 | B4 | E4 | A5 | W3 | L4 | AB3 |
| 3.00 | P3 | B5 | E4 | A5 | W4 | L4 | AB5 |
| 3.33 | P3 | B5 | E4 | A5 | W4 | L4 | AB5 |
| 3.66 | P3 | B5 | E5 | A5 | W5 | L4 | AB4 |
| 4.00 | P4 | B6 | E6 | A6 | W5 | L5 | AB5 |
| 4.33 | P4 | B6 | E6 | A6 | W6 | L6 | AB5 |
| 4.66 | P4 | B6 | E7 | A7 | W6 | L6 | AB6 |
 | |||||||
| Age (D) | 30 ± 1 °C | ||||||
|---|---|---|---|---|---|---|---|
| Puparium (Figure 3) | Body Segmentation (Figure 4) | Compound Eye (Figure 5) | Antennae (Figure 6) | Wings (Figure 7) | Legs (Figure 8) | Abdomen (Figure 9) | |
| 0.00 | P1 | B1 | E1 | A1 | W1 | L1 | AB1 |
| 0.33 | P2 | B2 | E2 | A2 | W2 | L2 | AB2 |
| 0.66 | P2 | B3 | E2 | A3 | W2 | L2 | AB2 |
| 1.00 | P2 | B3 | E2 | A3 | W3 | L3 | AB2 |
| 1.33 | P3 | B4 | E3 | A4 | W3 | L3 | AB3 |
| 1.66 | P3 | B4 | E3 | A4 | W3 | L3 | AB3 |
| 2.00 | P3 | B4 | E3 | A4 | W3 | L3 | AB3 |
| 2.33 | P3 | B5 | E4 | A5 | W4 | L4 | AB4 |
| 2.66 | P3 | B5 | E5 | A5 | W4 | L4 | AB4 |
| 3.00 | P4 | B6 | E6 | A6 | W5 | L5 | AB5 |
| 3.33 | P4 | B6 | E7 | A7 | W6 | L6 | AB6 |
 | |||||||
| Pupation Landmark | Characteristics | Ch. rufifacies | |
|---|---|---|---|
| 24 ± 1 °C | 30 ± 1 °C | ||
| Pre-cryptocephalic pupal stage | The larval hypodermis remains attached to the puparium, while the cephalopharyngeal skeleton is firmly connected to the prepupa at the anterior end. Notable differences in the shape and color of the puparium were observed compared to later stages, as it retained the larval form and exhibited a lighter brown hue (Figure 10). | 0.33 | 0.33 |
| Cryptocephalic pupal stage | The initial formation of legs appeared as a swollen, tube-like structure in the midsection of the body at this stage. As development advances, a distinct groove emerges, separating the head and thorax regions. The cephalopharyngeal skeleton is still visible, but it is less firmly attached to the puparium compared to the preceding stage (Figure 10). | 0.66 | 0.66 |
| Phanerocephalic pupal stage | The respiratory horns, situated within the groove between the head and thorax regions, become visible. As development advances, the compound eyes and antennae emerged on the head, wings form on the thorax, and setae develop on the abdomen (Figure 10). | 3.00 | 2.00 |
| Pharate adult | In this final phase, the insect matures into an adult, undergoing body tanning and the hardening of visible setae and bristles. The pupal cuticle, which encases the developing adult, begins to shed as the maturation process progresses (Figure 10). | 1.00 | 0.66 |

3.3. Development Data and Required Degree Days for Each Life Stage at Two Temperatures
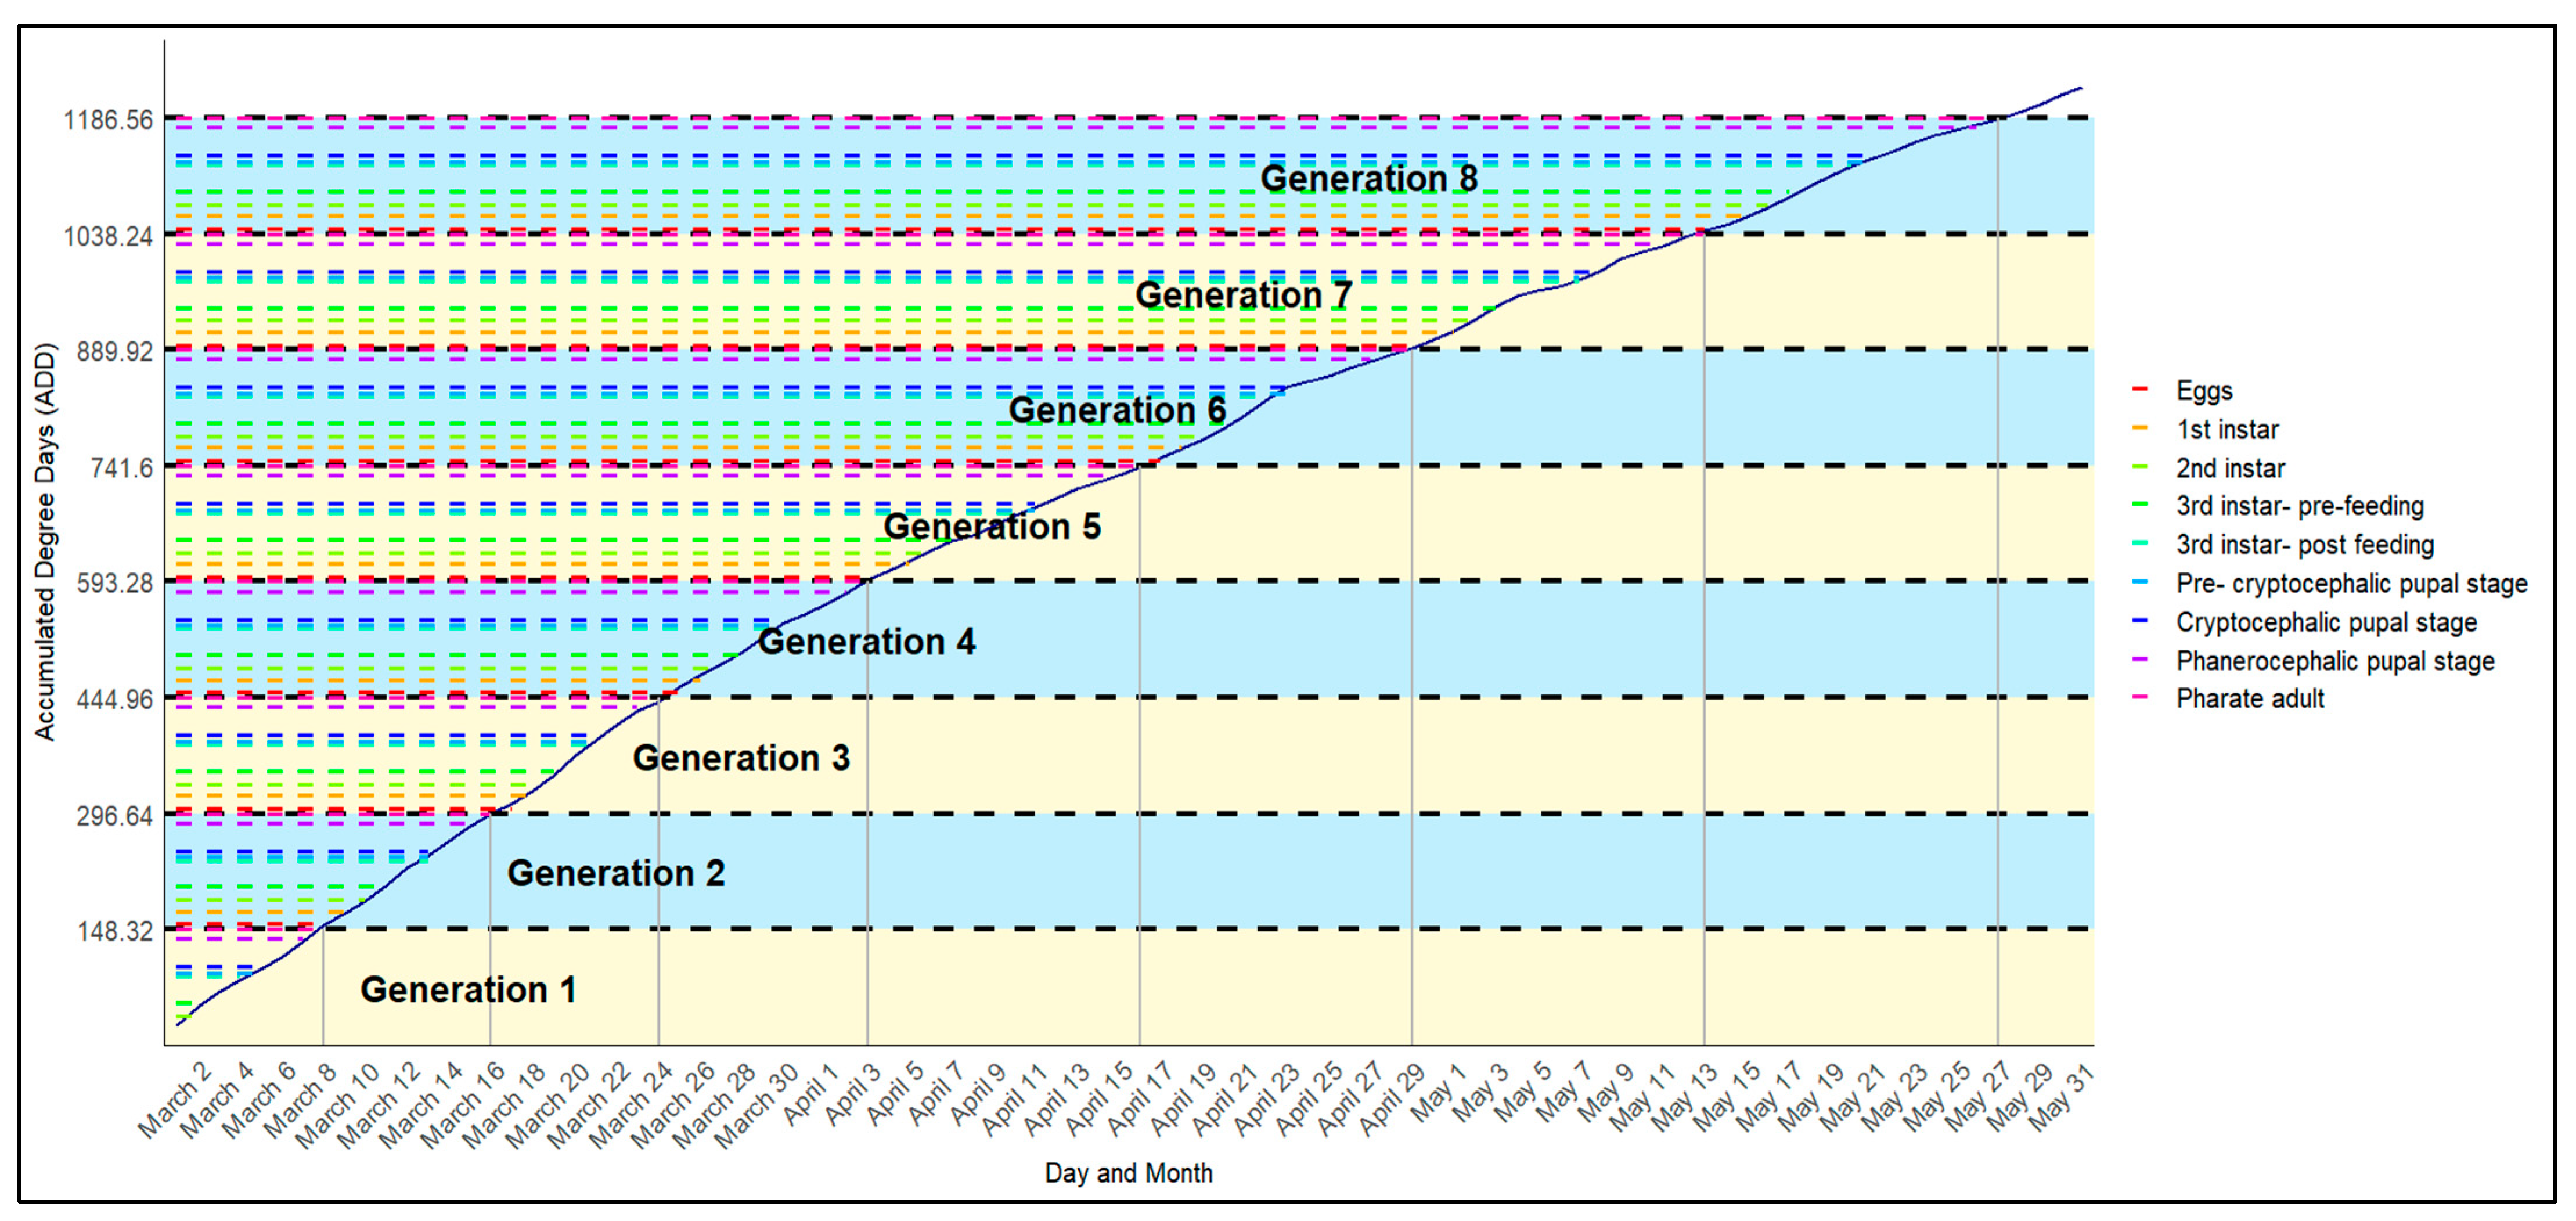
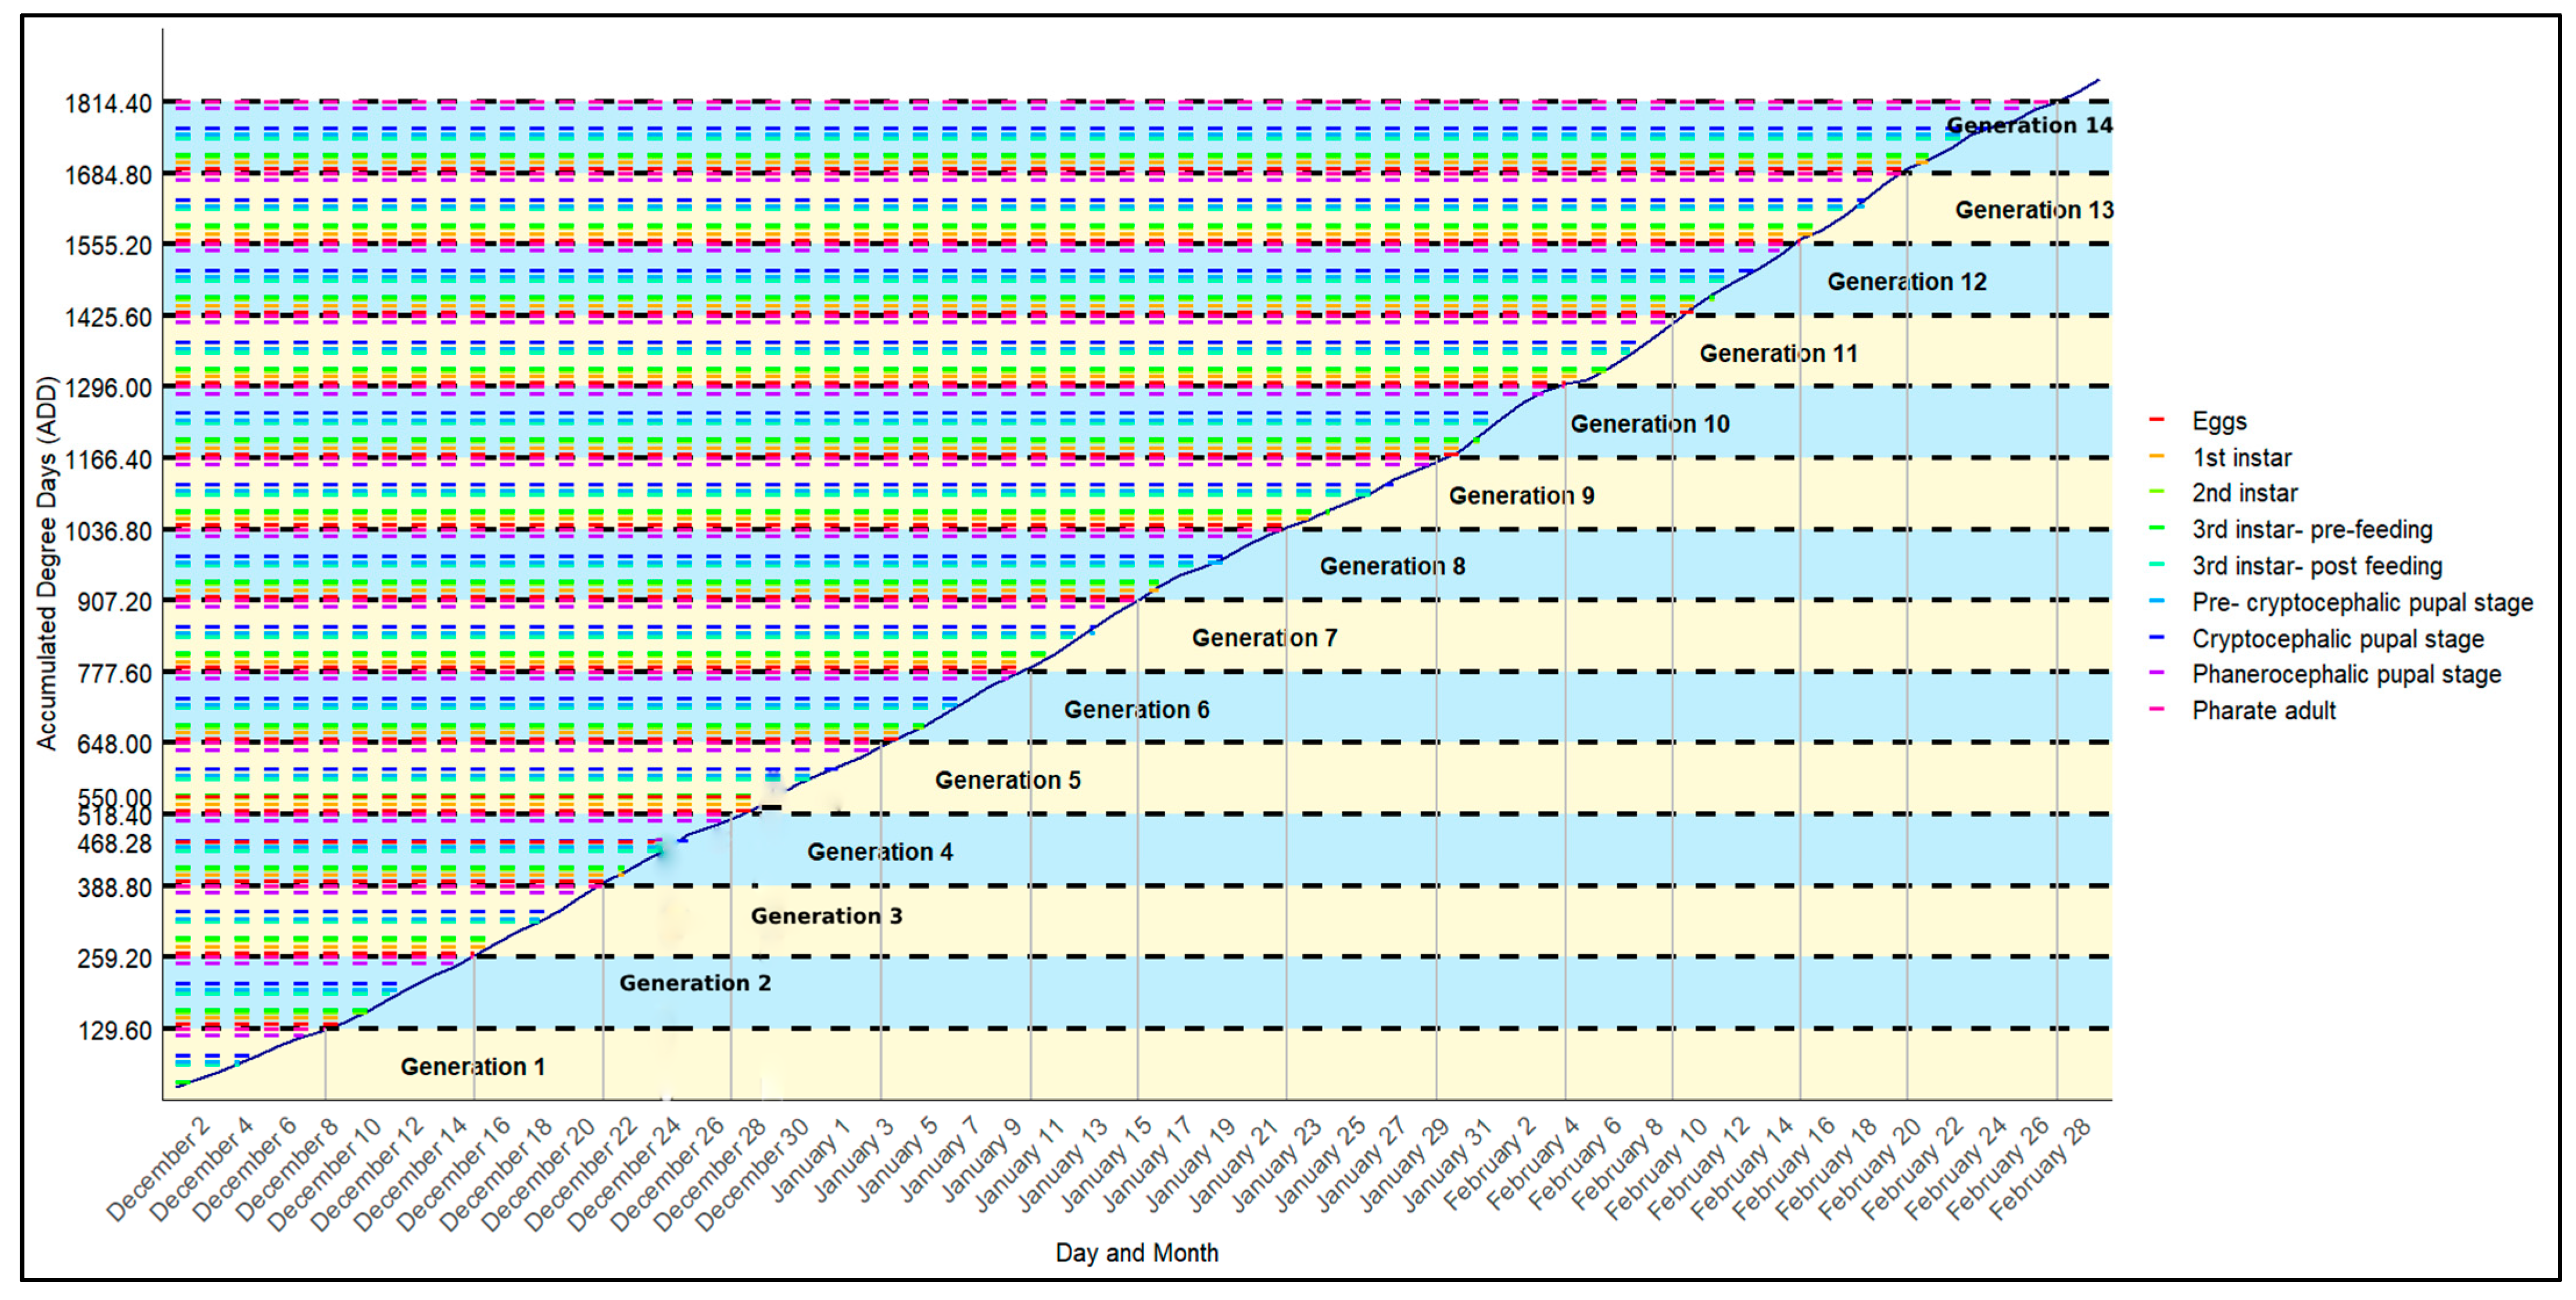
3.4. Seasonal Emergence of Fly Generations
4. Discussion
Author Contributions
Funding
Institutional Review Board Statement
Informed Consent Statement
Data Availability Statement
Acknowledgments
Conflicts of Interest
References
- Hall, M.J.R. Screwworm flies as agents of wound myiasis. World Anim. Rev. 1991, 8–17. Available online: http://forensicentomologist.com/wp-content/uploads/2008/05/screwworm-agents-of-myiasis.pdf (accessed on 16 July 2024).
- Bambaradeniya, Y.T.B.; Magni, P.A.; Dadour, I.R. Traumatic sheep myiasis: A review of the current understanding. Vet. Parasitol. 2023, 314, 109853. [Google Scholar] [CrossRef] [PubMed]
- Bambaradeniya, Y.T.B.; Karunaratne, W.A.I.P.; Tomberlin, J.K.; Magni, P.A. Effect of type of tissue on the development of Chrysomya rufifacies (Diptera: Calliphoridae) in Sri Lanka. J. Med. Entomol. 2021, 58, 1673–1679. [Google Scholar] [CrossRef] [PubMed]
- Bambaradeniya, Y.T.B.; Magni, P.A.; Dadour, I.R. Current status of five warm season Diptera species in estimating the post-mortem interval. Ann. Entomol. Soc. Am. 2023, 116, 19–50. [Google Scholar] [CrossRef]
- Wall, R.; French, N.; Morgan, K.L. Effects of temperature on the development and abundance of the sheep blowfly Lucilia sericata (Diptera: Calliphoridae). Bull. Entomol. Res. 1992, 82, 125–131. [Google Scholar] [CrossRef]
- Byrd, J.H.; Tomberlin, J.K. Forensic Entomology: The Utility of Arthropods in Legal Investigations, 3rd ed.; CRC Press: Boca Raton, FL, USA, 2020. [Google Scholar]
- Karabey, T.; Sert, O. The analysis of pupal development period in Lucilia sericata (Diptera: Calliphoridae) forensically important insect. Int. J. Legal Med. 2018, 132, 1185–1196. [Google Scholar] [CrossRef] [PubMed]
- Greenberg, B.; Kunich, J.C. Entomology and the Law: Flies as Forensic Indicators; Cambridge University Press: Cambridge, UK, 2002. [Google Scholar]
- Li, L.; Zhang, Y.; Chen, Y.; Guo, Y.; Wang, Y.; Hu, G.; Kang, C.; Wang, J.; Wang, Y. Intrapuparial development and age estimation of Sarcophaga peregrina (Diptera: Sarcophagidae) for postmortem interval estimation. J. Asia-Pac. Entomol. 2023, 26, 102089. [Google Scholar] [CrossRef]
- Bambaradeniya, T.B.; Magni, P.A.; Dadour, I.R. Morphological changes of larvae and pupae of Lucilia sericata (Diptera: Calliphoridae) reared at two temperatures and on three food types. J. Med. Entomol. 2024, 61, 521–529. [Google Scholar] [CrossRef] [PubMed]
- Yanmanee, S.; Husemann, M.; Benbow, M.E.; Suwannapong, G. Larval development rates of Chrysomya rufifacies Macquart, 1842 (Diptera: Calliphoridae) within its native range in South-East Asia. Forensic Sci. Int. 2016, 266, 63–67. [Google Scholar] [CrossRef]
- Hu, G.; Wang, Y.; Sun, Y.; Zhang, Y.; Wang, M.; Wang, J. Development of Chrysomya ruffacies (Diptera: Calliphoridae) at constant temperatures within its colony range in Yangtze River Delta region of China. J. Med. Entomol. 2019, 56, 1215–1224. [Google Scholar] [CrossRef] [PubMed]
- Kotze, A.C.; James, P.J. Control of sheep flystrike: What’s been tried in the past and where to from here. Aust. Vet. J. 2022, 100, 1–19. [Google Scholar] [PubMed]
- Bambaradeniya, T.B.; Magni, P.A.; Dadour, I.R. Influence of Soil Type and Moisture on Pupal Development of Chrysomya rufifacies (Macquart) at Two Different Temperatures. Insects 2024, 15, 479. [Google Scholar] [CrossRef] [PubMed]
| Temperature | Tissue Type | Eggs | 1st Instar | 2nd Instar | 3rd Instar | 3rd Instar Post Feeding | Pupa |
|---|---|---|---|---|---|---|---|
| 24 ± 1 °C | Ovine skeletal muscle (without fat) | 0.57 ± 0.06 | 1.42 ± 0.08 | 1.39 ± 0.40 | 1.34 ± 0.08 | 2.85 ± 0.20 | 6.47 ± 0.07 |
| Ovine skeletal muscle (with fat) | 0.49 ± 0.10 | 1.39 ± 0.09 | 1.05 ± 0.40 | 1.41 ± 0.08 | 2.84 ± 0.48 | 6.46 ± 0.13 | |
| Ave. development times in days | 0.53 | 1.40 | 1.21 | 1.39 | 2.84 | 6.46 | |
| 30 ± 1 °C | Ovine skeletal muscle (without fat) | 0.44 ± 0.18 | 0.67 ± 0.23 | 0.63 ± 0.19 | 0.24 ± 0.04 | 2.04 ± 0.35 | 3.59 ± 0.25 |
| Ovine skeletal muscle (with fat) | 0.41 ± 0.11 | 0.60 ± 0.15 | 0.53 ± 0.20 | 0.28 ± 0.11 | 1.31 ± 0.24 | 3.89 ± 0.18 | |
| Ave. development times in days | 0.42 | 0.63 | 0.58 | 0.25 | 1.67 | 3.74 | |
| Temperature | Stage | Time (Days) | DD | ADD |
|---|---|---|---|---|
| 24 ± 1 °C | Eggs | 0.53 | 6.36 | 6.36 |
| 1st instar | 1.40 | 16.80 | 23.16 | |
| 2nd instar | 1.21 | 14.52 | 37.68 | |
| 3rd instar: pre feeding | 1.39 | 16.68 | 54.36 | |
| 3re instar: post feeding | 2.84 | 34.08 | 88.44 | |
| Pre-cryptocephalic pupal stage | 0.33 | 3.96 | 92.40 | |
| Cryptocephalic pupal stage | 0.66 | 7.96 | 100.32 | |
| Phanerocephalic pupal stage | 3.00 | 36.00 | 136.32 | |
| Pharate adult | 1.00 | 12.00 | 148.32 | |
| 30 ± 1 °C | Eggs | 0.42 | 7.56 | 7.56 |
| 1st instar | 0.63 | 11.34 | 18.90 | |
| 2nd instar | 0.58 | 10.44 | 29.34 | |
| 3rd instar: pre feeding | 0.25 | 4.50 | 33.84 | |
| 3re instar: post feeding | 1.67 | 30.06 | 63.90 | |
| Pre-cryptocephalic pupal stage | 0.33 | 5.94 | 69.84 | |
| Cryptocephalic pupal stage | 0.66 | 11.88 | 81.72 | |
| Phanerocephalic pupal stage | 2.00 | 36.00 | 117.72 | |
| Pharate adult | 0.66 | 11.88 | 129.60 |
Disclaimer/Publisher’s Note: The statements, opinions and data contained in all publications are solely those of the individual author(s) and contributor(s) and not of MDPI and/or the editor(s). MDPI and/or the editor(s) disclaim responsibility for any injury to people or property resulting from any ideas, methods, instructions or products referred to in the content. |
© 2025 by the authors. Licensee MDPI, Basel, Switzerland. This article is an open access article distributed under the terms and conditions of the Creative Commons Attribution (CC BY) license (https://creativecommons.org/licenses/by/4.0/).
Share and Cite
Bambaradeniya, T.B.; Magni, P.A.; Dadour, I.R. Linking Seasonal Temperature Variations with Laboratory-Derived Development Data for Chrysomya rufifacies (Macquart): A Case for Myiasis. Forensic Sci. 2025, 5, 10. https://doi.org/10.3390/forensicsci5010010
Bambaradeniya TB, Magni PA, Dadour IR. Linking Seasonal Temperature Variations with Laboratory-Derived Development Data for Chrysomya rufifacies (Macquart): A Case for Myiasis. Forensic Sciences. 2025; 5(1):10. https://doi.org/10.3390/forensicsci5010010
Chicago/Turabian StyleBambaradeniya, Tharindu B., Paola A. Magni, and Ian R. Dadour. 2025. "Linking Seasonal Temperature Variations with Laboratory-Derived Development Data for Chrysomya rufifacies (Macquart): A Case for Myiasis" Forensic Sciences 5, no. 1: 10. https://doi.org/10.3390/forensicsci5010010
APA StyleBambaradeniya, T. B., Magni, P. A., & Dadour, I. R. (2025). Linking Seasonal Temperature Variations with Laboratory-Derived Development Data for Chrysomya rufifacies (Macquart): A Case for Myiasis. Forensic Sciences, 5(1), 10. https://doi.org/10.3390/forensicsci5010010