Abstract
Forensic soil analysis is crucial in criminal investigations, necessitating robust analytical methodologies for an accurate discrimination of soil types and origins. This study explored the discrimination efficiency of thermogravimetric and differential scanning calorimetric analyses of Inceptisol, reddish Oxisol, and yellowish Oxisol soils from Brazil’s Cerrado region. Ninety air-dried soil samples collected at various locations underwent thermal analysis, focusing on mass loss of gibbsite, goethite, and kaolinite at specific temperatures. The log-transformed data were submitted to principal component analysis, nonmetric multidimensional scaling, and cluster analysis. The thermogravimetry emerged as a highly discriminatory tool, effectively delineating between soil types, and even detecting spatial variations. In contrast, the differential scanning calorimetry exhibited limited discriminatory power. The findings underscore the thermogravimetric potential as a valuable technique in soil forensics, providing critical insights into composition and spatial variations essential for criminal investigations. This study highlights the need for further research to explore synergies with complementary techniques, aiming to enhance forensic discrimination across diverse soil types and geographic contexts. The objective representation of results in this abstract emphasizes the significance of thermogravimetry in advancing forensic analysis of soil vestiges.
1. Introduction
The use of soil as a forensic vestige dates back nearly 150 years, but its widespread adoption has only materialized recently, fueled by advancements in soil analytical methods and equipment [1]. This evolution, though transformative, faces challenges as soil forensics remains poorly explored among scientists and forensic experts [2,3,4,5].
Forensic soil analysis attempts to correlate questioned soil samples collected from crime scenes with control samples from known locations, aiming to contribute valuable evidence to criminal investigations [2]. The richness of soil types, the adherence of soil traces to various surfaces, and the diversity of analytical methods for characterizing and individualizing soil vestiges underline the potential of soils as forensic evidence [1,2,3,4,5].
Various analytical methods employed in soil science have found applicability in soil forensics [1,3], and early methods, such as color analysis, laid its foundation. In following years, more advanced techniques, such as microscopic features, Fourier-transformed infrared spectroscopy (FTIR), X-ray diffractometry (XRD), X-ray fluorescence spectroscopy (XRF), laser-induced breakdown spectroscopy (LIBS), scanning electron microscopy/energy dispersive X-ray spectroscopy (SEM/EDX), thermogravimetry (TG), and differential scanning calorimetry (DSC), have evolved to address the complex demands of forensic investigations [6,7,8].
However, unlike more standardized forensic analyses like DNA and fingerprinting, soil forensics lacks a universally accepted analytical method, resulting in a diverse array of approaches [1]. The absence of a standardized protocol demands the exploration of multiple methods, each aiming to transform soil traces into forensic evidence [1,9]. While some studies focus on theoretical frameworks and sampling protocols [6,8], there have been noteworthy case reports demonstrating the practical application of soil forensics in criminal investigations [1,2,10,11].
The outstand impact of soil forensics is evident in cases reported from countries such as the Netherlands, Italy, Spain, Australia, Brazil, and Scotland [1,2,10,11]. Remarkable achievements include chromatography and mass spectrometry that aided in solving crimes in Scotland, where soil organic matter matched from getaway vehicles to a remote farm track, and soil microbial DNA contributed to the conviction of a suspect 37 years after committing a double murder [1]. In Australia, soil analysis played a crucial role in a complex double murder by identifying similarities between soil vestiges adhering to a shovel and from a quarry [2].
Soil forensics started in Brazil in the late 2000s [8], and it has already witnessed the application of this discipline in criminal investigations [10,11]. Notable instances include the analysis of a shovel encrusted with Inceptisol soil particles at a crime scene and the differentiation of stolen safe locations through sequential extraction of soil minerals followed by X-ray fluorescence, X-ray diffraction, and thermogravimetric analyses [10,11].
The discriminative power of analytical techniques in soil forensics varies across soils. X-ray diffraction (XRD), for instance, has accurately discriminated between mock forensic soil samples of Oxisol and Inceptisol in Brazil, with varying effectiveness according to soil type, being more robust for Inceptisol than Oxisol [6]. In the same study, the combination of XRD and hyperspectral imaging color data demonstrated the highest discrimination accuracy. At the same time, the pairing of differential scanning calorimetry (DSC) and thermogravimetric (TG) data exhibited the lowest accuracy among the used analytical techniques [6]. However, TG/DSC presents a high potential in soil forensics because this technique can characterize soil minerals and demands tiny samples for the thermal analysis (5–10 mg) [12]. Thermal analysis of clay minerals gained visibility in the first half of the twentieth century and entered the forensic sciences afterward [12].
Minerals are one the main constituents of soils, they imprint relatively permanent features in them, and these characteristics are essential in forensic investigations [2,6,8,13]. Thermal analysis techniques like TG and DSC play a paramount role in the mineralogical characterization of soils, as minerals show physical and chemical variations in their properties when subjected to heating. TG measures changes in mass as a function of temperature variation, and it can provide important information on the mineralogical composition of soils, thanks to the presence of several thermally active phases like phyllosilicates. DSC measures the energy differences during the analysis, and the resulting thermogram provides a calorimetric analysis of the process even when sample quantities are as small as a few milligrams [13].
Brazil houses 861 known soil classes organized into thirteen soil orders [14]; such diversity enhances the possibilities of using soil vestiges in forensic investigations. Mineral soils, like Oxisol and Inceptisol, cover approximately 99% of the Brazilian territory; organic soils comprise less than 1% [14]. Given the diversity of soil classes in Brazil and the reported limitations in discrimination accuracy associated with TG and DSC [6], this study aimed to evaluate the efficiency of these thermal techniques in discriminating between soil samples from three tropical soils: Inceptisol, reddish Oxisol, and yellowish Oxisol, which together spread over 86% of the study area (Figure 1) [6,15]. Through the examination of the discriminatory potential of TG and DSC, we sought to contribute to the evolution of soil forensics and advance our understanding of the applicability of these techniques in forensic investigations.
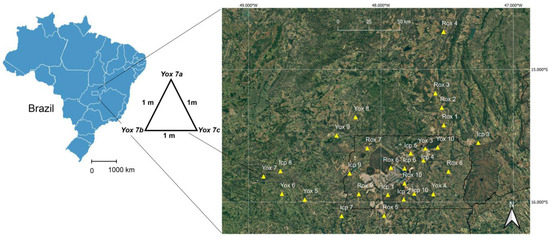
Figure 1.
Geographical distribution of soil sampling sites within the Cerrado biome of Brazil. Inceptisol samples are labeled as Icp1–Icp10, reddish Oxisol as Rox1–Rox10, and yellowish Oxisol as Yox1–Yox10.
2. Materials and Methods
2.1. Soil Sampling and Sample Preparation
We conducted soil sampling in the central region of Brazil, specifically within the neotropical savanna biome. Ten groups of triplicate samples were collected from each soil class: Inceptisol (Icp), reddish Oxisol (Rox), and yellowish Oxisol (Yox) [15] (Figure 1). Oxisol soils regionally occur on flat landscapes, are deep in profile, and represent an advanced weathering stage of tropical soils [14]. As a result, kaolinite [Al2Si2O5 (OH)] is the only remaining phyllosilicate in them. Gibbsite [Al(OH)3] and goethite [FeO(OH)] are the other main minerals in Oxisols, and the proportion of oxidized/hydrated iron differentiates Rox from Yox, among other attributes [14,15]. Inceptisols are shallow in profile, regionally appear on gentle slopes (≅8%), and are young soils not as highly weathered as Oxisols. However, gibbsite, goethite, and kaolinite are also the main minerals in Inceptisols [14,15].
The soil sampling design involved a triangular arrangement with samples positioned 1 m apart within each group, ensuring a minimum separation of 10 km between distinct groups, as shown in Figure 1. A total of ninety soil samples were collected, air-dried under shaded conditions, and passed through a 270 mesh sieve to remove sand particles ≥ 53 μm; sand has been shown to be unsuitable for forensic investigations of tropical and subtropical soils [13,16]. An eight-channel quarter was employed to homogenize samples, and three partitions were selected to obtain approximately 10 g of soil from each soil sample. The need to standardize small soil aliquots arises from soil vestiges being generally scarce in crime scenes [8]. Each set of triplicate samples was considered a repetition at its respective site, expecting these replicates to exhibit no significant differences during subsequent analyses.
2.2. Thermogravimetry (TG) and Differential Scanning Calorimetry (DSC) Analyses
Approximately 10 mg of soil sample from the 10 g aliquot were placed in ceramic crucibles and underwent thermal analysis using a Netzsch STA 449 Jupiter F3 apparatus, Selb, Germany. The heating protocol involved ramping from controlled room temperature (22 °C) to 950 °C at a rate of 10 °C min−1, with a gas flux of 20 mL min−1 under an N2 atmosphere. The apparatus conducted simultaneous thermogravimetry (TG) and differential scanning calorimetry (DSC), generating output thermograms. The dehydroxylation-induced mass reduction caused by thermal decomposition enabled the estimation of the percentual concentrations of gibbsite (Gb), goethite (Gt), and kaolinite (Kt), the predominant minerals in the selected tropical soils. In the process, mineral-bound water is removed by dehydroxylation, which causes a reduction in the mass of the analyzed samples, which can be measured from the thermogravimetric curve [13].
2.3. Chemometric Analyses
Data generated from TG and DSC analyses underwent descriptive statistic (Table 1) and log-transformation [17] (Equation (1)) before being subjected to principal component analysis (PCA), nonmetric multidimensional scaling (NMDS–Euclidean), and cluster analysis (UPGMA–K-means) using Past 4.11 software.
where Yi represents the value generated from TG and DSC analyses (Table 1).
Yi′ = log (Yi +1)

Table 1.
Means ± standard deviations for weight loss (%) of soil samples heated to between 200 °C and 600 °C, which correspond to the mass (%) of gibbsite, goethite, and kaolinite decomposed at their disintegrating temperatures (°C).
Groups of triplicate samples were randomly drawn one hundred times for comparing Yi’s values through PCA, NMDS, cluster analyses, and for calculating the discrimination efficiency (DE) of TG, DSC, and the combined TG + DSC data. The discrimination efficiency (DE) was calculated by determining the percentage of soil samples within each statistical comparison that successfully clustered in accordance with their designated group while remaining distinctly separated from other groups of triplicate samples [6,8,10,11], as follows (Equation (2)):
Equation (2) provides a quantitative measure, in percentage terms, reflecting the accuracy of the clustering process in classifying soil samples according to their specified groups, essential for evaluating the discriminatory power of the analytical methods under consideration.
3. Results
The percentages of the targeted minerals and differential scanning calorimetry (DSC) temperatures recorded during the thermal analysis (Figure 2) showed slight variation within soil sample triplicates (Table 1). Such a variation increased among triplicates, and the percentages of gibbsite (Gb) varied over ten times among Inceptisol (Icp) samples, 1.8 times among reddish Oxisol (Rox) samples, and 31 times among yellowish Oxisol (Yox) samples (Table 1). Likewise, kaolinite (Kt) and goethite (Gt) variations respectively ranged 3–5 times among Icp samples, 1.9–3.5 among Rox samples, and 9–15 times among Yox samples (Table 1). The Rox presented higher percentages of Gb and Gt than Icp and Yox, but Kt concentrations leveled between the two Oxisol soils (Rox and Yox) and remained higher than in Icp soil (Table 1; Figure S1).
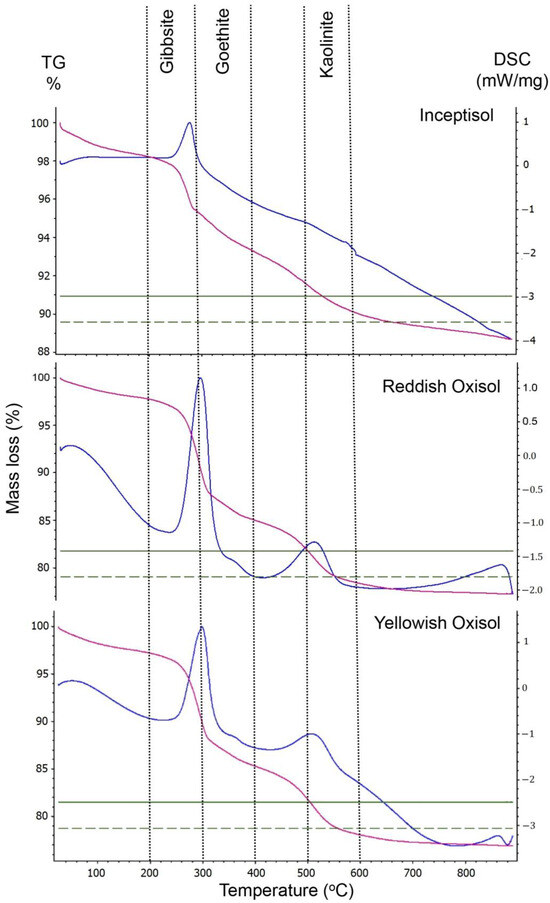
Figure 2.
Thermograms of Inceptisol, reddish Oxisol, and yellowish Oxisol submitted to thermal analysis showing mass loss of minerals (lilac curve) and differential scanning calorimetry (blue curve).
Minerals in Rox decomposed at lower temperatures than in Icp and Yox samples (Figure S1), although temperatures kept within the decomposition range for each mineral in the three soil classes (Figure 2). Differences in mineral concentrations and decomposing temperatures allowed thermogravimetry (TG) and DSC analyses of Icp, Rox, and Yox to produce data with varying discrimination potentials (DE = 22.2–100%), as assessed through multiple statistical tests (Figure 3). TG analysis, focusing on percent concentrations of Gb, Gt, and Kt, effectively grouped soil sam les based on respective soil classes when subjected to principal component analysis (PCA), nonmetric multidimensional scale (NMDS), or cluster analysis. In contrast, DSC results exhibited compromised discrimination efficiency (DE) between soil classes across the same statistical tests. The combined TG and DSC data yielded erratic statistical outcomes, inconsistently recovering to TG levels (Figure 3).
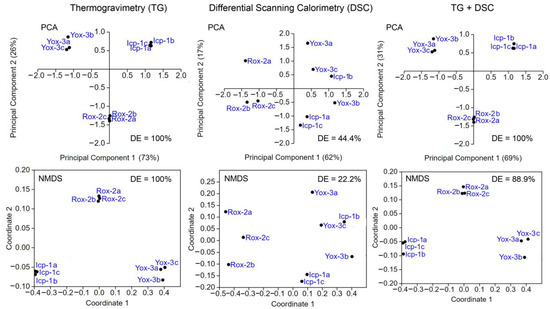
Figure 3.
Principal component analysis (PCA) and nonmetric multidimensional scale (NMDS) of thermogravimetry (TG) and differential scanning calorimetry (DSC) data for Inceptisol (Icp), reddish Oxisol (Rox), and yellowish Oxisol (Yox) samples. DE—discrimination efficiency.
Similarly, data from TG analysis successfully grouped samples of the same soil type based on their sampling locations, irrespective of the multivariate statistical test employed (DE = 100%). Conversely, DSC data and the combination of TG and DSC failed to discriminate between samples of the same soil class (DE = 22.2–66.7%; Figure 4).
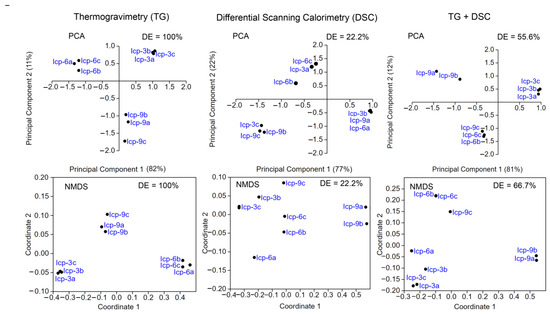
Figure 4.
Principal component analysis (PCA) and nonmetric multidimensional scale (NMDS) of thermogravimetry (TG) and differential scanning calorimetry (DSC) data for Inceptisol (Icp) samples. DE—discrimination efficiency.
Boxplot analysis (Figure 5) of one hundred DE results from multivariate tests highlighted that TG analysis of soil samples consistently achieved higher and less dispersive DE values when subjected to PCA, NMDS, and cluster analysis. In contrast, the DE values for DSC and TG + DSC data exhibited inconsistencies. Cluster analysis demonstrated superior DE values and more consistent behavior than PCA and NMDS analysis for the same data.
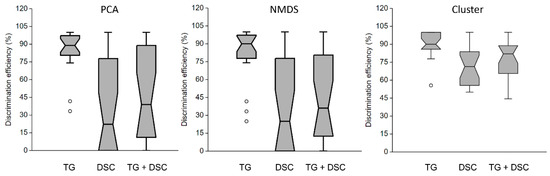
Figure 5.
Discrimination efficiency (%) among Inceptisol (Icp), reddish Oxisol (Rox), and yellowish Oxisol (Yox) samples based on thermogravimetry (TG) and differential scanning calorimetry (DSC) analyses. Evaluated using principal component analysis (PCA), nonmetric multidimensional scale (NMDS), and cluster analysis (K-means).
The role of soil type in discrimination efficiency was evident, with Icp samples showing better discrimination efficiency from each other than Rox and Yox samples when TG data underwent PCA and NMDS. Cluster analysis narrowed the DE gap among the three soil classes, although the DE among Icp samples remained less dispersive than among Rox and Yox samples (Figure 6).
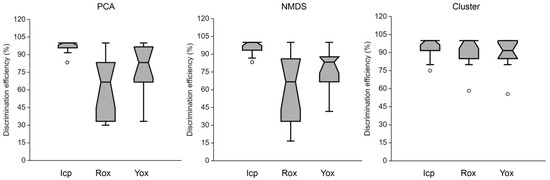
Figure 6.
Discrimination efficiency (%) among samples of the same soil type (Inceptisol–Icp, reddish Oxisol–Rox, and yellowish Oxisol–Yox) based on thermogravimetry (TG) analysis. Assessed using principal component analysis (PCA), nonmetric multidimensional scale (NMDS), and cluster analysis (K-means).
A slight advantage was observed in adopting PCA for discriminating between Icp samples compared to NMDS and cluster analysis. Cluster analysis of TG data more effectively discriminated Rox and Yox samples than PCA and NMDS (Figure 7).
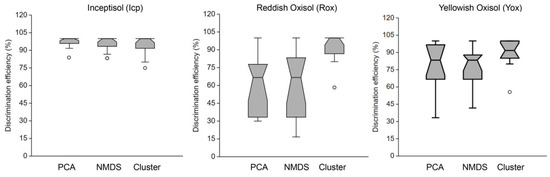
Figure 7.
Discrimination efficiency (%) of principal component analysis (PCA), nonmetric multidimensional scale (NMDS), and cluster analysis (K-means) based on thermogravimetry (TG) analysis for Inceptisol (Icp), reddish Oxisol (Rox), and yellowish Oxisol (Yox).
In the one hundred iterations of soil group draws (Tables S1 and S2), considering two (six samples) to 30 groups of triplicate samples (90 samples), the results indicated a linear decrease in DE as the number of soil samples increased within the same PCA, NMDS, and cluster analysis (Figure 8).
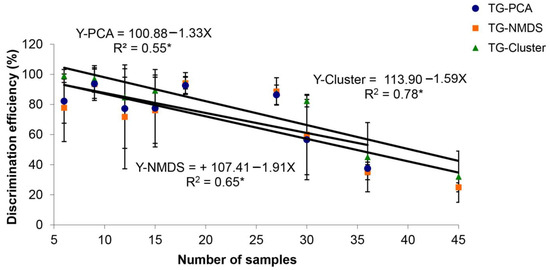
Figure 8.
Regression of discrimination efficiency (%) on the number of soil samples used in multivariate analyses: principal component analysis (PCA), nonmetric multidimensional scale (NMDS), and cluster analysis (K-means). * p ≤ 0.05.
4. Discussion
When submitted to the thermal analysis, thermogravimetry (TG) and differential scanning calorimetry (DSC) curves represent the mineralogical transformations in soil samples at respective temperatures (Figure 2). The removal of crystal-adsorbed and structural water are the main outcomes resulting from thermal decomposition of minerals [13]. Water in hydrate minerals is released according to different kinetics and mechanisms, depending on the type of mineral examined [13,18]. Mass losses up to 110 °C regard the adsorbed water onto mineral surfaces, which does not belong to the minerals’ structure (Figure 2). In this study, the thermal dehydroxylation, which removes structural water from minerals [18], started at approximately 200 °C with gibbsite (Gb) decomposition, followed by goethite (Gb) at 300 °C–400 °C and kaolinite at 500 °C–600 °C (Figure 2; Table 1). The measured mass losses along DSC values were consistent with the thermal behavior of soil minerals, although minerals can exhibit structural modifications without mass changes [13] on the DSC curve.
In thermal analysis, soil samples lose mass due to the decomposition of their minerals, and the weight loss at a specific temperature is proportional to the lost mass of a given mineral [13].
Gb, Gt, and Kt are the main minerals in weathering tropical soils [19,20], which develop under warm and rainy climates [21,22]. These minerals significantly influence nutrient cycling, water retention, and soil fertility, and they have also been used to distinguish soil samples collected at different locations [23]. Such minerals appear in Inceptisol (Icp), reddish Oxisol (Rox), and yellowish Oxisol (Yox) at different concentrations [24] due to specific site conditions [25], which enable Gb, Gt, and Kt to be used as forensic vestiges [26,27]. Although TG and DSC analyses target the same minerals in Icp, Rox, and Yox, the results of these techniques revealed distinctive discrimination potentials, shedding light on the efficiency and limitations of these techniques in soil forensics (Figure 3, Figure 4 and Figure 5).
Kt was the only analyzed phyllosilicate in this study. Contrary to Gb and Gt, its thermal decomposition yielded another mineral, metakaolinite (Al2O7Si2), which did not lose further mass even at 1000 °C [13]. The percent concentrations of Kt in the two Oxisol soils were twice as much as in the Icp (Table 1; Figure S1), which helped to discriminate Oxisol samples from Icp samples (Figure S1). Kt, Gb, and Gt concentrations acquired from TG analysis also discriminated between samples of the same soil class collected from different sites (Figure 1). At the same time, DSC data could not do the same (Figure 4). DSC is a thermal analysis technique that measures the heat flow associated with physical and chemical changes occurring in a sample as a function of temperature or time [12]. It can provide information about material decomposition, such as the loss of minerals in soils. Overall, the DSC technique offers insights into various materials’ thermal behavior and characteristics [12], but it has not worked efficiently in the discrimination of soil samples of this work based on the statistical tests used (Figure 3 and Figure 4).
4.1. Discrimination Potential of TG and DSC Analyses
TG analysis, with a focus on the percent concentrations of Gb, Gt, and Kt, has demonstrated robust discrimination among soil classes when subjected to principal component analysis (PCA), nonmetric multidimensional scale (NMDS), and cluster analysis (DE = 100%; Figure 3). This robust discrimination aligns with the known mineralogical differences among these soils, providing a promising way for soil type characterization. Conversely, DSC analysis exhibited compromised discrimination efficiency (DE = 22.2–44.4%) between soil classes across the same statistical tests, highlighting its limitations in distinguishing soil types based on thermal characteristics (Figure 3). The inconsistency observed in the combined TG and DSC data further underscores the challenges of integrating these techniques into forensic soil discrimination [6], since the combination of TG and DSC data has not improved DE values compared to the exclusive use of TG data (Figure 3, Figure 4 and Figure 5). Therefore, the type of variables rather than their quantity has played a more significant role in soil forensics [6,8].
4.2. Spatial Discrimination and Soil Type Influence
Soil class and dataset composition have influenced the discriminatory power of TG data (Figure 6 and Figure 7), as previously reported in other studies [6,8]. There has been no unanimity in the techniques that best discriminate between soil vestiges or in which particular sets of techniques represent a rigorous characterization of soil materials [28], although the percent concentrations of Gb, Gt, and Kt acquired from TG analysis discriminated between Icp, Rox, and Yox samples (Figure 3).
The spatial discrimination achieved via TG analysis, grouping samples of the same soil type based on their sampling locations, underscores its sensitivity to subtle variations in soil composition attributable to geographic differences (DE = 100%; Figure 4). This feature enhances its potential utility in forensic investigations where the origin of soil samples is a critical parameter. In contrast, DSC data and the combination of TG and DSC struggled once more to efficiently discriminate between samples of the same soil class, suggesting limited spatial sensitivity in these methods (DE = 22.2–66.7%; Figure 4). Soil minerals have their own crystal structure and chemical composition [20], and another study has shown the potential of mineral structure to discriminate between Inceptisol and Oxisol soils in Brazil [6].
The boxplot analysis of DE results (Figure 5) reinforces the superior discriminatory power of TG analysis compared to DSC. The more consistent and higher DE values obtained from cluster analysis further emphasize the robustness of TG in revealing distinctions among soil classes. This finding aligns with the mineralogical variations inherent in different soils, where TG can effectively capture thermal responses associated with specific mineral components.
4.3. Soil Type-Specific Discrimination
A few analytical techniques can discriminate soils that are similar but not identical [6], and consequently, multimodal analytical approaches have been frequently applied in soil forensics [8,29,30]. The influence of soil type on discrimination efficiency has become apparent when comparing Icp samples with Rox and Yox samples. TG analysis, when subjected to PCA and NMDS, displayed superior discrimination among Icp samples, suggesting its effectiveness in capturing the heterogeneity within this soil class (Figure 6). However, cluster analysis balanced the DE gap among the three soil classes, indicating that each statistical approach has its merits in specific contexts (Figure 6). The relatively less dispersive DE among Icp samples compared to Rox and Yox samples highlighted the soil-specific nuances that impact discriminatory outcomes.
The soils (Icp, Rox, and Yox) used in this study developed from different parent materials and geomorphological environments [31,32], and their percent concentrations of Gb, Gt, and Kt (Figure 3, Figure 4, Figure 5 and Figure 6) could efficiently discriminate their origin locations. Gb, Gt, and Kt however have been more reliable in distinguishing samples of Icp than Rox and Yox (Figure 7), as reported in another study [6]. Icp characteristics vary more along the terrain than Rox and Yox [6,31,32], and therefore, samples from the first soil class have been easier to discriminate for forensic purposes than samples of the last two soil classes [6].
Topography is vital in pedogenesis and other associated attributes such as soil mineralogy [28,33]. In the region where the soil samples were collected, Oxisol spreads on flat terrains (<5% slope), and Icp occurs on slopes ≅ 8%. Icp is still undergoing pedogenesis, while Oxisol is an old and highly weathered soil [31,32]. Therefore, it is expected to have a higher mineral variation among Icp samples than among Rox and Yox samples [34,35]. From the forensic point of view, Icp vestiges may provide more information for criminal investigations than Oxisol can (Figure 7).
4.4. Statistical Approach and Sample Size Impact
The multivariate analysis has revealed that it is possible to distinguish samples of the same soil class according to the site they were collected [36,37]. However, the interaction between multivariate test (PCA, NMDs, and cluster analysis) and soil type has varied. There has been a variation in the efficiency of PCA, NMDS, and cluster analysis in discriminating between Icp samples, and cluster analysis has worked better for Rox and Yox samples than PCA and NMDS (Figure 7). Therefore, the choice of statistical approach significantly influenced discrimination outcomes, with PCA slightly outperforming NMDS in discriminating between Icp samples (Figure 7). Cluster analysis, particularly with TG data, demonstrated superior discrimination among Rox and Yox samples compared to PCA and NMDS (Figure 7). The observed variation emphasizes the importance of selecting appropriate statistical methods tailored to specific objectives in soil forensic analyses.
Intriguingly, the multivariate analyses of smaller sets of soil groups have consistently better discriminated samples than sets of high numbers of the same (Figure 8). The regression analysis on discrimination efficiency concerning sample size revealed a linear decrease as the number of soil samples increased within the same multivariate analysis (Figure 8). A study conducted in southern Brazil on Icp samples collected from five locations initially selected 56 variables obtained from soil clays’ physical, chemical, and mineralogical analyses. It concluded that a set composed of only sixteen chemical variables could more efficiently discriminate soil samples than the whole dataset [8]. These results suggest that larger sample sizes might introduce complexities that reduce the discriminatory power of the selected statistical method.
5. Conclusions
This study has shed light on the distinct discrimination potentials of thermogravimetry (TG) and differential scanning calorimetry (DSC) analyses of three tropical soils aimed at forensic investigation. TG analysis has emerged as a robust tool, particularly capturing spatial variations of soil sample, and demonstrating soil type-specific discrimination. DSC has exhibited limitations in discrimination efficiency, especially compared to TG. The integration of TG and DSC data has presented challenges with erratic outcomes. The influence of soil class on discrimination outcomes, the impact of statistical approaches, and the nuanced relationship between sample size and discrimination efficiency have underscored the multifaceted nature of soil forensic analyses. Further research is necessary to refine methodologies and enhance the reliability of thermal analysis techniques in diverse forensic scenarios.
Supplementary Materials
The following supporting information can be downloaded at: https://www.mdpi.com/article/10.3390/forensicsci4010007/s1, Figure S1: means and standard deviations of gibbsite, goethite, kaolinite, and respective decomposition temperatures of these minerals in Inceptisol, reddish Oxisol, and yellowish Oxisol submitted to thermal analysis. Table S1: principal component analysis (PCA), non-metric multidimensional scale (NMDS), and cluster data for selected samples, illustrating the discrimination efficiency of each chemometric analysis; Table S2: principal component analysis (PCA), non-metric multidimensional scale (NMDS), and cluster data for selected samples, demonstrating the discrimination efficiency of thermogravimetry (TG) and differential scanning calorimetry (DSC) techniques.
Author Contributions
R.S.C.: Conceptualization, writing methodology, data curation, writing-original draft preparation; R.E.R.: Conceptualization, soil sampling, visualization; M.P.B.: thermogravimetry (TG) and differential scanning calorimetry (DSC) analyses, validation; E.F.J.: Conceptualization, funding acquisition, data curation, supervision; J.d.A.G.: Funding acquisition, writing-original draft preparation, review and editing, manuscript submission. All authors have read and agreed to the published version of the manuscript.
Funding
This research was supported by FAP/DF (Fundação de Apoio à Pesquisa do Distrito Federal, Brazil) and FPCIAA (Fundação de Peritos em Criminalística Ilaraine Acácio Arce, Brazil), grant number PIBITI-FPCIAA 2022-2023.
Institutional Review Board Statement
Not applicable.
Informed Consent Statement
Not applicable.
Data Availability Statement
Data is contained within the article or Supplementary Material.
Acknowledgments
The authors are grateful to the local police department—PCDF (Polícia Civil do Distrito Federal, Brazil) and to its forensic experts for their precious collaboration with this research.
Conflicts of Interest
The authors declare no conflicts of interest.
References
- Wald, C. Forensic Science: The soil sleuth. Nature 2015, 520, 422–424. [Google Scholar] [CrossRef]
- Fitzpatrick, R.W.; Raven, M.D. How pedology and mineralogy helped solve a double murder case: Using forensics to inspire future generations of soil scientists. Soil Horiz. 2012, 53, 1–16. [Google Scholar] [CrossRef]
- Woods, B.; Lennard, C.; Kirkbride, K.P.; Robertson, J. Soil examination for a forensic trace evidence laboratory—Part 1: Spectroscopic techniques. Forensic Sci. Int. 2014, 245, 187–194. [Google Scholar] [CrossRef] [PubMed]
- Woods, B.; Lennard, C.; Kirkbride, K.P.; Robertson, J. Soil examination for a forensic trace evidence laboratory—Part 2: Elemental Analysis. Forensic Sci. Int. 2014, 245, 195–201. [Google Scholar] [CrossRef] [PubMed]
- Woods, B.; Lennard, C.; Kirkbride, K.P.; Robertson, J. Soil examination for a forensic trace evidence laboratory—Part 3: A proposed protocol for the effective triage and management of soil examinations. Forensic Sci. Int. 2016, 262, 46–55. [Google Scholar] [CrossRef]
- Corrêa, R.S.; Melo, V.F.; Abreu, G.G.F.; Sousa, M.H.; Chaker, J.A.; Gomes, J.A. Soil forensics: How far can soil clay analysis distinguish between soil vestiges? Sci. Justice 2018, 58, 138–144. [Google Scholar] [CrossRef]
- Cox, R.J.; Peterson, H.L.; Young, J.; Cusik, C.; Espinoza, E.O. The forensic analysis of soil organic by FTIR. Forensic Sci. Int. 2000, 108, 107–116. [Google Scholar] [CrossRef]
- Melo, V.F.; Barbar, L.C.; Zamora, P.G.P.; Schaefer, C.E.; Cordeiro, G.A. Chemical, physical and mineralogical characterization of soils from the Curitiba Metropolitan Region for forensic purpose. Forensic Sci. Int. 2008, 179, 123–134. [Google Scholar] [CrossRef] [PubMed]
- Musse, J.O.; Olimpio, A.; Saad, K.; Andrade, E.L.; Capeola, C.N.; Reis, M.J.; Ocon, C.A.; Isabella, A.P.J.; Pitanga, F.S.M.; Leal, M.R.; et al. Protocol validation for the preservation of forensic traces in health services. Rev. Contrib. A Las Cienc. Soc. 2023, 16, 30589–30604. [Google Scholar] [CrossRef]
- Testoni, S.A.; Melo, V.F.; Dawson, L.A.; Malakoski, J.; Cunico, E.; Junqueira Neto, J.E. The use of a sequential extraction technique to characterize soil trace evidence recovered from a spade in a murder case in Brazil. J. Forensic Sci. 2020, 65, 1921–1934. [Google Scholar] [CrossRef]
- Testoni, S.A.; Melo, V.F.; Dawson, L.A.; Salvador, F.A.S.; Prandel, L.V. Evaluation of forensic soil traces from a crime scene: Robbery of a safety deposit box in Brazil. Geol. Soc. 2021, 492, 181–196. [Google Scholar] [CrossRef]
- Chauhan, R.; Kumar, R.; Diwan, P.K.; Sharma, V. Thermogravimetric analysis and chemometric based methods for soil examination: Application to soil forensics. Forensic Chem. 2020, 17, 100191. [Google Scholar] [CrossRef]
- Mercurio, M.; Izzo, F.; Langella, A.; Sarkar, B. Simultaneous Thermal Analysis (STA): A Powerful Tool for Forensic Investigation of Geomaterials. In Mineralogical Analysis Applied to Forensics—A Guidance on Mineralogical Techniques and Their Application to the Forensic Field; Mercurio, M., Langella, A., Di Maggio, R.M., Cappelletti, P., Eds.; Springer Nature: Cham, Switzerland, 2022; pp. 193–224. [Google Scholar] [CrossRef]
- Santos, C.P.; Santos, A.J. Estudo do Comportamento Térmico de Materiais Argilosos a Diferentes Taxas de Aquecimento; Org. Andrade, M.C.N., Ed.; Termodinâmica: Prática e sem mistérios; Editora Cientifica Digital: Guaruja, Brazil, 2021; pp. 128–143. [Google Scholar] [CrossRef]
- Soil Survey Staff. Soil taxonomy—A basic system of soil classification for making and interpreting soil surveys. In Agriculture Handbook; Natural Resources Conservation Service, U.S. Department of Agriculture: Washington, DC, USA, 1999; Volume 436. [Google Scholar]
- Melo, V.F.; Testoni, S.A.; Dawson, L.A.; Salvador, F.A.S. Sand fraction is not suitable for forensic investigations in subtropical soils. Braz. J. Soil Sci. 2020, 44, e0190174. [Google Scholar] [CrossRef]
- Legendre, P.; Legendre, L. Numerical Ecology: Developments in Environmental Modelling, 2nd ed.; Elsevier: Amsterdam, The Netherlands, 1998. [Google Scholar]
- Santos, H.G.; Jacomine, P.K.T.; Anjos, L.H.C.; Oliveira, V.A.; Lumbreras, J.F.; Coelho, M.R.; Almeira, J.A.; Araújo Filho, J.C.; Oliveira, J.B.; Cunha, T.J.F. Sistema Brasileiro de Classificação de Solos, 5th ed.; Editora Embrapa Solos: Rio de Janeiro, France, 2018. [Google Scholar]
- Costa, A.C.S.; Bigham, J.M.; Tormena, C.A.; Pintro, J.C. Clay mineralogy and cation exchange capacity of Brazilian soils from water contents determined by thermal analysis. Thermochim. Acta 2004, 413, 73–79. [Google Scholar] [CrossRef]
- Melo, V.F.; Castilhos, R.M.; Pinto, L.F.S. Reserva mineral do solo. In Química e Mineralogia do Solo: Parte I—Conceitos Básicos, 1st ed.; Melo, V.F., Alleoni, L.R., Eds.; Sociedade Brasileira de Ciência do Solo: Viçosa, Brazil, 2009; Volume 1, pp. 251–332. [Google Scholar]
- Brady, N.C.; Weil, R.R. The Nature and Properties of Soils; Prentice-Hall: Upper Saddle River, NJ, USA, 2002. [Google Scholar]
- White, R. Principles and Practice of Soil Science: The Soil as a Natural Resource, 4th ed.; Wiley Blaclwell: Upper Saddle River, NJ, USA, 2005. [Google Scholar]
- Testoni, S.A.; Prandel, L.V.; Melo, V.F.; Dawson, L.A.; Da Silva Salvador, F.A. Conjunctive use of synchrotron X-ray diffraction and Rietveld refinement in Fe-oxide clays for forensic applications. J. Forensic Sci. 2022, 67, 2020–2031. [Google Scholar] [CrossRef]
- Bruand, A.; Reatto, A. Morphology, chemical composition and origin of 2:1 phyllosilicates in Bw horizons of latosols of the Brazilian Central Plateau: Contribution to the discussion of the microgranular structure origin. Comptes Rendus Géosci. 2022, 354, 159–185. [Google Scholar] [CrossRef]
- Pirrie, D.; Dawson, L.A.; Graham, G. Predictive geolocation: Forensic soil analysis for provenance determination. Episodes 2017, 40, 141–147. [Google Scholar] [CrossRef]
- Fitzpatrick, R.W.; Raven, M.; Self, P. The role of pedology and mineralogy in providing evidence for 5 crime investigations involving a wide range of earth materials. Episodes 2017, 40, 148–156. [Google Scholar] [CrossRef]
- Testoni, S.A.; Silva, A.S.; Lima, N.; Aguiar, M.; Santos, R.S.; Leitzke, A.; Miguel, P.; Camargo, F.A.O.; Carreno, N.L.V.; Mariotti, K.C.; et al. Discrimination of soil collected in Pelotas, Rio Grande do Sul, for forensic purposes. Rev. IFES Ciência 2023, 9, 1–18. [Google Scholar] [CrossRef]
- Fitzpatrick, R.W.; Donnelly, L.J. An introduction to forensic soil science and forensic geology: A synthesis. Geol. Soc. 2021, 492, 1–32. [Google Scholar] [CrossRef]
- Kumar, R.; Sharma, V. Chemometrics in forensic science. Trends Anal. Chem. 2018, 105, 191–201. [Google Scholar] [CrossRef]
- Newland, T.G.; Pitts, K.; Lewis, S.W. Multimodal spectroscopy with chemometrics: Application to simulated forensic soil casework. Forensic Chem. 2023, 33, 100481. [Google Scholar] [CrossRef]
- Martins, E.S.; Reatto, A.; Abílio de Carvalho, O.; Guimarães, R.F. Evolução Geomorfológica do Distrito Federal; Documento 122; Embrapa Cerrados: Planaltina, Brazil, 2004; 57p. [Google Scholar]
- Reatto, A.; Bruand, A.; Martins, E.S.; Muller, F.; Silva, E.M.; Carvalho, O.A., Jr.; Brossard, M. Variation of the kaolinite and gibbsite content at regional and local scale in Latosols of the Brazilian Central Plateau. Comptes Rendus Géosci. 2008, 340, 741–748. [Google Scholar] [CrossRef]
- Barbosa, I.O.; Lacerda, M.P.C.; Bilich, M.R. Pedogeomorphlogical relations in the Chapadas Elevadas of the Distrito Federal, Brazil. Braz. J. Soil Sci. 2009, 33, 1373–1383. [Google Scholar] [CrossRef][Green Version]
- Alleoni, L.R.F.; Camargo, O.A.; Casagrande, J.C.; Soares, M.R. Química dos solos altamente intenperizados. In Química e Mineralogia do Solo, Parte II—Aplicações; Melo, V.F., Alleoni, L.R.F., Eds.; Sociedade Brasileira de Ciência do Solo: Viçosa, Brazil, 2009; pp. 382–447. [Google Scholar]
- Ramos, P.V.; Inda, A.V.; Barrón, V.; Siqueira, D.S.; Marques Júnior, J.; Teixeira, D.B. Color in subtropical Brazilian soils as determined with a Münsell chart and by diffuse reflectance spectroscopy. Catena 2020, 193, 104609. [Google Scholar] [CrossRef]
- Guo, H.; Wang, P.; Li, Y.; Hu, C.; Zheng, J.; Mei, H.; Zhu, J.; Fan, S.; Zhong, Q. Mineralogical and elemental data for soil discriminating and geolocation tracing. Sci. Justice 2022, 62, 76–85. [Google Scholar] [CrossRef]
- Matheron, G. Principles of geostatistics. Econ. Geol. 1963, 58, 1246–1266. [Google Scholar] [CrossRef]
Disclaimer/Publisher’s Note: The statements, opinions and data contained in all publications are solely those of the individual author(s) and contributor(s) and not of MDPI and/or the editor(s). MDPI and/or the editor(s) disclaim responsibility for any injury to people or property resulting from any ideas, methods, instructions or products referred to in the content. |
© 2024 by the authors. Licensee MDPI, Basel, Switzerland. This article is an open access article distributed under the terms and conditions of the Creative Commons Attribution (CC BY) license (https://creativecommons.org/licenses/by/4.0/).