1. Introduction
Stature estimation is an important aspect of biographic information across sub-disciplines of biological anthropology. In forensic anthropology, stature is used to help identify missing individuals [
1,
2]. In paleoanthropology, it offers a means to estimate life history parameters from body size estimations of human fossil specimens [
3,
4]. In bioarchaeology, it can also provide a measure of living height that supports past osteobiographies [
5] and interpretations of health and well-being [
6]. Stature is routinely estimated for adult individuals, but in children, it is often not estimated because age is a more determinant aspect of forensic identification or may add unnecessary error in growth studies of archaeological populations. For example, the estimation of stature relies on data that can also be used to estimate age—typically long bone lengths. Relative to age, in a medico-legal investigation, the height of the child is less commonly known or can change by an unpredictable amount between the time it is last measured, the time the child goes missing, and/or the time of death. Thus, the estimation of age is considered more reliable and is given more importance in the identification process. However, in some cases stature has been useful to, for example, distinguish between the remains of two or more children of the same dental age [
7]. In studies of archaeological samples, skeletal growth profiles often rely on a long bone length as a proxy for height and dental development as an indicator of chronological age [
8,
9]. Replacing a long bone length for a stature estimate in these profiles will add an unnecessary amount of error associated with the stature estimation, and thus, many researchers prefer to use the raw long bone lengths directly. Nonetheless, a stature estimate can be useful for either single individuals or samples, as stature is more directly comparable with modern living children [
10,
11], and osteobiographies often rely on other personal features, including stature, to provide a picture of the individual [
12].
There are currently few child stature estimation methods, which is very likely the result of the scarcity of data sources. To the best of our knowledge, available methods include those of Telkkä et al. [
13], Feldesman [
14], Smith [
15], Robbins Schug et al. [
16], Brits et al. [
17], and Ruff [
18], all of which rely on samples of living children where long bone lengths have been measured from radiographs and standing height is measured directly. Kimura [
19] provides a similar stature estimation method but, in comparison, relies on the radiographic length of the second metacarpal. With the exception of Feldesman [
14], who uses the femur-to-stature ratio to estimate stature, all of the remaining methods depend on the strong relationship between long bone length and stature modeled via regression. Because of the scarcity of data sources, most methods are based on longitudinal height data and long bone radiographs taken from the children of the Denver Growth Study, apart from the Telkkä et al. [
13], Brits et al. [
17] and Kimura [
19] methods, which rely on cross-sectional samples of Finnish, South African, and Japanese children, respectively. Feldesman [
14] also included two other similar longitudinal growth studies, one from the Harvard School of Public Health Study and the other from British school children. While these methods have the undisputable merit of providing the few reliable means to estimate stature from long bone lengths in children, there are several downsides to their use.
Perhaps the most significant drawback to a large portion of these methods is that they rely on the Denver Growth Study, which is comprised of a longitudinal cohort of healthy middle- to upper-class North American children measured between the years of 1941 and 1967. Together with the Harvard School of Public Health (Feldesman, [
14]) and the Finnish sample (Telkkä et al. [
13]), these samples include a disproportionate number of higher socioeconomic class children whose growth trajectory might not be representative of the general population. The Denver Growth Study was carried out more than 50 years ago, and it is unclear whether the stature of these children can be considered representative of contemporary well-off groups [
20,
21]. It is also uncertain whether the Denver Growth Study children can be said to represent children from more disadvantaged groups in developed countries or even children from developing nations, where medico-legal death investigations involving children are unfortunately more common or over-represented [
22]. Similarly, the Denver Growth Study cannot be said to represent children in ecologically diverse populations from prehistoric or historic periods studied by bioarchaeologists. Additionally, because the Denver Growth Study is longitudinal, the variation in stature-for-long bone length sampled is smaller and representative of only a handful of children.
Further to these issues, there are concerns about whether long bone lengths measured in radiographs have been corrected for magnification (parallax) in some studies [
18]. In addition to sample-specific problems, there are also several issues due to modeling approaches used to devise the stature estimation methods. Most of these methods also require age to be estimated before the appropriate age-specific regression equation is selected. Using age-specific equations is meant to account for the changes seen in linear proportions of limbs and differing growth trajectories from infancy to adolescence. However, for individuals of unknown age, this step adds intermediate error that is not reflected in the final prediction and associated prediction interval. Comparatively, some of these methods have shown less concern to account for sex differences in growth after puberty. Finally, because of the background of the samples used in these methods, many researchers might feel tempted to consider these methods specific to “White” or “European-American”, particularly privileged, children and to deem them of limited use among other population groups in other nations. However, under similar social circumstances, there is little to no evidence in support of “racial-“, ancestry-, or other similarly defined population-specific differences in the relationship between stature and long bone length and growth in children [
23]. In adults, a generic stature estimation equation that does not require an unknown to first be assigned to a given “racial”, ancestry, or national group provides the best results more often than a population-specific equation [
2,
24].
The goal of this paper is to provide a more generic and inclusive set of regression equations for the estimation of stature in children from long bone lengths, which do not rely on knowing the sex, the age at death, or assigning individuals to any
a priori defined groups, however the user wants to define them. In adults, Albanese and co-workers [
2,
24] have already demonstrated that group affiliation, age, and sex make little, if any, contributions to the increased reliability of stature estimation methods. Developing more generic and inclusive equations requires sampling a diversity of children and as much variation in stature-for-long-bone-length as possible. Unfortunately, and as mentioned above, samples where stature and long bone lengths can be collected from a series of documented stature, sex, and age children are very scarce. This paper is a first attempt at sampling a wide range of variation by using multiple datasets that include a range of variation in children to model the relationship between stature and long bone length. This sample includes a historical and a modern sample of children representing various groups over time and data collected from both real and virtual skeletons. Additionally, two other smaller but similarly diverse samples, where data were likewise collected from real and virtual skeletons, were obtained to test these stature estimation equations. The availability of these samples provides the unique opportunity to develop and test a set of new, more general, and inclusive stature estimation methods that can be used in a diversity of contexts and for a variety of purposes.
2. Materials and Methods
A model sample that includes 142 children under 12 years of age (69 female and 72 male) was used to develop the stature estimation equations. Thirty-one of these (17 female and 14 male) are comprised of skeletal remains from the Hamann–Todd Human Osteological Collection (HTHOC) curated at the Cleveland Museum of Natural History, Ohio, USA, and the remaining 111 individuals (52 female and 59 male) consist of full body CT-scans obtained from the New Mexico Decedent Image Database (NMDID), USA [
25]. The stature estimation equations were tested on a sample of 14 individuals of the same age range (4 female and 10 male). Seven of these individuals (1 female and 6 males) are comprised of skeletons in the Lisbon Collection (LC) cared for at the National Museum of Natural History and Science in Lisbon, Portugal, and the remaining 7 (3 females and 4 males) consist of full body CT-scans obtained from the Victoria Institute of Forensic Medicine, in Victoria, Australia (VIFM). The VIFM individuals were age-matched to the LC individuals, as only a portion of the VIFM children were selected to meet the much smaller sample size than the LC dataset, which was used in its entirety. See
Table 1 for details about the range and distribution of the ages in the model and test samples.
All four datasets (HTHOC, NMDID, LC, and VIFM) include children of documented sex, age-at-death, date of birth and death, and cadaver length, and also include other biographic data, such as cause of death and assigned “race” [
1,
23,
26,
27,
28]. Decimal ages were calculated from birth and death dates for all individuals in the NMDID, LC, and VIFM datasets. For the HTHOC, some children were missing birth records, and the most recent full year of age was recorded as the known age. For those individuals, the decimal age was calculated as being halfway between that age and the next by adding 0.5 years to their age.
The datasets in the model and test samples include a socioeconomically and temporally diverse group of North American, Australian, and European children. Dates of death for children in the HTHOC dataset range from 1917 to 1935. The collection includes the skeletons of individuals who have been identified as “Black”, “Negro”, “Colored”, “African”, or “White” Americans of low socioeconomic status who died mostly in the Cleveland area [
23]. In the NMDID dataset, dates of death range from 2011 to 2017 and include a variety of socioeconomic status children, mostly underprivileged, who died in the state of New Mexico, USA, and whose death was subjected to medico-legal death investigation [
27,
28]. In the NMDID dataset, individuals were originally assigned to “White”, “Black”, or “Native American” “race” groupings, with an additional field for “Hispanic” ethnicity as coded by the medicolegal institution. The LC dataset includes the remains of low to middle-socioeconomic children who were autopsied and whose remains were exhumed from local cemeteries in the city of Lisbon, Portugal, having died between 1957 and 1972 [
1]. Children in the VIFM dataset is comprised of children who died in the state of Victoria, Australia, and whose deaths were also subjected to medico-legal death investigations between 2011 and 2017 [
27,
28].
Table 1 displays the sample size breakdown by dataset, age, and sex.
In model-building and testing, we opted to combine data from individuals who grew up in very different biocultural environments in order to maximize the range of variation included in each sample. Both the HTHOC and LC are historic datasets considered to include children who lived under adverse living conditions and who are moderately to severely stunted [
23] and thus are significantly shorter for age compared to a modern reference standard. In comparison, the NMDID and VIFM datasets can be said to include “normal” modern children who lived under more favorable conditions to HTHOC and LC and do not show significant height-for-age deficits relative to a modern standard [
27,
28]. Thus, by pooling the HTHOC and NMDID samples, we created a model sample that incorporated a greater range of biological variation than would be present in either of those groups alone and reflected a range of social experiences of growth.
In all four datasets, stature was taken as cadaver length, which was available from autopsy records, except for the HTHOC dataset. For these children, the length of the cadaver was measured in a suspended vertical position, as described by Todd and Lindala [
29]. In the NMDID, LC, and VIFM datasets, the cadaver was measured in a supine position, from vertex to heel, using a measuring tape, and with the body in an anatomic position, typically undressed and with shoes removed [
1,
30]. All cadaver length measurements were recorded in centimeters. Only individuals of 12 years of age and younger were included in the study to exclude any individuals who would have already begun epiphyseal fusion. The timing of epiphyseal fusion varies between bones and across epiphyses within the same bone, resulting in non-comparable long bone lengths after 12 years of age.
Maximum diaphyseal length measurements for the humerus, radius, ulna, femur, and tibia were collected in millimeters from dry bone measurements in the HTHOC and LC datasets using an osteometric board. In the NMDID and VIFM datasets, maximum diaphyseal length measurements were taken from DICOM images using a protocol shown to replicate dry bone measurements taken on an osteometric board [
31]. The left side was used for the analysis when possible, and the measurement from the right was substituted when the left was absent. Length measurements were subsequently converted into centimeters for the analysis.
Least squares linear regression was used to obtain the stature estimation formulae where stature (in centimeters) was regressed onto the diaphyseal length (in centimeters) of the humerus, radius, ulna, femur, and tibia in the model sample. To evaluate the fit of the resulting prediction models, the F-statistic (F), the coefficient of determination (R
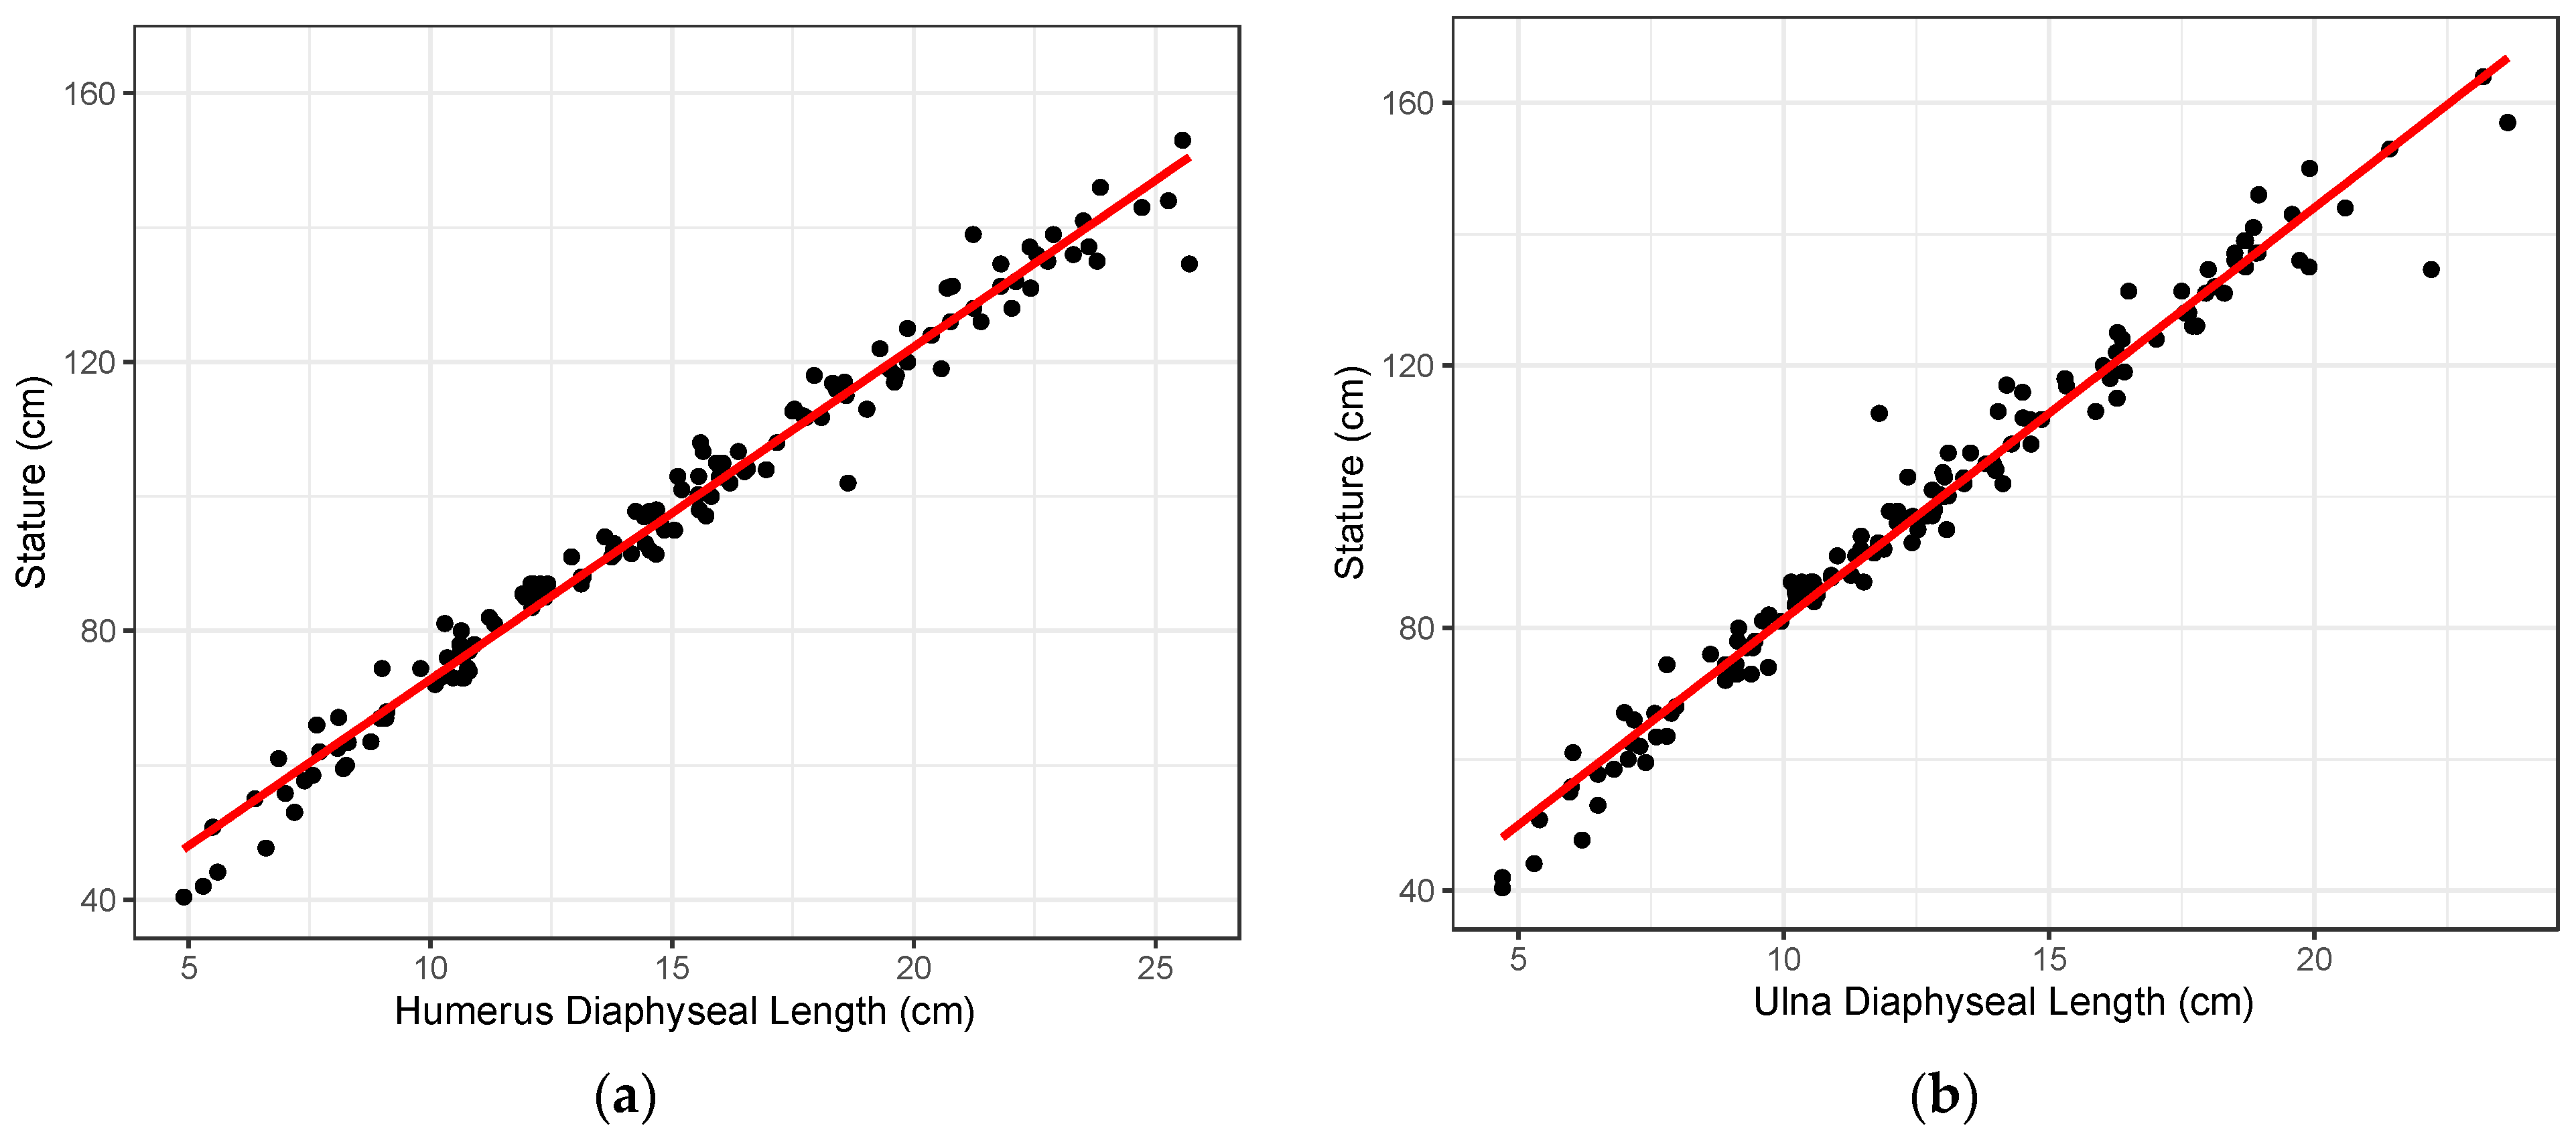
2), and the standard error of the estimate (SEE) were calculated. Visual observation of the data, when stature is plotted against long bone length (
Figure 1), indicated a linear relationship. As growth models tend to be heteroscedastic because variation in size increases with age, other statistical models were considered. However, when stature was plotted against long bone length, the resulting plots showed that the dataset was homoscedastic.
Internal validation of the stature estimation models was carried out to assess the stability and accuracy of the model parameters and was completed by testing the equations back onto the model sample (HTHOC and NMDID datasets). For each long bone model, the estimated stature obtained for each individual was subtracted from the documented stature to provide the regression residuals (estimated–documented stature). A negative residual corresponds to an underestimation of stature by the model, and a positive residual means that the model overestimated stature. The mean residuals (MR) and the mean of the absolute value of the residuals (MAR) were calculated for the total model sample and for the HTHOC and NMDID subsamples separately to provide a measure of the internal accuracy of the models, respectively. The 95% confidence interval (CI) of the estimate was calculated for each individual using the point estimate ± SEE × 1.96. The 1.96 corresponds to the critical value for a two-tailed t-test distribution at a 95% confidence level. The 95%CI was used to calculate the coverage or the percentage of individuals whose documented stature falls within the 95% confidence interval (95%CI) of the estimated stature. This measure was calculated for each long bone in the total model sample, as well as the HTHOC and NMDID sub-samples separately.
To assess the transportability or cross-sample applicability of the stature estimation models, an external validation was carried out by testing the equations using the test sample (LC and VIFM datasets). Similar to the internal validation, the mean residuals (MR), the mean of the absolute residuals (MAR), and the coverage or percentage of individuals whose known stature falls within the 95% confidence interval (95%CI) of the estimated stature were also calculated for the total test sample, and separately for the LC and VIFM datasets, to provide a measure of the accuracy of the regression equations outside of the model sample. All data analysis was performed in R (v4.2.2) [
32].
3. Results
Table 2 shows the slope (a) and intercept (b), and their respective
p-values, of the regression formulae for the estimation of stature (cm) from the diaphyseal lengths (cm) of the five long bones included in this study. The table also includes the sample size for each model, the F-statistic (F) and its p-value, the coefficient of determination (R
2), the standard error of the estimate (SEE), and the minimum and maximum range (Min–Max, in cm) for the predictor variable (diaphyseal lengths). The Min–Max parameter includes the range of diaphyseal lengths within which each model is expected to perform. Since the regression model was built on bone lengths within this range, the model may not accurately reflect the relationship between bone length and stature outside of this range. For example, it is known that the relationship between leg length and stature changes with the adolescent growth spurt [
14]. Estimating stature from a diaphyseal length outside of that range may result in a point estimate that is more inaccurate than suggested by our model testing, as well as a 95% confidence interval for the estimate. All regression coefficients are statistically significant, and the F-value indicates that all models are excellent fits to the data. All model coefficients of determination (R
2) are close to or at 0.98, indicating a very strong fit and that only about 2% of the variation in stature for long bone length is not explained by the linear regression models. The standard errors of the estimates are generally low, around or under 4 cm, about the point estimate.
Based on the parameters of the regression models, the humerus provides the best-performing stature estimation method with the highest R
2 (0.980) and the smallest prediction error (SEE = 3.73 cm).
Figure 1a illustrates the bivariate relationship between the diaphyseal length of the humerus and stature, where most observations are tightly positioned about the entire regression line. The femur provided the second-best model with a SEE of 4.02 cm and an R
2 of 0.978. Overall, the ulna provided the poorest model with the highest prediction error (SEE = 4.45 cm), although the R
2 is on par with the other long bones (R
2 = 0.974).
Figure 1b illustrates the ulna diaphyseal length regressed on stature. Both the best and worst models illustrated in
Figure 1a,b, demonstrate a clear linear relationship between stature and long bone length throughout the ontogenetic period considered, as well as a general lack of heteroscedasticity in the dataset.
Internal validation of the models (
Table 3) show no bias (MR = 0.00) in the model parameters and a mean absolute residual (MAR) ranging between 2.77 and 3.01 cm in the total sample. The humerus and radius showed the smallest residuals (MAR). When considering the percentage of individuals whose known stature is within the 95%CI of the predicted stature, the radius and ulna are tied for the best coverage at about 95%, and the tibia provided the poorest coverage at 90.6% in the total sample. When comparing the two datasets in the model sample, all models tend to overestimate the stature of individuals in the HTHOC and slightly underestimate the NMDID dataset. Bias is greatest in the humerus (MR = 1.02 and MR = −0.27, respectively) and tibia (MR = 1.92 and MR = −0.56, respectively) for both the HTHOC and the NMDID samples. On the other hand, the MAR values across the two datasets indicate that the humerus provides the best results in both (MAR = 3.66 and MAR = 2.97, respectively), followed by the femur (MAR = 4.09) in the HTHOC and the ulna (MAR = 2.58) in the NMDID. Residuals (MAR) are generally smaller in the HTHOC (MAR range: 3.66–4.93) and greater in the NMDID for all long bones (MAR range: 2.53–2.69). The HTHOC dataset also shows the smallest percentage of individuals whose known stature falls within the 95%CI of the predicated stature (70.97–86.21%), compared to the NMDID dataset, which shows a greater coverage percentage, at or above 95% (95.33–97.27%). In this respect, the humerus and ulna are the better-performing bones in the HTHOC dataset, whereas the ulna and femur perform the best in the NMDID dataset.
The estimated transportability or cross-sample applicability of the models, as determined by the external validation on the test sample, is shown in
Table 4. Overall, the humerus provides the most accurate estimate of stature (MR = 0.47) in the test sample, and the least accurate stature predictions were obtained from the ulna (MR = 2.38). The femur and tibia showed both the greatest residuals (MAR = 3.19 and MAR = 3.20, respectively) and the greatest coverage (92.9% in both). The weakest coverage is from the humerus and ulna, with 81.8%. When comparing the LC and VIFM datasets, all equations, on average, underestimated stature in the LC and overestimated it in VIFM. The ulna equation provided the least accurate stature estimations with the greatest overestimates for VIFM (MR = 5.96), and the equation providing the greatest underestimates for LC was the tibia (MR = −3.13). Overall, the MAR results show that the femur provided the best model (MAR = 3.19), while the ulna provided the poorest (MAR = 4.72), followed by the radius (MAR = 3.67). In comparing the LC and VIFM samples, the LC sample had slightly larger MARs (3.17–4.16) than the VIFM sample (2.95–5.96) for each bone, other than the ulna. When evaluating the percentage of individuals in the total test sample whose documented statures are bracketed by the 95%CI, the radius, femur, and tibia have 100% coverage for the VIFM. Conversely, the VIFM has the least coverage for the ulna, with 66.7%, whereas the LC has 100% coverage. For the LC sample, the humerus and radius have the lowest coverage at 80%.
4. Discussion
The current study proposes a series of new, more generic, and inclusive regression formulae to estimate stature in juvenile remains that are based on a greater diversity of children and that do not rely on previous knowledge about biological sex, age, or group affiliations. Several previous child stature estimation methods have significant drawbacks that limit their utility in a variety of paleontological, archaeological, and forensic applications. These include relying on small longitudinal samples of children of high socioeconomic status, which may include a limited range of variation in stature for long bone length. Additionally, these methods have relied on radiographic measurements with no correction for magnification. Some methods also require age to be determined before the appropriate age-specific equation is selected.
Compared to existing methods, the regression formulae provided in this study estimate stature with seemingly greater prediction error, about twice as much (about 15 cm at the maximum range of the 95% confidence interval). However, this two-fold increase in error is artificial because group or sex-specific approaches to estimation truncate variation in the original samples. Since experts cannot make reliable a priori decisions of group affiliation or sex in juvenile remains, the smaller prediction error of those methods is only apparent and not real. Our method is a more realistic representation of the variation in growth of stature-for-long bone length that exists across populations, compared to the other methods that rely on a single population. The regression methods presented here should, therefore, be more reliable when applied across populations than previous methods.
An example of how to use the regression formulae to estimate the stature of an unknown individual is provided here, using the diaphyseal length of the femur, with a hypothetical measurement of 12.6 cm. The formula (
Table 2) is stature = 3.27 × diaphyseal length + 31.20. When 12.6 cm is substituted in the formula for diaphyseal length, solving for stature yields a result of 72.4 cm. When calculating the 95% confidence interval, the standard error of the estimate specific to the femur (
Table 2; SEE = 4.02) is multiplied by 1.96 (4.02 × 1.96 = 7.88). This amount is then added to and subtracted from the point estimate (72.40 ± 7.88 cm). The 95% confidence interval for this hypothetical measurement is between 64.5 cm and 80.3 cm.
Results from the internal and external validation of the regression formulae are mixed, indicating that the humerus provided the lowest mean absolute residuals (MAR), while the radius and ulna provided slightly higher residuals (MAR), but at the same time, higher percentages of individuals correctly estimated by the 95% confidence interval (95%CI). When coupled with the fact that the humerus also had the smallest estimation error (SEE), and, therefore, the smallest prediction interval around the point estimate, the internal validation testing would seem to indicate that the humerus yields the best-performing model. However, external sample testing did not support this. In external validation, the femur and tibia showed the smallest mean absolute residuals (MAR) and the highest percentage of individuals correctly estimated by the 95% confidence interval (95%CI). This was not consistent across the two test samples, however: the best-performing equation in the LC test sample was the ulna, and in the VIFM, it was the radius. However, it should be noted that the test sample is relatively small, even when the two test samples are aggregated (n = 11–14). These equations should continue to be tested on samples of documented stature to assess their performance across populations.
An additional and unexpected finding in external validation is that stature tended to be underestimated in the LC test sample but overestimated in the VIFM test sample. Both the LC and HTHOC samples are considered to represent children living under more adverse environmental circumstances and include largely stunted children [
23]. Comparatively to LC and HTHOC, both NMDID and VIFM datasets are comprised of better-off children, showing less constrained growth [
27,
28]. Consequently, the expectation was that stature would be overestimated in LC (as it is in HTHOC) and underestimated in VIFM (as it is in NMDID), but the opposite was observed. It is unclear why the above differences were observed, and there are probably a range of possible factors. One of them is simply the small sample sizes of the LC and VIFM datasets, making the results more sensitive to random fluctuations in sample composition.
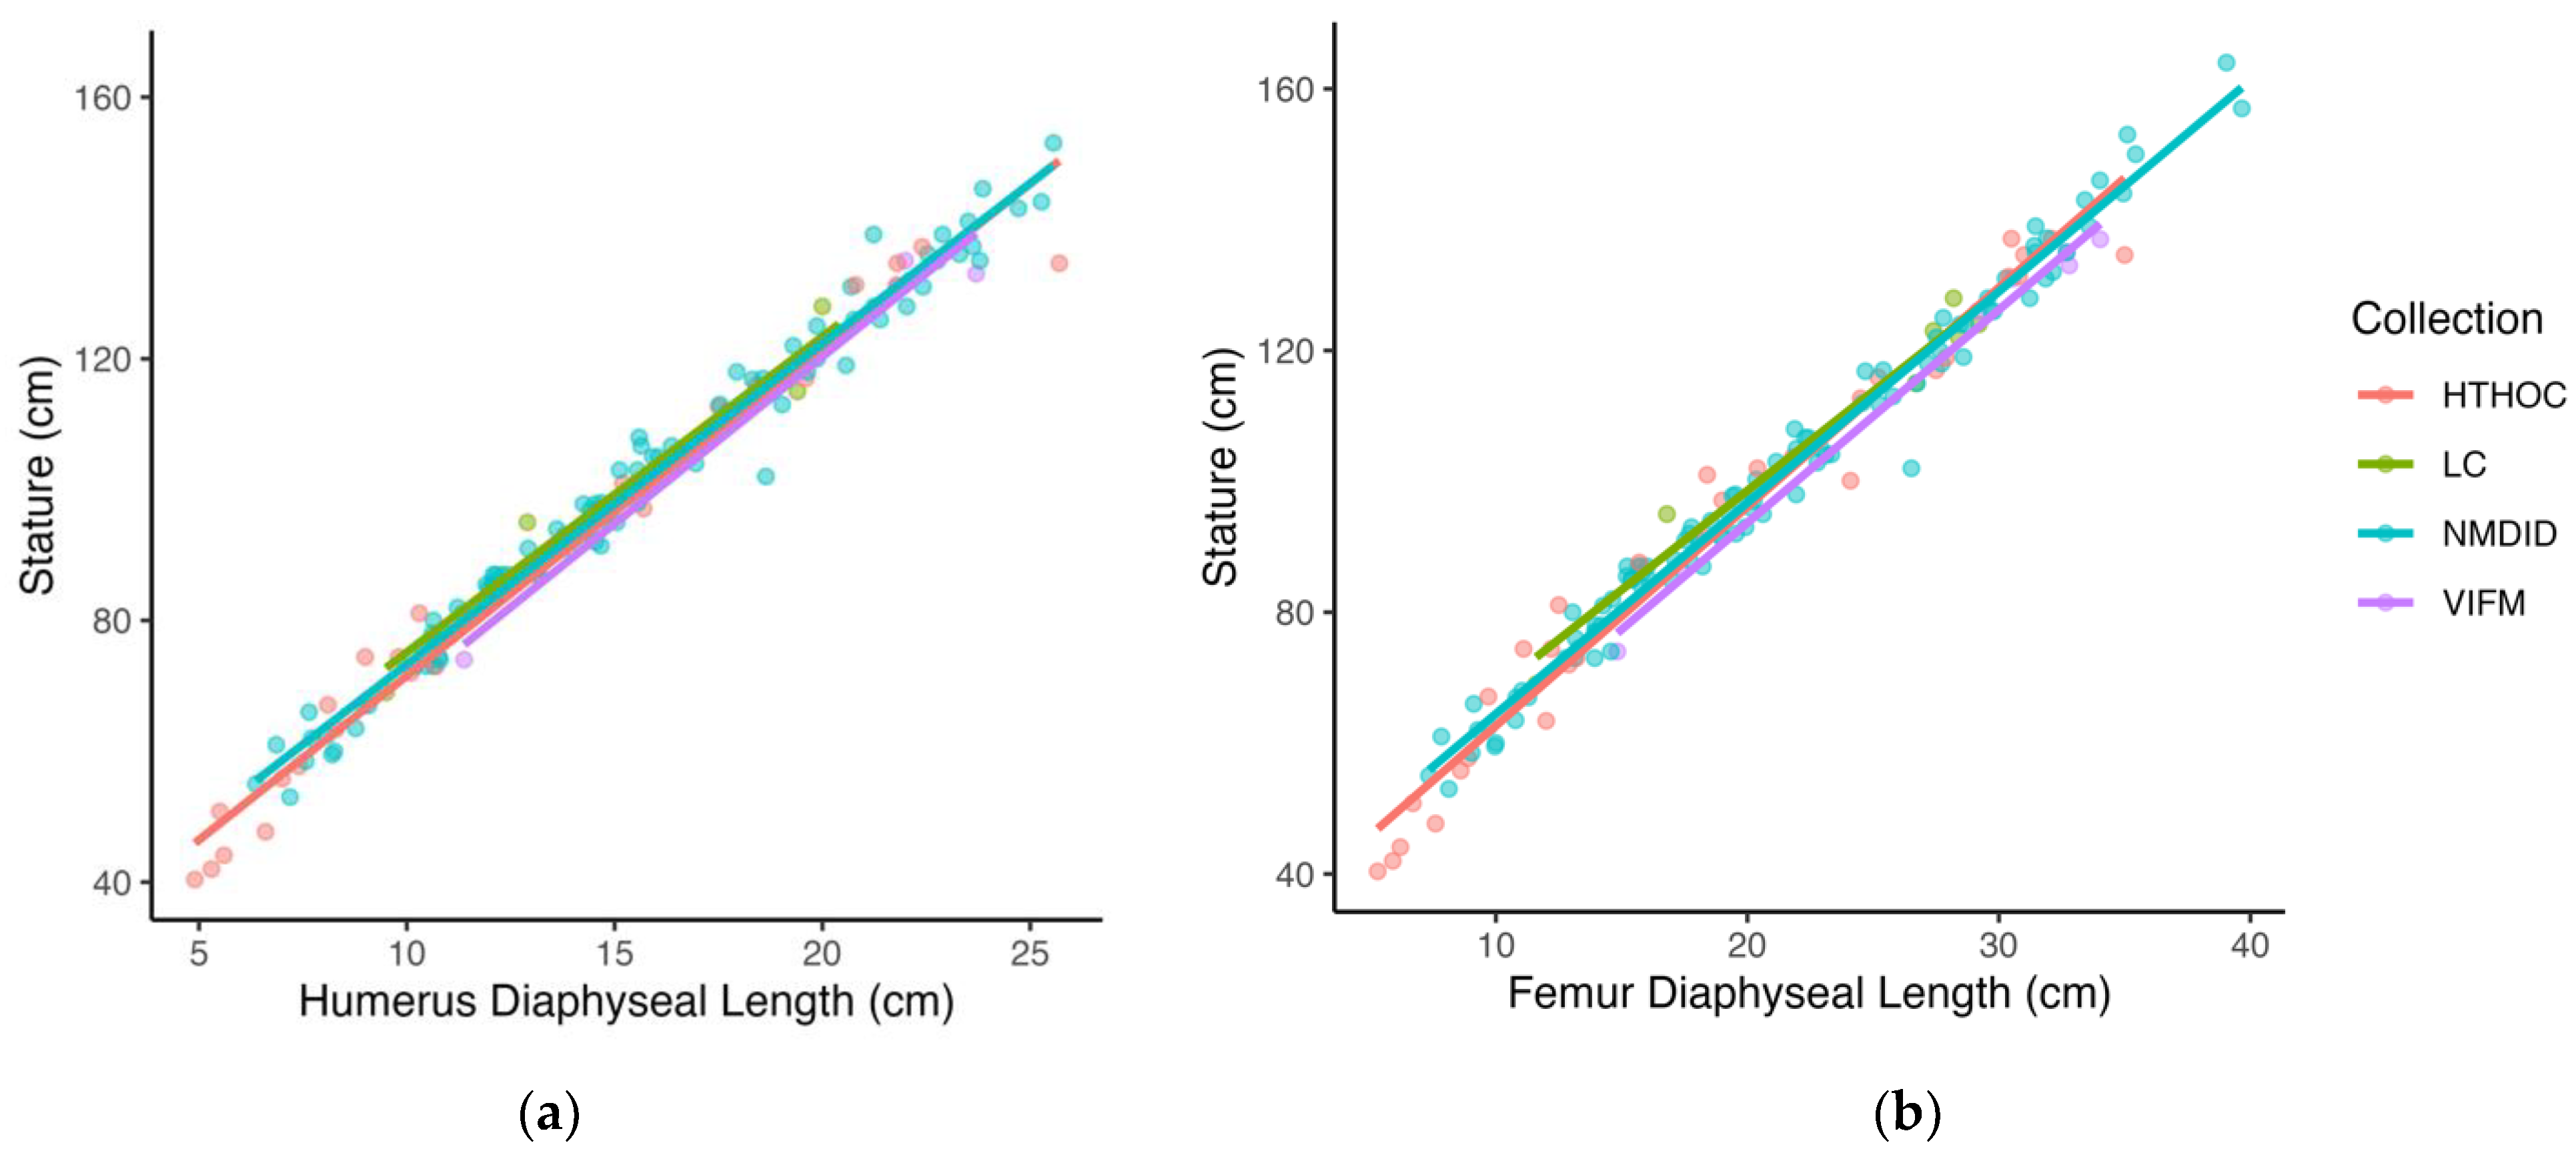
Another possible factor explaining the external validation results is the fact that the test sample is composed of slightly older individuals (mean age = 6.8 years) compared to that of the model sample (mean age = 4.2 years). Since variation in growth increases over age (heteroscedasticity), the fact that the test sample is older on average than the model sample may mean that the test sample incorporates more variation, impacting the performance of the models on the test sample. However, closer examination of the relationship between stature and long bone length in the datasets shows that while in the test sample, children in the LC sample had longer bones for stature than children in the VIFM sample, the relationship was reversed in the model sample, where children in the HTHOC dataset were found to have shorter bones for stature when compared to the children in the NMDID dataset. In fact, children in the LC sample showed the longest bones for stature, followed by the NMDID, HTHOC, and VIFM children, who were found to have the shortest bones for stature (
Figure 2). The reason for these differences is unclear, but results suggest they may be related to differences in the contribution of trunk height to total height, the timing of growth of different body segments across the course of ontogeny, and how these differences in body proportions reflect the differential impact of the timing and intensity of stress on individual or shared-group life histories [
33,
34,
35].
All of these factors discussed above are likely to contribute to the unexpected results in the external validation test. However, rather than highlighting problems, these results are a further demonstration of the applicability or transportability of the stature estimation equations developed in this study in a variety of distinct groups within and across populations, with dissimilar variation to that of the model samples and reflecting different social experiences. Such differences can be in height-for-age but also in the relationship between stature and long bone length. As such, the test samples and the results of the external validation provide a good approximation of the performance of the stature estimation equations outside of the model sample. In fact, the differences between the model and test sample are a testament to how the method proposed here is being pushed to its limits and provides a better or more realistic estimate of its future performance.
Given the mixed performance of the equations in the internal versus external validation tests, which models should be used to estimate stature in an unknown individual? The selection of a model depends to some extent on the motivations of the user. In forensic anthropological applications, it is typically considered most important that the 95% prediction interval yielded by a method includes the true value for the individual so that the estimate does not exclude a potential identification. In this case, a practitioner may prefer a model with high coverage (95%CI) in external testing and might, therefore, prefer the femur and/or tibia models. However, in paleoanthropological and/or bioarchaeological settings, the 95% prediction intervals are less important, and researchers might prefer instead models with smaller prediction intervals and/or higher accuracy. In this case, the user might prefer a model with higher SEE but low residuals (MR and MAR) in external testing, for example, the humerus. Of course, the choice of model is also constrained by the bones retrieved.
The various considerations made up to this point also highlight some of the limitations of this study. One of the potential concerns includes the issue of unknown or inexact decimal age for children in the HTHOC dataset and the different ways by which cadaver length was collected, including the conversion of cadaver length to standing height. Given that the regression equations do not seem to depend on age, the use of individuals with inexact age is not problematic. The reason why there was no attempt to address how cadaver lengths were measured differently in the various datasets, and no stature-to-standing height conversion was attempted is because there is no consensus on how to accomplish it. Most importantly, there are no data to address this issue properly. Furthermore, the results presented in this paper suggest that a correction is not required. The equations provide good estimates of documented stature, regardless of how the stature data were collected.
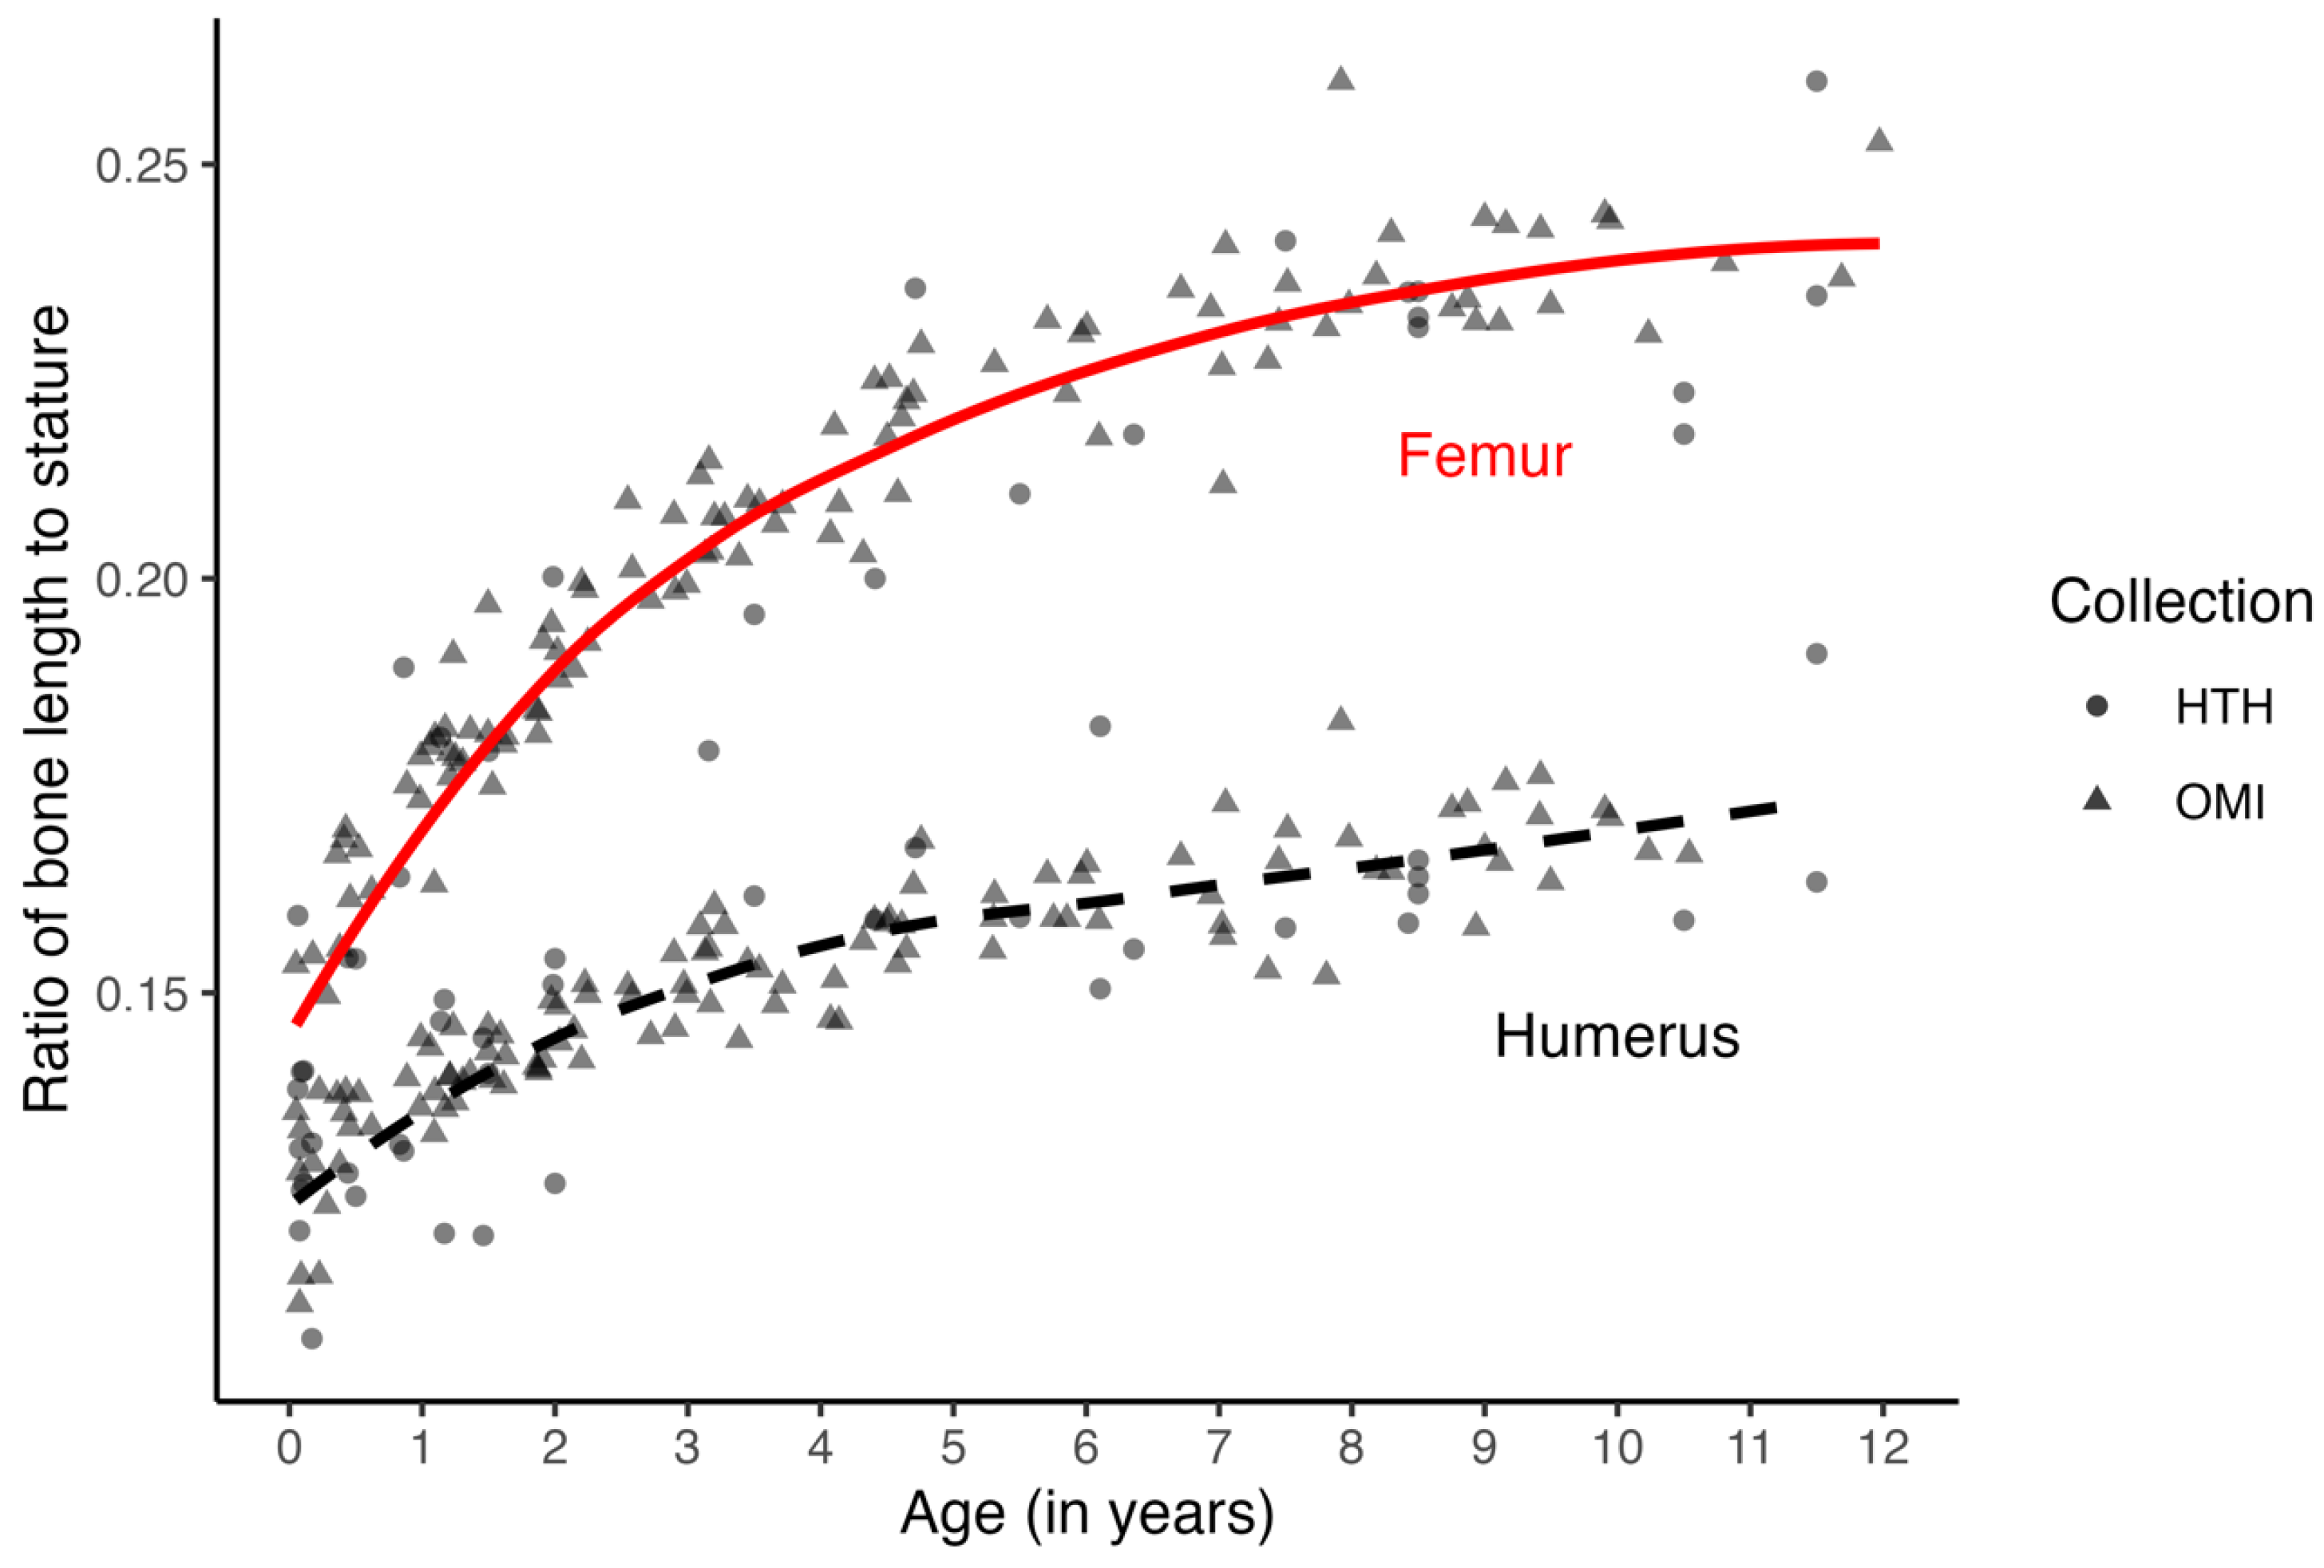
The most significant concern, however, is probably the age structure and size of the samples. The model sample has more younger individuals and includes more children from the NMDID dataset. While the number of females and males in the sample is relatively equal (F = 69, M = 73), the distribution of individuals across the age categories is not. There is no pattern in the ages or stature of the children whose statures were misestimated, and the inclusion of infants does not seem to play a role in the performance of the methods. However, while the relationship between stature and bone length does change with age (
Figure 3), when individuals are pooled across ages and samples, a stable change is modeled well enough by a linear model. Sample variation in the relationship between stature and long bone length is more related to proportional differences between individuals rather than differences due to age (
Figure 3). Also, while the sexes were balanced, the sample only included children under the age of 12 years. Before puberty and the adolescent growth spurt, there is little evidence for sexual dimorphism in height growth [
16,
17,
18]. Any sex-related variation in the sample results from small differences that are better seen as a continuum of overlapping ranges.
Further, individuals of the “ancestry” groups recorded in the HTHOC and NMDID datasets were included to incorporate more variation in the models, but the number of individuals in each “ancestry” is not equal. Since the goal was to be more inclusive and generic, the regression formulae provided in this study were not meant to develop population- or group-specific approaches that would require appropriate group representation. This population- or ancestry-specificity is problematic due to the lack of clarity on what the parameters of membership to a “population”, “ancestry”, or “group” are [
24]. Further, the definitions of these parameters create artificial distinctions in human variation, separating people into arbitrary boundaries [
24].
In addition to being independent of age and sex, the stature estimation equations can, therefore, also be said to be independent of other group affiliations such as “ancestry” or “race.” The reason why children identified as different “races” were included in the samples was not in an effort to make them more representative of a variety of “racial” or “ancestry” categories but rather as a means to increase the sample variation in stature-for-long bone length, as many of these categories represent children of either privileged (typically “White” or “European”) or disadvantaged social background (typically “Black”, “African” or other groups), who are on average taller- and smaller-for-age, respectively. These racialized categories do not represent genetic or ancestry-related differences but instead reflect embodied social inequalities [
23]. Such inequalities reflect group differences in access to nutrition, healthcare, and exposure to disease and pathogens, as well as healthy social and psychological stimuli that result in developmental differences in stature. While the differences in stature for long bone length in the various datasets can be attributed to differences in social and environmental conditions during the growth of the individuals, they simply highlight the range of cross-population applicability or transportability of the stature estimation methods provided here. This results in more generic and inclusive methods which can be used more widely. For example, individuals under medico-legal investigation are a subset of the population who are generally of lower socioeconomic status (SES) [
22,
36]. Individuals of low SES often have a compromised nutritional status, and malnutrition can lead to stunting and differences in body segment proportions, such as shorter legs [
17,
18,
23,
36]. For these reasons, the HTHOC and NMDID samples were combined to include greater variation in stature-for-long bone length, potentially increasing the number of populations, groups, and individuals, particularly disadvantaged, to which the models can be applied. This also includes prehistoric and historic populations living in a variety of ecological conditions. Previous observations of how different body segments respond to environmental changes found that the humerus was least affected and thus reliable and less biased for estimating stature [
1,
23,
37]. This is only partly consistent with the findings of these models, as overall, the humerus performed simultaneously better in terms of residuals (MR and MAR) than the lower limb, which generally performed better in the coverage (95%CI) tests.


 ,
, 


