Abstract
Techniques used in forensic analysis have to find an appropriate balance between fairness to the defendant and efficiency and safety for forensic personnel. Safety issues are particularly acute in analyzing large seizures of bags likely containing heroin, possibly laced with fentanyl. National and local law specifies penalties that depend on the weight of seized powder containing heroin. Local custom makes available to the prosecution and the defense a preliminary report showing the presence of heroin and an indication of the powder weight seized. Such a report, even if it involves uncertainty, can be useful to both parties in understanding the likely sentencing range, with a view toward plea bargaining. An earlier methodological paper demonstrates how data from a sample of bags can be used to create a probability distribution for the weight of seized powder. The aim of this paper is to study whether sampling itself creates substantial additional uncertainty. To this end, we apply the above method to four populations with weights known for each item in the population. We draw eight random samples of size five from each population. Applying the proposed method to each sample, the results show that the variation created by drawing these samples is trivial. We conclude that the proposed method, which is convenient and safer for personnel, can be used without prejudice against the defendant.
1. Introduction
US criminal law specifies conviction only when the defendant has been found guilty beyond a reasonable doubt. Additionally, any fact used to determine sentencing must be found beyond a reasonable doubt (Apprendi v. New Jersey (530 U.S. 466 (2000)) and Allegre v. U.S. (570 U.S. 99 (2013))). With respect to heroin trafficking, penalties depend on the total weight of powder containing heroin, no matter how pure it may be. The local (Pennsylvania) jurisdiction of the authors distinguishes between less than 1 g, 1 to 5 g, and more than five grams, with increasingly severe penalties that also depend on the criminal record of the defendant. Therefore the weight of powder in a seizure is germane to the severity of the offense to be found by the trier of fact (a jury, or a judge, if jury trial is waived by the defendant).
Stamp bags are small glassine packets that contain mixtures of illicit drugs, most commonly heroin, packaged for sale and sometimes stamped with a graphical logo by drug dealers to market their contents. When drugs are seized, custody of the seized stamp bags containing powder is transferred to the crime lab. Preliminary qualitative analysis generates analytical results for one bag, together with a warning that no inference can be made about the contents of the rest of the bags. That result, typically together with some notion of the weight of powder seized, comprises a preliminary report on the offense. This paper addresses a possible weakness in a proposed new method [1] of indicating the weight of powder seized in such a report.
In this lab, the traditional method of reporting weight began by ascertaining the seizure gross weight. A sample (typically 20 to 30 bags), based on the ENFSI hypergeometric number [2], is drawn. To estimate the weight of the seized powder, each sampled bag is emptied of powder, and the empty bags are weighed. These weights are averaged, and multiplied by the number of bags in the population. The result is subtracted from the gross seizure weight, giving an estimate of the weight of powder seized. The uncertainty of each weighing is 0.002 g, so the reported uncertainty is 0.004 g, to account for the tare of the weighing vessel. This preliminary analysis plan was designed to streamline the assimilation of information. Weights of unanalyzed powder are provided based on case circumstances at the discretion of the chemist.
In response to the increase in highly potent opioids, such as carfentanil, there was a safety-driven investigation into methods that could decrease chemist exposure in the preliminary step of the examination process. The goal was a revised procedure that reduced the number of bags being opened (to five) and did not require counting the bags. Not counting the bags will result in analysis time savings as well as increased safety due to lower exposure.
Early in the research on alternative methods, it became clear that the uncertainty attending to the averaging of sampled emptied bag weights is several orders of magnitude greater than the weighting uncertainty, which was the only contributing uncertainty reported. Therefore, typically the traditional method was conveying far more certainty than the science could support.
An alternative method has been developed that meets these goals [1].
The design constraints on analyzing the weight of powder seized were two:
- only five bags would be opened;
- the bags in the seizure are not to be counted.
The counting of bags becomes a major issue if the seizure involves hundreds or thousands of bags. These constraints also minimize the exposure of lab personnel. However, weighing is not additionally dangerous beyond opening the bags.
Since the number of bags is not available, the other way to get at a magnitude of a seizure is to weigh all of the seized bags together. That weight is the gross weight of the seizure, denoted G. For each of the five opened bags, both the gross weight of the bag and the net weight of the powder in the bag are available and are denoted respectively and for bag . Then, of the gross weight G, some portion, namely weight is accounted for, and remains. If the proportion of powder to gross weight in the remaining bags, denoted x, were known, then the total weight of powder in the seizure would be
However, x is not known, but there are five data points that give evidence about x. A crude method would be to use the average, , as an estimate. However, with data from only five bags, an appeal the normal, Gaussian, distribution seems inappropriate. Especially in the context in which sentencing must be done using facts determined “beyond a reasonable doubt,” the problem requires a more careful accounting for uncertainty about the proportion x. Consequently, we decided to treat x as a random variable, and use Bayesian methods to find a probability distribution for x. Using such a distribution, Equation (1) implies a distribution for the weight of powder in the seizure, since G and g are known.
To find a convenient distribution for x, observe first that as a proportion, its range is the interval from 0 to 1. A flexible family of distributions for proportions is the Beta family, which has the density as a function of two parameters and .
where denotes the Gamma function, and . The Beta distribution (2) is a member of the exponential family of distributions, so it has a conjugate prior distribution and sufficient statistics and , and the sample size n (here ).
The goal then is to find the distribution of x under the model specified above, called the posterior predictive distribution. This requires integrating the joint distribution of , and with respect to and , which are restricted to be positive. Because the space of and is unbounded, grid methods cannot be reliably used. However, it is possible to reparametrize in terms of , the mean, and , the variance. Then m is restricted to the space , and v is restricted to the space . Grid methods on m and v approximate the integral required. The transformation is valid provided the Jacobian of the transformation is calculated, as is done in [1].
Once the posterior predictive distribution for x is obtained, it is substituted into (1) to obtain a posterior predictive distribution for the amount of powder in a seizure. Figure 1 displays a typical result from such analysis.
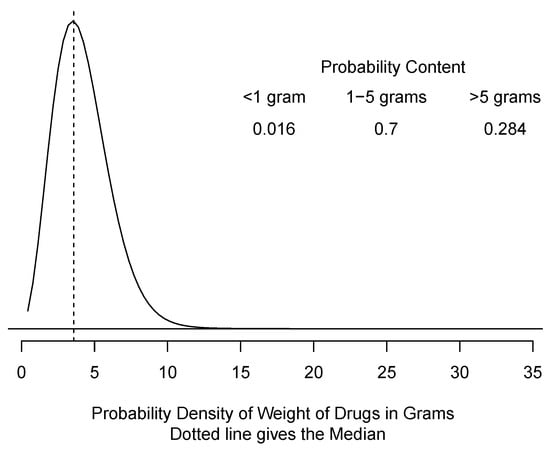
Figure 1.
A typical probabilistic report in a drug case.
There are two major schools of thought about how to do statistics. The traditional one, used in [2] is called frequentist. In frequentism, the parameters are regarded as fixed but unknown, and the data, even after they have been observed, are regarded as random. The other approach is Bayesian, and regards the parameters as having probability distributions reflecting the uncertainty in them, but the data, once observed, are fixed at those values. The data that might have been observed, but were not, are regarded as irrelevant at that point. The approach of [1] is Bayesian. A balanced view of the distinction is given in [3].
There are important differences between the inferences that can be drawn from each approach. For example, to a frequentist, a confidence interval is a property of a procedure used to calculate it, not a property of the specific instance of use. It says that an interval calculated the way this one was will fail to include the correct value of the parameter (here the weight of drug powder seized) only 5% of the time. It does not tell you whether the specific application is one of the 5% or the 95%. By contrast, a credible interval, the Bayesian counterpart, says that IN THIS INSTANCE the probability that the interval contains the parameter is 95% or whatever. It is a common error to misinterpret a confidence interval as if it were a credible interval, i.e., that it gives information about the likely weight of seized powder. It does not. It gives only information about the procedure used in the calculation. The legal system demands to know how much the seized powder weighs, and specifies intervals of weights that have specific legal consequences.
The advantage of [1] over the frequentist alternatives are four: (1) it is unnecessary to count the bags (instead just get their gross weight). (2) The frequentist methods typically require a sample of roughly thirty bags to be opened and weighed, while [1] requires only five. (3) In addition, [1] gives an easily interpretable result–a probability for each of the intervals specified in the law. (4) The Bayesian method provides an analysis for each specific data set as opposed to for the procedure. Hence the proposed methodology helps answer the legal question FOR THIS SPECIFIC SAMPLE.
We would report to the parties and the court figures like Figure 1, rather than just a single number. It is ultimately up to the finder of fact to determine at what level the legal standard “beyond a reasonable doubt” has been met. Giving the whole probability distribution and the probability in each of the legally specified intervals rather than a single number allows transparency about the uncertainty involved.
Each random sample could result in a different probability distribution like that shown in Figure 1. The specific purpose of this paper is to examine whether those distributions, in this application, are sufficiently similar that the parties or a court could reasonably rely on the result of a single sample of size five.
2. Materials and Methods
To discover the extent to which drawing a different sample would influence the result, we turn to complete data sets. Such sets have both gross and net powder weights for each bag. The crime lab has only a few complete data sets, because of the extra effort required to weigh each bag with its contents, and to separately weigh the contents. With data of this kind, several samples of a given size can be drawn from a complete data set, analyzed, and compared. This paper reports on four such data sources:
RLDAT: A total of 200 bags from a drug seizure were weighed. First the gross (filled) weight of each bag was measured. Then each bag was emptied, and the powder contents were weighed. The stamp bags are authentic street samples without any prior laboratory analyst contact. The bags are from an adjudicated case and were retained by the laboratory for training and research purposes. This is real data of the kind our laboratory sees regularly.
SCI80: For training purposes, the laboratory filled 998 bags with a visually consistent amount of lactose powder. Eight scientists were each given ten randomly selected bags and asked to record the gross and net weight, resulting in a complete data set of size 80.
INT179: An intern, who had no familiarity with what routine contents of stamp bags look like, was shown what 20 mg of powder looks like, and was asked to fill 200 pristine stamp bags with 5.031 g of a mixture of benzocaine, caffeine, diphenhydramine, lactose, and quinine. Although the target was 200 bags, only 179 were filled because the bags were filled through visual estimation. The gross and net weight were then measured by laboratory personnel.
SEED: This data set is different in content and purpose from the preceding three. In each of the former, the vast majority of the weight (at least 85%) is in the packaging. In SEED, roughly 85% of the weight is in the contents. About 900 g of wildflower seeds were distributed, roughly evenly, among 98 envelopes. The use of this data set is essentially a check on the programming, to see if it behaves properly with such different input.
3. Results
Table 1 gives the total gross and net weight of each data source. The total net weight is particularly important, as it is the “target” for the probability distributions to be displayed. One way of understanding the total net weight is that it would be the result if the sample size were the entire population.

Table 1.
Gross and net weight of each data set.
We sampled each data set randomly with samples of size five because that is the target sample size for this project. We did this eight times and overlaid the graphs so that one can assess the variability of the results in different samples. We limited the comparison to eight curves each so that the individual probability densities might be visually evident. Additionally, because the data sets were complete, the total powder weight in each data set is available (see Table 1), and is indicated by a dashed line.
Figure 2, Figure 3, Figure 4 and Figure 5 give the results of this exercise. There are two sources of uncertainty involved in analyses such as exemplified by Figure 1. First is the uncertainty due to the fact that only five out of a large number of bags were sampled. The probability distribution in Figure 1 displays this source of uncertainty. The second source is that a different sample might have led to a very different result. Table 2, Table 3, Table 4 and Table 5 give the probabilities in the important intervals (less than 1 g, 1 to 5 g, and greater than 5 g), for each sampled bag. To assess the second source of uncertainty, we examine the result of Figure 2, Figure 3, Figure 4 and Figure 5 in conjunction with Table 2, Table 3, Table 4 and Table 5.
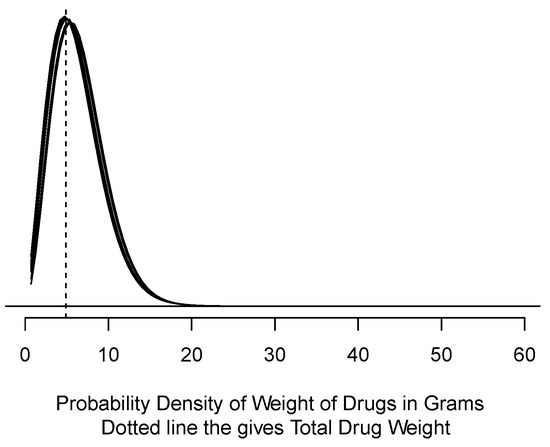
Figure 2.
Eight probability densities computed from samples of size 5 using RLDAT data.
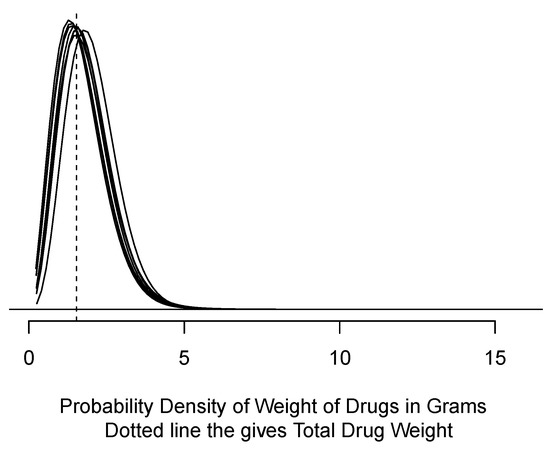
Figure 3.
Eight probability densities computed from samples of size 5 using INT data.
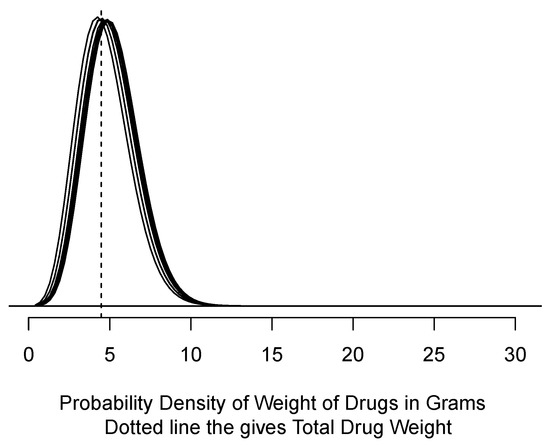
Figure 4.
Eight probability densities computed from samples of size 5 using SCI80 data.
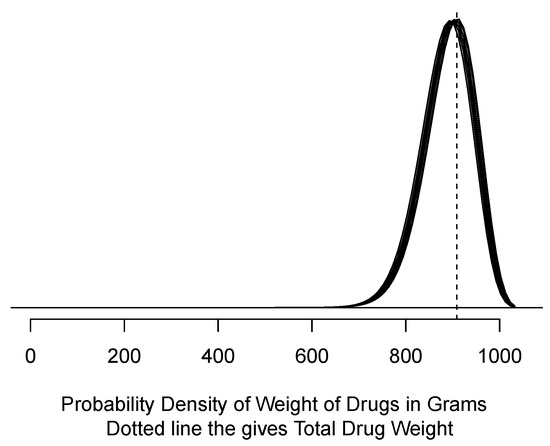
Figure 5.
Eight probability densities computed from samples of size 5 using SEED data.
Table 2.
Probability content of the 8 samples from RLDAT.
Table 3.
Probability content of the 8 samples from SCI80.
Table 4.
Probability content of the 8 samples from INT.
Table 5.
Probability content of the 8 samples from SEED data.
Table 2 and Figure 2 both suggest that the weight of the powder is almost certainly greater than 1 g, but is roughly evenly split between 1 and 5 g and greater than 5 g. Since the judicial standard is “beyond a reasonable doubt,” most likely this defendant’s powder would be taken to be in the 1 to 5 g range.
The bulk of the probability in Figure 3 and Table 3 is in the 1 to 5 g range, but there is generally substantial probability in the less than 1 g range (except for the seventh sample). It is notable that this data set is more variable than the case data in RLDAT.
Similar to the results for RLDAT, the INT data in Table 4 and Figure 4 show a roughly even split between less than 5 g and greater than 5 g. We think it likely that this would be interpreted legally as more than 1 g, but less than 5.
The SEED data are much heavier than the three examined so far, so Table 5 should come as no surprise. We wanted an example in which the proportion of net weight to gross weight is substantially greater than the 10% to 15% generally found in drug powder, so SEED looks very different from the other data sets. Figure 5 shows that the net weight is approximately 900 g, as suggested in Table 1.
The ranges used here, <1 g, 1–5 g, and 5+ g, can be replaced as case circumstances require. For example, if the federal courts implement a 40 g criterion for powder containing fentanyl, that can be accommodated.
4. Discussion
The report exemplified by Figure 1, and studied in the subsequent figures and tables, is meant only as a preliminary analysis that can be used by both prosecution and defense to get a quick understanding of the likely penalty range for an offense. In contested cases, a court can order a more detailed study of the powder seized. Our results, particularly those relating to RLDAT, which is data from a street seizure, suggest that sampling variability is a minor concern for the method described in (1).
The advantage of the proposed method is hoped to be that it will become clearer to attorneys on both sides and the trier of fact that a true weight of total powder need not be known to have a reliable decision about sentencing in drug cases. A clear disadvantage is not having a single number for a trier of fact to use as a reference point in their decision-making, which is what they are used to. However absent analysis of each bag seized, a single number obscures the uncertainty involved. Implementation of the proposal would require internal validation, training for analysts on the process and on the computer programming, and acceptance from the customer.
The chemical analysis and weight question can be treated completely separately. The full analysis of a single bag answers the question of possession of a controlled substance. The weight extrapolation provides details for the sentencing guidelines. Further analysis can be completed to determine the contents of the entire population, however, treating these as two separate issues provides the prosecution and defense with information that can aid in the litigation of a case without time in court. This benefits everyone involved in the criminal justice system by increasing the likelihood of plea bargains, decreasing the number of cases in front of judges/juries, and therefore decreasing the amount of time that a defendant who chooses to go forward must wait to schedule a case in a courtroom.
5. Conclusions
When only a handful of bags containing drugs are seized, sampling is superfluous. The proposed method using sampling is therefore germane only in cases in which many bags are seized. In such cases, it saves time not to have to count the bags. It also reduces the number of bags that have to be opened for weighing, and hence reduces the exposure of the chemists to harmful drugs. This paper shows that the probability distributions derived adequately represent the uncertainty engendered by sampling. Consequently, the method can be used without exposing defendants to an unfair chance mechanism that could have a drastic effect on their likely sentence.
Author Contributions
Conceptualization, J.Y. and J.B.K.; methodology, J.B.K.; software, J.B.K.; validation, J.B.K., E.W. and J.Y.; formal analysis, J.B.K.; data curation, E.W.; writing—original draft preparation, J.B.K.; writing—review and editing, E.W.; visualization, E.W.; supervision, J.Y.; project administration, J.Y. All authors have read and agreed to the published version of the manuscript.
Funding
This research received no external funding.
Institutional Review Board Statement
This research involved no human subjects.
Data Availability Statement
Data are available at https://doi.org/10.1184/R1/20405451.v1 (accessed on 10 August 2022).
Acknowledgments
We thank Allison Cao for research assistance.
Conflicts of Interest
The authors declare no conflict of interest.
References
- Kadane, J.B.; Wilkinson, E.; Yohannan, J.C. Extrapolating the weight of a homogeneous retail drug seizure using packing weight data. Law Probab. Risk 2020, 19, 207–220. [Google Scholar] [CrossRef]
- ENFSI DWG Calculator for Qualitative Sampling of Seized Drugs. Version July 2017. Available online: https://enfsi.eu/docfile/calculator-for-qualitative-sampling-of-seized-drugs-version-2017/ (accessed on 10 August 2022).
- Barnett, V. Comparative Statistical Inference, 3rd ed.; John Wiley and Sons: New York, NY, USA, 1999. [Google Scholar]
Publisher’s Note: MDPI stays neutral with regard to jurisdictional claims in published maps and institutional affiliations. |
© 2022 by the authors. Licensee MDPI, Basel, Switzerland. This article is an open access article distributed under the terms and conditions of the Creative Commons Attribution (CC BY) license (https://creativecommons.org/licenses/by/4.0/).