Article

The Subadult Virtual Anthropology Database (SVAD): An Accessible Repository of Contemporary Subadult Reference Data

1
Department of Anthropology, University of Nevada, Reno, NV 89557, USA
2
Department of Anatomy, Faculty of Health Sciences, University of Pretoria, Pretoria 0031, South Africa
*
Author to whom correspondence should be addressed.
Forensic Sci. 2022, 2(1), 20-36; https://doi.org/10.3390/forensicsci2010003
Submission received: 24 November 2021 / Revised: 24 December 2021 / Accepted: 30 December 2021 / Published: 5 January 2022

Abstract

:
The Subadult Virtual Anthropology Database (SVAD) is the largest available repository of contemporary (2010–2019) subadult reference data from around the world. It is composed of data collected from individuals aged between birth and 22 years. Data were collected from skeletal remains (n = 43, Colombia) and medical images (n = 4848) generated at medical examiner’s offices in the United States (full-body Computed Tomography (CT) scans), hospitals in France, The Netherlands, Taiwan (region-specific CT scans), and South Africa (full-body Lodox Statscans), a private clinic in Angola (region-specific conventional radiographs), and a dental practice in Brazil (panoramic radiographs). Available derivatives include individual demographics (age, sex) with standardized skeletal and/or dental growth and development indicators for all individuals from all samples, and segmented long bone and innominate surfaces from the CT scan samples. Standardized protocols for data collection are provided for download and derivatives are freely accessible for researchers and students.

1. The Need for Contemporary Subadult Reference Samples
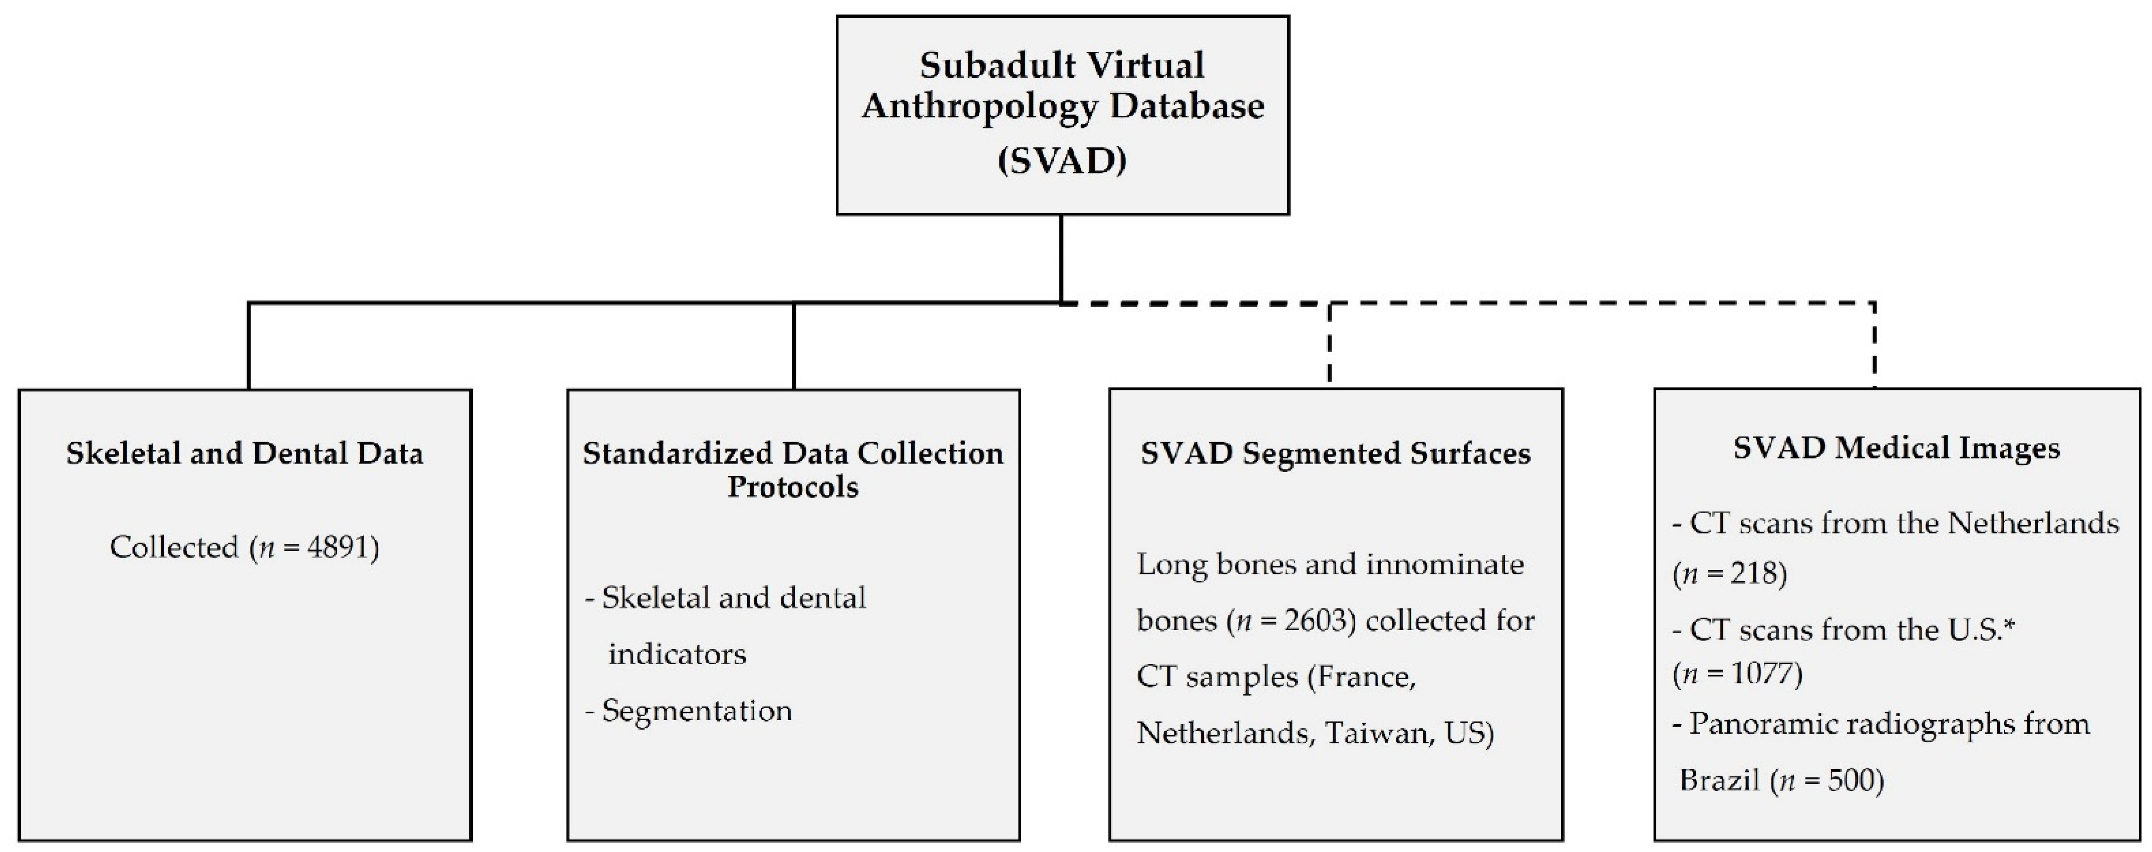
With a few exceptions [1,2], contemporary skeletal reference collections often present with few or no subadult specimens. The handful of osteological collections that do have subadult specimens present numerous issues that are not unexpected, but are problematic when developing or validating subadult methods, especially for use in forensic contexts. These include one or several of the following limitations: relatively small samples [3,4], uneven age distributions [1], anatomically incomplete or taphonomically damaged skeletons, historic samples that do not accurately reflect contemporary growth and development or health [5,6], samples truncated to one type of indicator [7], and/or incomplete or inaccurate information on demographics, population affinity, or socio-economic status [1,6,8,9]. Therefore, the subadult material to use as reference material in forensic anthropology or for ontogenetic studies of modern populations is limited, if not questionable [10]. As evident with the Granada Collection [1] where infants younger than the age of one year old make up 80% of the subadult sample, available skeletal collections also often have unequal age distributions because of differential mortality risks in subadults. Very young individuals, such as infants and perinates, are often over-represented compared to children and juveniles; mortality increases again with age and therefore adolescents are also usually over-represented compared to children and juveniles [10,11,12]. Unbalanced age groups can potentially bias results built with these samples, such as the negative impacts of age mimicry in regression models [13,14].
When skeletal content is available, there are still obstacles associated with access to skeletal collections. Using the material is dependent on the policies of the laboratories or museums that house them as well as governmentally emplaced and linked to employers. Open access repositories of complete subadult osteological reference data are rare, if in existence at all, even though biological anthropologists have been urging for open-source approaches and discussions about open science is standard in many fields [15,16]. When sample information is available through publications, data are often limited to summary statistics. The limitations pertaining to documented skeletal collections have been consistently brought to the attention of anthropological researchers and forensic practitioners over the past few decades [8,17,18,19], and illustrates the material, logistic, political, and ethical complexities preventing from effectively increasing accessibility.
Most of the practical limitations of subadult osteological collections can be alleviated with the use of digital or virtual data and specimens obtained from two-dimensional or three-dimensional medical imaging. Virtual data are now more commonly used in biological and forensic anthropology, as they have become easier to access through ethical collaborative research [20]. The most common two-dimensional and three-dimensional advanced imaging techniques used in biological and forensic anthropology include radiography (conventional or other), computed tomography (CT) scans, and magnetic resonance imaging (MRI). Stacks of two-dimensional images, such as CT scans and MRIs, have the advantages of radiography (i.e., the ability to see beyond the external surfaces), but the additional benefit of alleviating orientation, position ambiguity, magnification, and superimposition issues that are inherent to two-dimensional radiograph imaging. The possibility for visualizing internal structures and high image resolution have proven time and again that the rendered image series [21,22,23,24,25] and the specific derivatives, such as segmented bone surfaces and the skeletal and dental variables collected directly from the image series or the virtual reconstructions, are reliable and accurate [26,27,28,29,30,31].
While there are an increasing number of available virtual resources [20], they are also not without their respective limitations. De Tobel and collaborators [32] have an extensive review on skeletal imaging in forensic age estimation and discuss some of these considerations including, sample sizes are often small and lack diversity, medical images are region-specific and often include a single or a limited number of indicators, and the protocols for data collection are not always standardized or transposable to other imaging modalities. The New Mexico Decedent Image Database (NMDID) is a new and remarkable resource that has made full body CT images of over 15,000 individuals, of which a little over 1000 are subadults, available for researchers [33]. The full body image series offer a unique opportunity to collect a wide variety of data from the entire skeleton, mimicking the ability of working with dry bone from a cadaveric or donated collection. Yet, there are two major limitations with NMDID. First, the variation captured in the sample is constrained to Albuquerque, New Mexico, United States (U.S.). This is not unlike most donated and cadaveric skeletal collections, but important for interpretations gleaned from the sample. Second, virtual data collection is at the intersection of computer science, medical imaging, and social and biological sciences. Its multidisciplinary nature requires a particular skillset that are not commonly incorporated into the higher education coursework or commonplace for faculty/practitioners to have familiarity with software and virtual data types. In contrast to NMDID, Patricia is an online radiographic repository of over 9000 individuals, all of which are less than 20 years of age [34]. This database has a wider representation of biological and geographic variation in the sample because most images were generated at medical examiner’s offices around the US, and it has more individuals less than 20 years compared to the NMDID. Yet, the primary data source is conventional radiographs, which restricts the variety of data types to just those that can be collected from two-dimensional images (i.e., skeletal and dental maturation stages). Even with the limitations of these repositories, the extraordinary pro for each is that they are freely available resources that enable researchers to access large samples of contemporary data.
The Subadult Virtual Anthropology Database (SVAD) is a new, open-source resource that includes myriad data from contemporary subadults, incorporates a wide range of human variation, includes all developmental ages with substantial sample sizes throughout ontogeny, and has known demographics. This unique combination of features overcome limitations associated with other virtual resources. The SVAD is an outcome of three federally funded projects dedicated to improving the subadult biological profile (National Institute of Justice Award 2015-DN-BX-K409 and 2017-DN-BX-0144 and the National Science Foundation BCS-1551913). Data are required to improve methodology and because of that, the SVAD was created. The database contains an extraordinary amount of data for future research that could easily involve questions extending beyond the boundaries of biological and forensic anthropology. The composition of the database, its derivatives, and how to access the material is described below.

2. The SVAD

The SVAD constitutes a repository of medical images, standardized osteological data, and other derivatives of 4891 contemporary subadults (n = 2077 females and n = 2814 males). Individuals are aged between birth and 22 years and stem from eight different countries located around the world, namely Angola, Brazil, Colombia, France, The Netherlands, South Africa, Taiwan, and the U.S. (Table 1). The available derivatives include: (1) segmented surfaces of long bones (humerus, radius, ulna, femur, tibia, fibula) and/or innominate bones of 2603 individuals and (2) skeletal and dental growth and development indicators, including diaphyseal dimensions, epiphyseal fusion stages, dental development stages, and vertebral neural canal measurements (Figure 1). The standardized protocols used to collect these data on medical images or 3D bone surfaces are also available (Figure 1). While the derivatives are freely available for future research, not all collaborating institutions allow sharing of the medical images that the data were collected from. However, 1795 medical images are available for future research and some of those are housed in the SVAD (panoramic radiographs from Brazil and CT scans from The Netherlands) and some in NMDID (CT scans from the U.S.) (Figure 1). The acquisition of the medical image series and biological data was done retrospectively in compliance with the Declaration of Helsinki for the protection of data privacy. The project descriptions and research designs were reviewed by the University of Nevada, Reno Research Integrity office who considered the research to collect the derivatives was exempt from IRB review since it did not comprise any personal identifiable information. This is consistent with the ethical principles described in the Belmont Report [35] and in compliance with applicable U.S. federal, state, and local laws.

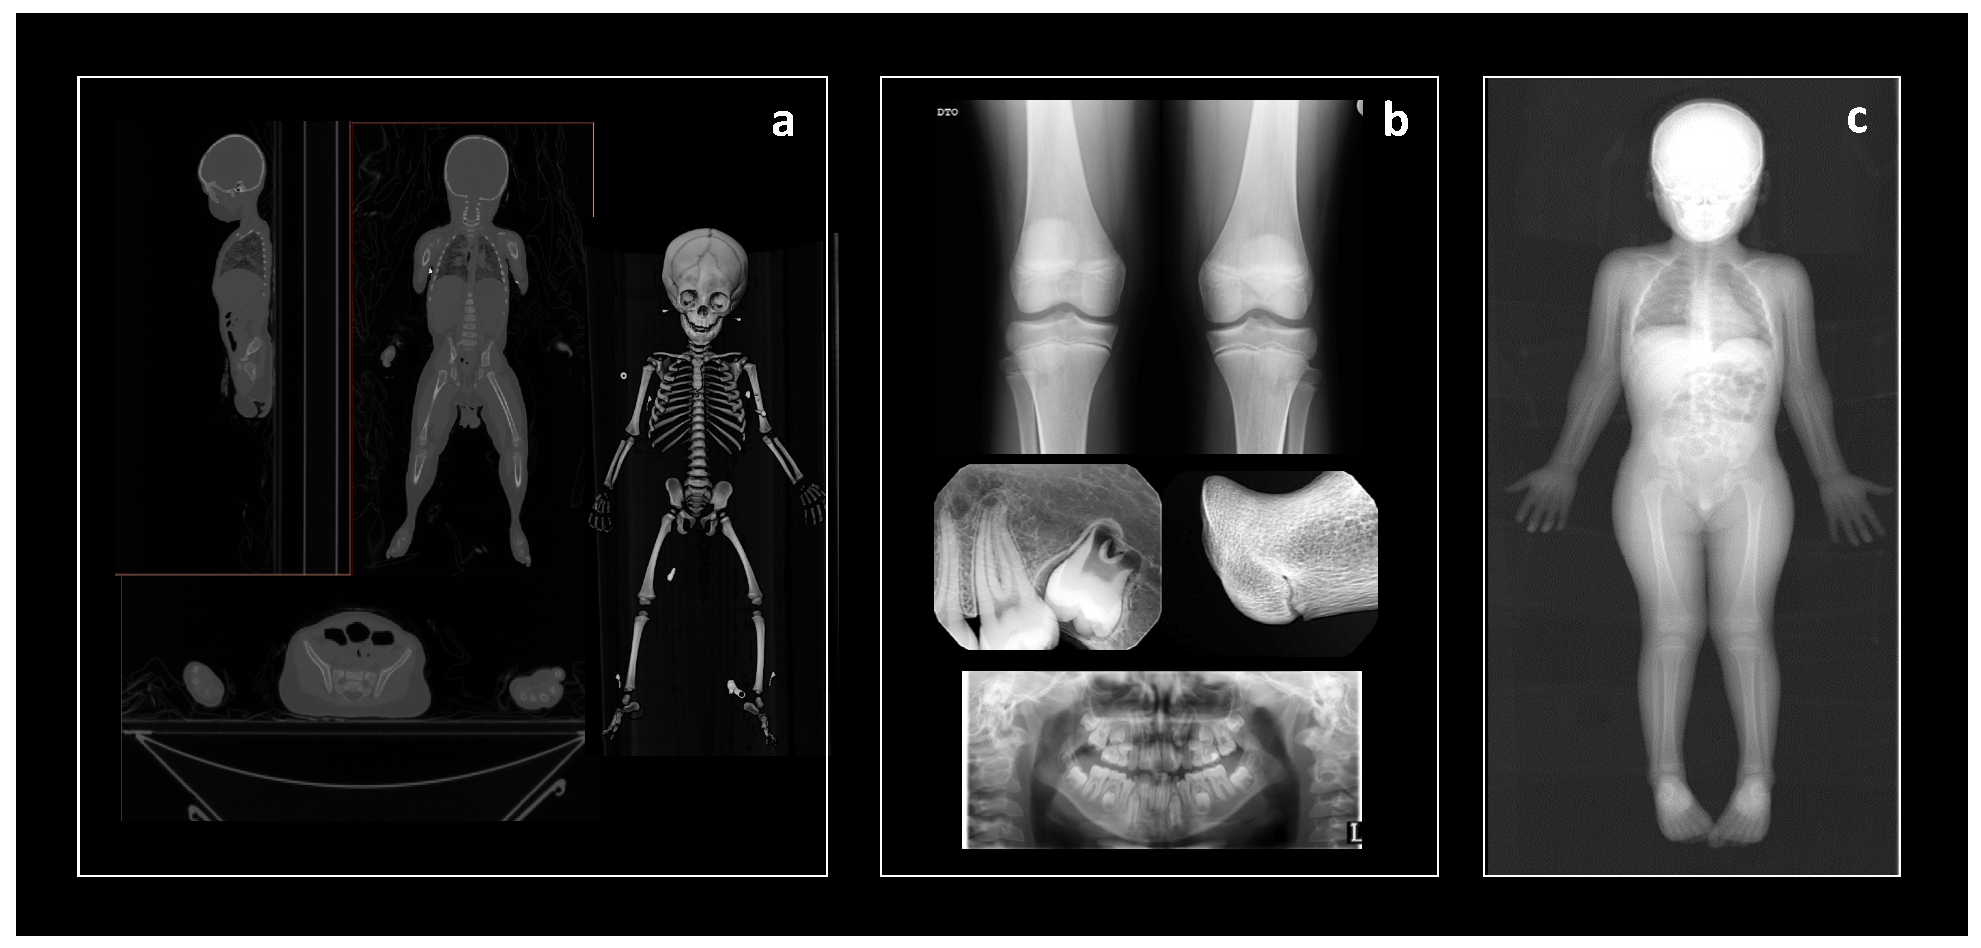
2.1. Collaborations, Contributions, and Imaging Modalities

Each collaboration provided previously generated medical images and all data were cross-sectional (Table 1 and Table 2). The composition of the samples varies and depends on the institution. The unique parameters per collaborator include: data source (hospital versus medical examiner’s office), image modality (CT scan, Lodox Statscan, dry bone, panoramic or conventional radiograph), and type of image (element/region specific versus full body). While there are eight countries represented, some countries have more than one collaborator and/or city. As such, each unique combination of these parameters and the specific policies and procedures for data sharing, and the type of medical image, impacted what was collected and/or what is available for future researchers.
The data were collected from four types of anonymized medical images: CT scans, Lodox Statscans, conventional radiographs, or panoramic radiographs (Figure 2). The CT scan and Lodox Statscan images follow the Digital Imaging and Communications in Medicine (DICOM) Standard for facilitated storage (.dcm format), transfer, and visualization of the images without any loss of information and data [36]. DICOM images require medical imaging visualization software for data collection. The two-dimensional conventional (Angola, Colombia) and panoramic (Brazil) radiographs are stored in other formats common to digital images (e.g., .JPG, .TIFF formats). Other medical imaging databases composed of .JPG files have been set up and studies have shown that loss of information is minimal and image resolution is preserved after conversions from .dcm files [34,37]. However, because of the possibility of distortion and/or magnification associated with these three radiographic samples, only ordinal data (i.e., developmental stages), not continuous data (i.e., measurements), were collected on them. The collaborators from hospitals and/or dental practices usually contributed element- or region-specific images of living individuals. This was true for the Brazilian radiographic sample, the Dutch CT scan sample, the French CT scan sample, the Taiwanese CT scan sample, and the Angolan radiograph sample. The South African sample stemmed from a hospital (living individuals) and a medical examiner’s office (deceased individuals) that used Lodox Statscan to produce full-body images [31]. The Lodox Statscan is an imaging device that can generate high quality radiographic images of up to 1.8 m in length at high speed, with minimal radiation or distortion, and is routinely used in trauma and forensic cases [38]. The U.S. sample is comprised of deceased individuals and therefore the full body CT scans were generated at medical examiners’ offices in Baltimore, Maryland and Albuquerque, New Mexico. The CT scans of the individuals from Albuquerque, New Mexico are part of the NMDID virtual repository and accessible via the NMDID website (https://nmdid.unm.edu/ accessed on 1 November 2021). The only SVAD sample that had data collected from skeletal remains was Colombia. Individuals in this sample died between the 1990s and early 2000s and were exhumed from public cemeteries in Medellin and housed at the Universidad de Antioquia [39].
As mentioned above, the available data varied across collaborating institutions. Generally, region/anatomic-specific images were associated with living individuals and hospital samples, most likely in an effort to minimize unnecessary exposure to radiation [40]. In contrast, a full body image was standard for the medical examiner’s office and therefore the deceased samples do not have notable amounts of missing data, if any. The differing contexts of origin for the SVAD samples and the fact that it is comprised of data from deceased and living individuals do not seem to influence the range of values for indicators in each population. A recent study showed no differences in long bone lengths and dental development between the deceased (medical examiner’s office context) and living (hospital/clinical context) individuals from the U.S. and South African samples [10]. Although these findings should be verified on the other SVAD samples, they suggest there is no bias in skeletal and dental indicators that is related to the type of collaborating institution, the context of origin of the individuals (forensic or clinical), or the type of medical image (CT scan or radiograph), and that these indicators could be compared across samples for anthropological research [28].

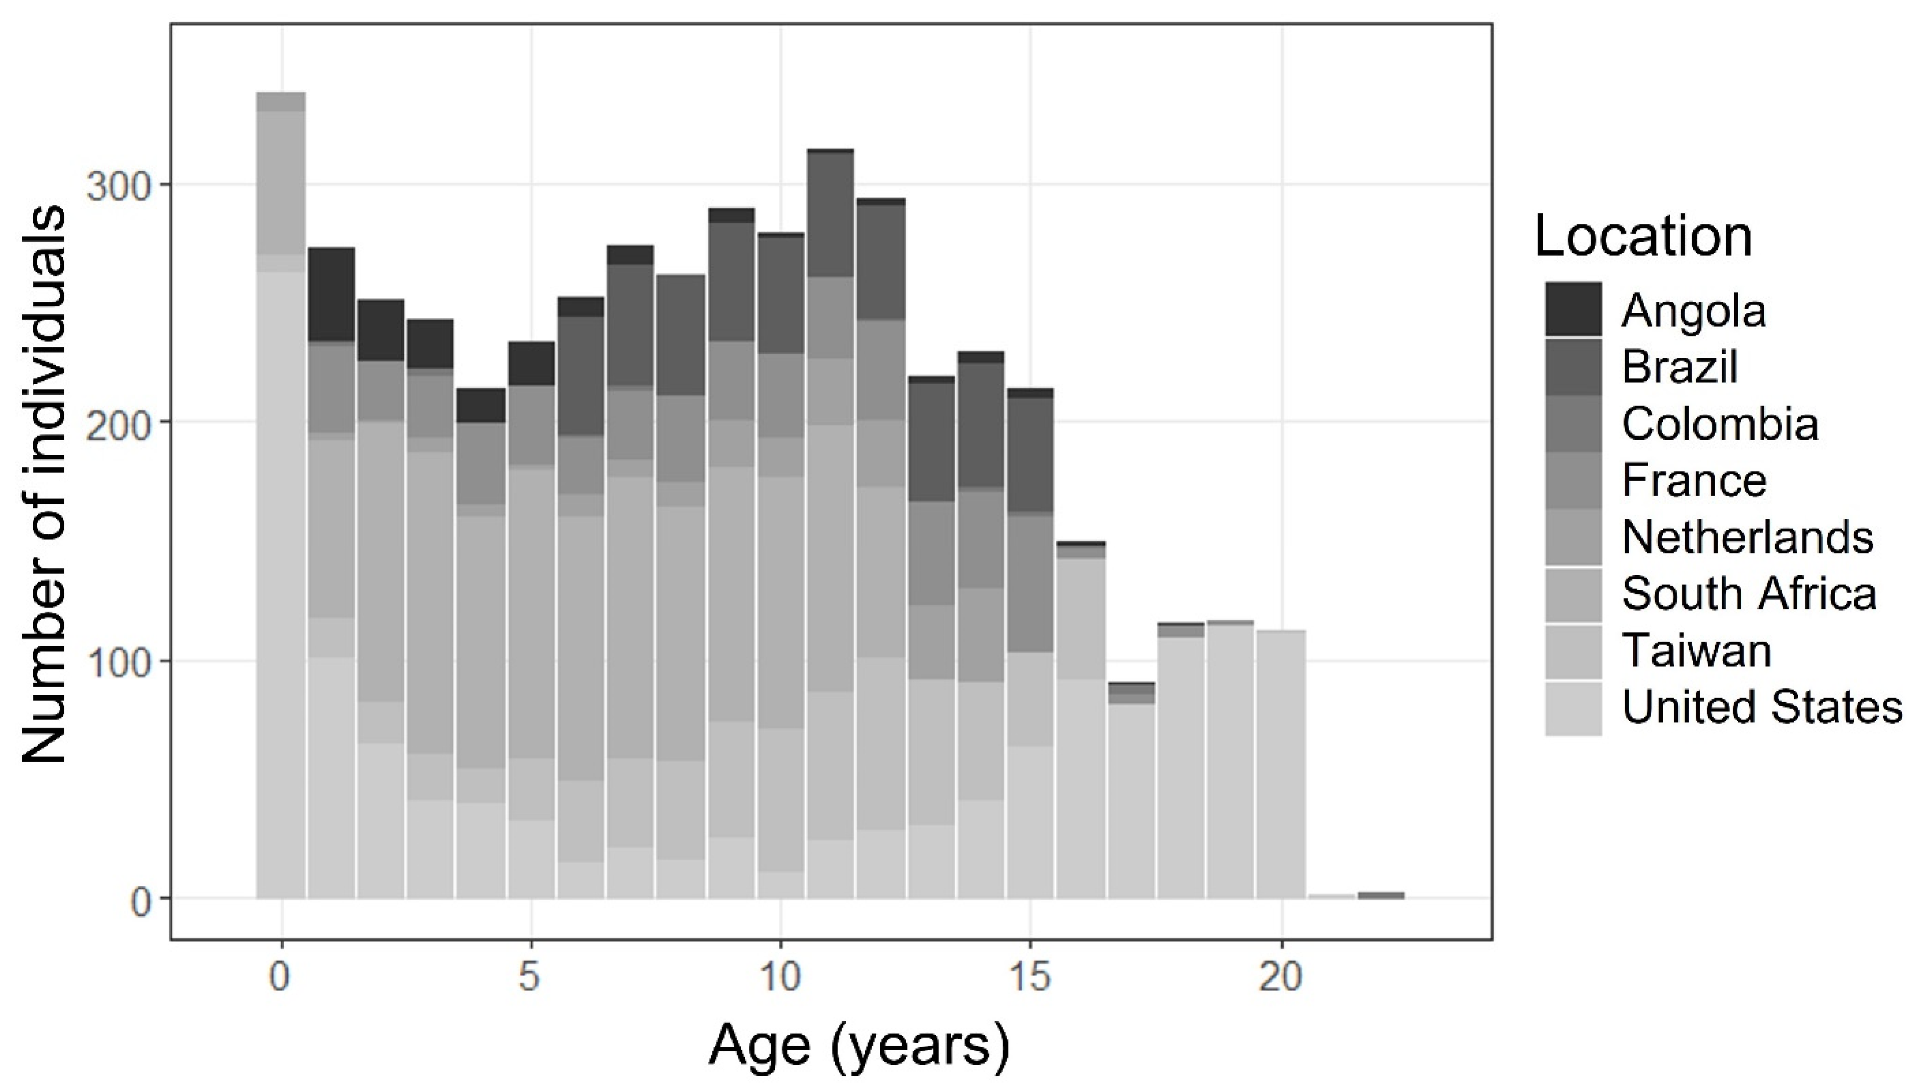
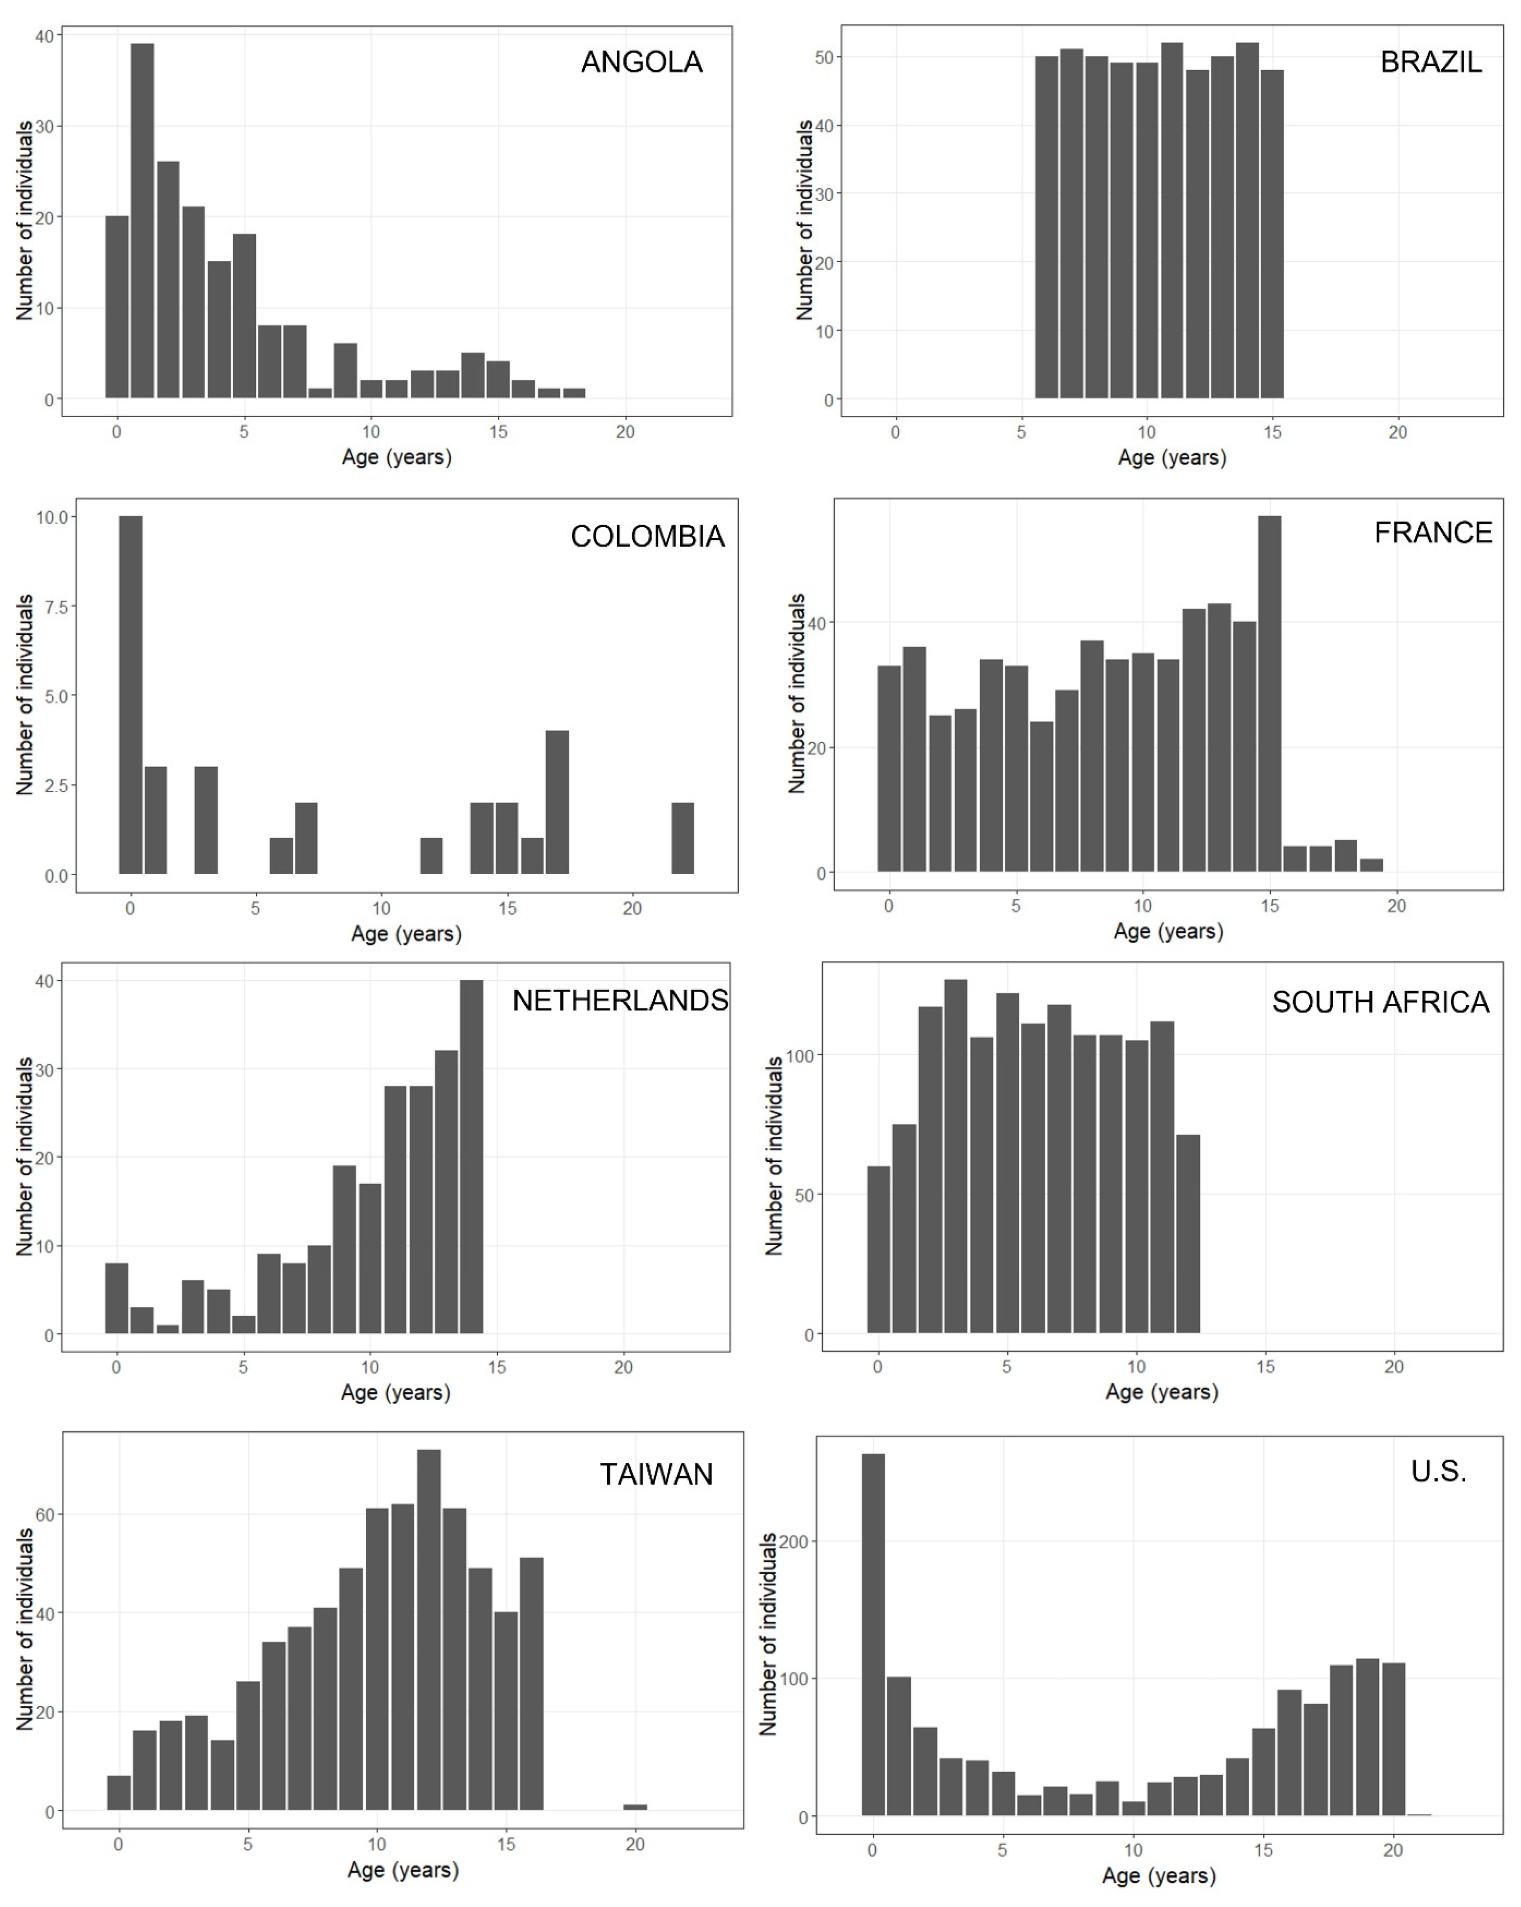
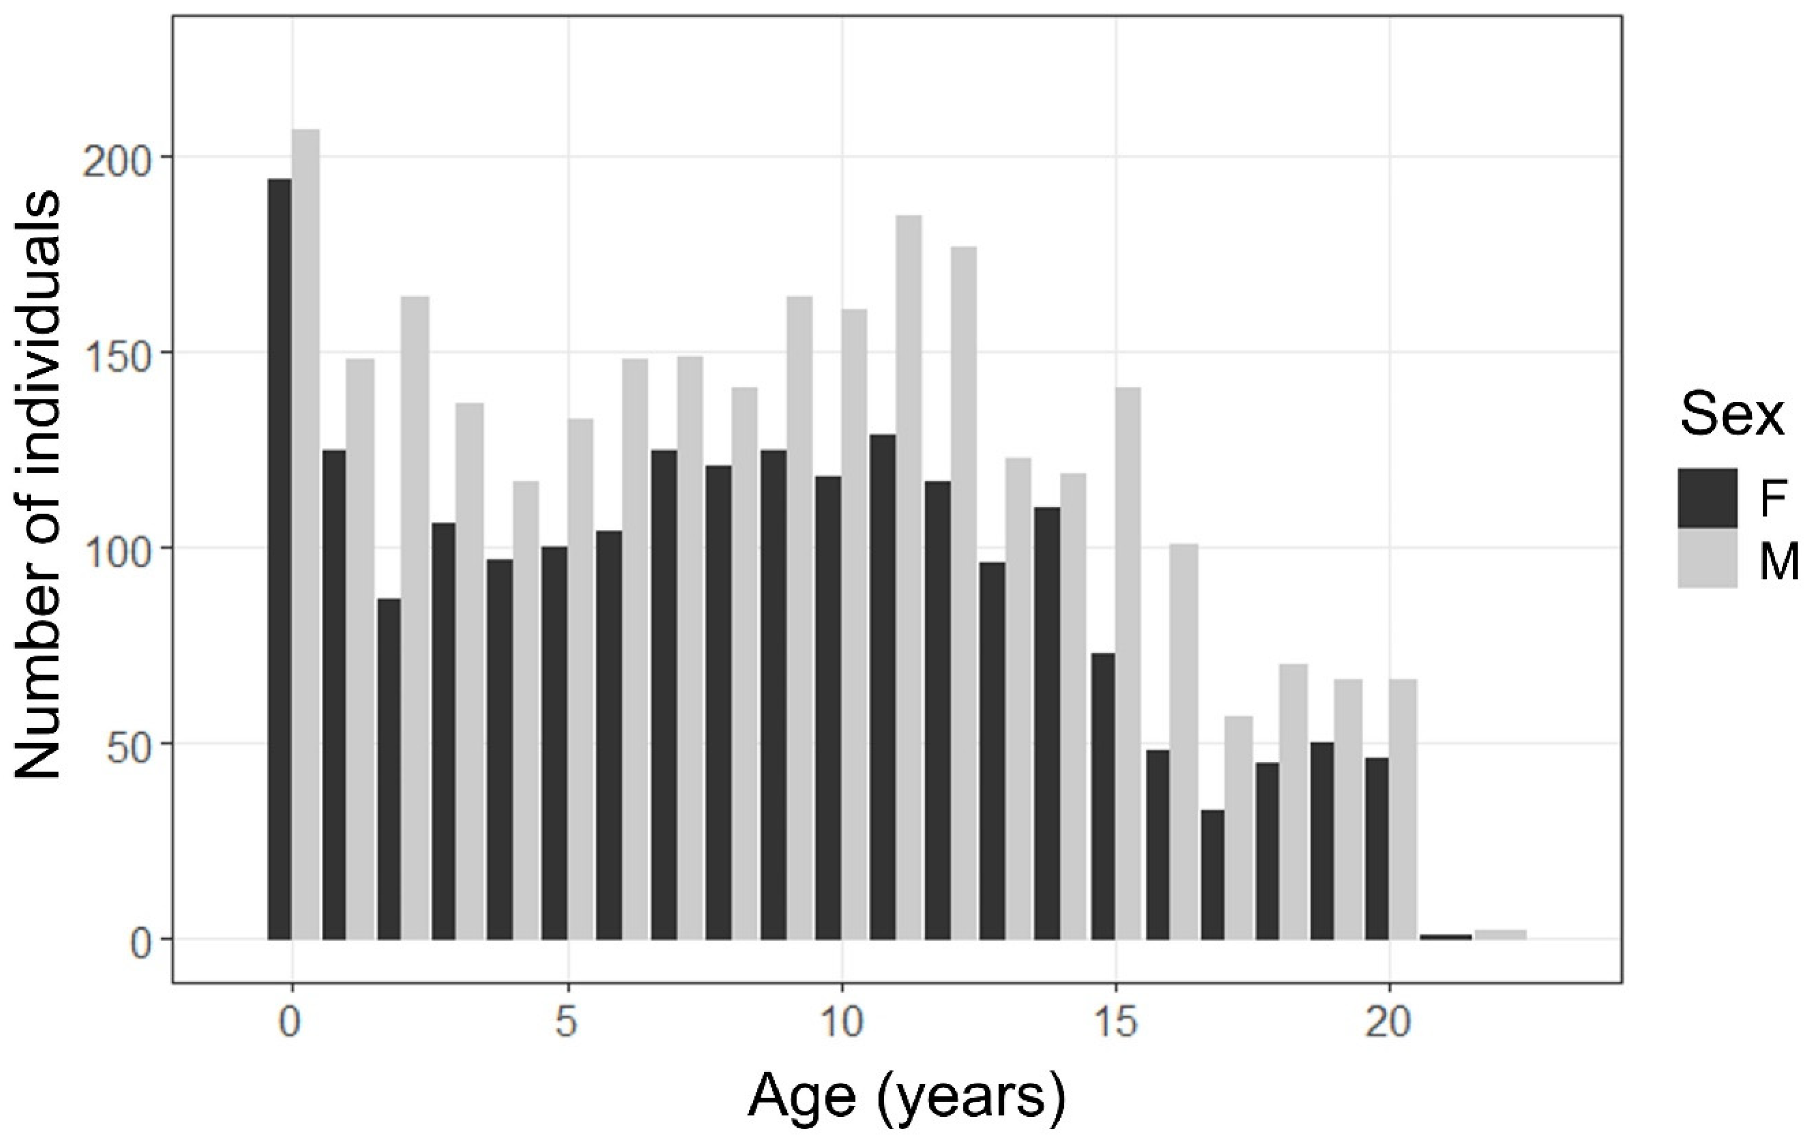
2.2. Sample Demographics

Age and sex are known for all individuals in the SVAD and are the only two variables provided by each institution. The full age range represented in the SVAD is birth to 22 years. There are minimally 200 individuals per chronological age in the SVAD, up until the late teens; there are approximately 100 individuals per chronological age from the ages of 16 to 20 years (Figure 3).
The sampling distribution varies at the institution level (Figure 4, Table 1). In general, subadult mortality patterns are bimodal with a high mortality rate for infants, a reduction in mortality in early to mid-childhood, and another increase in mortality during adolescence [10,34]. In comparison, a living sample from a hospital/clinical setting will likely show a more uniform age distribution for most age groups except for infancy (Figure 4). The youngest individuals are usually less represented in clinical contexts because ionizing medical imaging is scarcely used unless absolutely necessary [40]. However, the cumulative distribution in the total SVAD sample is somewhat equal across the ages (Figure 3).
An age distribution separated by sex (n = 2077 females and n = 2814 males) reveals a larger number of males compared to females per chronological age (Figure 5). Numerous clinical studies have shown the existence of sex disparities in pediatric hospital admissions, with a predominance of male patients over female patients both in emergency and long-term care, independently of the country or healthcare system involved [41,42,43,44,45]. A slight sex bias towards males has been observed in the medico-legal context, although it is less significant for pre-teen subadults than it is for adolescent and young adults [46,47]. Although care was taken to avoid substantially unbalanced sex distributions, the opportunistic, or convenience, sampling approach used to select individuals generally reflects the sex ratios at each collaborating institution (Figure 5).
Additional demographic derivatives varied for each institution and depended not only on the policies of the institution but also if the individuals were deceased or living. For deceased individuals (the U.S. sample only), manner of death (MOD) and cause of death (COD) were known. Population affinity is only known for the U.S. and South African samples, as that parameter was not recorded by the additional collaborating institutions in the SVAD.
Sampling variability can be quite complex and level of details to consider can vary depending on the scale and research question. Country and city level statistics (i.e., human development index, Gini coefficient) could provide a snapshot of the broad population, but nuanced information at the institution level will provide the most accurate reflection of the sample. One component to consider is the type of institution. Researchers have illustrated different sectors of society may visit different types of doctors at different frequencies even when there is equity in healthcare [41,42,43,44,45]. Therefore, countries with public healthcare like Brazil, France, and South Africa, may present greater diversity in their hospital samples, compared to the samples that may populate medical examiner’s offices [46,47] and dental practices.

2.3. Derivatives

Skeletal and dental growth and development indicators were collected on images, dry bones, or virtual bone surfaces (Table 2, Figure 6, Figure 7 and Figure 8). Each country’s complete dataset (.CSV format) and the protocols developed to standardize the collection of the indicators on medical images (.PDF format) are available for download via the SVAD Zenodo Community [44]. Virtual bone surfaces of the long bones and coxal bones (in .PLY format) for the French, Dutch, Taiwanese, and U.S. samples were segmented per their availability using a standardized protocol based on the Amira™ (AmiraTM v.6.5.0, Thermo Fisher Scientific, Waltham, MA, USA) imaging visualization software [23,48]. Segmented surfaces are also available for research but require one to contact the authors for access.
The specific skeletal and dental variables that comprise the datasets are detailed below. Long bone measurements, epiphyseal fusion, and dental development stages were collected following standardized protocols [49] using the KScollect Graphical User Interface (GUI) [50]. The variable levels used in KSCollect are compatible with the KidStats GUI. Both KScollect and KidStats are referenced and available for download in the SVAD Zenodo Community (https://zenodo.org/record/5601936#.YZgRJC-B3z8 accessed on 1 November 2021).

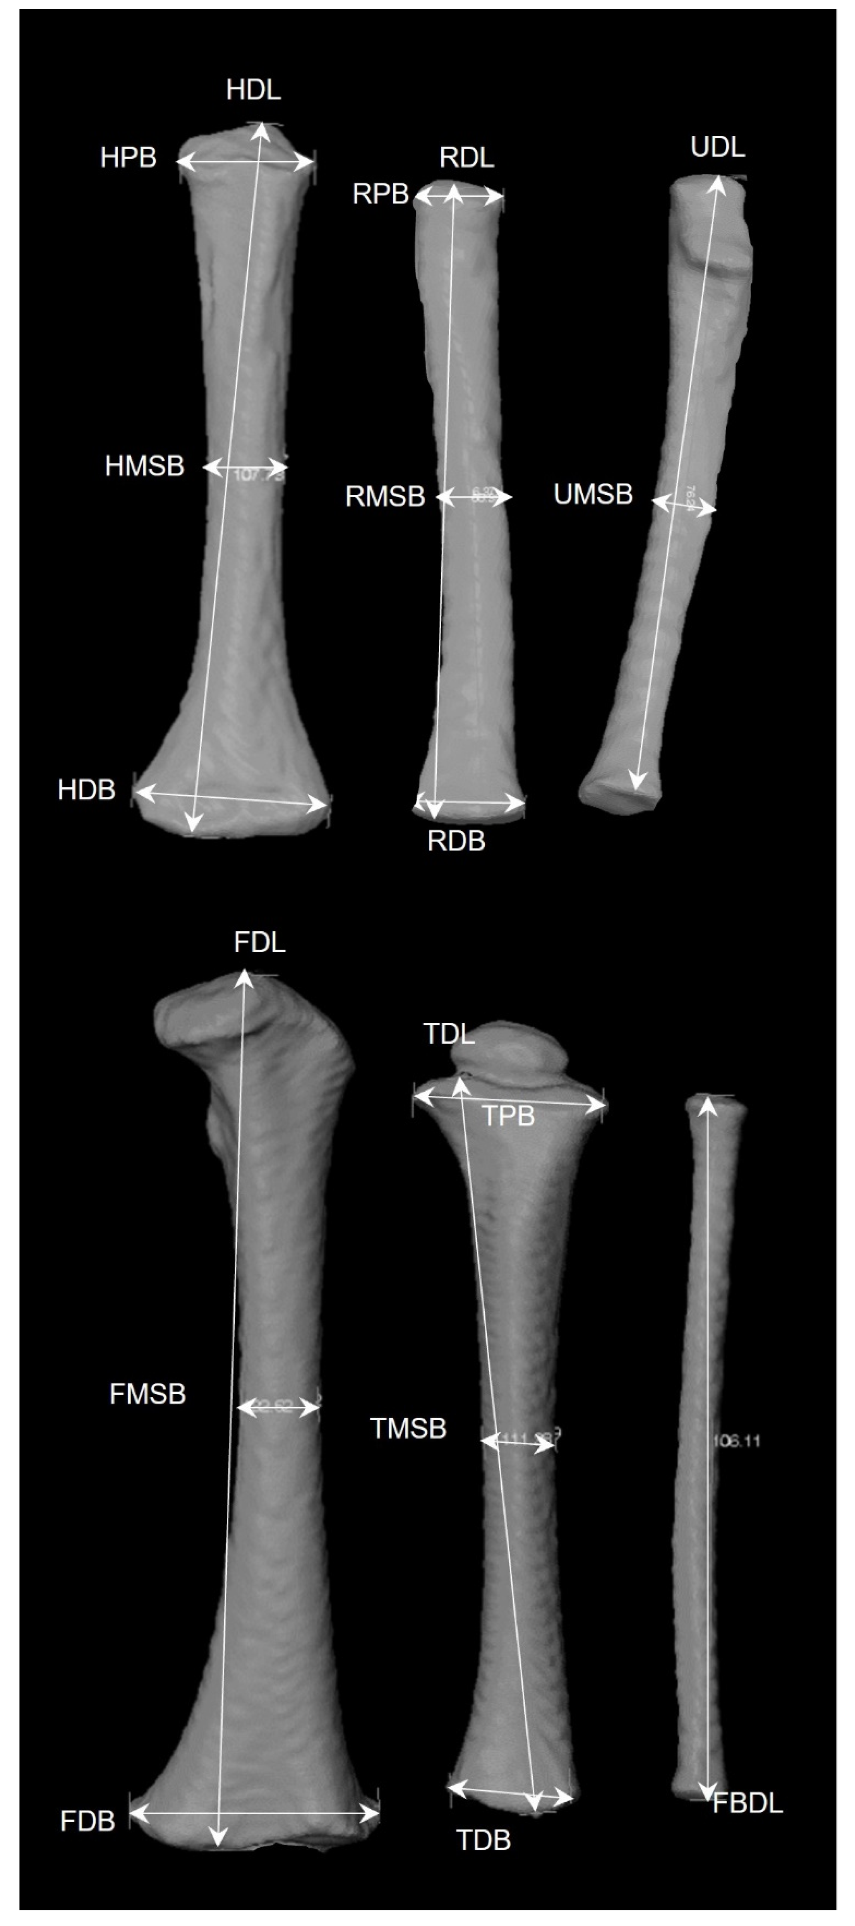
2.3.1. Diaphyseal Data

Eighteen diaphyseal length and breadth measurements of the six long bones (femur, tibia, fibula, humerus, radius, and ulna) were collected per individual (Figure 6). They follow the definitions presented by Stull, L’Abbé, & Ousley in 2014 [31], which were based on Fazekas and Kosa [51] and Moore-Jansen et al. [52]. Left-sided elements were measured by default and their right antimere were measured if unavailable or broken. Length measurements were taken only from unfused long bones. Therefore, the age range for each measurement varies and is dependent on the fusion age, though data for the long bones were mostly unavailable after 13 years of age. Long bone data were measured on segmented bone surfaces in the four CT samples (France, The Netherlands, Taiwan, the United States). The South African long bone data were previously collected by Stull [25,53] from Lodox Statscan images using DVS (2.9.6), the Lodox imaging software. Measurements were taken directly on the dry bones in the Colombian sample using a digital caliper (0.01 mm precision). Previous publications document the high repeatability and accuracy of Lodox Statscan measurements [25,53] and high precision, accuracy, repeatability, and reproducibility of measurements collected on virtual reconstructions of skeletal elements [21,22,26,27,30,31,49,54].

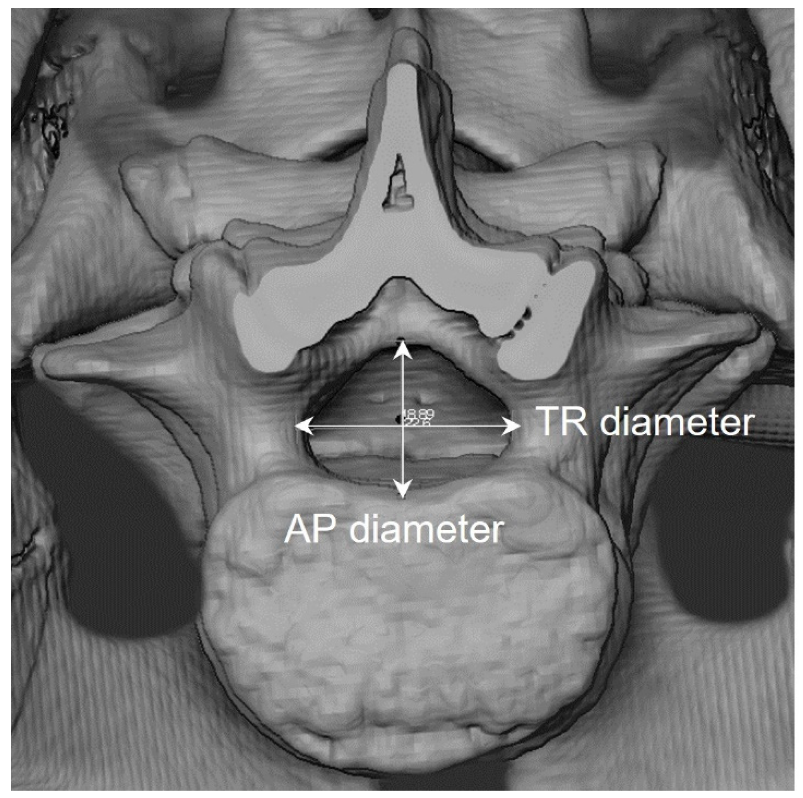
2.3.2. Vertebral Neural Canal Measurements (VNC)

Antero-posterior (AP) and transverse (TR) diameters of vertebrae thoracic 10 to lumbar 5 were collected following definitions by Watts [55,56]. The data were measured on the virtually reconstructed surfaces in the four countries that provided CT images (France, The Netherlands, Taiwan, the United States) (Figure 7) and collected directly on the dry vertebrae in the Colombian sample.

2.3.3. Dental Development

Dental development was collected for the 32 permanent teeth following AlQahtani, Hector, and Liversidge [57] 13-stage revision of the Moorrees, Fanning and Hunt [58] mineralization stages for mono-radicular and pluri-radicular teeth (Table 3). The data collection team used a numerical adaptation of the 13 stages rather than the abbreviations that were associated with the original and modified stage definitions used. For example, 1 was used rather than Ci (Table 3). Teeth were scored directly from CT slices, panoramic and conventional radiographs generated at the original institutions, and from radiographs generated on site in Colombia using a portable Nomad Pro 2 handheld X-ray system (Patterson Dental). In the South African sample, dental development of only the first and second molars was scored because of the insufficient visibility and superimposition.

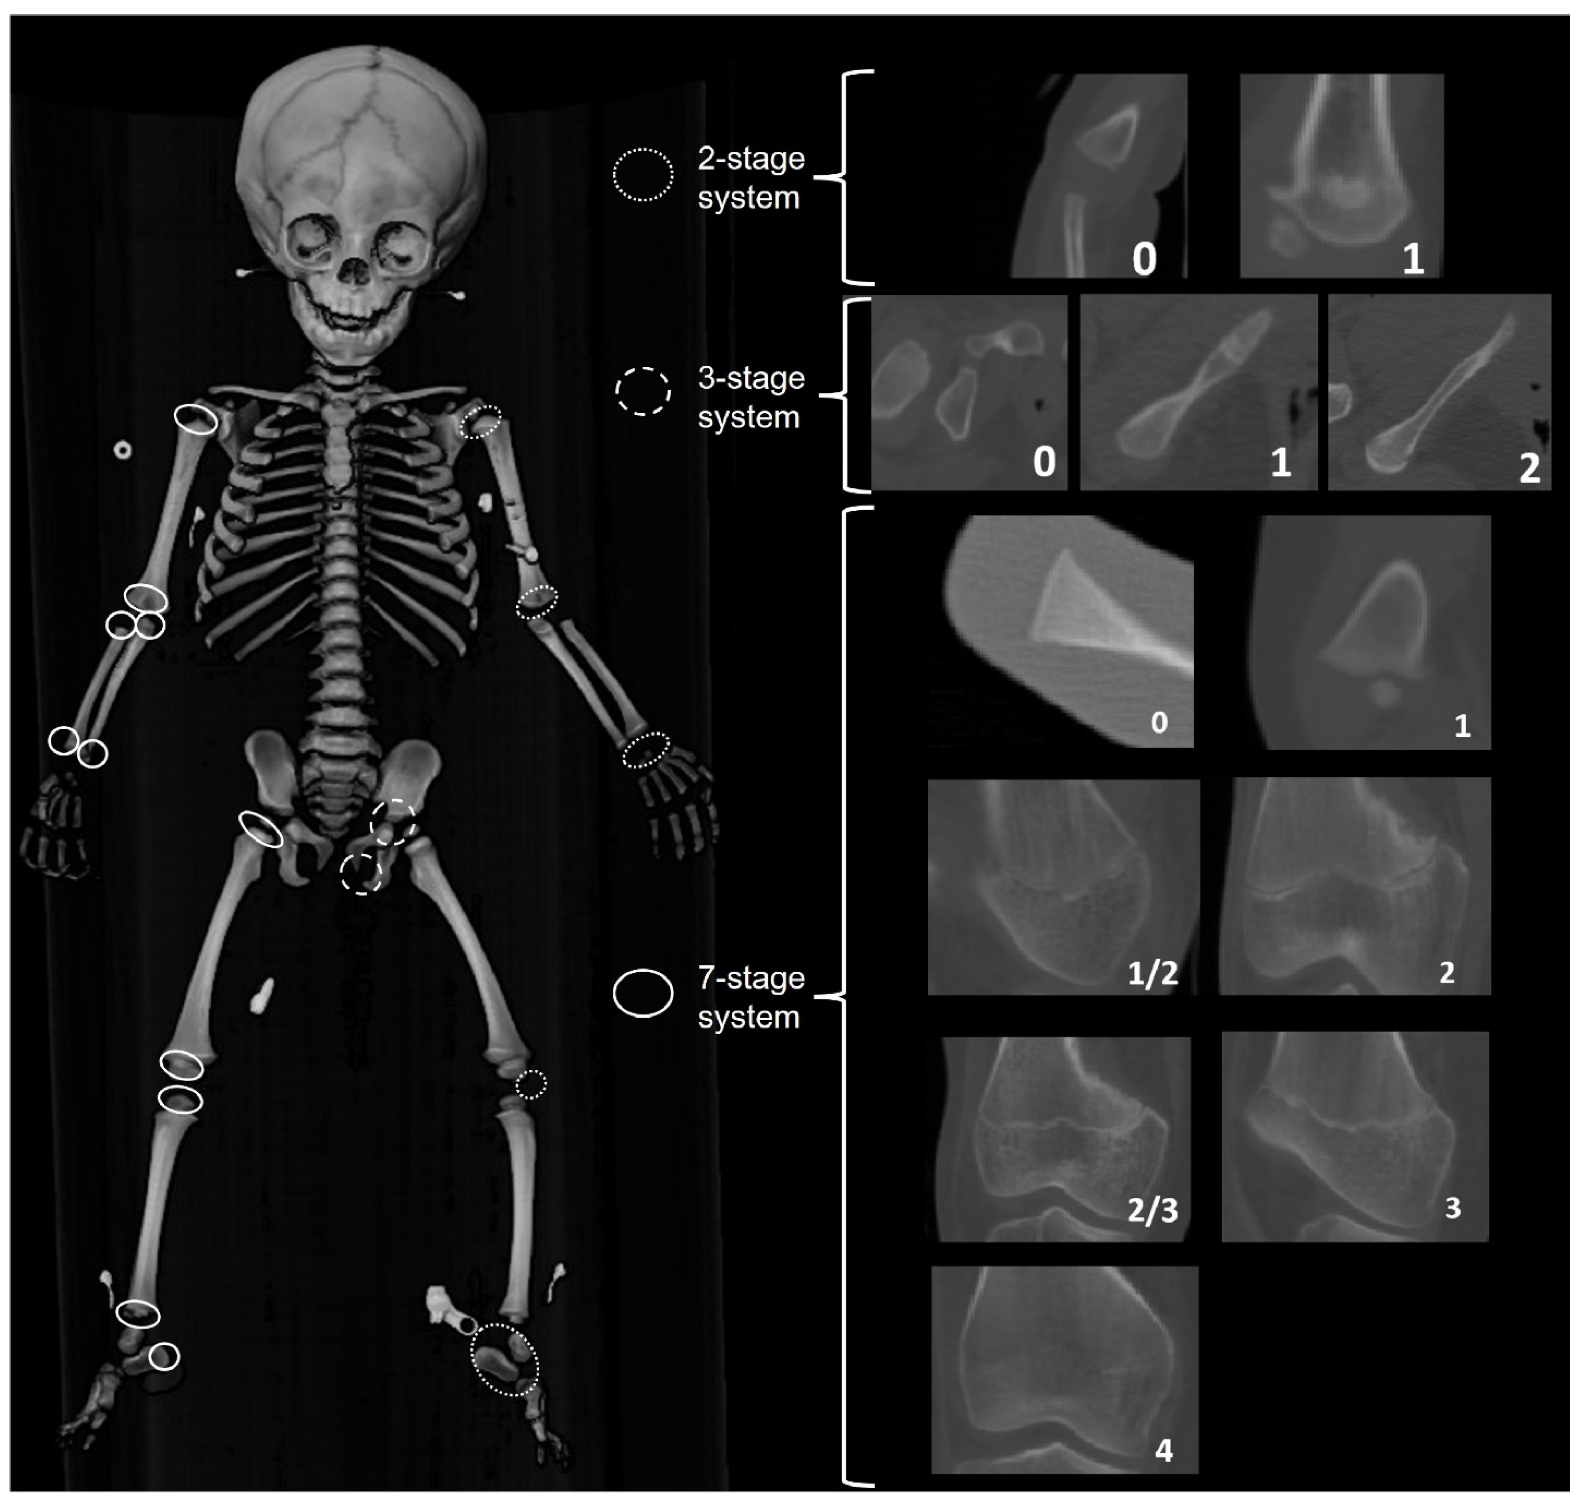
2.3.4. Epiphyseal Fusion (EF)

Epiphyseal fusion stages for proximal and distal long bone epiphyses, the calcaneal tuberosity, the ischiopubic ramus, the ilium and ischium, and ossification of the patella were recorded for both left and right-sided elements. Ossification of carpals and tarsals were scored binary absent (0)/present (1), and then the component score was recorded to indicate the number of elements present on either the left or right side. Three different staging systems were employed (Figure 8): a seven-stage system was used for the long bone epiphyses and the calcaneal tuberosity; a three-stage system was used for the pelvic epiphyses; and a binary absent/present was used for the carpals and tarsals, the ossification of the elements of the proximal and distal humerus (e.g., humeral head, lesser tubercle, greater tubercle, capitulum, trochlea, composite epiphyses), and the patella. Epiphyseal fusion was scored on CT slices for France, The Netherlands, Taiwan, and the United States samples, and on radiographs taken for the Angolan, Colombian, and South African samples.

2.4. Observer Error and Agreement

Intra- and inter-observer errors for continuous data (Table 4) were calculated using technical error of measurement (TEM) and relative TEM (%TEM). Intra- and inter-observer agreement rates for ordinal data (Table 5) were assessed using quadratic weighted Cohen’s Kappa. The original presentation of the agreement rates [28] used linear weighted Cohen’s Kappa; the authors have since recognized that quadratic coefficients are more appropriate. Essentially, the quadratic approach put more weight on a difference in ordinal scores of two or more increments (e.g., a difference between a score of 1 and a score of 3 for dental development) than a difference in ordinal scores of one increment (e.g., a difference between a score of 1 and a score of 2), which limits the risk of overestimating the resulting Cohen’s kappa values [59]. All TEM, %TEM and Cohen’s Kappa values for each indicator are available in the SVAD data collection protocol stored in the SVAD Zenodo Community [49].

3. Access and Expansion

Each partner institution has indicated their preferred conditions for data sharing and access of the medical images and/or their derivatives (Table 2, Figure 1). While all derivatives (segmented bone surfaces, demographic data, and biological data) from each sample are freely accessible and available for download on the SVAD Zenodo Community, it is more uncommon to share the anonymized images. The radiographs from Brazil and the CT scans from The Netherlands can be accessed via a secure server hosted by the University of Nevada, Reno. Prior to providing access to these images, users will need to read and sign a Data Use and Sharing Agreement form and fill out a Research Form describing the purpose and use of the images for a given research project that will need to be submitted to the SVAD curators. Both forms are available via the SVAD University of Nevada, Reno webpage (https://www.unr.edu/anthropology/research-and-facilities/subadult-database accessed on 1 November 2021). The CT scans for the U.S. UNM sub-sample are available for download via the NMDID website; their NMDID ID has been linked for efficient merging of data.
Along with fellow forensic and biological anthropology colleagues [28,32,33,60,61,62,63,64,65,66], we recognize the need to standardize and “optimize” data collection and ease the access to samples, medical images, and skeletal derivatives, and the resulting anthropological methods. The SVAD is substantial in size and diversity and the derivatives are freely available via the SVAD Zenodo Community for fellow researchers to use for their own research questions. Since it is a living repository, it is built to welcome contributions from other researchers whether that be biological and demographic derivatives or anonymized medical images. Open-access derivatives will foster collaborations among researchers at the professional and graduate student levels and allows for new research on various projects exploring ontogeny, variation, methodology, and many others in anthropology and various sister fields. The SVAD Zenodo Community can host links to the various publications and presentations using part or all its content, thus acting as a primary information sharing point on subadult research and reinforcing collaborative efforts and networking. New collaborations will allow it to continue to increase in size and diversity, and collectively will positively increase accessibility to large reference datasets and vertically advance research in our field. If you are interested in contributing and have inquiries, please contact the authors.

4. Conclusions

The SVAD is a new and exceptional resource for researchers interested in virtual data more broadly and subadult research more specifically. Additionally, the data have potential in various fields of research relying on medical images or skeletal and dental variables and elements. Visit https://zenodo.org/communities/svad/?page=1&size=20 accessed on 1 November 2021 for more information and https://www.unr.edu/anthropology/research-and-facilities/subadult-database accessed on 1 November 2021 to apply for access to the available medical images. By developing the open-access platform, we hope to steer the culture of forensic anthropological research specifically and forensic science research more generally towards open science, which leads to greater collaboration and mutual gains, ensures scientific integrity through transparency, and improves the overall quality of research [66]. With this platform established, the SVAD will allow for the inclusion of additional data via new collaborations so that samples can increase in size and diversity. Ultimately, the SVAD can host and provide access to derivatives from various projects and individual and country-specific demographic information, including entire datasets, medical images, segmented bone surfaces, data collection protocols, automated segmentation tools, resulting methods, novel R packages and scripts, and GUIs. The end goal is to facilitate access to large-scale anthropological data, avoid costs of traveling, and limit the effects of missing data/structures that are common with physical skeletal collections.

Author Contributions

K.E.S.: Conceptualization; Methodology; Validation; Investigation; Resources; Data Curation; Writing—Review and Editing; Supervision; Project Administration; Funding Acquisition. L.K.C.: Methodology; Validation; Formal Analysis; Data Curation; Writing—Original Draft Preparation; Writing—Review and Editing; Visualization. All authors have read and agreed to the published version of the manuscript.

Funding

This research was funded by National Institute of Justice (NIJ Awards 2015-DN-BX-K409 and 2017-DN-BX-0144) and the National Science Foundation (BCS-1551913). The content is solely the responsibility of the authors and does not necessarily represent the official views of the National Institute of Justice or the National Science Foundation.

Institutional Review Board Statement

The study was conducted according to the guidelines of the Declaration of Helsinki and has been determined exempt or not human subjects research according to United States federal regulations by the Institutional Review Board (or Ethics Committee) of the Research Integrity Office of the University of Nevada, Reno.

Informed Consent Statement

Patient consent was waived because of the retrospective research design.

Data Availability Statement

The data mentioned in this this study are openly available in the “Subadult Virtual Anthropology Database” Zenodo community (https://zenodo.org/communities/svad/?page=1&size=20 accessed on 1 November 2021) at Datasets: [doi:10.5281/zenodo.5193208] Data collection protocol: Amira [doi:10.5281/zenodo.5348411] Data collection protocol: Indicators [doi:10.5281/zenodo.5348392].

Acknowledgments

Thank you to all our collaborators who agreed to help build the SVAD: Maria Gabriela Haye Biazevic, Kathia Chaumoitre, Kerri Colman, Eugenia Cunha, Henrique Manuel Vale Fernandes Costa Rodrigues, Rick van Rijn, Timisay Monsalve-Vargas, and An-Di Yim. Additional thanks go to all the colleagues and graduate and undergraduate students who helped collect the derivatives: Michala Stock, Leah Auchter, Elaine Chu, Laura Cirillo, Stephanie Cole, Cortney Hulse, Briana New, and Christopher Wolfe.

Conflicts of Interest

The authors declare no conflict of interest. The sponsors had no role in the design, execution, interpretation, or writing of the study.

References

  1. Aleman, I.; Irurita, J.; Valencia, A.R.; Martinez, A.; Lopez-Lazaro, S.; Viciano, J.; Botella, M.C. Brief communication: The Granada osteological collection of identified infants and young children. Am. J. Phys. Anthropol. 2012, 149, 606–610. [Google Scholar] [CrossRef]
  2. Cattaneo, C.; Mazzarelli, D.; Cappella, A.; Castoldi, E.; Mattia, M.; Poppa, P.; De Angelis, D.; Vitello, A.; Biehler-Gomez, L. A modern documented Italian identified skeletal collection of 2127 skeletons: The CAL Milano Cemetery Skeletal Collection. Forensic Sci. Int. 2018, 287, 219.e1–219.e5. [Google Scholar] [CrossRef]
  3. L’Abbé, E.N.; Loots, M.; Meiring, J.H. The Pretoria Bone Collection: A modern South African skeletal sample. Homo 2005, 56, 197–205. [Google Scholar] [CrossRef]
  4. Meadows Jantz, L.; Jantz, R. The Anthropology Research Facility, University of Tennessee. In The Forensic Anthropology Laboratory; Warren, M.W., Walsh-Haney, H.A., Freas, L., Eds.; CRC Press: Boca Raton, FL, USA, 2008; pp. 7–21. [Google Scholar]
  5. Molleson, T.; Cox, M. The Middling Sort (The Spitalfields Project, CBA Research Report 86); Council for British Archaeology: London, UK, 1993; Volume 2, p. 231. [Google Scholar]
  6. Cardoso, H.F. Brief communication: The collection of identified human skeletons housed at the Bocage Museum (National Museum of Natural History), Lisbon, Portugal. Am. J. Phys. Anthr. 2006, 129, 173–176. [Google Scholar] [CrossRef] [PubMed]
  7. Maresh, M.M. Linear growth of long bones of extremities from infancy through adolescence: Continuing studies. AMA Am. J. Dis. Child. 1955, 89, 725–742. [Google Scholar] [CrossRef] [PubMed]
  8. Albanese, J. Identified Skeletal Reference Collections and the Study of Human Variation. Master’s Thesis, McMaster University, Hamilton, ON, Canada, 2003. [Google Scholar]
  9. Saunders, S.R.; De Vito, C. Subadult skeletons in the Raymond Dart Anatomical Collection: Research potential. Hum. Evol. 1991, 6, 421–434. [Google Scholar] [CrossRef]
  10. Stull, K.E.; Wolfe, C.A.; Corron, L.K.; Heim, K.; Hulse, C.N.; Pilloud, M. A Comparison of Subadult Skeletal and Dental Development Based on Living and Deceased Samples. Am. J. Phys. Anthropol. 2021, 175, 36–58. [Google Scholar] [CrossRef]
  11. Saunders, S.R.; Hoppa, R.D. Growth deficit in survivors and non-survivors: Biological mortality bias in subadult skeletal samples. Yearb. Phys. Anthropol. 1993, 36, 127–151. [Google Scholar] [CrossRef]
  12. Wood, J.W.; Milner, G.R.; Harpending, H.C.; Weiss, K.M.; Cohen, M.N.; Eisenberg, L.E.; Hutchinson, D.L.; Jankauskas, R.; Cesnys, G.; Cesnys, G.; et al. The osteological paradox: Problems of inferring prehistoric health from skeletal samples. Curr. Anthropol. 1992, 33, 343–370. [Google Scholar] [CrossRef]
  13. Konigsberg, L.; Frankenberg, S.R. Bayes in biological anthropology. Am. J. Phys. Anthropol. 2013, 57, 153–184. [Google Scholar] [CrossRef]
  14. Langley-Shirley, N.; Jantz, R.L. A Bayesian Approach to Age Estimation in Modern Americans from the Clavicle. J. Forensic Sci. 2010, 55, 571–583. [Google Scholar] [CrossRef] [PubMed]
  15. Beheim, B. Reproducible Research as Our New Default. Anthropol. News 2016, 57, e57–e58. [Google Scholar] [CrossRef]
  16. Martin, M.A. Biological Anthropology in 2018: Grounded in Theory, Questioning Contexts, Embracing Innovation. Am. Anthropol. 2019, 121, 417–430. [Google Scholar] [CrossRef]
  17. Dirkmaat, D.C.; Cabo, L.L.; Ousley, S.D.; Symes, S.A. New perspectives in forensic anthropology. Am. J. Phys. Anthropol. 2008, 137, 33–52. [Google Scholar] [CrossRef]
  18. Işcan, M.Y. Rise of forensic anthropology. Am. J. Phys. Anthropol. 1988, 31, 203–229. [Google Scholar] [CrossRef]
  19. Ubelaker, D.H. A history of forensic anthropology. Am. J. Phys. Anthropol. 2018, 165, 915–923. [Google Scholar] [CrossRef] [Green Version]
  20. Simmons-Ehrhardt, T. Open osteology: Medical imaging databases as skeletal collections. Forensic Imag. 2021, 26, 200462. [Google Scholar] [CrossRef]
  21. Colman, K.L.; de Boer, H.H.; Dobbe, J.G.; Liberton, N.P.T.J.; Stull, K.E.; van Eijnaten, M.; Streekstra, G.J.; Oostra, R.J.; Van Rijn, R.R.; van der Merwe, A.E. Virtual forensic anthropology: The accuracy of osteometric analysis of 3D bone models derived from clinical computed tomography (CT) scans. Forensic Sci. Int. 2019, 304, 109963. [Google Scholar] [CrossRef]
  22. Colman, K.L.; Dobbe, J.G.G.; Stull, K.E.; Ruijter, J.M.; Oostra, R.J.; van Rijn, R.R. The geometrical precision of virtual bone models derived from clinical computed tomography data for forensic anthropology. Int. J. Legal Med. 2017, 131, 1155–1163. [Google Scholar] [CrossRef] [Green Version]
  23. Stock, M.K.; Garvin, H.M.; Corron, L.K.; Hulse, C.N.; Cirillo, L.E.; Klales, A.R.; Colman, K.L.; Stull, K.E. The importance of processing procedures and threshold values in CT scan segmentation of skeletal elements: An example using the immature os coxa. Forensic Sci. Int. 2020, 309, 110232. [Google Scholar] [CrossRef]
  24. Garvin, H.; Stock, M.K. The utility of advanced imaging in forensic anthropology. Acad. Forensic Pathol. 2016, 6, 499–516. [Google Scholar] [CrossRef] [PubMed]
  25. Stull, K.E.; L’Abbé, E.N.; Steiner, S. Measuring distortion of skeletal elements in Lodox Statscan-generated images. Clin. Anat. 2013, 26, 780–786. [Google Scholar] [CrossRef] [PubMed] [Green Version]
  26. Brough, A.; Bennett, J.; Morgan, B. Anthropological measurement of the juvenile clavicle using multi-detector computed tomography—Affirming reliability. J. Forensic Sci. 2013, 58, 946–951. [Google Scholar] [CrossRef]
  27. Corron, L.; Marchal, F.; Condemi, S.; Chaumoître, K.; Adalian, P. Evaluating the consistency, repeatability and reproducibility of osteometric data on dry bone surfaces, scanned dry bone surfaces and scanned bone surfaces from living individuals. Bull. Mém. Société D’Anthropologie Paris 2017, 29, 33–53. [Google Scholar] [CrossRef]
  28. Corron, L.K.; Stock, M.K.; Cole, S.J.; Hulse, C.N.; Garvin, H.M.; Klales, A.R.; Stull, K.E. Standardizing ordinal subadult age indicators: Testing for observer agreement and consistency across modalities. Forensic Sci. Int. 2021, 320, 110687. [Google Scholar] [CrossRef] [PubMed]
  29. Franco, A.; Vetter, F.; de Fatima Coimbra, E.; Fernandes, A.; Thevissen, P. Comparing third molar root development staging in panoramic radiography, extracted teeth, and cone beam computed tomography. Int. J. Legal Med. 2019, 134, 347–353. [Google Scholar] [CrossRef]
  30. Spake, L.; Meyers, J.; Blau, S.; Cardoso, H.; Lottering, N. A simple and software-independent protocol for the measurement of post-cranial bones in anthropological contexts using thin slab maximum intensity projection. Forensic Imag. 2020, 20, 200354. [Google Scholar] [CrossRef]
  31. Stull, K.E.; Tise, M.L.; Ali, Z.; Fowler, D.R. Accuracy and reliability of measurements obtained from computed tomography 3D volume rendered images. Forensic Sci. Int. 2014, 238, 133–140. [Google Scholar] [CrossRef] [Green Version]
  32. De Tobel, J.; Ottow, C.; Widek, T.; Klasinc, I.; Mörnstad, H.; Thevissen, P.W.; Verstraete, K.L. Dental and Skeletal Imaging in Forensic Age Estimation: Disparities in Current Approaches and the Continuing Search for Optimization. Semin. Musculoskelet. Radiol. 2020, 24, 510–522. [Google Scholar] [CrossRef]
  33. Berry, S.D.; Edgar, H.J.H. Announcement: The New Mexico Decedent Image Database. Forensic Imag. 2021, 24, 200436. [Google Scholar] [CrossRef]
  34. Ousley, S. A Radiographic Database for Estimating Biological Parameters in Modern Subadults; NIJ Award 2008-DN-BX-K152—Final Technical Report; Mercyhurst University: Erie, PA, USA, 2013; p. 58. [Google Scholar]
  35. National Commission for the Protection of Human Subjects of Biomedical and Behavioral Research. The Belmont Report: Ethical Principles and Guidelines for the Protection of Human Subjects of Research; U.S. Department of Health and Human Services: Washington, DC, USA, 1979; p. 10.
  36. Bidgood, W.D.; Horii, S.C.; Prior, F.W.; Van Syckle, D.E. Understanding and Using DICOM, the Data Interchange Standard for Biomedical Imaging. J. Am. Med. Inform. Assoc. 1997, 4, 199–212. [Google Scholar] [CrossRef] [Green Version]
  37. Johnson, A.E.; Pollard, T.; Berkowitz, S.J.; Greenbaum, N.R.; Lungren, M.P.; Deng, C.; Mark, R.G.; Horng, S. MIMIC-CXR: A large publicly available database of labeled chest radiographs. arXiv 2019, arXiv:1901.07042. [Google Scholar]
  38. Deyle, S.; Wagner, A.; Benneker, L.M.; Jeger, V.; Eggli, S.; Bonel, H.M.; Zimmermann, H.; Exadaktylos, A.K. Could Full-body Digital X-ray (LODOX-Statscan) Screening in Trauma Challenge Conventional Radiography? J. Trauma Inj. Infect. Crit. Care 2009, 66, 418–422. [Google Scholar] [CrossRef] [Green Version]
  39. Monsalve Vargas, T.; Isaza, J. Estudio biosocial de una muestra de restos óseos provenientes de la colección osteológica de referencia de la Universidad de Antioquia. Bol. Antropol. 2014, 29, 28–55. [Google Scholar]
  40. Food and Drug Administration Pediatric X-ray Imaging. 2018. Available online: https://www.fda.gov/radiation-emitting-products/medical-imaging/pediatric-x-ray-imaging (accessed on 1 November 2021).
  41. Hon, K.L.; Nelson, E.A. Gender disparity in paediatric hospital admissions. Ann. Acad. Med. Singap. 2006, 35, 882–888. [Google Scholar]
  42. Zachariasse, J.M.; Borensztajn, D.M.; Nieboer, D.; Alves, C.F.; Greber-Platzer, S.; Keyzer-Dekker, C.M.G.; Maconochie, I.K.; Steyerberg, E.W.; Smit, F.J.; Moll, H.A. Sex-specific differences in children attending the emergency department: Prospective observational study. BMJ Open 2020, 10, e035918. [Google Scholar] [CrossRef]
  43. Lostao, L.; Blane, D.; Gimeno, D.; Netuveli, G.; Regidor, E. Socioeconomic patterns in use of private and public health services in Spain and Britain: Implications for equity in health care. Health Place 2014, 25, 19–25. [Google Scholar] [CrossRef] [PubMed]
  44. Morris, S.; Sutton, M.; Gravelle, H. Inequity and inequality in the use of health care in England: An empirical investigation. Soc. Sci. Med. 2005, 60, 1251–1266. [Google Scholar] [CrossRef]
  45. Regidor, E.; Martínez, D.; Calle, M.E.; Astasio, P.; Ortega, P.; Domínguez, V. Socioeconomic patterns in the use of public and private health services and equity in health care. BMC Health Serv. Res. 2008, 8, 183. [Google Scholar] [CrossRef] [PubMed] [Green Version]
  46. Basu, S.; Holubkov, R.; Dean, J.M.; Meert, K.L.; Berg, R.A.; Carcillo, J.; Newth, C.J.L.; Harrison, R.E.; Pollack, M.M.; CPCCRN. PICU Autopsies: Rates, Patient Characteristics, and the Role of the Medical Examiner. Pediatr. Crit Care Med. 2018, 19, 1137–1145. [Google Scholar] [CrossRef]
  47. Sorenson, S.B. Gender disparities in injury mortality: Consistent, persistent, and larger than you’d think. Am. J. Public Health 2011, 101 (Suppl. S1), S353–S358. [Google Scholar] [CrossRef]
  48. Stull, K.E.; Corron, L.K. Subadult Virtual Anthropology Database (SVAD) Data Collection Protocol: Amira. August 2021. Available online: https://zenodo.org/record/5348411#.YdVRQ9pByUk (accessed on 1 November 2021). [CrossRef]
  49. Stull, K.E.; Corron, L.K. Subadult Virtual Anthropology Database (SVAD) Data Collection Protocol: Epiphyseal Fusion, Diaphyseal Dimensions, Dental Development Stages, Vertebral Neural Canal Dimensions. August 2021. Available online: https://zenodo.org/record/5348392#.YdVLBlko-Uk (accessed on 1 November 2021). [CrossRef]
  50. Stull, K.E. KScollect: Purpose-Built App for Collecting Data for Future Inclusion in KidStats. 2017. Available online: https://github.com/geanes/KScollect (accessed on 1 November 2021).
  51. Fazekas, I.; Kosa, F. Forensic Fetal Osteology; Budapest, Hungary, 1978. [Google Scholar]
  52. Moore-Jansen, P.; Ousley, S.; Jantz, R. Data Collection Procedures for Forensic Skeletal Material; Department of Anthropology, The University of Tennessee: Knoxville, TN, USA, 1994. [Google Scholar]
  53. Stull, K.E.; L’Abbé, E.N.; Ousley, S.D. Using multivariate adaptive regression splines to estimate subadult age from diaphyseal dimensions. Am. J. Phys. Anthropol. 2014, 154, 376–386. [Google Scholar] [CrossRef] [Green Version]
  54. Robinson, C.; Eisma, R.; Morgan, B. Anthropological measurement of lower limb and foot bones using multi-detector computed tomography. J. Forensic Sci. 2008, 53, 1289–1295. [Google Scholar] [CrossRef]
  55. Watts, R. Non-specific indicators of stress and their association with age at death in medieval York: Using stature and vertebral neural canal size to examine the effects of stress occurring during different periods of development. Int. J. Osteoarchaeol. 2011, 21, 568–576. [Google Scholar] [CrossRef]
  56. Watts, R. Lumbar vertebral canal size in adults and children: Observations from a skeletal sample from London, England. Homo—J. Comp. Hum. Biol. 2013, 64, 120–128. [Google Scholar] [CrossRef] [PubMed]
  57. AlQahtani, S.J.; Hector, M.P.; Liversidge, H.M. Brief communication: The London atlas of Human tooth development and eruption. Am. J. Phys. Anthropol. 2010, 142, 461–490. [Google Scholar] [CrossRef]
  58. Moorrees, C.; Fanning, E.; Hunt, E.E. Age variation of formation stages for ten permanent teeth. J. Dent. Res. 1963, 42, 1490–1502. [Google Scholar] [CrossRef]
  59. Vanbelle, S. A New Interpretation of the Weighted Kappa Coefficients. Psychometrika 2016, 81, 399–410. [Google Scholar] [CrossRef] [PubMed]
  60. De Tobel, J.; Fieuws, S.; Hillewig, E.; Phlypo, I.; van Wikj, M.; de Haas, M.; Politis, C.; Verstraete, K.; Thevissen, P.W. Multi-factorial age estimation: A Bayesian approach combining dental and skeletal magnetic resonance imaging. Forensic Sci. Int. 2020, 306, 110054. [Google Scholar] [CrossRef]
  61. Lottering, N.; MacGregor, D.M.; Barry, M.D.; Reynolds, M.S.; Gregory, L.S. Introducing standardized protocols for anthropological measurement of virtual subadult crania using computed tomography. J. Forensic Radiol. Imaging 2014, 2, 34–38. [Google Scholar] [CrossRef]
  62. Stock, M.K.; Stull, K.E.; Garvin, H.M.; Klales, A. Development of Modern Human Subadult Age and Sex Estimation Standards Using Multi-Slice Computed Tomography Images from Medical Examiner’s Offices; International Society for Optics and Photonics: Bellingham, DC, USA, 2016; Volume 9967, p. 99670E. [Google Scholar]
  63. Berry, S.D.; Edgar, H.J.H. Extracting and Standardizing Medical Examiner Data to Improve Health. AMIA Jt. Sum. Transl. Sci. Proc. 2020, 2020, 63–70. [Google Scholar]
  64. Lottering, N.; MacGregor, D.; Alston, C.; Watson, D.; Gregory, L.S. Introducing computed tomography standards for age estimation of modern Australian subadults using postnatal ossification timings of select cranial and cervical sites. J. Forensic Sci. 2016, 61, S39–S52. [Google Scholar] [CrossRef]
  65. Liebenberg, L.; Kruger, G.C. Standardization and quality assurance in skeletal landmark placement and osteometry. Forensic Sci. Int. 2020, 308, 110168. [Google Scholar] [CrossRef] [PubMed]
  66. Allen, C.; Mehler, D.M.A. Open science challenges, benefits and tips in early career and beyond. PLoS Biol. 2019, 17, e3000246. [Google Scholar]
Figure 1. The SVAD contents and available derivatives. Solid lines indicate derivatives directly available through the SVAD Zenodo Community; dashed lines indicate derivatives available upon request, either through SVAD or collaborators (* U.S. CT scans are available through NMDID).
Forensicsci 02 00003 g001
Figure 2. Types of medical images used for data collection in the SVAD. (a) full-body CT scan (sagittal, frontal, transverse views) and volume rendering of the skeleton; (b) conventional radiographs, examples herein of the knees (top), teeth and proximal radius (middle), and teeth (bottom); and (c) full-body Lodox Statscan.
Forensicsci 02 00003 g002
Figure 3. Cumulative age distribution of the SVAD samples by country of origin.
Forensicsci 02 00003 g003
Figure 4. Age distributions of the SVAD samples by country.
Forensicsci 02 00003 g004
Figure 5. Sex distribution of the combined SVAD samples.
Forensicsci 02 00003 g005
Figure 6. Long bone dimensions taken on virtual surfaces reconstructed from CT scans.
Forensicsci 02 00003 g006
Figure 7. Antero-posterior (AP) and transverse (TR) vertebral neural canal (VNC) diameters taken on virtual surfaces reconstructed from CT scans.
Forensicsci 02 00003 g007
Figure 8. Three staging systems used to score the ossification of secondary centers, carpals, and tarsals (2-stage system) and epiphyseal fusion of the long bones and pelvis (7-stage system).
Forensicsci 02 00003 g008
Table 1. Demographics of the SVAD samples.
ContinentCountrySample Size (by Sex)Age Range (Years)Deceased/Living
AfricaAngolaN = 186 (99 F, 87 M)0–15 yearsLiving
South AfricaN = 1352 (531 F, 821 M)0–12 yearsLiving
South AmericaColombiaN = 31 (5 F, 26 M)0–22 yearsDeceased
BrazilN = 500 (248 F, 252 M)0–15 yearsLiving
EuropeFranceN = 578 (260 F, 318 M)0–15 yearsLiving
The NetherlandsN = 218 (109 F, 107 M)0–15 yearsLiving
AsiaTaiwanN = 730 (306 F, 424 M)0–16 yearsLiving
North AmericaUnited States
(Maryland)
N = 244 (96 F, 148 M)0–20 yearsDeceased
United States
(New Mexico)
N = 1077 (441 F, 636 M)0–21 yearsDeceased
Table 2. Context and availability of SVAD images and derivatives.
CountryPartner InstitutionContextModalityDerivativesAvailability
AngolaDepartamento de Ciências da Vida, University of Coimbra and private medical cabinets from Luanda, AngolaPrivate practiceConventional
radiograph
Epiphyseal fusion stages
Dental development stages
Derivatives
South AfricaRed Cross War Memorial Children’s Hospital, Cape Town
Hospital
HospitalLodox StatscanDental development stagesEpiphyseal fusion stages
Long bone dimensions
Derivatives
Forensic Pathology Services, Salt River, Cape TownForensicLodox StatscanLong bone dimensionsDerivatives
ColombiaUniversidad de Antioquia, MedellinForensicDry bone (long bone dimensions and epiphyseal fusion)
Conventional
radiograph (dental development and epiphyseal fusion)
Long bone dimensions
VNC diameters
Epiphyseal fusion stages
Dental development stages
Radiographs and derivatives
BrazilUniversidade de São Paulo (FOUSP)Dental PracticePanoramic radiographDental development stagesPanoramic radiographs and derivatives
FrancePublic hospital services of Marseille (AP-HM)HospitalCT scanLong bone dimensions
VNC diameters
Epiphyseal fusion stages
Dental development stages
Segmented bone surfaces
Derivatives
The NetherlandsAmsterdam Medical Center (Hospital)HospitalCT scanLong bone dimensions
VNC diameters
Epiphyseal fusion stages
Dental development stages
Segmented bone surfaces
CT scans and derivatives
TaiwanNational Taiwan University Hospital, Taipei CityHospitalCT scanLong bone dimensions
VNC diameters
Epiphyseal fusion stages
Dental development stages
Segmented bone surfaces
Derivatives
United States *Office of the Chief Medical Examiner, Baltimore, MarylandMedico-legalCT scanLong bone dimensions
Epiphyseal fusion stages
Derivatives
University of New Mexico Health Sciences Center, Office of the Medical Investigator, Albuquerque, New MexicoMedico-legalCT scanLong bone dimensions
VNC diameters
Epiphyseal fusion stages
Dental development stages
Pelvic landmarks
Segmented bone surfaces
CT scans ** and derivatives
* For the two U.S. samples, age, sex, population affiliation/social race, manner of death and cause of death are also known. ** The University of New Mexico CT scans can be downloaded via the NMDID website and linked to the derivatives we have available (https://nmdid.unm.edu/ accessed on 1 November 2021).
Table 3. Stages used to score development of permanent teeth.
StageMonoradicular TeethPluriradicular TeethDescription
1 Forensicsci 02 00003 i001 Forensicsci 02 00003 i002Initial cusp formation
2 Forensicsci 02 00003 i003 Forensicsci 02 00003 i004Coalescence of cusps
3 Forensicsci 02 00003 i005 Forensicsci 02 00003 i006Cusp outline complete
4 Forensicsci 02 00003 i007 Forensicsci 02 00003 i008Crown half completed with dentine formation
5 Forensicsci 02 00003 i009 Forensicsci 02 00003 i010Crown three quarters completed
6 Forensicsci 02 00003 i011 Forensicsci 02 00003 i012Crown completed with defined pulp roof
7 Forensicsci 02 00003 i013 Forensicsci 02 00003 i014Initial root formation with diverge edges
8 Forensicsci 02 00003 i015 Forensicsci 02 00003 i016Root length less than crown length
9 Forensicsci 02 00003 i017 Forensicsci 02 00003 i018Root length equals crown length
10 Forensicsci 02 00003 i019 Forensicsci 02 00003 i020Three quarters of root length developed with diverge ends
11 Forensicsci 02 00003 i021 Forensicsci 02 00003 i022Root length completed with parallel ends
12 Forensicsci 02 00003 i023 Forensicsci 02 00003 i024Apex closed (root ends converge) with wide periodontal ligament
13 Forensicsci 02 00003 i025 Forensicsci 02 00003 i026Apex closed with normal periodontal ligament width
Table 4. Observer errors of continuous data: minimum, maximum, and average values of technical errors of measurement (TEM) and percent TEM.
Intra-Observer ErrorInter-Observer Error
TEM (mm)TEM (%)TEM (mm)TEM (%)
MINMAXAVGMINMAXAVGMINMAXAVGMINMAXAVG
Long Bone Dimensions0.04260.3640.1560.0691.7230.5020.03540.340.1330.0980.8770.453
Vertebral Neural Canal0.0240.1780.1030.1611.1040.5890.1180.3580.1930.6722.1171.127
Table 5. Observer agreement of ordinal data using quadratic weighted Cohen’s Kappa.
Intra-Observer ErrorInter-Observer Error
Cohen’s KappaCohen’s Kappa
MINMAXAVGMINMAXAVG
Epiphyseal fusion stages *0.5451.000.9740.5011.000.930
Dental development stages *0.6871.000.9390.7741.000.965
* Values updated from [28]; the original publication employed linear weighted Cohen’s Kappa.
Publisher’s Note: MDPI stays neutral with regard to jurisdictional claims in published maps and institutional affiliations.

