Article

A Novel CuAlMnFe/CeO2 Composite Alloy: Investigating the Wear and Corrosion Features

1
Rare Earth Elements Application and Research Center (MUNTEAM), Munzur University, 62000 Tunceli, Turkey
2
Research and Development Center (SARGEM), Sakarya University, 54187 Sakarya, Turkey
*
Author to whom correspondence should be addressed.
Solids 2025, 6(3), 43; https://doi.org/10.3390/solids6030043
Submission received: 3 July 2025 / Revised: 3 August 2025 / Accepted: 5 August 2025 / Published: 11 August 2025

Abstract

Shape memory alloys (SMAs) are known for their exceptional mechanical properties, particularly their superior wear resistance compared to conventional alloys with similar surface hardness. Rare earth oxides are often used as additives to further improve these characteristics. This study investigates the effects of different CeO2 (cerium dioxide) concentrations (0.01 wt.%, 0.1 wt.%, 0.5 wt.%, and 1.0 wt.%) on the properties of CuAlMnFe alloys produced via powder metallurgy (PM). Various analyses were performed, including scanning electron microscopy (SEM), Energy Dispersive Spectroscopy (EDS), X-ray diffraction (XRD), as well as hardness, wear, and corrosion tests. The increase in wear rate is closely related to the formation of precipitates from CeO2 addition. Improvements in wear resistance and hardness are attributed to the effects of grain refinement and solid solution strengthening due to CeO2. Specifically, the wear rate increased from 1.5 × 10⁻³ mm3/(Nm) to 3.4 × 10⁻³ mm3/(Nm) with higher CeO2 content. Additionally, the friction coefficient of the CuAlMnFe alloy was reduced with CeO2 addition, indicating enhanced frictional properties. The optimal CeO2 concentration of 0.5% was found to improve grain uniformity, resulting in better wear resistance. Incorporating CeO2 particles into CuAlMnFe alloy enhances hardness and reduces wear rate when used in appropriate amounts. Additionally, it exhibits superior corrosion resistance, as evidenced by a positive shift in corrosion potential in Tafel measurements in solutions and a decrease in corrosion current density. The C0.5 specimen showed the highest corrosion potential (Ecorr, −588 V) and the lowest corrosion current density (icorr, 6.17 μA/cm2) during electrochemical corrosion in 3.5 wt.% NaCl solution.

1. Introduction

As new materials continue to evolve, their characteristics are becoming increasingly significant. The exceptional properties of alloys have increasingly captured the interest of researchers in the medical and engineering sectors. The wear performance is especially critical for applications that involve the relative sliding motion of novel materials. Under contact conditions, wear can occur through various mechanisms, including abrasive and adhesive wear [1]. SMAs exhibit remarkable superelasticity (or pseudoelasticity) and high hardness, enabling them to withstand severe tribological conditions [2]. Shape memory alloys (SMAs) have been utilized as actuators and sensors in applications requiring high-temperature actuation, thanks to their elevated phase transformation temperature [3]. SMAs exhibit two distinct phases (austenite and martensite). Each phase has unique mechanical properties and crystallographic structures. The distinctive behavior of SMAs is primarily due to a martensitic phase transition, which involves a transformation from a stable, robust crystal structure at higher temperatures. As the temperature of the alloy rises, martensite transforms into austenite, while increased applied stress converts austenite back to martensite. The introduction of stress tends to alter the transformation temperatures of SMAs. Despite experiencing residual deformations during inelastic loading and unloading cycles, an SMA returns to its original shape upon heating. This effect is known as the shape memory effect (SME). At high temperatures, an SMA can return to its original shape upon unloading, without needing further heating [4]. On the other hand, under mechanical stress, SMAs deform, but they revert to their original shape rapidly once the stress is removed. The SME and SE of SMAs lead to an increased real contact area during sliding wear. This expansion of the contact area reduces localized compressive stress and stress concentrations in the substrate, resulting in lower wear. Furthermore, the high plastic yield stress of SMA could delay plastic deformation, which significantly boosts its wear resistance [5]. SMAs, especially nickel–titanium (NiTi) and copper (Cu)-based alloys, are widely used in industrial applications. Despite superior shape recovery properties making NiTi-based shape memory alloys the most desirable for practical applications, NiTi SMAs are more costly and harder to process than Cu-based SMAs [6]. Also, Cu-based SMAs tend to show more reliable superelasticity when subjected to temperature changes. Cu-based SMAs are fundamentally built on binary systems (Cu-Sn, Cu-Zn, Cu-Al, etc.) and dopant elements, including Ni, Ti, Co, and Mn, to make ternary systems. Trehern et al. [7] showed that the phase transition temperatures of aluminum are influenced by the alloy’s chemical composition. Moskvichev et al. [8] attributed that Cu–Al–Mn alloys have advantages in mechanical properties over other Cu-based SMAs, thanks to the addition of Manganese (Mn). Sattari et al. [1] suggested that martensitic transformations are regarded as mechanisms that enhance wear properties under varying loading conditions. To improve the mechanical properties of SMAs and their structure, it could help to add different elements. Zhang et al. [9] mentioned that adding Fe to ternary Cu-based SMAs could effectively increase their compressive fracture strain. Wang et al. [10] indicated that the wear resistance of materials is influenced by their mechanical properties, as well as the material’s hardening. However, in SMAs, these properties are not the primary factors determining wear resistance. Instead, the phase transformation of SMAs, which is dependent on the transformation temperature, contributes to its wear resistance. The wear behavior of SMA alloys produced through conventional methods has been extensively studied. It is commonly used across various sectors, like aerospace and medical areas, due to its high fatigue and corrosion resistance. Among the SMAs, Nitinol is a prominent SMA known for its impressive tribological performance, particularly in interactions with other materials [11]. However, the high cost of Nitinol can limit its use in certain applications. Moreover, the difficulty in machining and the sensitivity of composition in NiTi alloys with complex structures hinder their widespread applications. Cu-based alloys offer strain recovery, thermal conductivity, and corrosion resistance. While pure copper offers excellent electrical and thermal conductivity, it suffers from low hardness and tensile strength [12]. The mechanical strength of copper can be significantly improved by incorporating dispersed particles into its matrix. Also, dispersion-strengthened copper matrix composites are alloys that have been strengthened through the dispersion of copper. However, the ductile copper’s low hardness results in a lack of wear resistance, making it prone to material removal in the form of wear debris when it slides against a hardened steel counterpart [13]. Furthermore, Cu-based alloys are crucial to address the issues of abrasion in materials and prevent SMAs from losing their SME due to wear. Additionally, surface wear can deform the copper surface, diminishing its strength and hardness [14]. Xu et al. specified that the incorporation of elements like Ni, W, Mo, and Co can notably impact the phase transformation behavior, as well as the shape memory effect (SME) and superelasticity (SE) of SMAs. Nevertheless, incorporating these elements does not considerably improve the mechanical properties of SMAs. Rare Earth Elements (REEs) significantly enhance the microhardness and wear resistance of materials due to their chemical and physical properties and their ability to refine grains [15]. REEs are particularly well-suited for metal alloying, as they possess physical and chemical properties that make them a common alloying element. REEs could also act as grain refiners by providing nucleation sites, which improve the strength of alloys [16,17]. Moreover, REEs act as highly active alloying elements that can interrupt grain growth and form stable compounds. The introduction of REEs to SMAs leads to the formation of grain refinement and solid solution strengthening. The quantity of REEs added significantly impacts the mechanical properties and SME. Lu et al. [18] demonstrated that the incorporation of La2O3 into SMAs has been found to enhance the microstructure and yield strength of the material while investigating the impact of rare earth addition on the wear properties of the SMAs. Zhao et al. [19] mentioned that Ce addition promotes advantages such as grain refinement and matrix hardening, all of which contribute to enhanced SME. The incorporation of Ce can significantly improve the creep resistance and corrosion performance of SMAs [20]. Liu et al. [21] demonstrated that incorporating varying amounts of CeO2 significantly enhanced the wear resistance of the material. This demonstrates that alloying with REEs could be an effective method for improving the mechanical properties of SMAs. Hussain et al. [22] indicated that if the quaternary alloying elements have low solubility, they can inhibit grain growth and improve the mechanical properties. Yang et al. [23] reported that the CuAlMnFe single crystals exhibited abnormal grain growth, demonstrated excellent SE, and significant SME was obtained due to the stabilization of martensite. Pandey et al. [24] mentioned that conventional casting of Cu-based alloy can result in a coarse-grain structure. Also, they noted that coarse grains lead to reduced mechanical properties, while fine grains enhance mechanical performance. Nevertheless, maintaining a fine-grain structure is challenging in casting processes, making it difficult to achieve. In contrast, the powder metallurgy (PM) route could allow to produce materials with fine-grain structures. It was reported in the literature that the addition of CeO2 leads to an improvement in mechanical properties [25]. Additionally, the mechanical characteristics of Cu-based alloys enhanced by microstructural alteration have been shown in earlier studies to have detrimental impacts on corrosion behavior [26,27]. Loa et. al. indicated that corrosion resistance is mostly caused by the Cu-rich precipitates, which form at the grain boundaries [28]. Tian et. al. reported that the rare earth elements can offer superior protection against localized corrosion of alloy [29]. Chen et al. indicated that the alloy with refined grain and lessened grain boundary precipitation from the addition of rare earth elements, which significantly reduced corrosion susceptibility [30]. The effect of CeO2 addition to Cu-based alloys’ wear and corrosion features in the literature is unclear, and further research is needed to fully understand its role in improving this property. The role of CeO2 additions, particularly through the powder metallurgy route, in influencing the microstructural evolution (e.g., grain refinement, precipitate formation, phase stability), the resulting wear mechanisms (e.g., abrasive, adhesive, delamination), and the corrosion behavior (e.g., passive film formation, pitting resistance) within the complex CuAlMnFe alloy system. This gap pertains to how these interconnected aspects are synergistically affected by varying CeO2 concentrations in this specific alloy. This study presents novel research by uniquely investigating the combined effects of CeO2 addition on the wear and corrosion features of CuAlMnFe alloys, specifically those produced via powder metallurgy, thereby providing new insights into the synergistic improvements achieved through this composition and processing route. The microstructural characteristics of CuAlMnFe with varying CeO2 contents (0.05 wt.%, 0.1 wt.%, 0.5 wt.%, and 1.0 wt.%) were investigated. The impact of CeO2 addition on mechanical properties was thoroughly analyzed. The primary mechanisms involved in the wear process are abrasion, adhesion, and delamination. In this study, using SEM and XRD, the alloy’s shape and structure were examined. Using potentiodynamic polarization and electrochemical impedance spectroscopy in 3.5 wt.% NaCl solution, the corrosion behavior of CeO2, including Cu-based alloy specimens, was investigated.

2. Materials and Methods

In this study, a sample was obtained using the parameters shown in Table 1 to determine the CuAlMnFe composition. To create reference samples with the same composition, metal powders of Cu, Al, Fe, Mn, and CeO2 with a purity of 99.99% and particle sizes of less than 50 µm were used (Merck, Darmstadt, Germany). The metal powders, totaling 10 g, were mixed in a metallic powder blending machine (MS BM_S38003) (MSE, Kocaeli, Turkey). The mixing was performed with a 5:1 powder/ball ratio, using stearic acid as a lubricant, in an inert Ar gas atmosphere, at a speed of 300 rpm, for mixing durations of 0, 8, 12, 16, 20, and 24 h, to ensure a homogeneous mixture. The mechanically alloyed powders were compacted using a hydraulic press (Testform, Ankara, Turkey) in a cylindrical mold (10 mm). During the pelletizing process, the powder samples were pressed under a pressure of 400 MPa for one minute using a cold press. A sample of the pellet is shown in Figure 1a. The reference pellets were subjected to a sintering process in a tube furnace (MSE, Kocaeli, Turkey) under a high-purity (99.99%) argon atmosphere, with a flow rate of 1 mL/min. The process was conducted under vacuum at temperatures of 950 °C, with a heating rate of 5 °C/min and a cooling rate of 10 °C/min. Following sintering, the samples underwent homogenization at 950 °C for 1 h in a muffle furnace (MSE, Kocaeli, Turkey). Alloy samples that were sintered and homogenized are shown in Figure 1b. To achieve the transformation from the austenite phase to the martensite phase, the high-temperature samples were rapidly cooled in room-temperature brine. Specifically, the lower concentrations (0.05 wt.% and 0.1 wt.%) were selected to observe the initial impact of CeO2 as a minor additive, often explored for grain refinement and minor property enhancements. The 0.5 wt.% concentration was chosen based on preliminary experimental trials that indicated a potential optimal range for mechanical and corrosion properties, where beneficial effects like improved hardness and corrosion resistance were more pronounced without leading to excessive agglomeration. This aligns with findings in similar alloy systems where rare earth elements showed peak performance at moderate concentrations [31]. The highest concentration (1.0 wt.%) was included to investigate the effects of increased CeO2 content, particularly to determine if further additions would lead to continued improvement or detrimental effects due to saturation, as suggested by thermodynamic modeling studies on Ce-containing alloys [32]. These preliminary experiments and literature review guided our selection to cover a meaningful range for comprehensive analysis.
After thermal treatments, the samples were prepared for evaluation using X-ray diffraction (XRD) and scanning electron microscopy (SEM). The oxide layers formed on the surface of the samples were sequentially ground with 240, 400, 600, 800, 1000, and 1200-grit sandpaper to remove them. The samples were then polished with a 1 µm alumina suspension and cleaned with alcohol in an ultrasonic cleaner (Heilscher, Teltow, Germany). The etching process of the samples was carried out in a solution consisting of 3 g of FeCl3, 5 mL of HCl, and 100 mL of H2O. XRD analyses of the samples were performed using the Rigaku Miniflex 600 (Rigaku Corporation, Tokyo, Japan). The phase identification of the sintered alloy samples was conducted using Cu Kα radiation (0.1542 nm) over a 20–90° (2θ) range with a scanning rate of 1°/min for X-ray diffraction. The microstructural analyses of the alloy samples were conducted using a Hitachi SU3500 SEM (Hitachi High-Technologies Corporation, Tokyo, Japan) and an Oxford AZTech (AZTech, Oxford, UK). Vickers hardness testing was applied to investigate the hardness of each sample. Microhardness measurements were performed under a 5 N load for 15 s. To ensure the reliability of the test results, both Vickers hardness and fracture toughness tests were conducted five times each, and the average values were used. The tribological behavior of the alloy samples was investigated under dry sliding conditions at room temperature and ambient humidity using a tribometer (CSM Instruments TRB 18–317) (CSM Instrument, Graz, Austria). Wear tests of the alloy samples against Al2O3 balls (Φ 6 mm) were conducted with a 5.0 N load and a sliding speed of 10 cm/s for a total duration of 60 min. The corrosion tests and corrosion analysis of alloys were carried out with the Corrtest CS350M (Corrtest Instruments, Wuhan, China). To evaluate corrosion behavior, tests were performed on sintered samples using polarization, electrochemical impedance spectroscopy (EIS), and a potentiostat/galvanostat system (Corrtest Instruments, Wuhan, China). The corrosion behavior of the CeO2-additive alloys after sintering was studied in a 3.5 wt.% NaCl solution, with a scan rate of 1 mV/s, using an Ag-AgCl reference electrode. All samples were ultrasonically cleaned with alcohol and then dried with warm air before testing.

3. Results and Discussion

3.1. Phase Composition

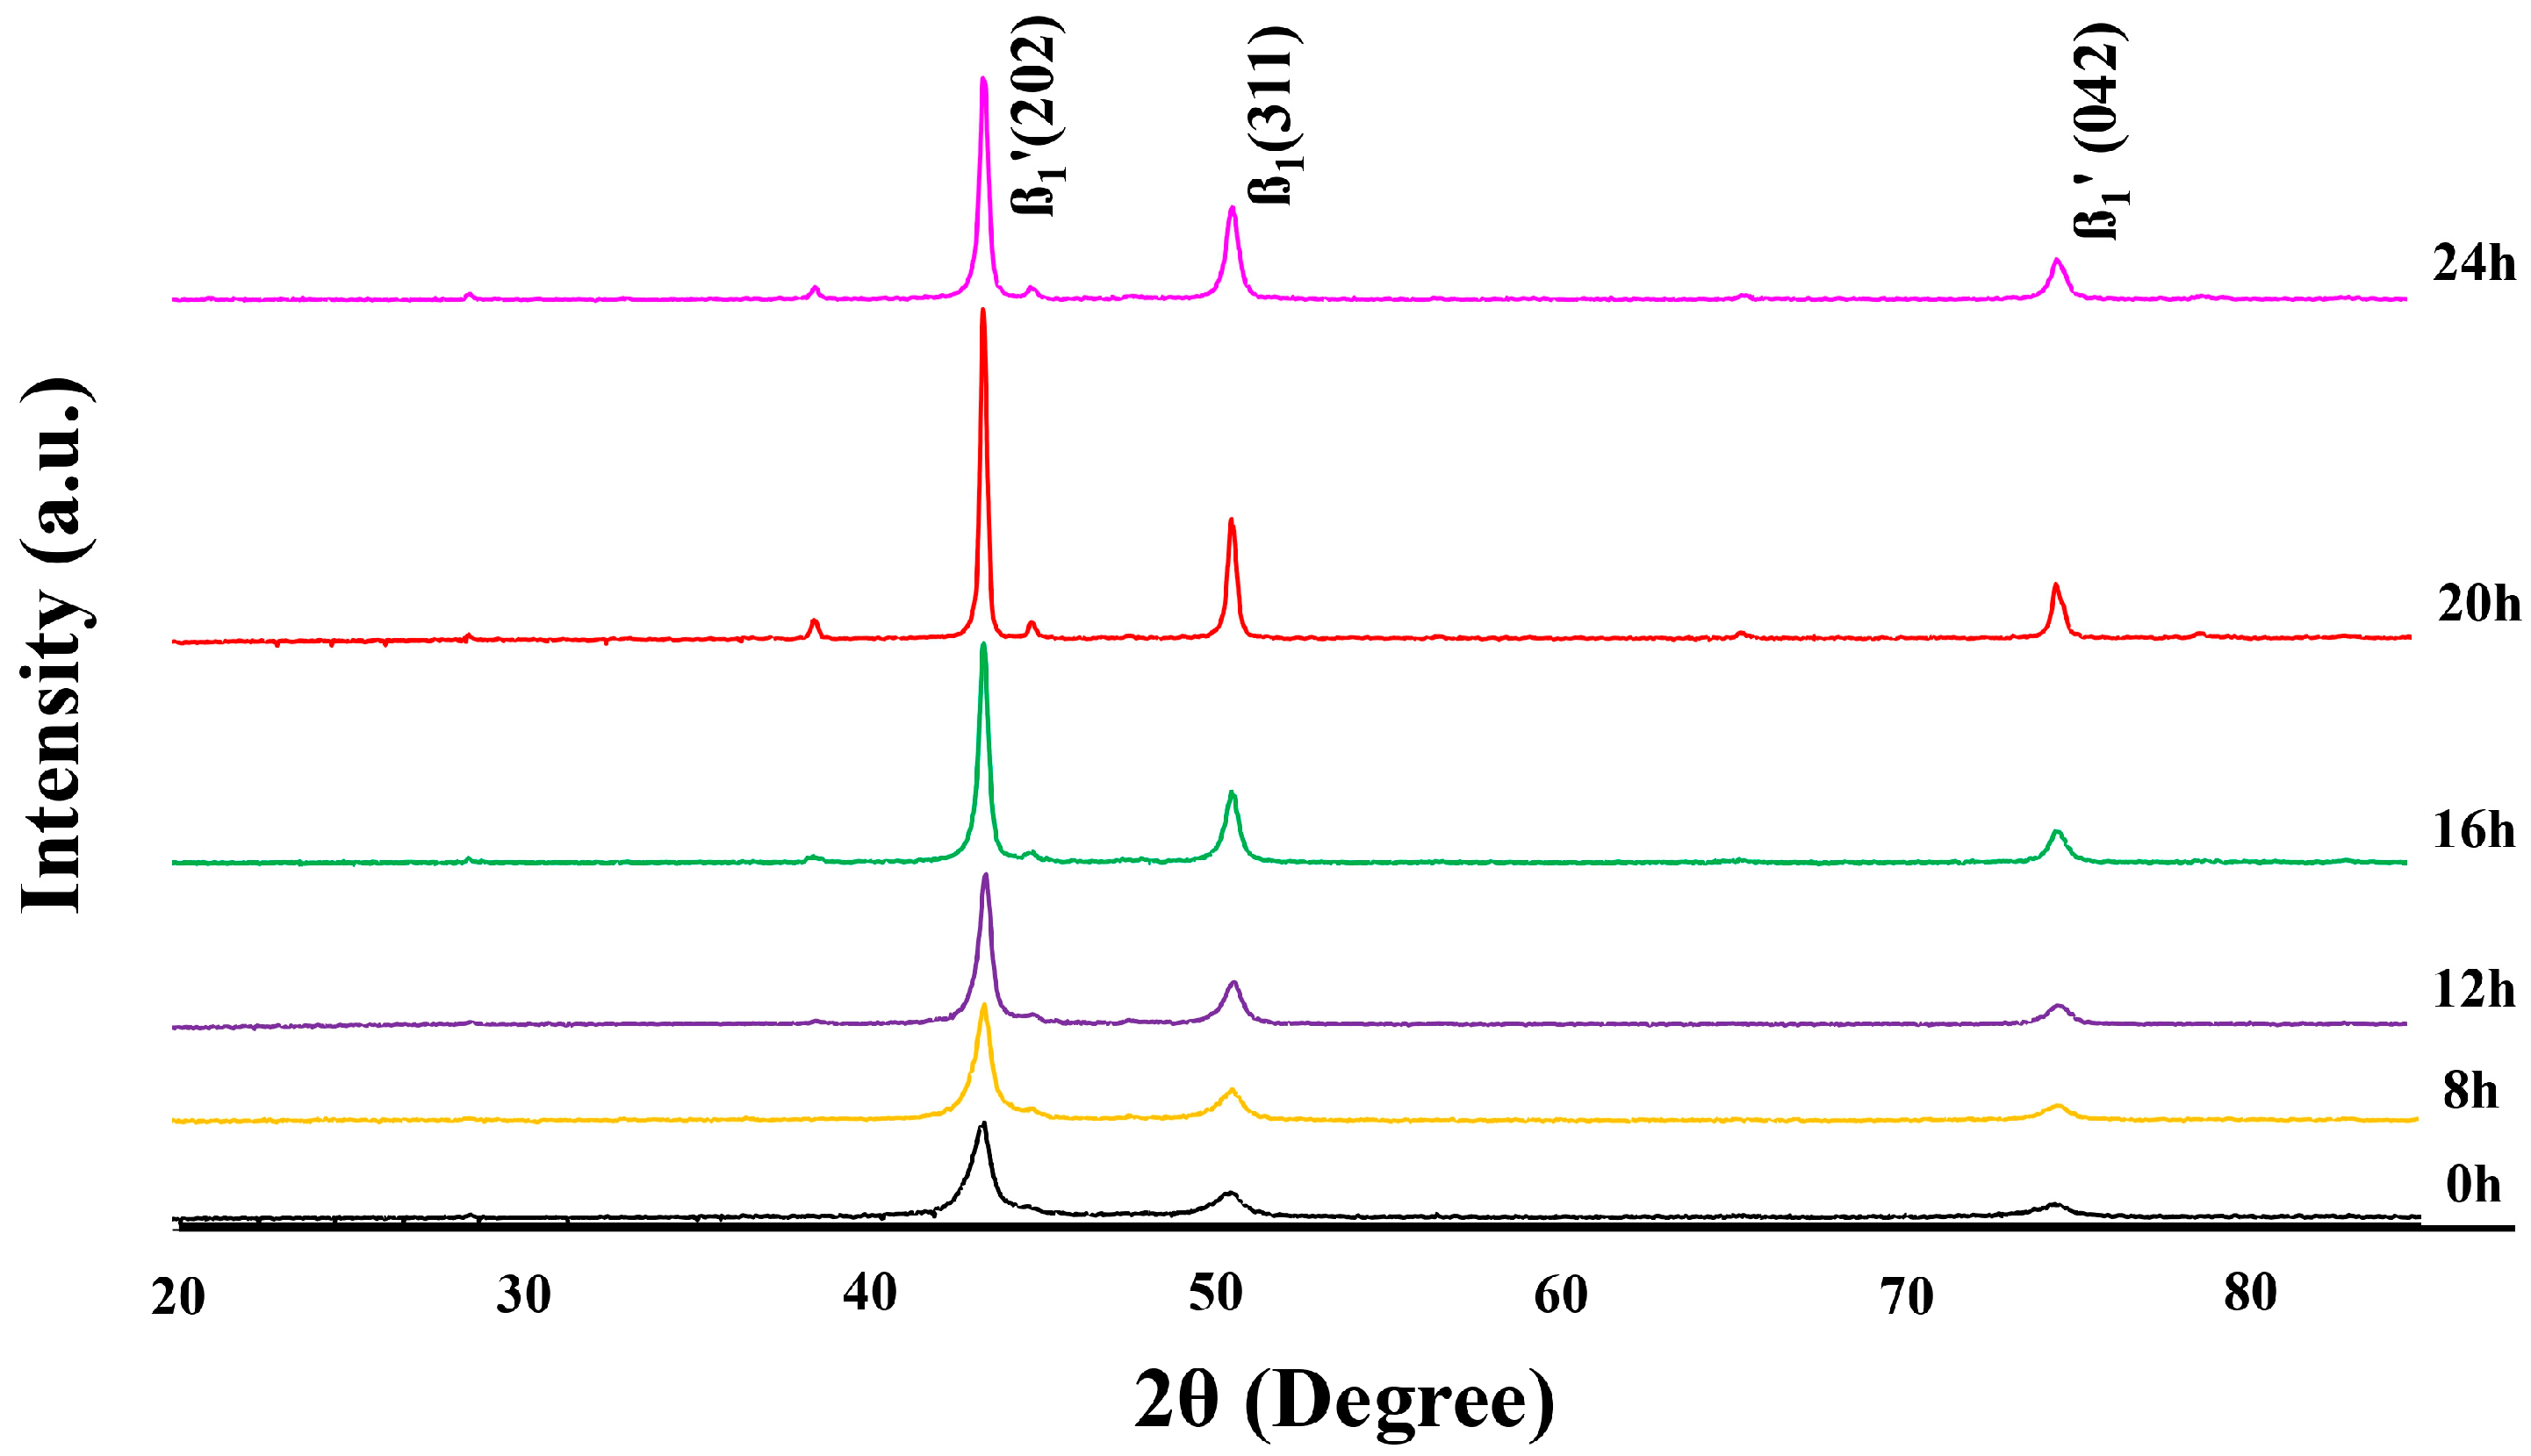
Figure 2 shows the XRD analysis results of the reference alloy powders produced with different mechanical alloying times. The two main diffraction peaks observed at room temperature belong to the martensite phase, and these main diffraction peaks can be attributed to peak groups containing the β1’ martensite structure. These structures correspond to the β1’ (202) and β1 (311) peaks at 42.647° and 49.535°, respectively. In addition, a low intensity β1’ (042) peak corresponding to an angle of 75.824° is observed. The most intense reflection among the planes is the (202) plane at an angle of 42.647°. For the CuAlMnFe alloys, as the mechanical alloying time increased up to 20 h, the intensities of the diffraction peaks in the XRD patterns increased. It was observed that after 20 h of mixing, during the mixing at 24 h, the peak intensities decreased. At 20 h of mixing, the X-ray diffractometer measurements revealed that the sharpness of the peaks and intensity of the peaks increased. It was determined that the crystal martensitic phases necessary for the copper-based alloy samples to exhibit SME have formed. Thus, it can be stated that the alloy sample with the most intense martensitic peaks, which underwent 20 h of mechanical mixing, is closer to the martensitic phase transformation mechanism.
Figure 3 displays the XRD patterns of the CuAlMnFe alloys with varying CeO2 content, following quenching. We know that the β1’ martensite phase is essential for the shape memory characteristics, and to achieve this phase in the alloy, quenching is necessary [33]. At room temperature, the (202), (0022), (1210), (2012), and (042) planes corresponding to the β1’ martensite phase were observed at 42.40°, 44.95°, 49.18°, and 72.48°, respectively. On the other hand, the CeO2 (220) and (420) planes were detected at 50° and 81.74°, respectively. It can be observed that the addition of CeO2 promotes the dissolution of copper and enhances the formation of the martensitic phase. In the CuAlMnFe alloy, the formation of martensitic phases is observed at different diffraction angles, indicating the development of phases. At CeO2 concentrations below 0.5 wt.%, a low-intensity martensite phase was present. However, the high intensity β1’ parent phase appeared in the alloy when the CeO2 content was increased to 0.5 wt.%. The peak intensity of β1’ (0022) and β1’ (2012) changed with the addition of a small amount of CeO2. Specifically, the C0.5 sample caused a notable increase in the peak intensity of β1’ (0022) while simultaneously reducing the peak intensity of β1’ (1210). Further increasing the CeO2 content (1.0 wt.%) caused the β1’ (1210) to disappear. Also, it was not observed that the peak of β1’ (1210) with added CeO2 (0.05 wt.% and 0.1 wt.%). As it is known, with the martensitic transformation temperatures of Cu-based alloys increasing, the martensite progressively becomes the dominant phase, and the alloys may consist entirely of martensite [34]. The emergence of phase (β1’ (1210)) is likely to significantly impact the mechanical properties of the CuAlMnFe alloys. Furthermore, CeO2 phases in the C0.5 sample were detected in the XRD analysis. This could be attributed to the high concentration of added CeO2 or the possibility that CeO2 was solved within the matrix [18]. The formation of (0022) and (1210) peaks due to the addition of CeO2 to the CuAlMnFe alloy composition can be explained by the infiltration of CeO2 particles into the alloy matrix phase. The increase in the peak intensity at 44.95° with increasing CeO2 content could be attributed to the increased solid solubility of the CeO2 powder. Also, martensitic phases are distinctly identified in the XRD patterns of the sintered alloy samples. It could be associated that the martensitic phase has been fully completed [35]. In addition, we could mention that the completion of the α + β1′ transition of the ordered β1 phase or its partial retention without significant changes was possible. Despite the CuAlMnFe content remaining unchanged, the diffraction peaks of martensite have become much more distinct with the increasing CeO2 content (0.5 wt.%), which is attributed to the rise in martensitic transformation temperature. The martensitic transformation temperatures of Cu-based alloys could be explained by the increasing dominance of martensite and the transformation of the alloys into a single martensitic structure [36]. Consequently, with CeO2 content increases, the diffraction peaks of martensite become much more distinct, and the high intensity of X-ray peaks indicates that primarily martensite was present in the C0.5 sample.

3.2. Study of Surface Morphology

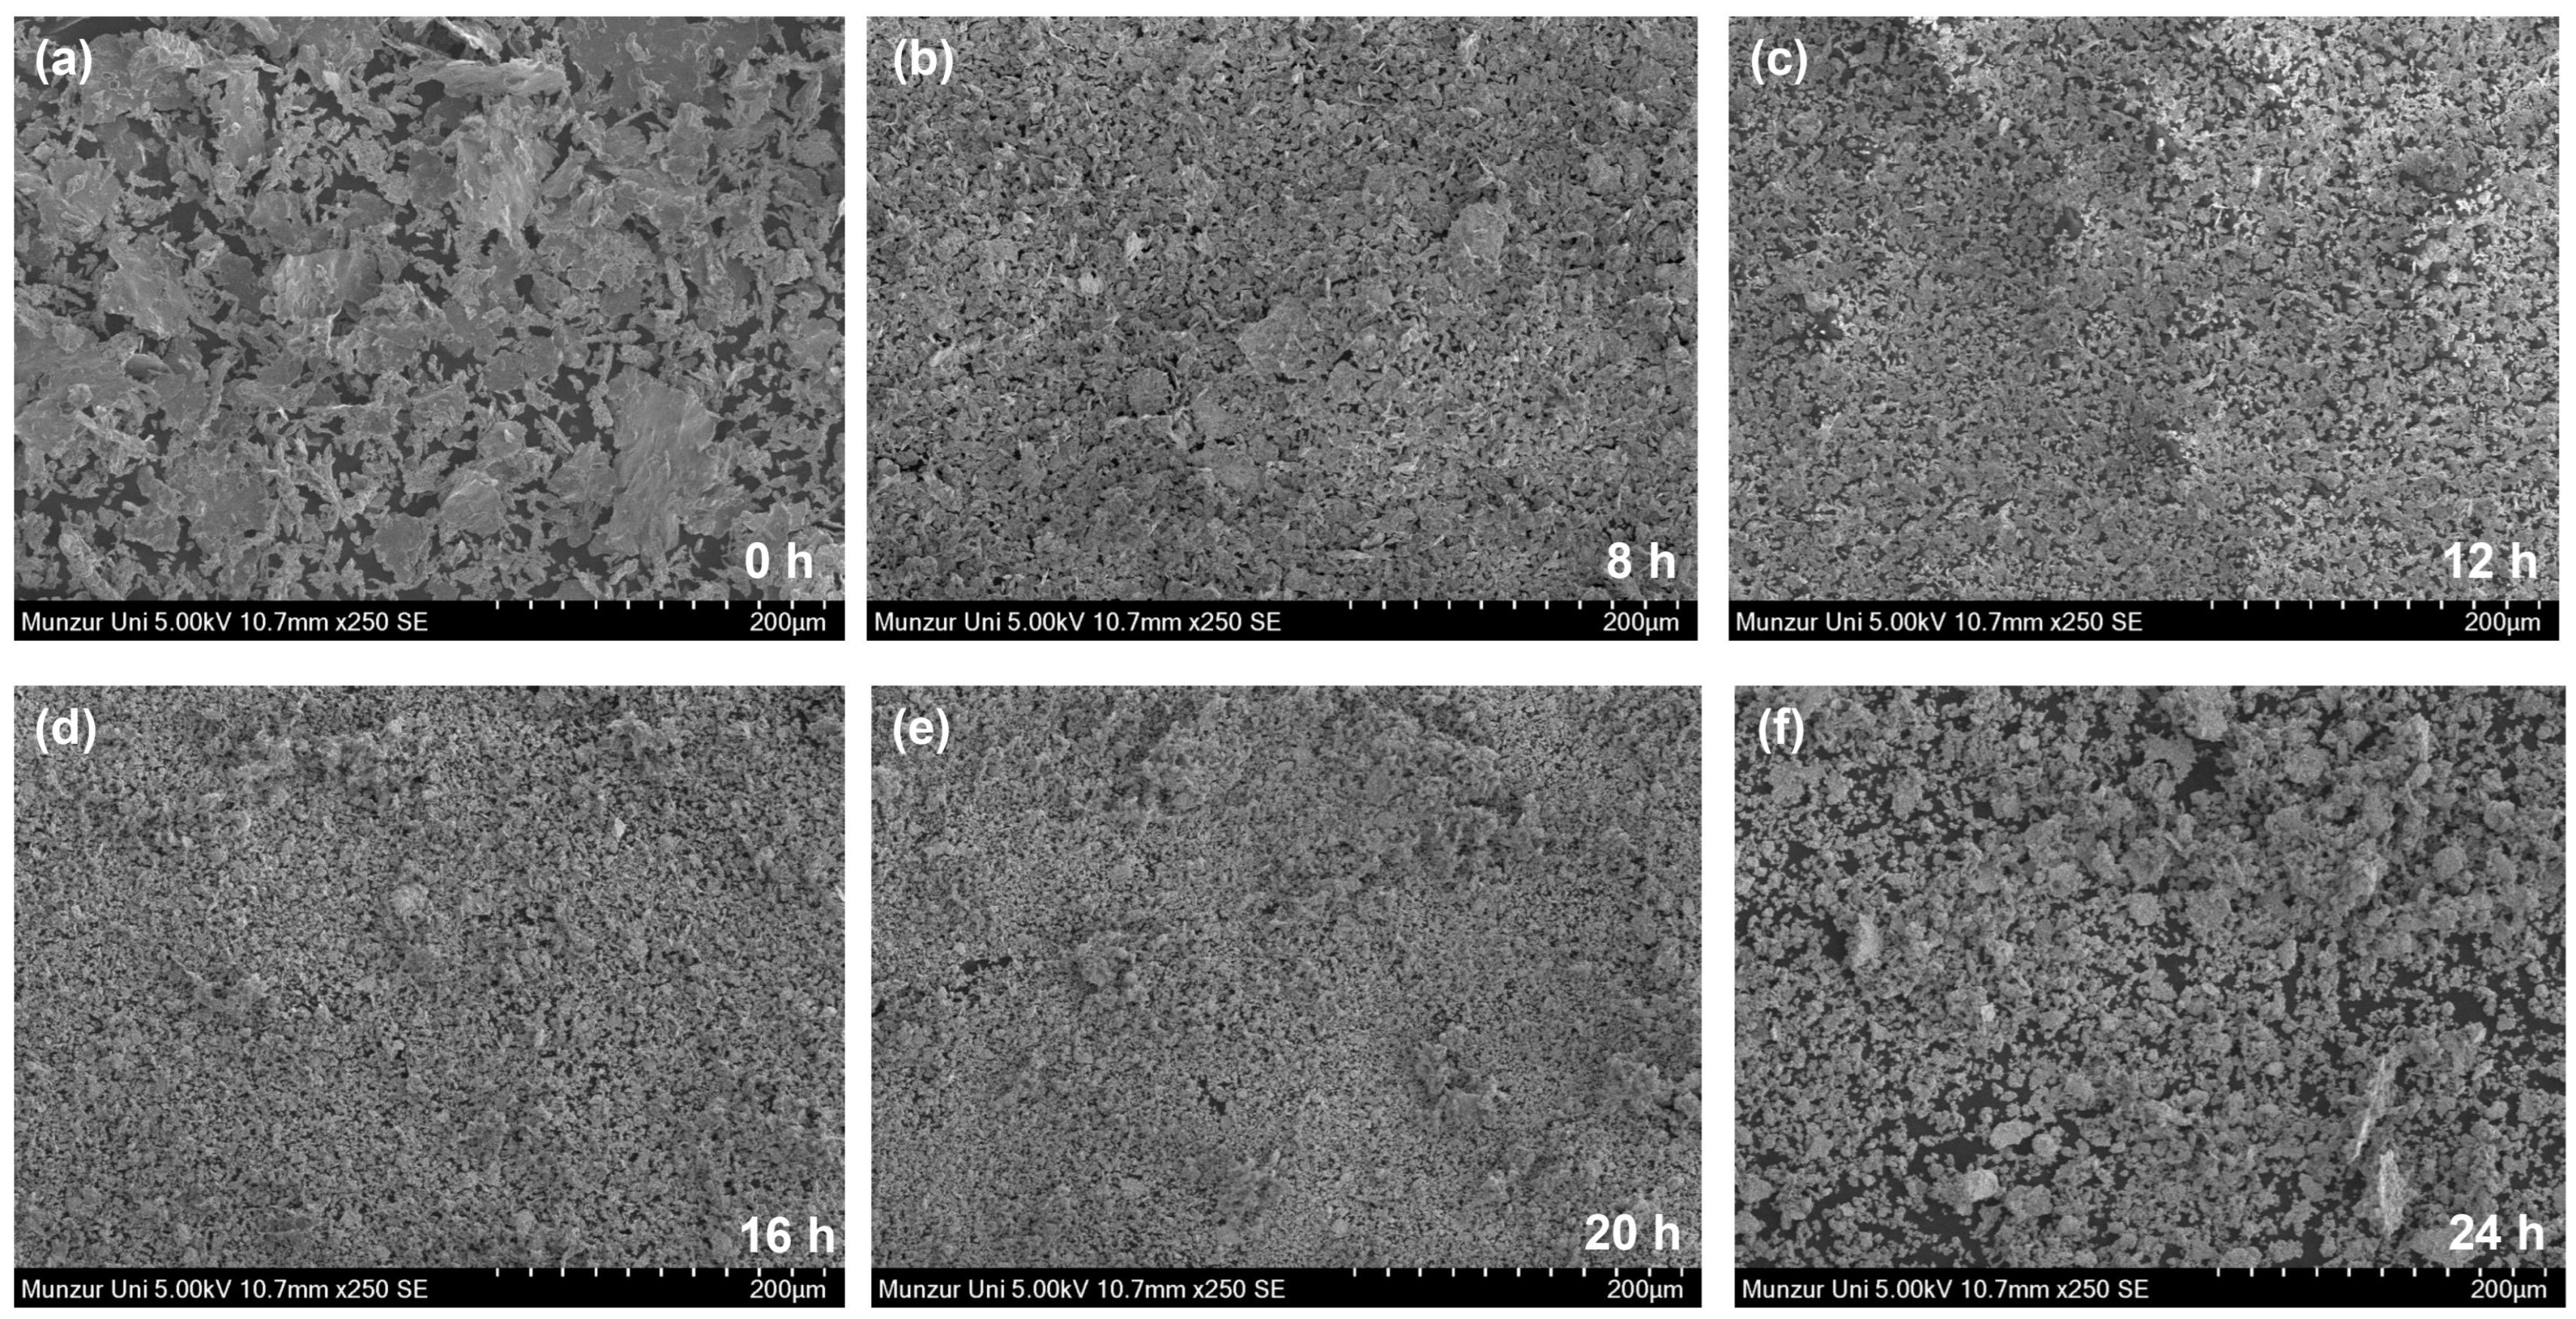
The SEM images of the CeO2-containing CuAlMnFe alloy powder samples subjected to different mechanical mixing processes (0, 8, 12, 16, 20, and 24 h) are shown in Figure 4. The gray color of the main phase in all samples can be explained by the formation of a matrix phase in the morphology. The alloy powder sample prepared with 0 h of mixing shows pores distinctly in its morphological structure (Figure 4a). As the mechanical mixing time increases, the formation of small-sized spherical particles becomes evident. When comparing the SEM images of the reference samples, it can be concluded that the alloy powders mixed for 20 h (Figure 4e) are more homogeneously mixed than the other samples. In contrast, porosity structures have reappeared in the 24 h (Figure 4f) mechanical mixing sample.
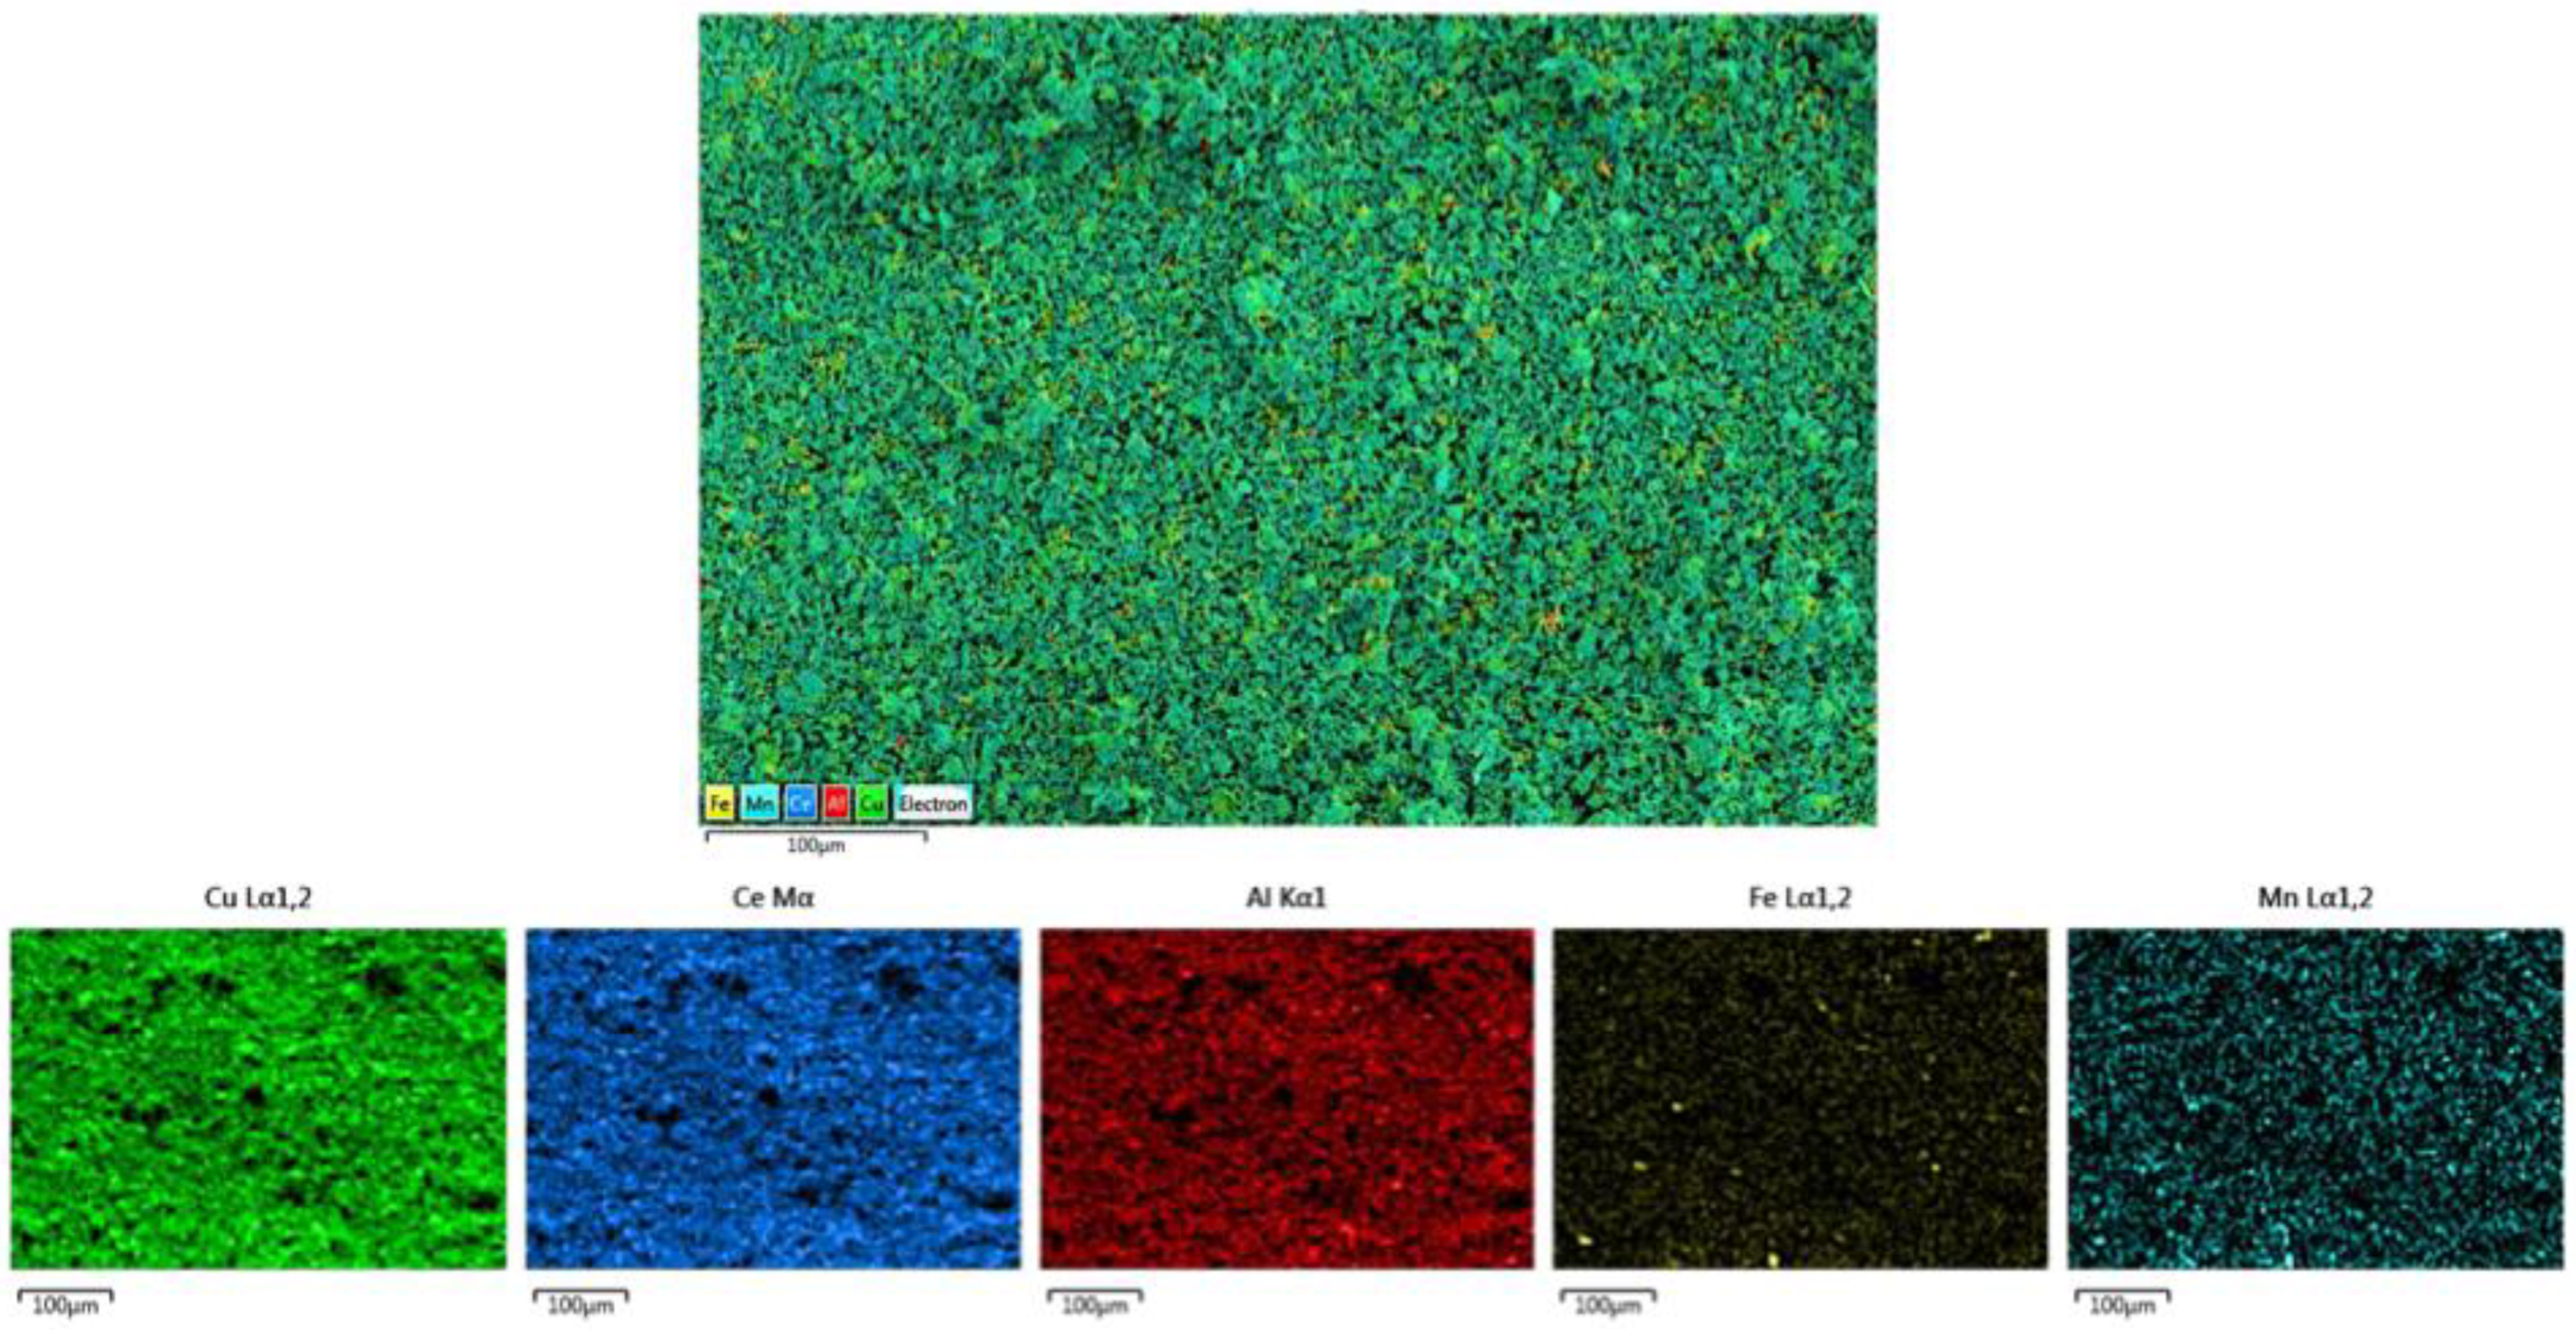
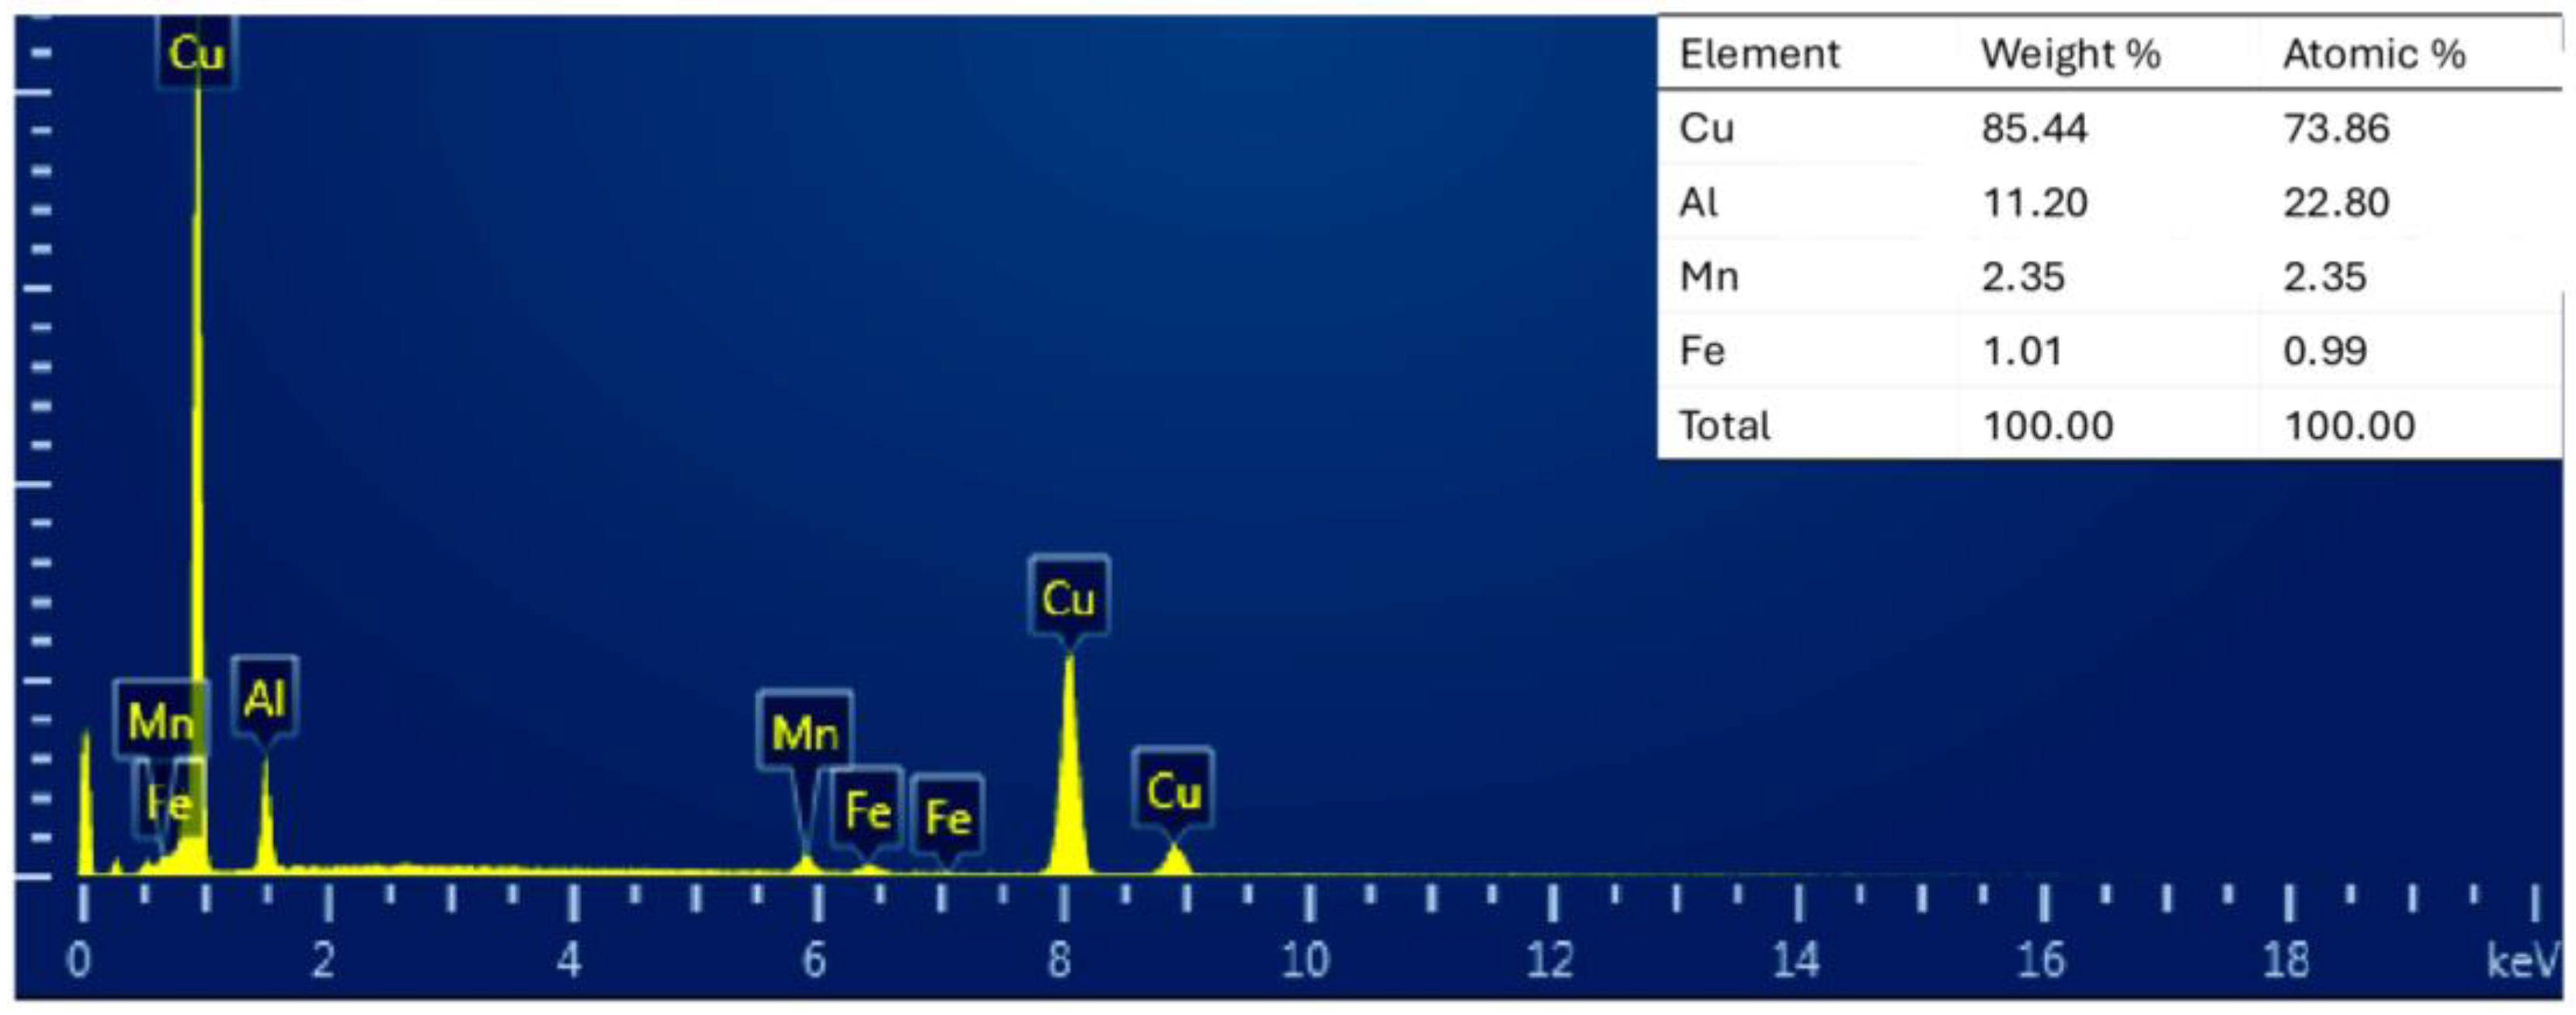
Figure 5 shows the mapping images of the CuAlMnFe alloy mixed mechanically for 20 h. The morphology, size, and distribution of particles, as well as the overall homogeneity of the mixed powders, were observed. As observed in the mapping images, the main phase of Cu was green, while Al, Fe, and Mn powders in the Cu matrix form a rich layer that reacts with Cu to create the alloy. The EDS elemental composition analysis of specific areas of CuAlMnFe alloy is shown in Figure 6. It could be concluded that the sample exhibits copper-rich characteristics and that Al, Mn, and Fe particles were distributed within the matrix phase. It has been found that verifying the CuAlMnFe alloy and assessing the elemental homogeneity after mechanical mixing was necessary. It could be said that deviations from compositions would indicate specific microstructural features.
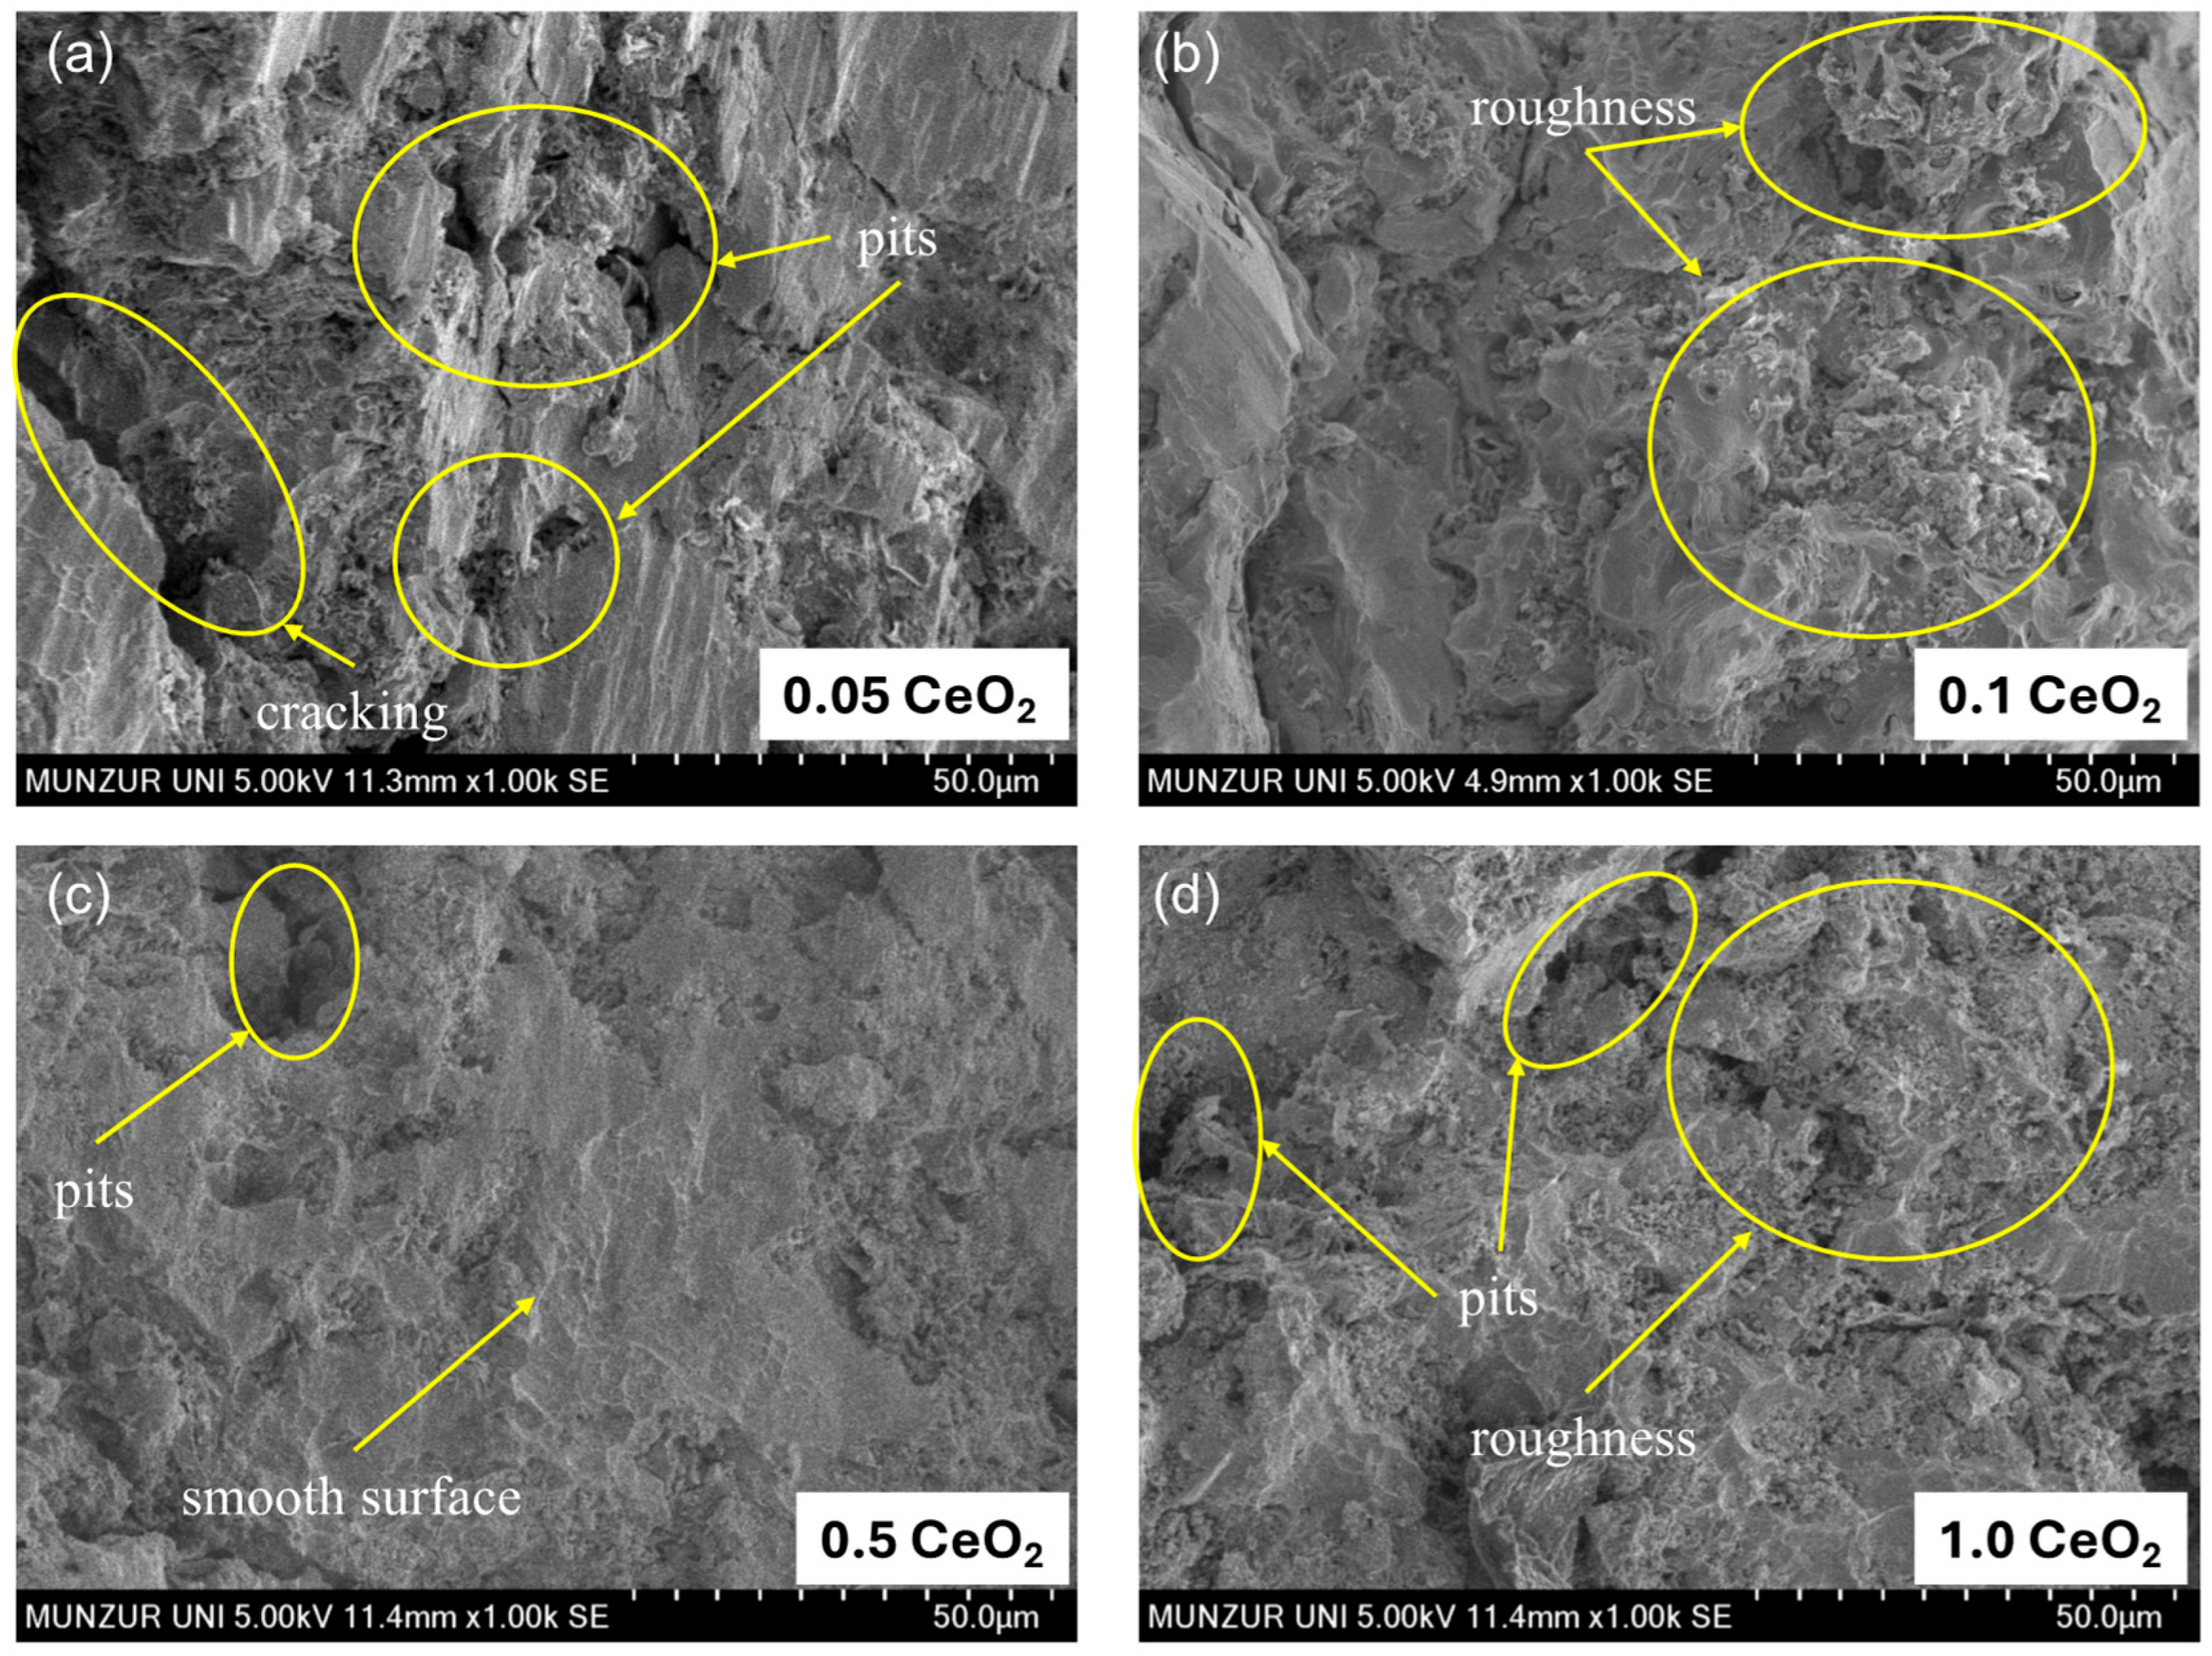
Figure 7 shows the SEM images of CuAlMnFe alloys containing 0.05 wt.%, 0.1 wt.%, 0.5 wt.%, and 1.0 wt.% CeO2 by weight, respectively. The gray regions were identified as Al and Mn particles embedded in the Cu particles. It was observed that the entrenchment of CeO2 particles in the matrix was owing to improved interfacial bonding between the matrix and reinforcement. The increase in surface defects observed in the C0.05 sample could be attributed to the internal stress [37]. However, the low CeO2 content (0.05 wt.%) has not prevented the formation of porous structures in the alloy. It could be indicated that powder metallurgy production involves the formation of pores within the microstructure. Also, it could be noted that with increasing CeO2 amount in the CuAlMnFe alloy, the pits at the grain boundaries diminish, but pores begin to appear within the grains. As the CeO2 content increases (0.5 wt.%), it can be observed that the matrix, which is homogeneously surrounded, shows signs of precipitate formation. Thus, it could be said that the CeO2 amount in the chemical composition can affect the pitting corrosion behavior of Cu-based alloy [13]. In the SEM images of the alloy containing 0.5 wt.% CeO2, it was observed that the elements dissolved within the matrix and exhibited a more homogeneous distribution compared to other CeO2-containing alloy samples. Thus, it could be inferred that CeO2 particles may cause the morphology of the alloy structure.
Moreover, the above-mentioned XRD results support the modification of the orientation, which demonstrated 0.5 wt.% CeO2 particles in the CuAlMnFe alloy led to precipitation of β1′. As the CeO2 content in the CuAlMnFe alloy increased to 1.0 wt.%, it was seen that the number of pit-like structures decreased. It could be mentioned that the network structure made up of secondary phases also becomes larger [38]. It could be attributed to an irregular structure formed by metal powders that do not dissolve into one another. Furthermore, it could be mentioned that pits that formed at the grain boundaries during sintering result in the formation of pits and a rough surface.

3.3. Hardness and Wear Behavior

Figure 8 illustrates the relationship between CeO2 content and the corresponding changes in Vickers hardness for CuAlMnFe alloys. Peak hardness values of 256 HV, 267 HV, 304 HV, and 289 HV were observed for CuAlMnFe alloys that include CeO2, respectively. As the quantity of CeO2 particles increased, the CuAlMnFe alloy’s microhardness tended to grow and then decrease. It peaked at 0.5 wt.%. The CeO2 concentration then began to decline at 1.0 wt.%. The hardness of the alloy is significantly influenced by the quantity of CeO2 present; hence, variations in the structure of the CuAlMnFe alloy result in notable variations in performance. An increase in hardness is observed with increasing CeO2 content below 0.1 wt.%. A nearly 1.2-fold increase in hardness is achieved with CeO2 containing 0.5 wt.% CeO2, which is substantially higher than values for 0.05 wt.%. CeO2 content. CuAlMnFe alloy, which includes 0.5 wt.%. CeO2 reached a peak hardness value of 304 HV. However, as the CeO2 concentration rises to 1.0 wt.%, the C1.0 alloy’s hardness decreases to 289 HV. The rise in hardness of the CuAlMnFe alloys is likely due to the refined microstructure and the uniform dispersion of CeO2 precipitates, which contribute significantly to strengthening. The rich intermetallic compounds may form in sample C0.5 [39].
Furthermore, it could be attributed that the presence of a high density of defects, including vacancies, in the solid solution can result in better mechanical performance than precipitation strengthening [40]. The observed increase in hardness, particularly for the C0.5 sample, was directly correlated with the grain refinement induced by CeO2 addition. According to the Hall-Petch relationship, finer grain sizes increase the number of grain boundaries, which act as barriers to dislocation motion, thereby enhancing the material’s hardness [41]. Higher hardness generally leads to improved wear resistance, as harder materials are more resistant to plastic deformation and penetration by abrasive particles, a key aspect of Archard’s Law, which states that wear volume is inversely proportional to hardness [42].
Archard’s Law is a fundamental empirical relationship used to estimate the wear volume (V) of a material during sliding. It is expressed as follows:
V   =   k . P . L H
where V is the wear volume (mm3), and k is the dimensionless wear coefficient, which is an experimentally determined constant that depends on the specific material pair, lubrication conditions, and wear mechanism. It typically ranged from 10−8 for very mild wear to 10−2 for severe wear. P is the normal load (N) applied on the contact. L is the sliding distance (m). H is the hardness (N/mm2 or MPa) of the softer material in contact. It was highlighted that wear was directly proportional to the applied load and sliding distance and inversely proportional to the material’s hardness. Particularly, the reduced wear rates with increased hardness in the CeO2-modified alloys align well with the principles of Archard’s Law.
Therefore, this increased resistance to deformation could reduce the severity of abrasive wear and adhesive wear, as seen in the reduced friction coefficients and wear rates. Otherwise, the hardness increase declines when CeO2 content surpasses 0.5 wt.%, which may be attributed to defects illustrated in Figure 7. Also, there are no visible cracks, and the surface quality was good (Figure 7c); however, as seen in Figure 7d, the C1.0 sample has more visible surface pits. The dispersion of CeO2 precipitates within the CuAlMnFe matrix also contributed significantly to strengthening. The dispersed particles acted as obstacles to dislocation movement, leading to precipitation hardening [43]. Moreover, the decline in hardness after the peak is attributed to the CuAl2 phase [44]. In conjunction with the examination of XRD data, it is discovered that the doping of CeO2 particles encourages the growth of metallic Cu along the alloy’s (0022) crystal plane, leading to a notable rise in the alloy’s CeO2 content and a significant improvement in its mechanical qualities. The lower precipitation resulting from CeO2 addition may cancel out the strengthening benefits of intermetallic compounds. It could be said that CeO2 particles in the lattice, where diffusion primarily occurs via the vacancy mechanism, rather than direct atom interchange. Additionally, it could be inferred that the hardness of the alloys was affected by different factors, including increasing porosity and precipitation in the Cu matrix [45]. On the other hand, crystallographic orientations could lead to variations in elastic modulus and yield strength depending on the direction of applied load during wear. This anisotropy could affect the ease of plastic deformation and propagation [46]. Furthermore, CeO2 ceramic particles, being significantly harder than the matrix, might act as effective load-bearing elements and could be an obstacle to dislocation movement during sliding. It could be said that the uniform dispersion of CeO2 particles enhanced the composite’s resistance to plastic deformation and micro-cutting by abrasive particles, thereby reducing material removal. Nevertheless, the stable phases could have hindered the propagation of subsurface cracks, which was crucial in mitigating delamination wear. It was observed that the optimal distribution in the C0.5 sample contributed to its wear performance by providing a robust barrier against wear mechanisms such as abrasion and adhesion [47]. Similarly, Guan et al. [48] reported that grain refinement enhanced hardness and strength. The formation of stable RE-rich intermetallic compounds or oxide particles, which acted as strengthening phases and crack inhibitors, was also a common mechanism reported across different alloy systems, consistent with the role of metal oxide precipitates. Also, Sun et al. described that the balance between increased hardness and reduced wear rate was particularly noteworthy for potential applications [49]. Consequently, new uniform grain structures with robust boundaries were developed, leading to improved mechanical properties of the alloy.
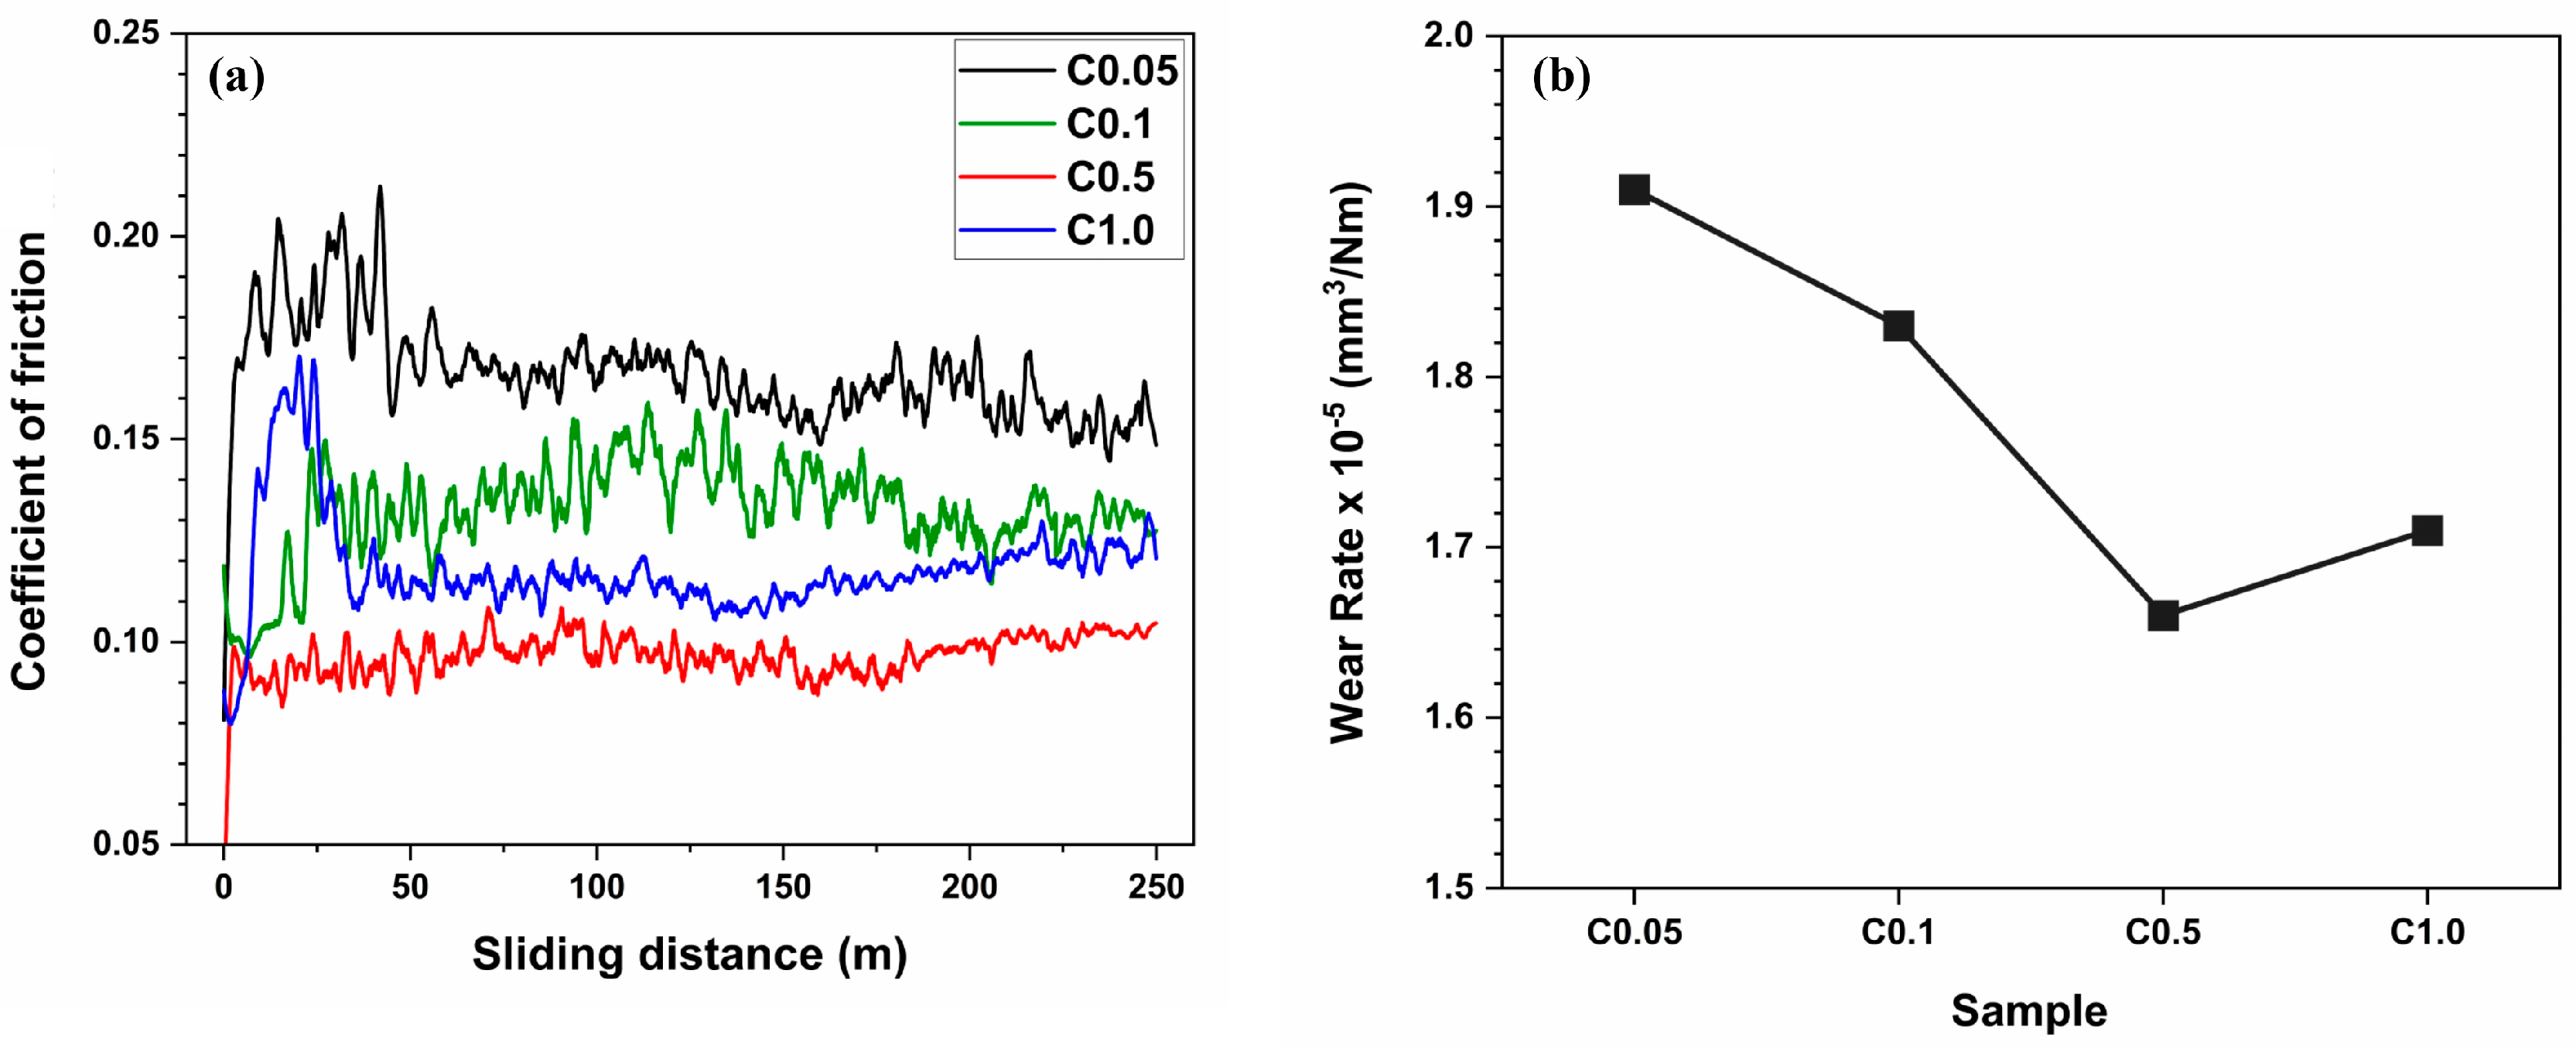
The friction coefficients (COF) (a) and wear rate (b) of CeO2-including CuAlMnFe composite alloys were illustrated in Figure 9, respectively. Significant variations in frictional behavior were shown by comparing the friction coefficients following wear testing. The COF was affected by numerous factors, including the surface condition and the bulk mechanical properties of the contacting surfaces. The lower portion of the alloy is denser, while the higher portion is looser with occasional microcracks and micropores, which accounts for the fluctuation at the beginning of the curves. Because of the complicated working conditions during the early friction stage, the friction coefficient varies greatly [50]. It is evident that in all samples, the loading step caused the COF to rise in the first distances before beginning to fluctuate within ranges. The COF is significantly reduced by CeO2 addition and decreases steadily with increasing CeO2 content. Eventually, the CuAlMnFe alloys’ COF stabilizes and ceases to fluctuate, indicating that wear-through has not occurred. Between 0 and 50 m, the coefficient of friction first rises to 0.21, and between 50 and 250 m, it tends to settle at around 0.15. Also, the first “run in” step is the cause of the increase in the coefficient from 0 to 50 m [12]. The CeO2 addition considerably lowers the COF; the C0.5 sample has a friction coefficient of roughly 0.11, which is much less than that of the other samples. The findings indicate that when 0.5 wt.%. CeO2 is added, the alloy’s COF decreases by over 30% when compared to the 0.05 wt.%. CeO2 sample. It is noted that the COF has once again risen with the addition of 1.0 wt.%. CeO2.
When comparing hardness and COF results, consider that as hardness increases, both the friction coefficient and wear rate decrease. It could be concluded that the COF has dropped because of the homogenization process and the CuAlMnFe alloy’s increased hardness. These findings suggest that adding CeO2 improves wear resistance and lowers the friction coefficient. By refining the matrix granules inside the alloy, CeO2 modified the microstructure. By improving the alloy’s uniformity, this improvement could create a smoother contact surface and lower frictional forces even further [51]. These results demonstrate how CeO2 affected the structural features and microstructure of the CuAlMnFe alloy, hence enhancing their tribological qualities. CeO2-containing Cu-based alloys’ wear rate figures for three sliding tests at 25 °C are displayed in Figure 9. The hardness of the material has a direct correlation with the wear rate. The graphs suggest that a drop in the wear rate is a result of the alloy’s increased hardness. The wear rate was calculated by measuring the volume loss over the sliding distance and normal load:
W r = V F n · s
where V is the number of atoms lost, which is the wear volume, multiplied by the Cu-based alloy’s atomic volume; s is the sliding distance; Fn is the normal load [52]. When compared to the C0.05, C0.1, and C1.0 alloys, the C0.5 alloy had the lowest average wear rate at 25 °C, measuring 1.64 × 10⁻⁵ mm3/(Nm). Although the CuAlMnFe/CeO2 (C0.5) alloy has lower wear rates than the other samples, the hardness augmentation outweighs the wear performance advantage. It could be attributed to the complete wear of the C0.5 sample during the wear test, resulting in lower-than-expected values for wear rate. Moreover, the Cu-based alloy’s resistance to plastic deformation and abrasive wear was improved by the ideal combination of increased hardness, grain refinement, and uniform distribution of CeO2 precipitates for this improvement. We could also talk about the possible function of a protective layer made of wear debris [53].
On the other hand, compared to the other alloys, the C0.05 alloy exhibits a much greater average wear rate of 1.9 × 10⁻⁵ mm3/(Nm). When the CeO2 content exceeds 0.5 wt.%, the alloy’s COF increases noticeably. This is not the same as how alloys with CeO2 content vary in hardness. Additionally, it is observed that when the CeO2 concentration hits 1.0 wt.%, the wear profile changes. It could be attributed to the 0.5 wt.% CeO2 alloy exhibiting wear characteristics and a hardness different from the 1.0 wt.% alloy, despite similar surface flaws. Furthermore, the development and expansion of cracks were linked to the abrasion process. The wear could be decreased by any element that inhibited the emergence of cracks. Since a strong link has been formed between the reinforcement and the matrix, as was indicated in the preceding sections, these particles may be able to inhibit the formation of cracks [42]. These findings lead us to the conclusion that the CuAlMnFe alloy’s wear resistance was enhanced by the addition of CeO2. The CuAlMnFe/CeO2 was an excellent contender for enhancing the lubrication because of its satisfying wear resistance. On the other hand, hard precipitates could bear a portion of the applied load, resist the cutting action of abrasive particles and inhibit the propagation of cracks, which was crucial in preventing delamination wear. The presence of these stable CeO2 phases could also reduce the tendency for material adhesion between the sliding surfaces.
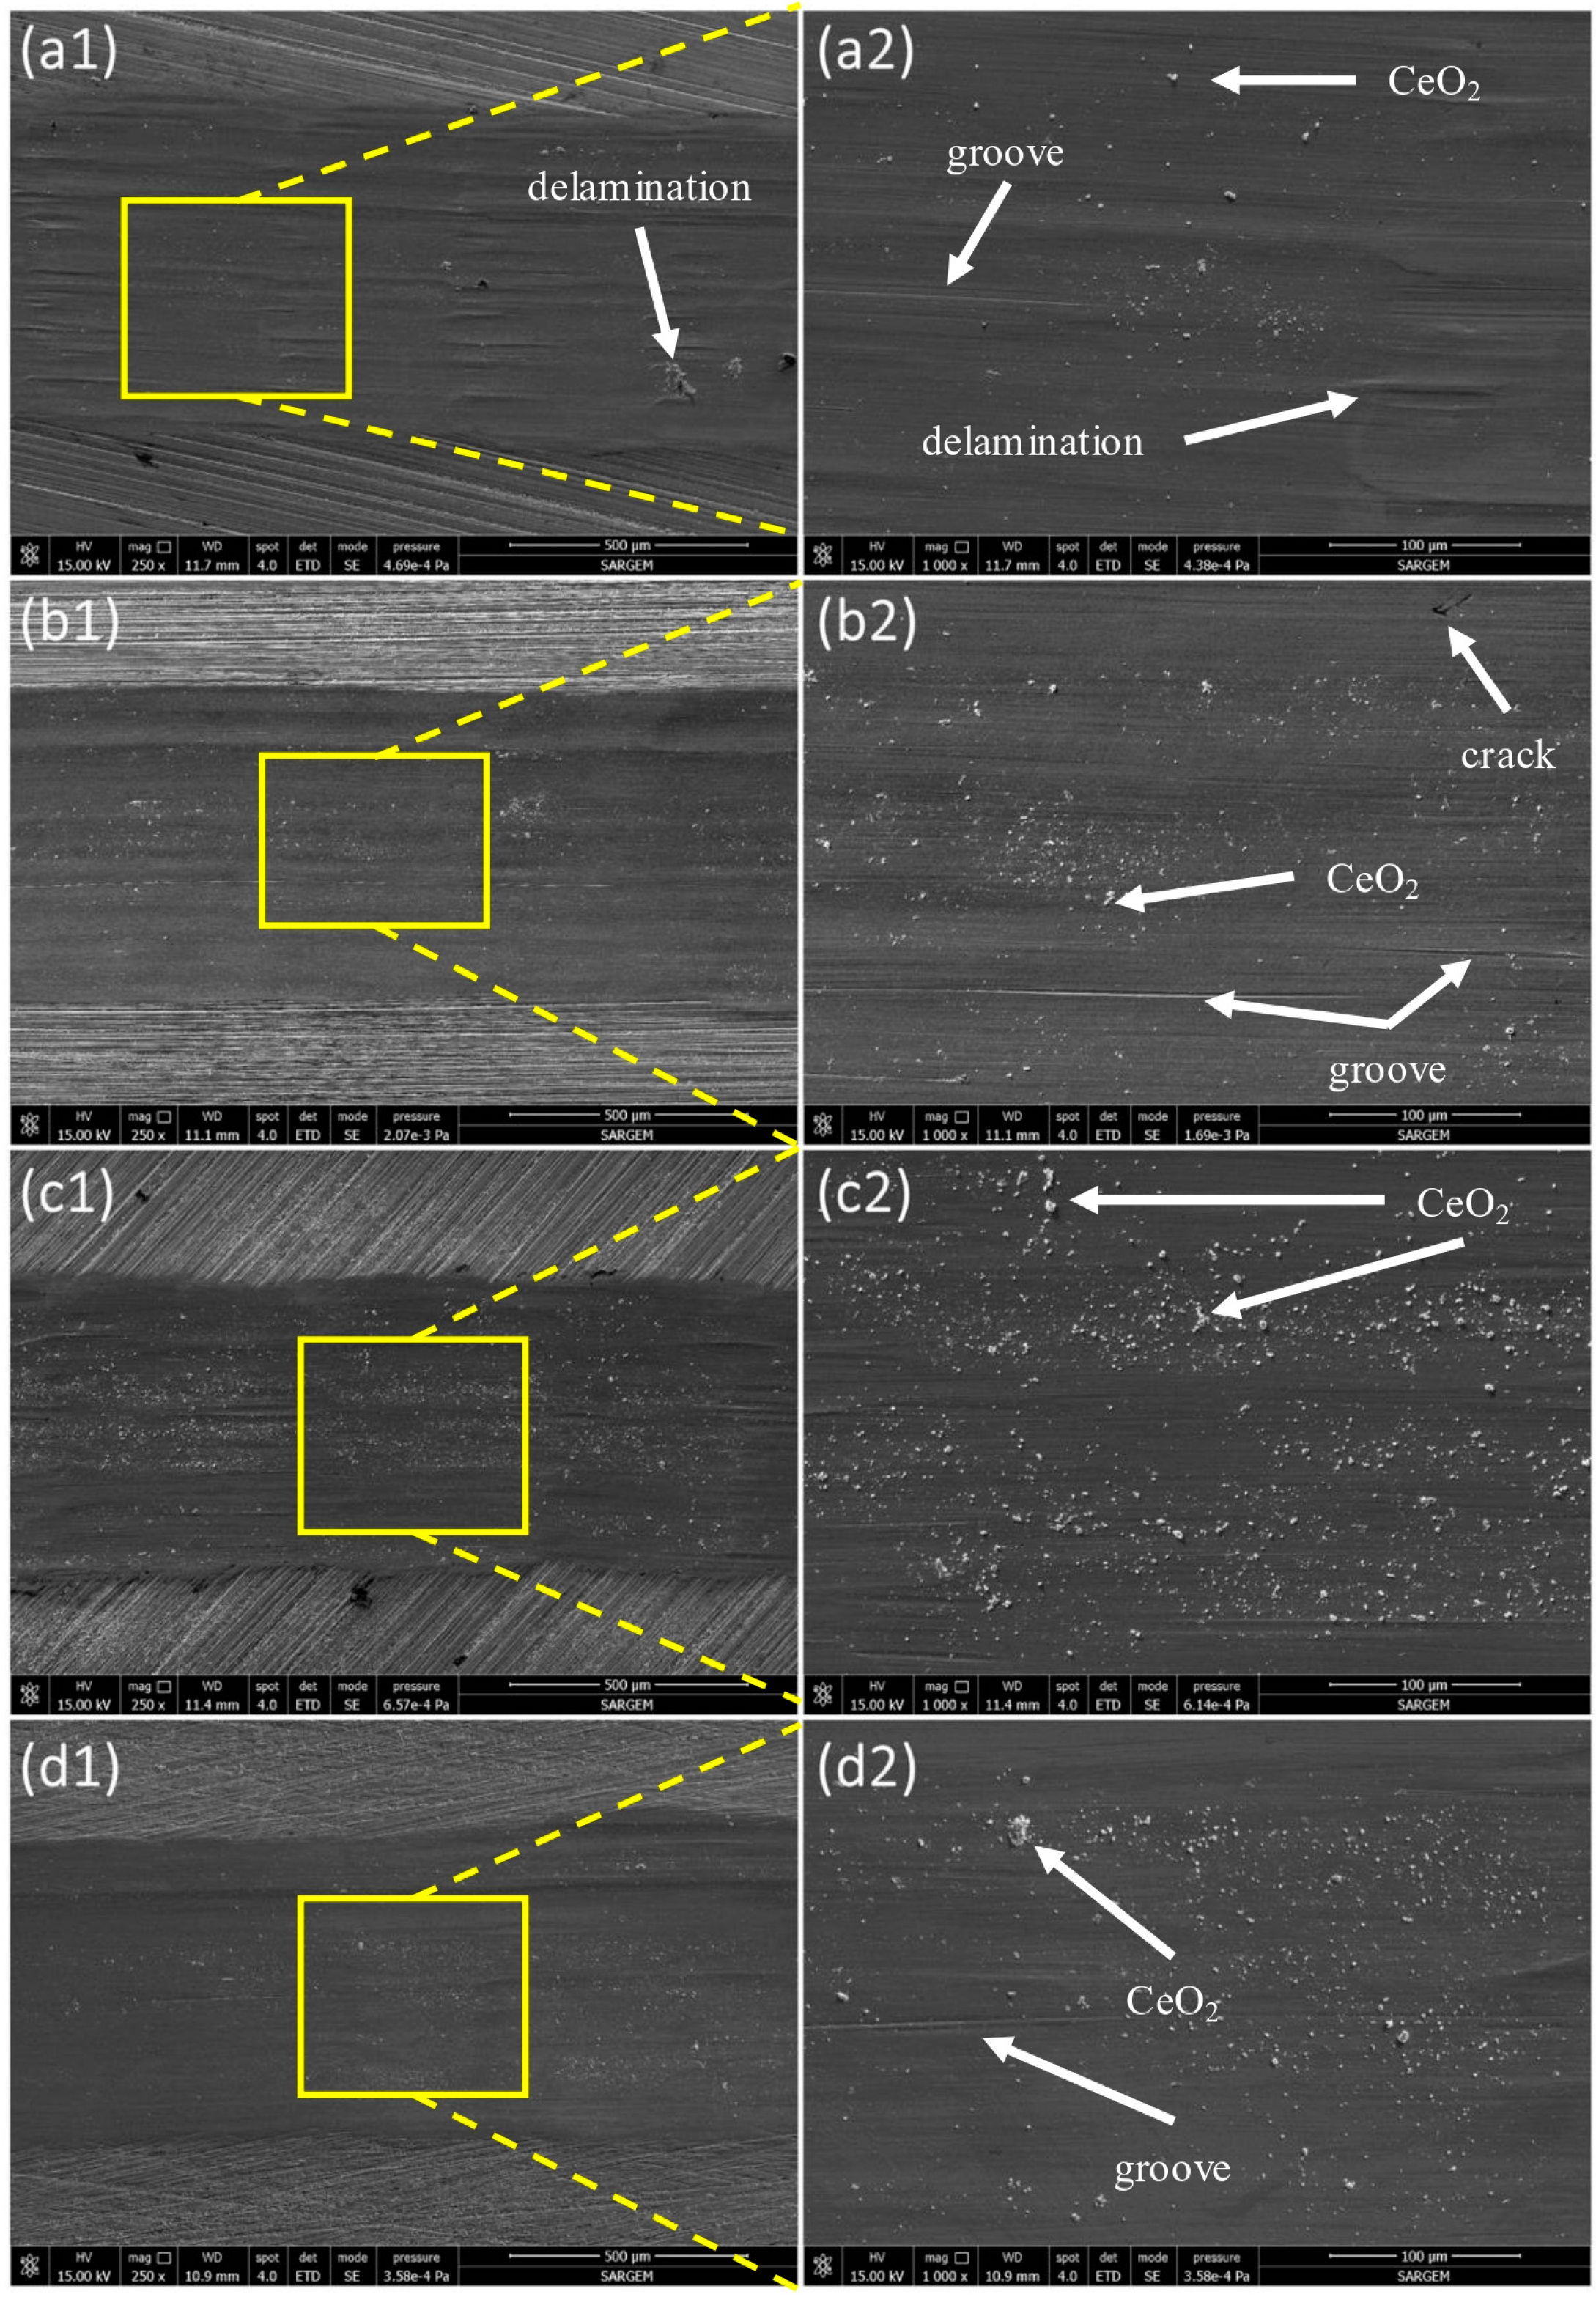
Figure 10 shows SEM images of the worn surfaces of C0.05, C0.1, C0.5, and C1.0 alloys at 25 °C. The images indicate that abrasive wear predominates, with only slight evidence of adhesive wear observed on the worn surfaces of different samples. Thus, it could be said that the worn surface grooves are generated by the counter-face disc cutting into the pin material during contact. Furthermore, it could be associated with wear in that higher hardness contributes to smaller groove depth and width on the worn surface. The presence of continuous grooves aligned with the sliding direction on the worn surface suggests that abrasive wear predominantly governs the wear behavior of the CuAlMnFe alloys. As shown in Figure 10(a1,a2,b1,b2), the wear grooves on the C0.05 and C0.1 samples are significantly and relatively wider compared to those on the C0.5 sample (Figure 10(c1,c2)). Furthermore, the enhanced wear resistance of the C0.5 sample relative to the C0.05 and C0.1 can be attributed to its higher hardness. As shown in the enlarged views (Figure 10(a1,a2,b1,b2)), micro-cracks appear in the deformed area and progressively grow and link, leading to delamination and material removal [54]. The combined effects of grain refinement and dispersed precipitates could lead to a more homogeneous microstructure. This improved microstructural integrity enhanced the material’s resistance to crack initiation and propagation, which were fundamental to the delamination wear mechanism [55]. Additionally, two-body abrasion is the primary wear mechanism identified on the worn surface. Nonetheless, the detection of CeO2 particles suggests the additional involvement of a three-body wear mechanism. It could be said that the detached material breaks down into wear debris during sliding, promoting secondary ploughing due to the development of a three-body wear mechanism [56]. On the other hand, the worn surface features and the existence of CeO2 in the C0.5 sample (Figure 10(c1,c2)) suggest that higher hardness leads to a reduced role of three-body wear. The presence of debris in the wear is evident in the worn surfaces obtained from specimens tested at 25 °C. Thus, along with abrasive wear, it could be mentioned that wear particles occurred on the worn surfaces of the alloys tested at 25 °C [57]. It could be noticed that in the C0.5 sample, the increased hardness has led to a significant reduction in the adhesive wear mechanism. Consequently, the occurrence of the wear particles may accumulate in the wear grooves, forming a protective layer on the surface that helps reduce the overall wear rate.

3.4. Corrosion Resistance

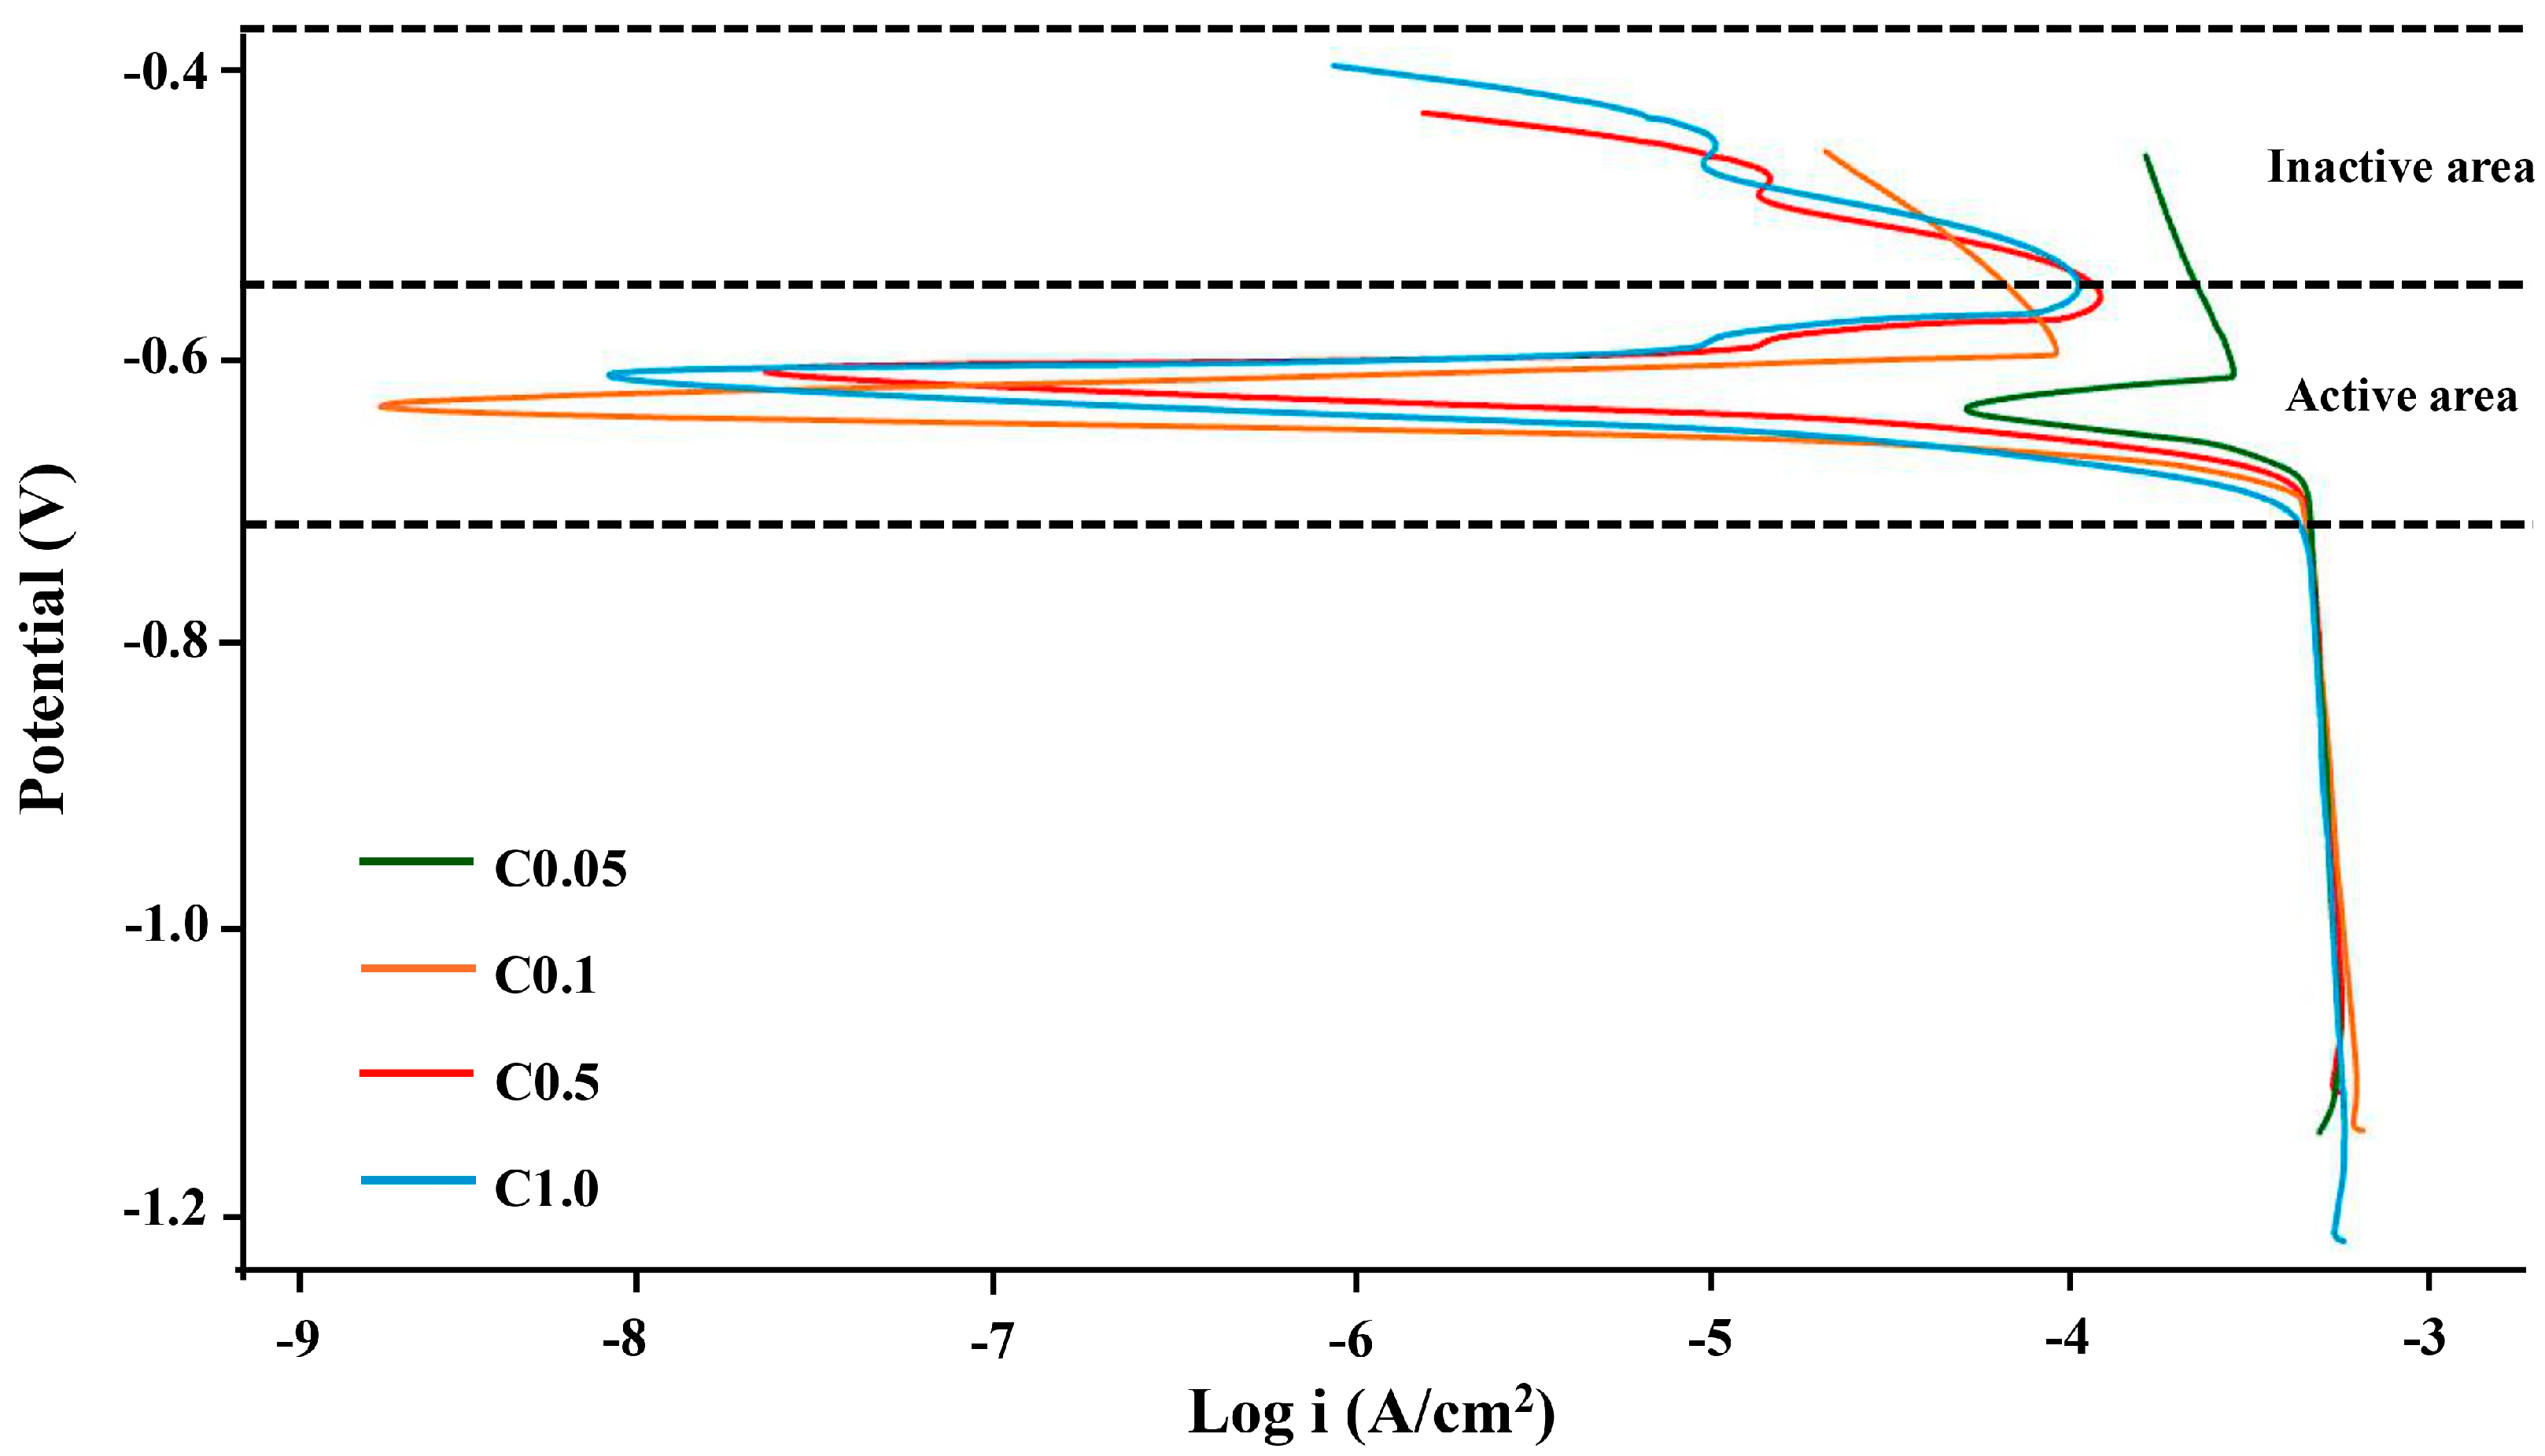
The similarly scaled potentiodynamic polarization curves of Cu-based alloy specimens in a 3.5 wt.% NaCl solution at room temperature is shown in Figure 11. Electrochemical polarization provides an appropriate description of the relationship between potential (E) and current (i). A common feature of E–i behavior for alloys was the comparable form of the polarization curves with cathodic and anodic branches for both alloys [58]. Tafel’s law, which was declared as typical active metal dissolving behavior as the current density rose with an increase in the applied anodic over-voltage, was followed by the anodic branches. Additionally, it could be indicated that the CeO2-containing alloys showed a considerable drop in anodic current density [59]. The electrochemical parameters, including corrosion potential (Ecorr) and corrosion current density (icorr), were assessed from the polarization curves using Tafel analysis to compare the corrosion resistance for alloys, and Table 2 displays the equivalent findings by Tafel fittings. Figure 11 displays the polarization curves of the alloy samples, illustrating differences in their electrochemical response and corrosion resistance. As seen, Cu-based alloy samples had a reduced corrosion current density and a positively shifted corrosion potential when the CeO2 concentration in the alloy increased. The corrosion potential of the alloys was recognized to be related to their corrosion tendency. If the alloy had a lower corrosion potential, it was more easily corroded. Also, the corrosion rate, which was proportional to the corrosion current density, further affected the degree of corrosion. [60,61]. When the Ecorr and icorr for the described polarization curves were calculated, it became clear that the addition of 0.05 wt.%. CeO2 to the Cu-based alloy resulted in a considerable shift in the corrosion potential (to +) and current (to −). The anodic and cathodic branches of the C0.1, C0.5, and C1.0 alloy specimens had comparable shapes. The anodic polarization curves of the above alloys were significantly different from the potentiodynamic polarization curves examined on C0.05. It could be attributed that activation polarization was in charge of the cathodic process, and the passivation zones were almost parallel to the potential axis in the anode polarization region [62].
Furthermore, the CeO2, including Cu-based alloys’ inactive area, expanded from −0.6 V to −0.4 V, as illustrated in Figure 11. As is seen, rapid increases in the anodic current density indicate that the passive films in the NaCl solution were dissolving. It was seen that when the CeO2 amount increased in Cu-based alloy, the corrosion potential changed negatively. The Ecorr of the C0.1, C0.5, and C1.0 alloys was more shifted in a positive direction when compared to the C0.05 alloy specimen. It could be inferred that the C0.5 and C1.0 alloys experienced corrosion damage propagation between −0.4 V and −0.6 V potential on their surfaces. In addition, the inactive area’s width widened at C0.5 and C1.0 samples, suggesting that the CeO2-containing alloy might create a more stable surface coating. It is crucial to understand that the preservation of the layer has a major role in the alloys’ overall resistance to corrosion. It could be said that the sustained passive current density can accurately indicate the corrosion resistance of the alloy following a specific duration of corrosion [63]. The CeO2 could act as a physical barrier, isolating the underlying alloy from the corrosive electrolyte (3.5 wt.% NaCl solution). It could be inferred that this barrier significantly reduced the rate of charge transfer reactions at the metal-solution interface, leading to a decrease in corrosion current density (icorr) and a shift in corrosion potential (Ecorr) towards more noble values, as observed in our Tafel polarization curves. Evidently, the inclusion of CeO2 may enhance the CuAlMnFe alloy’s corrosion properties by demonstrating a lower corrosion current density and a larger corrosion potential. The 0.5 wt.% CeO2 contained in a Cu-based alloy in the solution with 3.5 wt.% NaCl exhibited relatively high passive behavior, according to the polarization curve studies conducted with the other samples in Figure 11. It could be said that the alloy surface has strong stability and great protective properties. The electrochemical parameters’ values, which are displayed in Table 2, show that the C0.5 specimen exhibits a much lower icorr in comparison to the other samples. The C0.5 sample with −588 V had the nearest positive value of Ecorr. C1.0 (−597 V), C0.1 (−624 V), and C0.05 (−635 V) were next in line. According to these findings, adding 0.5 wt.% CeO2 to CuAlMnFe alloy improves corrosion protection. However, the particle form that may encourage localized corrosion attack is not present at high enough levels.
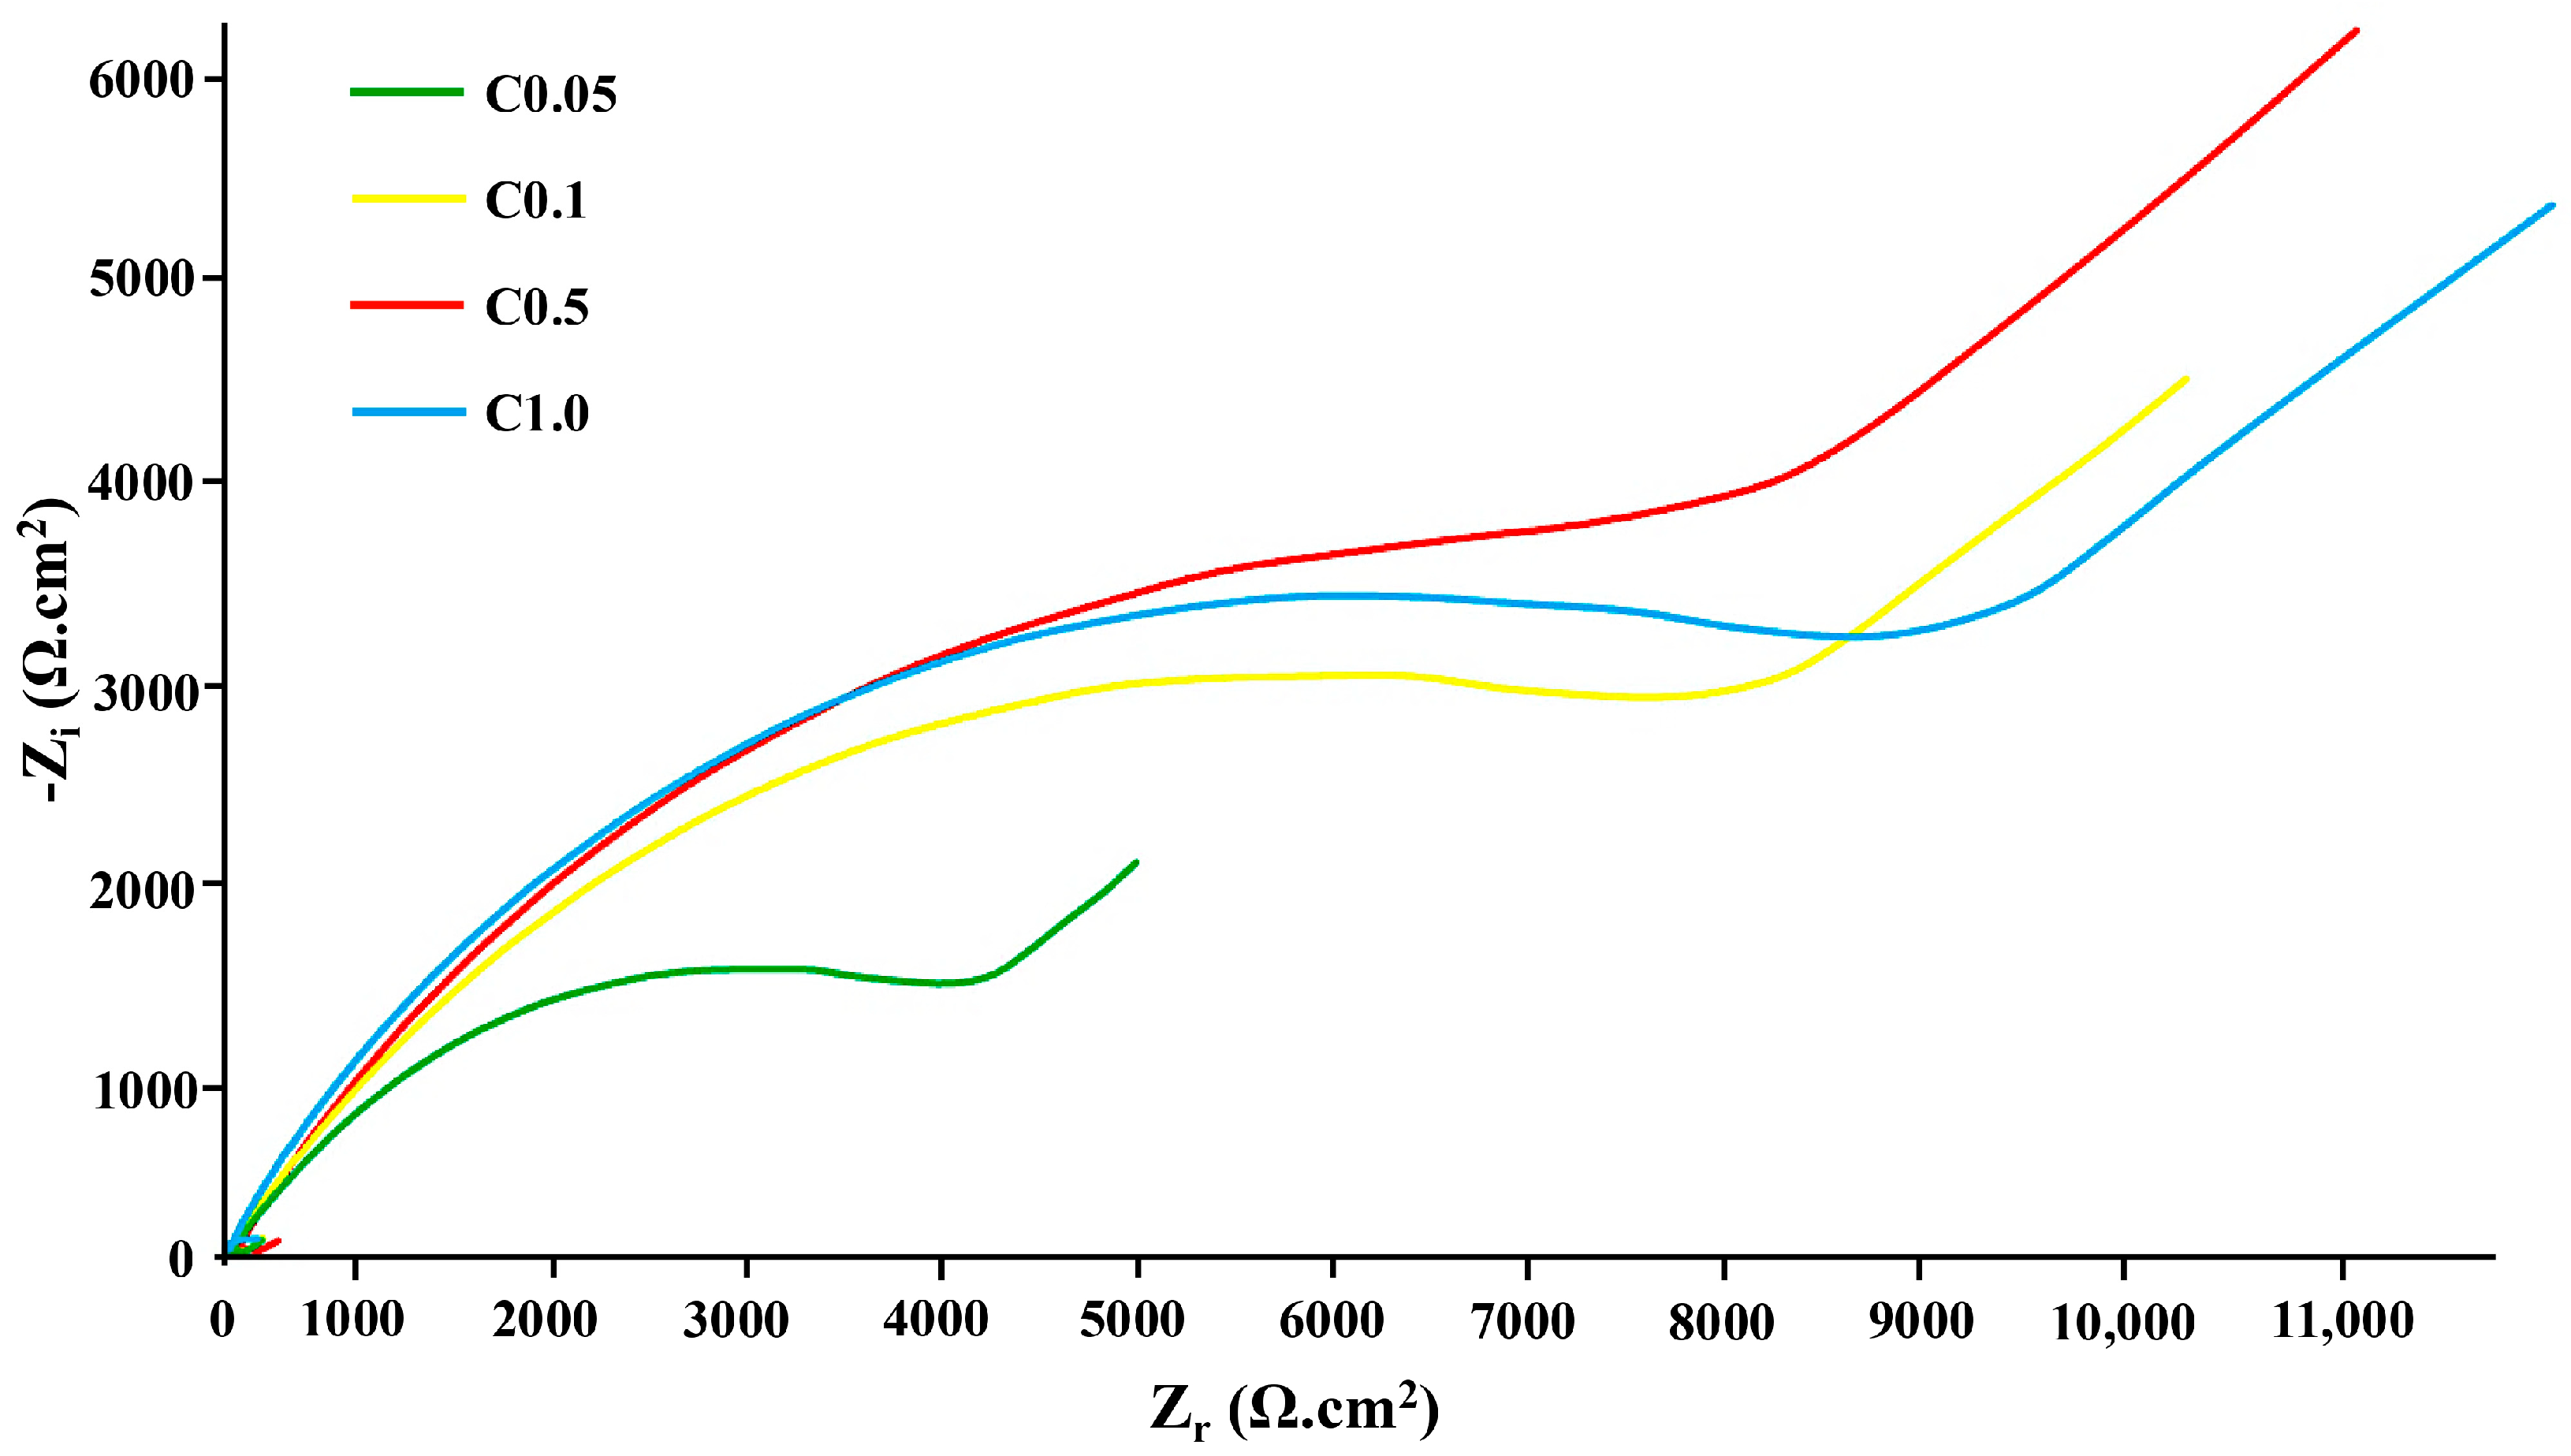
The CeO2, including CuAlMnFe alloys’ electrochemical corrosion behavior, was assessed using EIS testing in a 3.5 wt.%. NaCl solution at room temperature to better assess the impact of CeO2 addition. The corrosion products’ electrical resistance reflects the substrate’s protection. By employing the frequency response of the surface circuit, electrochemical impedance testing can non-destructively identify the surface resistance. In Figure 12, Nyquist plots of the Cu-based alloys with CeO2 addition were displayed. It demonstrates that the capacitive arc in the high frequency area was present in the impedance curves for C0.05, C0.1, C0.5, and C1.0 samples. It was clear that the radius of the impedance spectrum increased as the CeO2 concentration increased. The C0.1, C0.5, and C1.0 alloys’ radius was also greater than the C0.05 alloy’s, indicating that the passive layer after 0.05 wt.% CeO2-containing alloys’ surface had thickened. This indicates improved corrosion resistance and an increase in the impedance of the corrosion products. Otherwise, the corrosion surface inhomogeneity was the reason why the capacitance loop was not an exact semicircle. It was linked to a charge transfer process in the electronic double layer that developed at the junction of the corrosion solution and the Cu-based alloy surface [28].
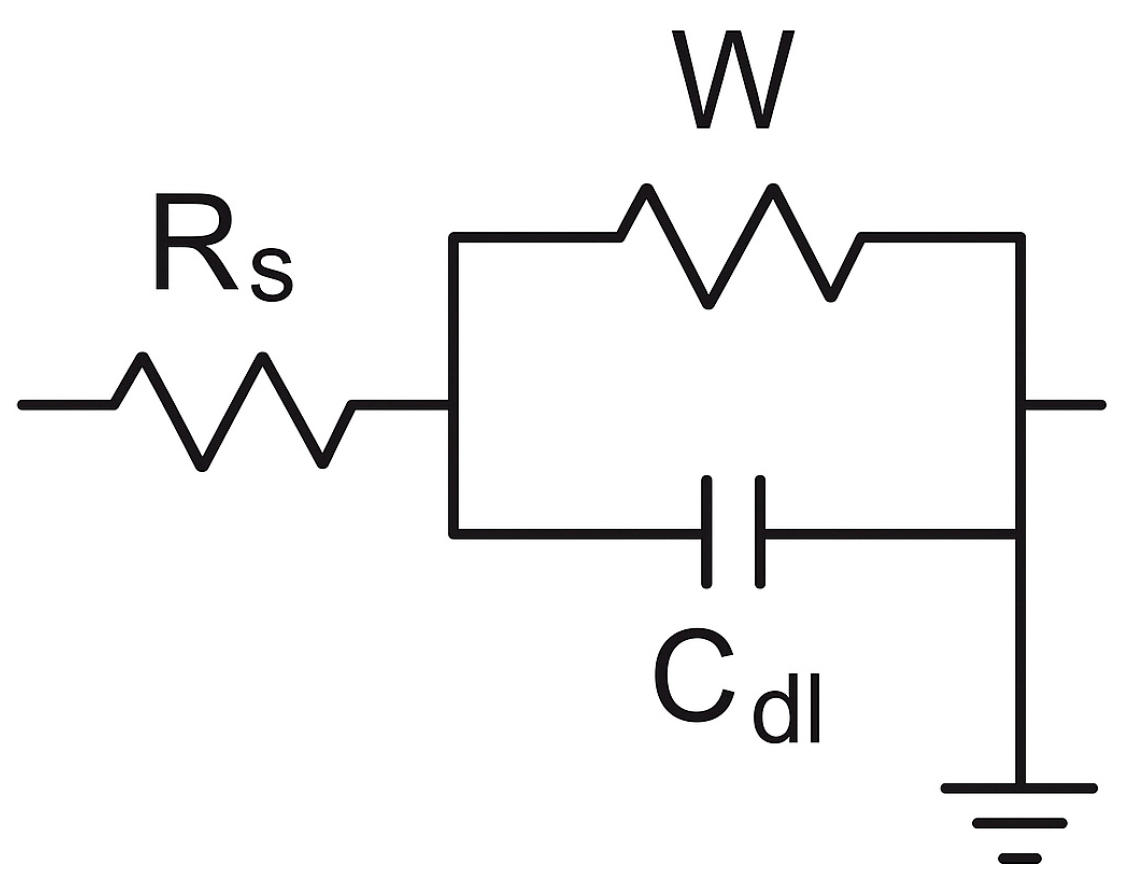
Consequently, it could be said that in conditions with a chloride content of 0.5 wt.%, CeO2 containing a CuAlMnFe alloy shows good local corrosion resistance. On the other hand, EIS data was fitted to provide more insight into the corrosion behavior. As an ideal capacitor to suit the EIS spectra, a constant phase element (CPE) is frequently utilized due to the electrode’s surface irregularities and non-uniformity. The fitted EIS spectra are shown by the solid line in Figure 13, which was based on the electrical equivalent diagrams in Figure 12. Rs stands for solution resistance, Rct and CPEdl for charge transfer resistance and double layer capacity, respectively. The impedance expression for the CPE:
Z C P E = Q 1 ( j w ) n
where Q, n, j, and ω stand for the CPE’s magnitude, the imaginary unit, the angular frequency, and the fitted exponential of CPE, respectively [64]. Because the corrosion electrochemical process could be reflected by the exchange current, high Rct values were linked to strong corrosion resistance [65].
ZW = σ(1 − j)ω−1/2
On the other hand, a Warburg impedance was added in series to model semi-infinite diffusion of electroactive species. Warburg diffusion element, accounting for semi-infinite linear diffusion of electroactive species. The linear tail at low frequency was characteristic of such behavior [66].
Nevertheless, the CeO2 could have influenced the composition and integrity of the passive film. The cerium ions (Ce3+/Ce4+) might incorporate into the formed oxide layer, leading to a more compact and less defective film. Thus, it could fill vacancies and defects within the oxide structure, reducing pathways for ion diffusion and preventing localized corrosion initiation. It could be attributed that the stability was further supported by the increased impedance values observed in the EIS measurements, indicating a higher resistance to charge transfer and mass transport through the passive layer [28]. In Table 3, it was detected that the C0.5 specimen had greater overall corrosion resistance since it showed greater Rct and lower CPEdl. Furthermore, the corrosion products’ resistance values gradually rise as the CeO2 concentration value increases. It could be inferred that the resistance of the alloy was responsible for the corrosion products’ overall resistance, and the critical function of the CeO2 passivation affected the establishment of the alloy’s corrosion resistance. Moreover, for the Cu-based alloy, the corrosion products’ resistance relatively increased at the C1.0 sample. It could be explained that the corrosion products’ protective function is partly limited. As a result, based on the corrosion findings shown in this work, it could be concluded that adding 0.5 wt.% CeO2 to the chemical composition of CuAlMnFe alloy should improve its passivity.

4. Conclusions

This study successfully investigated the effects of varying CeO2 concentrations (0.05, 0.1, 0.5, and 1.0 wt.%) on the microstructure, hardness, wear, and corrosion behavior of CuAlMnFe alloys produced via powder metallurgy. The diffraction peaks of martensite became considerably more apparent as the CeO2 level rose, and the high strength of the X-ray peaks suggested that the C0.5 sample included mostly martensite. The SEM pictures of the alloy with 0.5 wt.% CeO2 showed that the elements were dissolved in the matrix and had a more uniform distribution than those of other CeO2-containing alloy samples. It was demonstrated that CeO2 addition significantly refined the grain structure and promoted the formation of uniformly dispersed CeO2-rich precipitates, leading to a substantial increase in hardness. The hardness directly contributed to improved wear resistance by increasing the material’s resistance to plastic deformation and crack propagation, consistent with established wear theories (Archard’s Law). Furthermore, the electrochemical analyses revealed that CeO2 additions markedly improve the corrosion resistance of the CuAlMnFe alloy in 3.5 wt.% NaCl solution. This improvement is attributed to the formation of a more stable, dense, and protective passive oxide layer on the alloy surface, enriched with cerium oxides. This modified passive film acts as an effective barrier against corrosive species, reducing charge transfer and inhibiting localized corrosion. The C0.5 specimen, containing 0.5 wt.% of CeO2, exhibited the most optimal balance of enhanced hardness, wear resistance, and excellent corrosion performance among all tested compositions. This optimal concentration provided a practical guideline for the development of advanced Cu-based alloys. The synergistic improvements in both mechanical and electrochemical properties highlighted the potential of CeO2 as a multi-functional additive for CuAlMnFe alloys. The enhanced wear and corrosion resistance of the CuAlMnFe/CeO2 alloy could make it highly promising for components in diverse real-world applications, including industrial machinery, the automotive sector, marine environments, and potentially biomedical devices, where components are subjected to harsh operating conditions involving friction and saltwater. Future work could focus on further optimizing the processing parameters and exploring the long-term stability of these alloys in various service conditions.

Author Contributions

F.D.: writing initial draft, conceptualization of work, review; E.D.: experimental work, feedback, analysis. All authors have read and agreed to the published version of the manuscript.

Funding

This research was funded by the Scientific and Technological Research Council of Turkey (TUBITAK), grant number 122M981.

Institutional Review Board Statement

Not applicable.

Informed Consent Statement

Not applicable.

Data Availability Statement

The data presented in this study are available on request from the corresponding author.

Conflicts of Interest

The authors declare no conflicts of interest.

References

  1. Sattari, M.; Kadkhodaei, M.; Akbarzadeh, S.; Gholami, R.; Beheshti, A. Wear in superelastic shape memory alloys: A thermomechanical analysis. Wear 2022, 488–489, 204139. [Google Scholar] [CrossRef]
  2. Sattari, M.; Esfahani, H.A.; Kadkhodaei, M.; Akbarzadeh, S.A. Mechanical contact model for superelastic shape memory alloys. J. Intell. Mater. Syst. Struct. 2020, 32, 208–218. [Google Scholar] [CrossRef]
  3. Guotai, L.; Tianyu, Y.; Pan, W.; Mingjun, C. Molecular dynamics simulation of phase transformation and wear behavior of Ni35Al30Co35 high temperature shape memory alloy. Wear 2023, 522, 204849. [Google Scholar]
  4. Mohammad, H.Y.; Kadkhodaei, M.; Salehan, M. Fully coupled thermomechanical modeling of shape memory alloys under multiaxial loadings and implementation by finite element method. Contin. Mech. Thermodyn. 2019, 31, 1683–1698. [Google Scholar] [CrossRef]
  5. Yan, L.; Liu, Y. Effect of Deformation Mode on the Wear Behavior of NiTi Shape Memory Alloys. Shap. Mem. Superelasticity 2016, 2, 204–217. [Google Scholar] [CrossRef]
  6. Canbay, C.A.; Tataroğlu, A.; Dere, A.; Al-Sehemi, A.G.; Karabulut, A.; Bektaş, A.; Al-Ghamdi, A.A.; Yakuphanoglu, F. The photo-electrical performance of the novel CuAlMnFe shape memory alloy film in the diode application. Mater. Sci. Eng. B 2021, 264, 114931. [Google Scholar] [CrossRef]
  7. Trehern, W.; Ozcan, H.; Franco, B.; Hite, N.; Malone, N.; Loveall, B.; Morrison, T.D.; Benafan, O.; Karaman, I. Exploring thermomechanical functionality of CuAlMn as an extreme low temperature shape memory alloy. Mater. Lett. 2022, 308, 131246. [Google Scholar] [CrossRef]
  8. Moskvichev, E.; Shamarin, N.; Smolin, A. Structure and Mechanical Properties of Cu–Al–Mn Alloys Fabricated by Electron Beam Additive Manufacturing. Materials 2023, 16, 123. [Google Scholar] [CrossRef]
  9. Zhang, X.; Liu, Q.S. Influence of Alloying Element Addition on Cu–Al–Ni High-Temperature Shape Memory Alloy without Second Phase Formation. Acta Metall. Sin. (Engl. Lett.) 2016, 29, 884–888. [Google Scholar] [CrossRef]
  10. Wang, Y.; Xu, R.; Hu, S.; Tu, F.; Jin, W. Research combining experiment and FEM analysis on sliding wear behaviors and mechanisms of TiNi alloy. Wear 2017, 386–387, 218–222. [Google Scholar] [CrossRef]
  11. Huang, X.; Kang, N.; Coddet, P.; El Mansori, M. Analyses of the sliding wear behavior of NiTi shape memory alloys fabricated by laser powder bed fusion based on orthogonal experiments. Wear 2023, 534–535, 205130. [Google Scholar] [CrossRef]
  12. Baroni, L.F.S.; Silva, R.; Vacchi, G.S.; Sordi, V.L.; Rovere, C.A.D. Influence of Ce on the corrosion properties of Fe-Mn-Si-based shape memory stainless steel. Mater. Today Commun. 2020, 25, 101649. [Google Scholar] [CrossRef]
  13. Hammadi, D.F.; Ahmed Adnan, R.S.; Al-Sarraf, M.A. The effect of silicon carbide addition on the transformation temperatures and wear resistance of Cu-based shape memory alloys. Mater. Today Proc. 2022, 62, 6068–6076. [Google Scholar] [CrossRef]
  14. Ercan, E. Analysis of Dry Wear. Microstructure and Thermodynamic Parameters of CuAlTa Bulk Material. Trans Indian Inst Met. 2021, 74, 2193–2202. [Google Scholar] [CrossRef]
  15. Liu, L.; Qiao, Y.; Xu, P. Effect of La2O3 on Microstructure and Properties of Laser Cladding SMA Coating on AISI 304 Stainless Steel. Coatings 2022, 12, 1004. [Google Scholar] [CrossRef]
  16. Lu, B.; Cui, X.; Ma, W.; Dong, M.; Fang, Y.; Wen, X.; Jin, G.; Zeng, D. Promoting the heterogeneous nucleation and the functional properties of directed energy deposited NiTi alloy by addition of La2O3. Addit. Manuf. 2020, 33, 101150. [Google Scholar] [CrossRef]
  17. Xu, Z.; Guo, Y.; Liu, Y.; Yu, Z.; Zhang, Z.; Ren, L. The martensitic transformation behavior and shape memory effect of laser powder bed fusion NiTi alloys influenced by rare earth addition. Mater. Sci. Eng. A 2022, 848, 143350. [Google Scholar] [CrossRef]
  18. Lu, B.; Cui, X.; Jin, G.; Dong, M.; Fang, Y.; Wen, X.; Ma, W. Effect of La2O3 addition on mechanical properties and wear behaviour of NiTi alloy fabricated by direct metal deposition. Opt. Laser Technol. 2020, 129, 106290. [Google Scholar] [CrossRef]
  19. Zhao, C.; Liang, G.; Li, C.; Jin, Z. Influence of Cerium, Titanium and Nitrogen on Shape Memory Effect of Fe-Mn-Si-Cr-Ni Alloys. Scr. Mater. 1998, 38, 1163–1168. [Google Scholar] [CrossRef]
  20. Yang, Y.; Yang, M.; He, C.; Qi, F.; Wang, D.; Peng, S.; Shuai, C. Rare earth improves strength and creep resistance of additively manufactured Zn implants. Compos. Part B Eng. 2021, 216, 108882. [Google Scholar] [CrossRef]
  21. Yanan, L.; Ronglu, S.; Wei, N.; Tiangang, Z.; Yiwen, L. Effects of CeO2 on microstructure and properties of TiC/Ti2Ni reinforced Ti-based laser cladding composite coatings. Opt. Lasers Eng. 2019, 120, 84–94. [Google Scholar] [CrossRef]
  22. Hussain, S.; Pandey, A.; Dasgupta, R. Nano-CeO2 Doped Cu–Al–Ni SMAs with Enhanced Mechanical as well as Shape Recovery Characteristics. Met. Mater. Int. 2021, 27, 1478–1482. [Google Scholar] [CrossRef]
  23. Yang, S.; Omori, T.; Wang, C. A jumping shape memory alloy under heat. Sci. Rep. 2016, 6, 21754. [Google Scholar] [CrossRef]
  24. Pandey, A.; Jain, A.K.; Hussain, S. Effect of Nano CeO2 Addition on the Microstructure and Properties of a Cu-Al-Ni Shape Memory Alloy. Met. Mater. Trans. B. 2016, 47, 2205–2210. [Google Scholar] [CrossRef]
  25. Wang, Y.; Wang, Z.; Yang, Y.; Chen, W. The effects of ceria on the mechanical properties and thermal shock resistance of thermal sprayed NiAl intermetallic coatings. Intermetallics 2008, 16, 682–688. [Google Scholar] [CrossRef]
  26. Liu, X.Y.; Li, M.J.; Gao, F.; Liang, S.X.; Zhang, X.L.; Cui, H.X. Effects of aging treatment on the intergranular corrosion behavior of Al–Cu–Mg–Ag alloy. J. Alloys Compd. 2015, 639, 263–267. [Google Scholar] [CrossRef]
  27. Mahton, Y.; Kamde, M.A.; Chavan, A.; Saha, P. Influence of step-by-step cerium-based conversion and polydopamine duplex coating on stir cast AlCuMg alloys mitigating saltwater corrosion. Surf. Coat. Technol. 2024, 489, 131041. [Google Scholar] [CrossRef]
  28. Luo, B.; Lu, K.; Zhang, F. Effect of Aging Time on the Corrosion Resistance of the As-cast Al-Cu-Mg-Mn Alloy. JOM 2022, 74, 3616–3624. [Google Scholar] [CrossRef]
  29. Tian, W.; Hu, M.; Chen, X.; Zhou, H.; Sun, Y.; Lu, Q.; Wan, M. Effect of Ce addition on microstructure, mechanical properties and corrosion behavior of Al-Cu-Mn-Mg-Fe alloy. Mater. Res. Express 2020, 7, 036532. [Google Scholar] [CrossRef]
  30. Chen, J.; Bao, W.; Chen, H.; Ding, N.; Yang, X.; Yu, B.; Hong, T.; Cai, Z.; Xie, G. Dual phase reinforced CuCrZr alloy: Synergistic improvement of mechanical properties and corrosion resistance via metallic glass and rare earth oxides. Mater. Des. 2025, 251, 113686. [Google Scholar] [CrossRef]
  31. Liu, J.-S.; Yu, W.-X.; Chen, D.-Y.; Wang, S.-W.; Song, H.-W.; Zhang, S.-H. A Review of Studies on the Influence of Rare-Earth Elements on the Microstructures and Properties of Copper and Copper Alloys and Relevant Applications. Metals 2025, 15, 536. [Google Scholar] [CrossRef]
  32. Plakhova, T.V.; Romanchuk, A.Y.; Yakunin, S.N.; Dumas, T.; Demir, S.; Wang, S.; Minasian, S.G.; Shuh, D.K.; Tyliszczak, T.; Shiryaev, A.A.; et al. Solubility of Nanocrystalline Cerium Dioxide: Experimental Data and Thermodynamic Modeling. J. Phys. Chem. C. 2016, 120, 22615–22626. [Google Scholar] [CrossRef]
  33. Yavuzer, B.; Bicakci, Ü.; Simsek, D. Effect of Alloying Time and Heat Treatment on Microstructure and Tribological Properties of Mechanical Alloyed Cu-Al-Ni Shape Memory Alloy. J. Mater. Eng. Perform. 2024, 33, 11176–11187. [Google Scholar] [CrossRef]
  34. Yang, S.; Hong, S.; Li, M. Microstructure, martensitic transformation and shape memory effect of polycrystalline Cu-Al-Mn-Fe alloys. Sci. China Technol. Sci. 2021, 64, 400–406. [Google Scholar] [CrossRef]
  35. Dasgupta, R.; Jain, A.K.; Kumar, P.; Hussain, S.; Pandey, A. Role of alloying additions on the properties of Cu-Al-Mn shape memory alloys. J. Alloys Compd. 2015, 620, 60–66. [Google Scholar] [CrossRef]
  36. Mallik, U.S.; Sampath, V. Influence of quaternary alloying additions on transformation temperatures and shape memory properties of Cu-Al-Mn shape memory alloy. J. Alloys Compd. 2009, 469, 156–163. [Google Scholar] [CrossRef]
  37. Johnsy, A.G.; Agilan, S.; Jebasingh, S.; Vijay, J.S. Effect of sintering temperature on the mechanical properties of vacuum sintered Co-(Zn)-Ni alloys. Sci. Sinter. 2020, 52, 329–338. [Google Scholar] [CrossRef]
  38. Yi, X.; Wang, H.; Sun, K.; Shen, G.; Meng, X.; Gao, Z.; Cai, W. Tailoring martensitic transformation and mechanical properties of Ti-Ni composite reinforced by network structure of in-situ TiB and La2O3 phase. Vacuum 2021, 184, 109894. [Google Scholar] [CrossRef]
  39. Farajollahi, R.; Aval, H.J.; Jamaati, R. Effects of Ni on the microstructure, mechanical and tribological properties of AA2024-Al3NiCu composite fabricated by stir casting process. J. Alloys Compd. 2021, 887, 161433. [Google Scholar] [CrossRef]
  40. Perez, A.; Sanchette, F.; Billard, A.; Rébéré, C.; Berziou, C.; Touzain, S.; Creus, J. Comparison of the intrinsic properties of EBPVD Al-Ti and Al-Mg coatings. Mater. Chem. Phys. 2012, 132, 154–161. [Google Scholar] [CrossRef]
  41. Badiâ, A.; Hamadellah, A.; Bouayad, A.; Akili, C. Review of Grain Refinement Performance Of Aluminium Cast Alloys. Metall. taMater. Eng. 2023, 29, 1–15. [Google Scholar]
  42. Delaney, B.C.; Wang, Q.J.; Aggarwal, V.; Chen, W.; Evans, R.D. A Contemporary Review and Data-Driven Evaluation of Archard-Type Wear Laws. Appl. Mech. Rev. March 2025, 77, 022101. [Google Scholar] [CrossRef]
  43. Sedlaček, M.; Zupančič, K.; Šetina Batič, B.; Kosec, B.; Zorc, M.; Nagode, A. Influence of Precipitation Hardening on the Mechanical Properties of Co-Cr-Mo and Co-Cr-W-Mo Dental Alloys. Metals 2023, 13, 637. [Google Scholar] [CrossRef]
  44. Bhuyan, M.; Borah, A. Microstructure and Mechanical Properties Correlation of Al-4.28Cu-1.60 Mg Alloy Micro-Alloyed with Titanium. J. Mater. Eng. Perform. 2023, 32, 11085–11106. [Google Scholar] [CrossRef]
  45. Styles, M.J.; Hutchinson, C.R.; Chen, Y.; Deschamps, A.; Bastow, T.J. The coexistence of two S (Al2CuMg) phases in Al-Cu-Mg alloys. Acta Mater. 2012, 60, 6940–6951. [Google Scholar] [CrossRef]
  46. Li, A.; Pang, J.; Zhao, J. Crystallographic texture evolution and tribological behavior of machined surface layer in orthogonal cutting of Ti-6Al-4V alloy. J. Mater. Res. Technol. 2019, 8, 4598–4611. [Google Scholar] [CrossRef]
  47. Sharma, A.; Ahn, B. Brazeability, Microstructure, and Joint Characteristics of ZrO2/Ti-6Al-4V Brazed by Ag-Cu-Ti Filler Reinforced withCerium Oxide Nanoparticles. Adv. Mater. Sci. Eng. 2019, 2019, 8602632. [Google Scholar] [CrossRef]
  48. Guan, R.G.; Tie, D. A Review on Grain Refinement of Aluminum Alloys: Progresses, Challenges and Prospects. Acta Metall. Sin. (Engl. Lett.) 2017, 30, 409–432. [Google Scholar] [CrossRef]
  49. Sun, M.; Yang, D.; Zhang, Y.; Mao, L.; Li, X.; Pang, S. Recent Advances in the Grain Refinement Effects of Zr on Mg Alloys: A Review. Metals 2022, 12, 1388. [Google Scholar] [CrossRef]
  50. Zhang, Y.; Liu, Y.; Wang, J.; Hu, D.; Li, J. Microstructure and wear resistance of direct laser-deposited TiC-enhanced aluminum-based composite coating for brake discs. Surf. Coat. Technol. 2023, 455, 129193. [Google Scholar] [CrossRef]
  51. Zhao, X.; Fan, B.; Qiao, N.; Soomro, R.A.; Zhang, R.; Xu, B. Stabilized Ti3C2Tx-doped 3D vesicle polypyrrole coating for efficient protection toward copper in artificial seawater. Appl. Surf. Sci. 2024, 642, 158639. [Google Scholar] [CrossRef]
  52. Pantić, M.; Jovanović, S.; Djordjevic, A.; Petrović Savić, S.; Radenković, M.; Šarkoćević, Ž. Predicting Wear Rate and Friction Coefficient of Li2Si2O5 Dental Ceramic Using Optimized Artificial Neural Networks. Appl. Sci. 2025, 15, 1789. [Google Scholar] [CrossRef]
  53. Uniyal, P.; Gaur, P.; Yadav, J.; Khan, T.; Ahmed, O.S. A Review on the Effect of Metal Oxide Nanoparticles on Tribological Properties of Biolubricants. ACS Omega 2024, 9, 12436–12456. [Google Scholar] [CrossRef]
  54. Hazra, B.; Baranwal, P.; Bera, S.; Show, B.K. Improvement in dry sliding wear resistance of Al-17Si-5Cu alloy after an enhanced heat treatment process. Trans. Nonferrous Met. Soc. China. 2018, 28, 1705–1713. [Google Scholar] [CrossRef]
  55. Brandaleze, E.; Romanyuk, M.; Barrirero, J.; Mücklich, F.; Schell, N.; Brokmeier, H.G.; Ávalos, M.; Bolmaro, R. High deformation and delamination mechanisms explained through mesoscale and nanoscale phenomena in pearlitic steel wires. Metall. Res. Technol. 2024, 121, 111. [Google Scholar] [CrossRef]
  56. Wang, L.; Dong, B.; Qiu, F.; Geng, R.; Zou, Q.; Yang, H.; Li, Q.; Xu, Z.; Zhao, Q.; Jiang, Q. Dry sliding friction and wear characterization of in situ TiC/Al-Cu3.7-Mg1.3 nanocomposites with nacre-like structures. J. Mater. Res. Technol. 2020, 9, 641–653. [Google Scholar] [CrossRef]
  57. Liu, Y.; Jia, L.; Wang, W.; Jin, Z.; Zhang, H. Effects of Ni content on microstructure and wear behavior of Al-13Si-3Cu-1Mg-xNi-0.6Fe-0.6Mn alloys. Wear 2022, 500–501, 204365. [Google Scholar] [CrossRef]
  58. Jiang, D.; Liu, Y.; Liang, S.; Xie, W. The effects of non-isothermal aging on the strength and corrosion behavior of AlZnMgCu alloy. J. Alloys Compd. 2016, 681, 57–65. [Google Scholar] [CrossRef]
  59. Chai, Z.; Jiang, C.; Zhao, Y.; Wang, C.; Zhu, K.; Cai, F. Microstructural characterization and corrosion behaviors of Ni-Cu-Co coatings electrodeposited in sulphate-citrate bath with additives. Surf. Coat. Technol. 2016, 307, 817–824. [Google Scholar] [CrossRef]
  60. Doğan, F.; Duru, E.; Akbulut, H.; Aslan, S. How the duty cycle affects wear and corrosion: A parametric study in the Ni-B-TiN composite coatings. Results Surf. Interfaces. 2023, 11, 100112. [Google Scholar] [CrossRef]
  61. Doğan, F.; Uysal, M.; Algül, H.; Duru, E.; Akbulut, H.; Aslan, S. Optimization of pulsed electro co-deposition for Ni-B-TiN composites and the variation of tribological and corrosion behaviors. Surf. Coat. Technol. 2020, 400, 126209. [Google Scholar] [CrossRef]
  62. Du, J.; Ding, D.; Zhang, W.; Xu, Z.; Gao, Y.; Chen, G.; Chen, W.; You, X.; Chen, R.; Huang, Y.; et al. CeLa enhanced corrosion resistance of Al-Cu-Mn-Mg-Fe alloy for lithium battery shell. Appl. Surf. Sci. 2017, 422, 221–227. [Google Scholar] [CrossRef]
  63. Xiao, X.; Liu, X.; Wang, Z.; Xu, X.; Chen, M.; Xie, J. Corrosion mechanism and corrosion behavior prediction of Cu-10Ni-X alloys in NaCl solution combining DFT calculation and experiments. Corros. Sci. 2024, 227, 111671. [Google Scholar] [CrossRef]
  64. Brug, G.J.; van den Eeden, A.L.G.; Sluyters-Rehbach, M.; Sluyters, J.H. The analysis of electrode impedances complicated by the presence of a constant phase element. J. Electroanal. Chem. Interfacial Electrochem. 1984, 176, 275–295. [Google Scholar] [CrossRef]
  65. Ikeuba, A.I. AFM and EIS investigation of the influence of pH on the corrosion film stability of Al4Cu2Mg8Si7 intermetallic particle in aqueous solutions. Appl. Surf. Sci. Adv. 2022, 11, 100291. [Google Scholar] [CrossRef]
  66. Choi, W.; Shin, H.C.; Kim, J.M.; Choi, J.Y.; Yoon, W.S. Modeling and Applications of Electrochemical Impedance Spectroscopy (EIS) for Lithium-ion Batteries. J. Electrochem. Sci. Technol. 2020, 11, 1–13. [Google Scholar] [CrossRef]
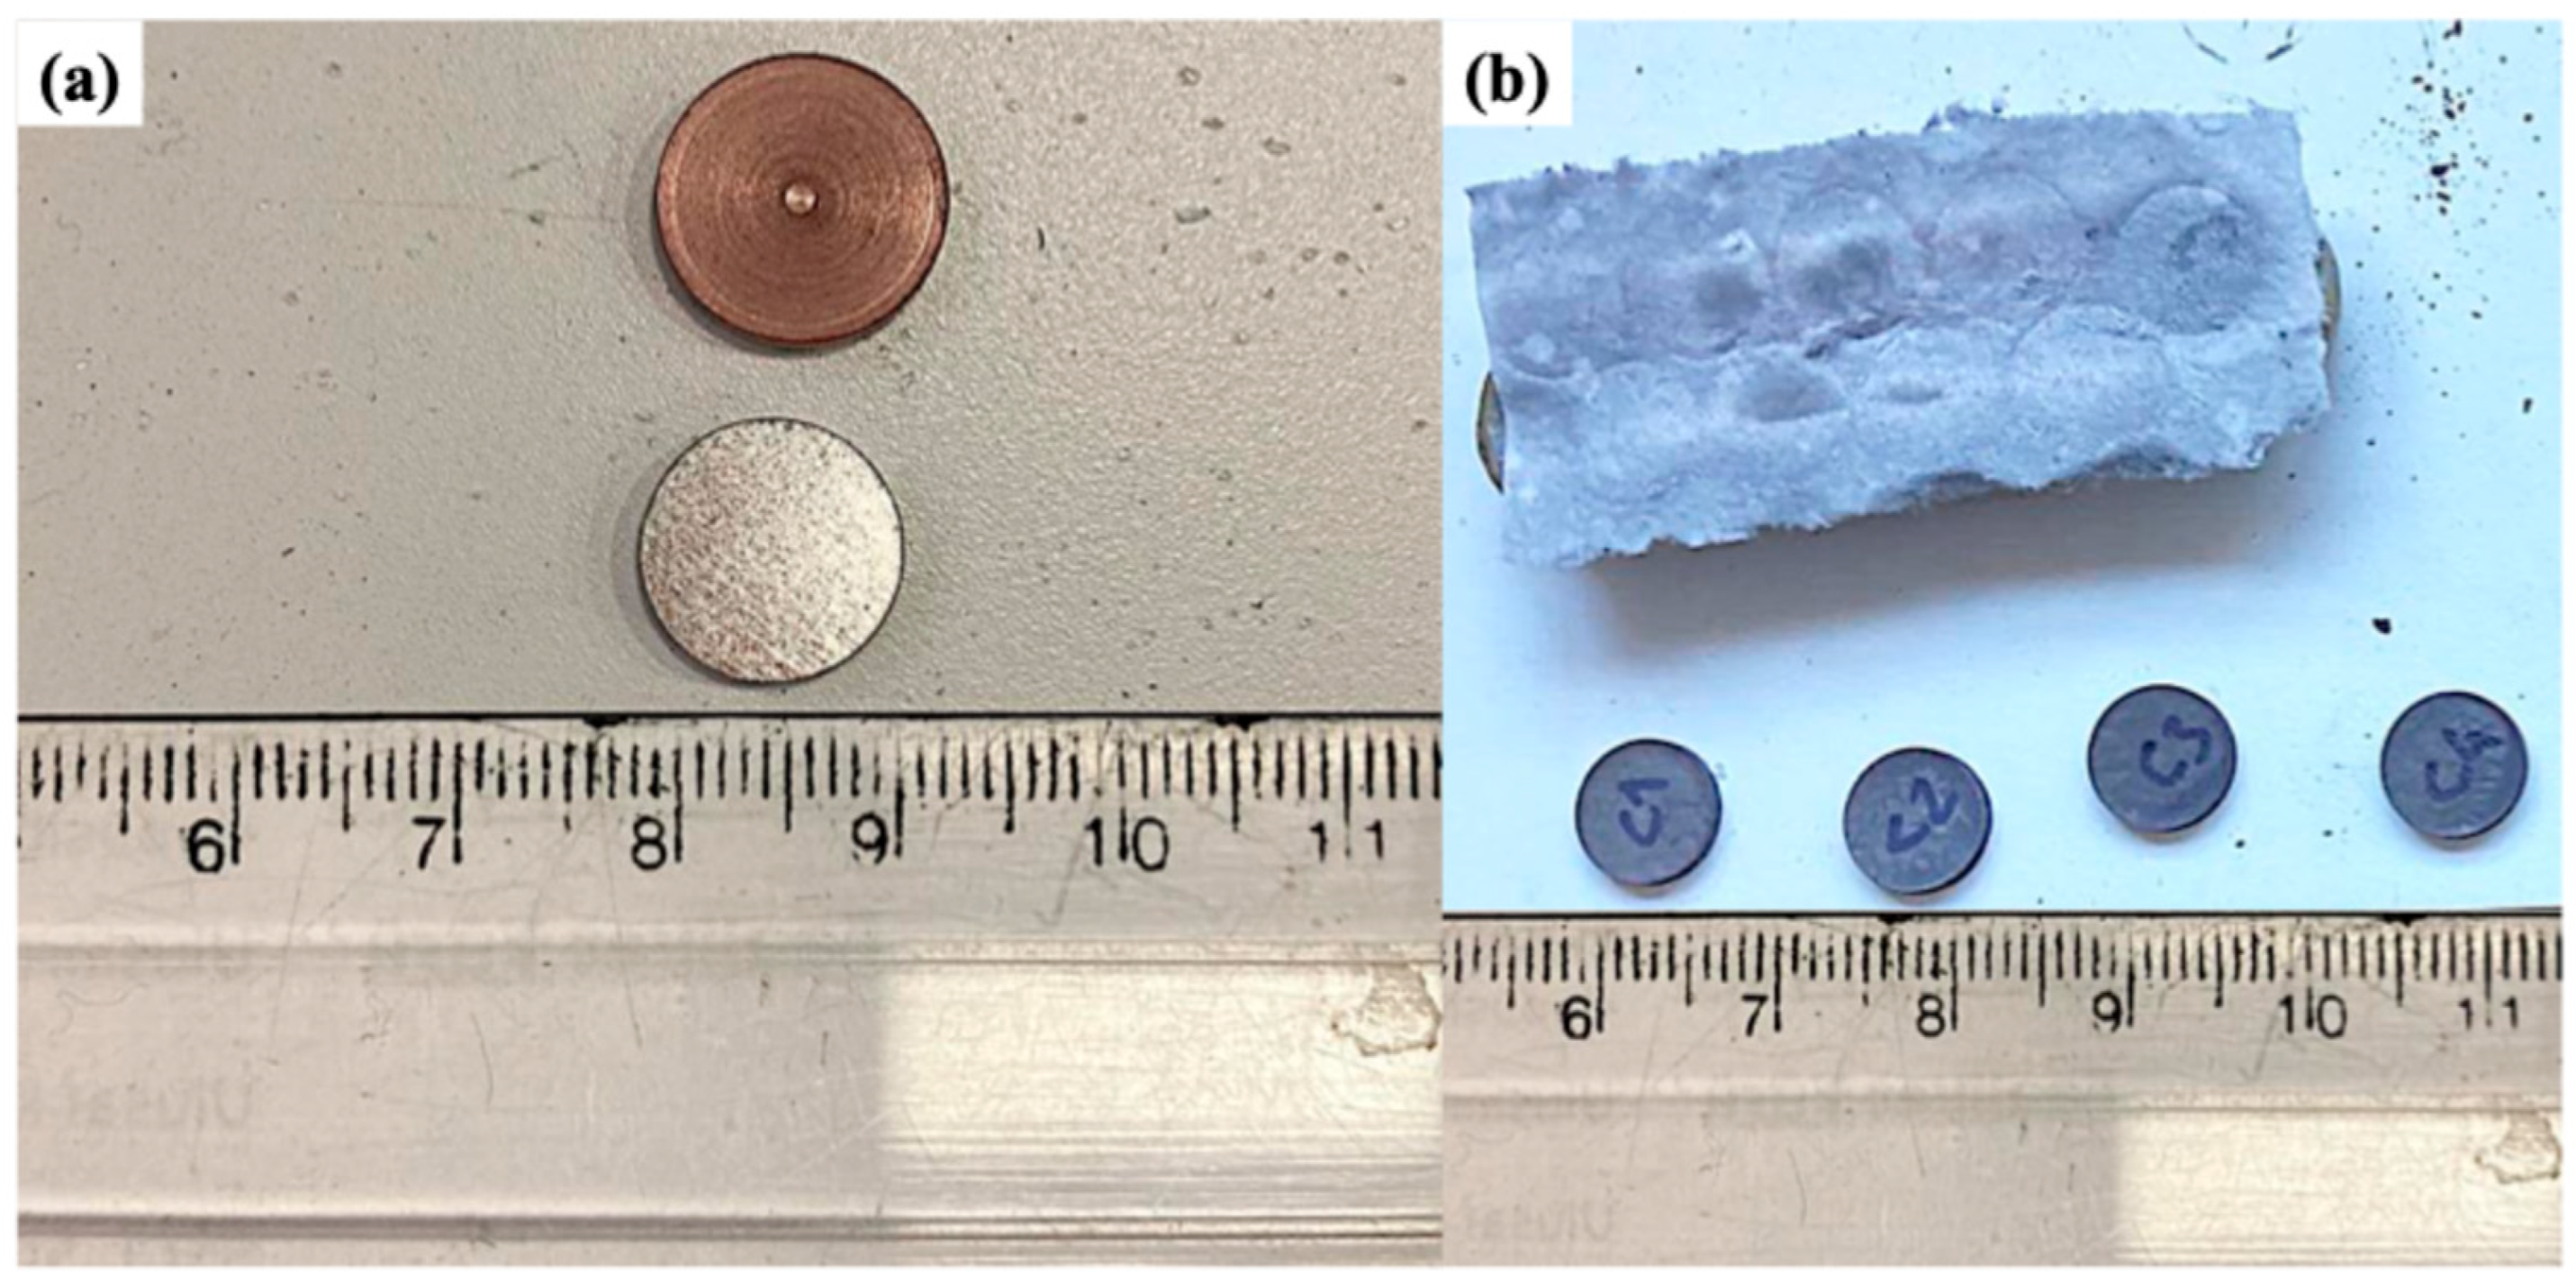
Figure 1. (a) A sample of the pellet and (b) sintered and homogenized CuAlMnFe alloys.
Solids 06 00043 g001
Figure 2. XRD results of alloy powders prepared at different powder mixing times.
Solids 06 00043 g002
Figure 3. XRD results of CuAlMnFe alloys with different CeO2 contents.
Solids 06 00043 g003
Figure 4. SEM images of CuAlMnFe SMA samples prepared at different mechanical mixing speeds; (a) 0 h, (b) 8 h, (c) 12 h, (d) 16 h, (e) 20 h, and (f) 24 h, respectively.
Solids 06 00043 g004
Figure 5. EDS mapping of CuAlMnFe alloy after 20 h of mechanical mixing.
Solids 06 00043 g005
Figure 6. EDS elemental composition table of CuAlMnFe alloy after 20 h of mechanical mixing.
Solids 06 00043 g006
Figure 7. SEM micrographs of CeO2-containing CuAlMnFe alloy; (a) C0.05, (b) C0.1, (c) C0.5, and (d) C1.0.
Solids 06 00043 g007
Figure 8. Hardness as a function of CeO2 content in CuAlMnFe alloys.
Solids 06 00043 g008
Figure 9. (a) Coefficient of friction vs. distance, and (b) wear rate vs. CuAlMnFe/CeO2 alloy samples at 25 °C.
Solids 06 00043 g009
Figure 10. SEM images of worn surfaces at 25 °C: (a1,a2) C0.05, (b1,b2) C0.1, (c1,c2) C0.5, and (d1,d2) C1.0.
Solids 06 00043 g010
Figure 11. Potentiodynamic polarization curves of the CeO2-containing CuAlMnFe alloys in the 3.5 wt.% NaCl solutions.
Solids 06 00043 g011
Figure 12. Nyquist plots of CeO2-containing CuAlMnFe alloys in 3.5 wt.% NaCl solution.
Solids 06 00043 g012
Figure 13. Equivalent circuit diagram.
Solids 06 00043 g013
Table 1. Sample design and contents of alloys.
Sample CodesTotal Weight
(g)
Cu
(wt.%)
Al
(wt.%)
Mn
(wt.%)
Fe
(wt.%)
CeO2
(wt.%)
C0.051080.9512520.05
C0.11080.912520.1
C0.51080.512520.5
C1.0108012521.0
Table 2. Tafel polarization parameters of the alloys examined at 25 °C in a 3.5 wt.% NaCl solution.
SampleEcorr (V)icorr (A/cm2)
C0.05−0.731.43 × 10−8
C0.1−0.685.41 × 10−8
C0.5−0.589.03 × 10−6
C1.0−0.706.99 × 10−7
Table 3. Fitting data of electrochemical parameters from EIS graphs.
SampleRs
(Ω·cm2)
Rct
(Ω·cm2)
CPEdl
(μF·cm−2)
Warburg Coefficient (σ, Ω·s½·cm2)
C0.0525121055847
C0.131232133661
C0.5524547413105
C1.045345192987
Disclaimer/Publisher’s Note: The statements, opinions and data contained in all publications are solely those of the individual author(s) and contributor(s) and not of MDPI and/or the editor(s). MDPI and/or the editor(s) disclaim responsibility for any injury to people or property resulting from any ideas, methods, instructions or products referred to in the content.