Abstract
Titanium nitride (TiN) is an advantageous material for plasmonic applications and is suitable for extreme conditions in which conventional plasmonic materials such as gold (Au) cannot be utilized. In this study, TiN and Au nanodisk arrays with different lattice spacing (Λ) were fabricated using the electron beam lithography (EBL) method to increase the quality factor of TiN. At a period of 550 nm, the TiN nanodisk arrays demonstrate a higher sensitivity, 412.79 nm·RIU−1, with the plasmonic resonance wavelength shifting from 883 nm (n = 1.3335) to 915 nm (n = 1.4069) in the NIR region. The surface lattice resonance (SLR) properties of the produced TiN nanodisk arrays were investigated in detail with Au nanodisk arrays. The TiN nanodisk arrays caused sharp plasmon resonances by creating a localized plasmon vibration mode coupled with the diffractive grazing wave excited by the incident light. The transmission dips obtained at narrower full width at half maximum (FWHM) values caused at least an almost 10-fold improvement in the quality factor compared to localized surface plasmon resonance (LSPR) dips. This study is significant for assessing the surface plasmon resonance characteristics of TiN and Au nanodisk arrays across various periods and indices.
1. Introduction
Utilizing recent advancements in computational and fabrication techniques, the coupling of individual LSPR modes via inter-particle interactions has been demonstrated, resulting in SLR, also known as collective lattice resonance (CLR) [1,2,3,4]. Ordered arrays of metal nanoparticles can scatter light, generating diffracted waves when illuminated with free-space plane waves. If a diffracted wave propagates in the plane of the array, it may couple the LPR of individual nanoparticles, resulting in a remarkable phenomenon: the significant narrowing of plasmon resonances to a spectral width of one to two nm [1,3,5]. In comparison to SLR, LSPR exhibits a higher FWHM, thereby constraining its utility in devices reliant on high-quality factors.
The coupled dipole approximation (CDA) functions as a fundamental theoretical framework for examining light–matter interactions in periodic nanoparticle arrays. This approach treats each nanoparticle as an induced dipole, with the dipole moment defined by the particle’s polarizability and the local electric field, which includes contributions from scattered fields produced by adjacent particles. The organized configuration of nanoparticles is essential for improving light–matter interactions, especially via constructive interference LSPR. The emergence of SLR is facilitated by the optimized size, morphology, and periodicity of these nanoparticles, which enables researchers to synchronize the scattered fields with the plasmonic responses of adjacent particles. This precise tuning not only mitigates the damping effects associated with individual particle resonances but also significantly improves the quality factor of the resonance [3,5].
When the optical responses of plasmonic nanoparticles approach the Rayleigh anomaly, the plasmon excitation from one nanoparticle directly interacts with neighboring particles [1]. Wood anomalies occur when regular periodic structures’ reflection properties change suddenly [6]. Rayleigh explained these anomalies of regular nanoparticle arrays on a transparent substrate by saying that a diffraction wave loses its characteristics when it crosses the medium–substrate boundary. Due to their different dispersion relations, diffraction modes cannot transition between substrate and air environments. This cuts off the diffraction mode at the Rayleigh cutoff wavelength. One of the Rayleigh diffraction waves interacts with many nanoparticles along the substrate surface at a grazing angle when a series is illuminated. Thus, if λR is close to a single nanoparticle’s localized plasmon wavelength, it may be possible to strongly transfer light energy to the localized plasmon modes and obtain sharp plasmon resonances near the Wood anomaly in a drastic narrowing linewidth of the plasmonic resonance wavelength [3,7]. In this case, the coupled nanoparticle array over an extended area generates SLR [1].
Au and Ag have been the most frequently employed materials to demonstrate plasmonic phenomena due to their high figure of merit (FOM). Although having a high FOM is crucial, it is inadequate for real-world applications due to the numerous critical limitations that prevent their wide-ranging use [8,9,10,11]. TiN is a favorable plasmonic material for optoelectronic applications, necessitating durability against extreme irradiation or temperatures. While TiN exhibits optical similarities to noble metals at near-infrared wavelengths under steady-state excitation, it surpasses many limitations of plasmonic metals owing to its superior electron conductivity and mobility, refractory properties, and compatibility with complementary metal oxide semiconductor (CMOS) technology [12,13,14,15]. The most attractive characteristic of TiN is its highly adjustable dielectric permittivity, which is influenced by metal/nitrogen stoichiometry, and its ability to exhibit full-visible-range colors, which is significantly dependent on the physical morphology of the nanostructure [8,16,17,18,19,20,21,22].
Zakomirnyi et al. fabricated a 2D TiN nanodisk array and investigated its SLR characteristics within this wavelength range for telecommunications applications [17]. Corrie and Giddings fabricated a semisphere by depositing TiN onto nanospheres and analyzed its optical properties using an ellipsometer, omitting any investigation of the refractive index [23]. Reese et al. fabricated TiN nanoparticle arrays and investigated the ultrafast photoinduced characteristics of the particles utilizing the SANE method [24]. Güler et al. synthesized TiN nanostructures utilizing TiO2 powder, nanorods, nanowires, and thin films. The researchers investigated the plasmonic and optical characteristics of the nanostructures fabricated without employing various refractive index media [25]. Günaydın et al. fabricated plasmonic TiN nanohole arrays and examined their remarkable optical transmission characteristics in water–ethanol environments [26]. Asencios et al. fabricated multilayers within TiN thin films and assessed the films’ sensitivity in aqueous and desiccated egg white conditions utilizing the ATR-SPR technique [27]. Sato et al. investigated the wavelength-dependent nonlinearities of TiN thin films and nanoparticles utilizing ellipsometry and ultrafast pump-probe spectroscopy [28]. Gui et al. have examined the nonlinear second-order optical properties through second-harmonic spectroscopy utilizing TiN nanoantennas [29]. Chang et al. developed an adjustable TiN grating structure and investigated its plasmonic characteristics in the infrared spectrum via simulations [30].
This study focuses on the fabrication and examination of plasmonic nanodisk arrays, highlighting the properties and production methods of TiN and Au materials. Plasmonic TiN thin films were converted into nanodisk arrays using EBL and dry etching techniques, while Au nanodisk arrays were produced using EBL and lift-off methods. These nanodisk arrays, produced homogeneously, have enabled a detailed examination of the diffraction coupling responsible for SLR and the refractive sensitivity of the two materials under different refractive indices. The systematic comparison of the SLR properties of TiN and Au nanodisk arrays in the Vis-NIR spectral range reveals TiN’s potential as an alternative plasmonic material to Au, particularly showing that it can offer tunable plasmonic behaviors under higher quality factors and different lattice periods and refractive indices.
2. Materials and Methods
2.1. Fabrication of TiN Thin Film and Nanodisk Arrays
Plasmonic TiN thin films were deposited on fused silica (FS) substrate using reactive radio frequency (RF) magnetron sputtering (NANOVAK, NVSP-400, Nanovak, Ankara, Türkiye) with a 99.995% pure Ti target (Kurt J. Lesker, Germany ) in a Class 1000 cleanroom environment. Before film deposition, the FS substrate was cleaned using a 3:1 piranha solution (H2SO4:H2O2), thoroughly rinsed with deionized water, and dried on a hot plate for 1 min. The base pressure in the sputtering chamber was maintained at approximately 8 × 10⁻⁶ Torr. Detailed optimization of the plasmonic TiN thin films was reported in our previous study [26], and the findings from these preliminary investigations guided the current deposition process. In brief, TiN thin films were deposited under 1.0:0.5 sccm Ar/N2 gas mixture introduced into the system at a constant RF power of 200 W. During the reactive sputtering process, active heating was applied, maintaining the substrate temperature at 400 °C. The deposition rate of the thin films ranged between 2.70 and 4 nm/min. The structural and plasmonic properties of the films used to fabricate nanodisc arrays are shown in Figure 1 and Figure 2.
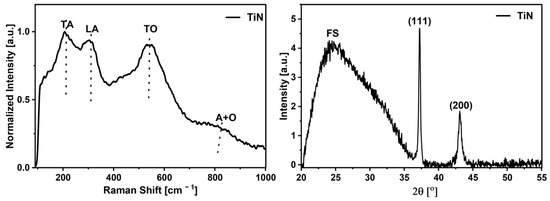
Figure 1.
Raman (left) and XRD (right) spectra of the TiN thin films. The XRD pattern confirms the cubic crystalline structure, while the Raman spectrum highlights characteristic phonon modes (TA, LA, TO, and A + O). The phonon bands of TiN are marked with dash lines. Annotated in and above the stack spectra are abbreviations for acoustic (A) and optical phonon modes (O).
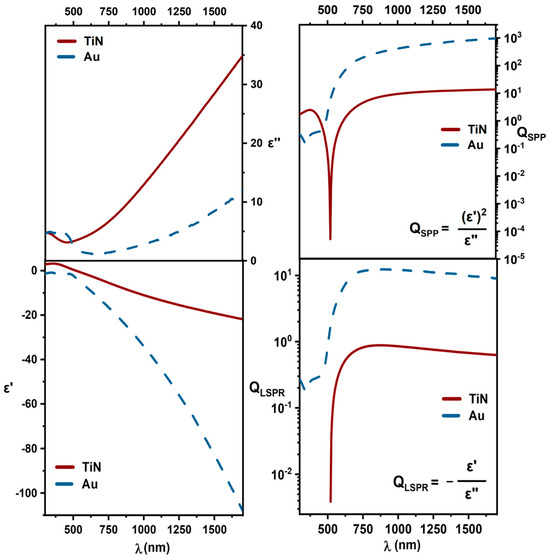
Figure 2.
Comparison of TiN and Au thin films based on spectroscopic ellipsometry results. The real (ε′) and imaginary (ε″) parts of the dielectric function are plotted to evaluate the optical properties of TiN and Au. The quality factors for surface plasmon polaritons (QSPP) and QLSPR are also calculated, highlighting the potential of TiN as a plasmonic material compared to Au.
After depositing the plasmonic TiN thin films, nanodisk array patterning was performed using EBL with the Vistec EBPG 5000+ system. The plasmonic TiN films were first spin-coated with Allresist CSAR 6200.13 resist at 4000 rpm for 45 s, followed by a soft bake at 150 °C for 2 min. The resist was then exposed using EBL, employing a 10 nm spot size electron beam, a 300 µC/cm2 dose, and a beam current of 5.0 nA. The exposed resist structures were developed through sequential immersion in developer, methyl isobutyl ketone:isopropyl alcohol (MIBK:IPA) (1:1) and 2-propanol, followed by nitrogen stream drying and a hard bake at 130 °C for 1 min. The TiN layer on the developed sample was subsequently etched using inductively coupled plasma reactive ion etching (ICP-RIE) with the Oxford Plasmalab System 100. The etching parameters included a 25 s etch time, 1000 W ICP power, 85 W RF power, 20 sccm of Cl2, 20 sccm of Ar, a process pressure of 15 mTorr, and a substrate temperature of 10 °C. Finally, the residual CSAR resist layer was removed from the patterned TiN films by immersing the sample in the CSAR remover solvent (AR 600–71) overnight. A schematic illustration of the fabrication flow from thin film to plasmonic TiN nanodisk arrays is provided in Figure 3.
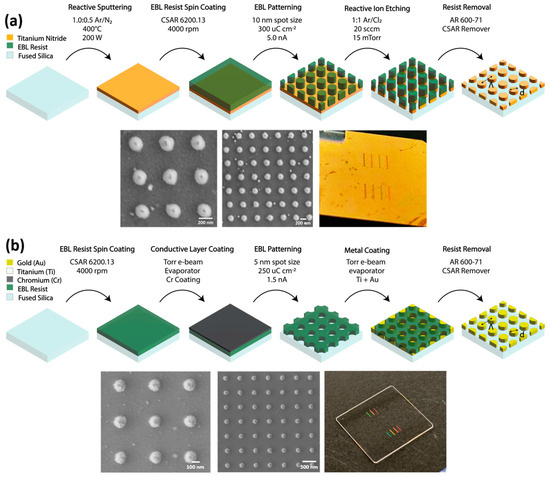
Figure 3.
(a) A schematic illustration of the fabrication process for TiN nanodisk arrays, accompanied by SEM images displaying the fabricated nanodisk arrays and photographs highlighting the TiN nanodisk arrays on real substrates. (b) A schematic fabrication flow and SEM images of Au nanodisk arrays. “Λ” is the periodicity of arrays, and “d” is the diameter of nanodisks.
2.2. Fabrication of Au Nanodisk Arrays
A lift-off process was implemented using the EBL system to fabricate plasmonic Au nanodisk arrays. Prior to resist coating, the FS substrates were cleaned using a 3:1 piranha solution (H2SO4:H2O2) as described above. This step was followed by exposure to oxygen plasma in an ICP-DRIE system for 3 min at 300 W RF power to enhance surface cleanliness and activation. The cleaned and hydrophilized FS substrates were then spin-coated with a CSAR 6200.13 EBL resist layer at 4000 rpm for 45 s. A 20 nm chromium (Cr) layer was thermally evaporated onto the resist to ensure surface conductivity before EBL. The EBL process was performed with a dose of 250 µC/cm and 5 nm spot size at a beam current of 1.5 nA. The resist layer was developed following nanopatterning, and a 100 nm Au layer was thermally evaporated onto the patterned resist. Finally, a lift-off process was carried out overnight to complete the fabrication of the plasmonic nanodisk arrays (Figure 3).
2.3. Characterization
The thickness of the deposited films was determined using a KLA Tencor P6 Surface Profiler. High-resolution X-ray diffraction (XRD) analysis was performed with a Bruker D8 Advance diffractometer, scanning in 0.002° increments across a 2θ range of 20° to 60°, with a step time of 1 s. Raman spectroscopy measurements were conducted using a Renishaw InVia Reflex Raman spectrometer to identify the phases of the deposited TiN. These measurements utilized a 532 nm laser source with a laser power of 10 mW, a 20 s exposure time, and a Raman shift range of 100–1500 cm−1. Additionally, the nanodisk arrays were visualized using a scanning electron microscope (SEM, ZeissLeo Supra VP 35) as shown in Figure 4 and Figure 5. A variable-angle spectroscopic ellipsometer (J.A. Woollam Co., VASE VB-400, Lincoln, NE, USA) was utilized to measure the Ψ and Δ parameters at incident angles of 65°, 70°, and 75°, enabling the characterization of the optical properties of the deposited thin films. The collected data were analyzed and modeled using the WVASE32© 3.686 software library.
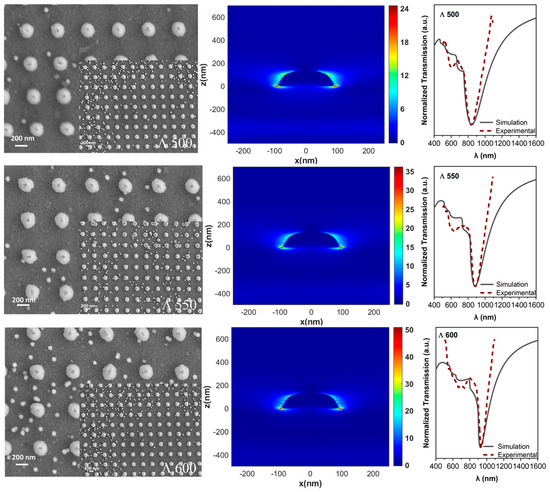
Figure 4.
The SEM images of TiN nanodisk arrays are presented for periods of 500 nm, 550 nm, and 600 nm, with the scale bar indicating 200 nm. Electric field intensity distributions |E|2 in the cross-sectional plane (xz) of the nanodisk array for periods of 500, 550, and 600 nm at the TiN/substrate interface (C). The transmission spectra of TiN nanodisk arrays correspond to a fabricated period within the wavelength range of 500 to 800 nm in a 1.0 wt.% glycerol–water medium. The black lines represent the FDTD simulations of the arrays for the specified period, while the red lines display the experimental transmission spectra.

Figure 5.
The SEM images of Au nanodisk arrays are presented for periods of 500 nm, 550 nm, and 600 nm, with the scale bar indicating 100 nm and the scale bar on the inset images indicating 1 μm.
2.4. Simulation
The feature parameters of the nanodisk arrays were simulated using commercial Finite Difference Time Domain (FDTD) software (Ansys Lumerical FDTD, 2023 R1), specifically designed for solving electromagnetic systems. A broadband light source, polarized along the x-axis and spanning wavelengths from 400 to 1700 nm, was employed as the excitation source in the simulation. To analyze the system, the electric field intensity distributions were captured on the xz-plane cross-section of the nanocavity array, positioned 1 nm above the TiN/medium interface, using a uniform 5 nm mesh.
For improved accuracy, the mesh was refined using the conformal variant 1 method, with an additional custom 1 nm resolution mesh applied at each interface to accurately model the metal/dielectric layers. The boundary conditions were optimized for simulation efficiency, employing a steep-angle perfectly matched layer (PML) along the z-axis. In contrast, symmetric and anti-symmetric conditions were applied along the y-axis and x-axis, respectively. The auto shut-off level was set at 10−7 to ensure precision, and the simulation runtime was fixed at 500 fs. The nanodisk arrays were simulated in a 1.0 wt.% glycerol–water medium with periodicities ranging from 500 to 600 nm as shown in Figure 4.
2.5. Microspectroscopy
The transmission spectrums of the plasmonic nanodisk arrays were characterized using a custom microspectroscopy setup, as shown in Figure 6. A fiber-coupled tungsten halogen broadband light source was collimated through a parabolic mirror-based reflective collimator (Thorlabs, RC08SMA-P01). To separate the illumination and imaging/spectroscopy paths within the setup, a plate beamsplitter (Thorlabs, BSW29R, 50:50) was employed. In the imaging/spectroscopy pathway, a tube lens (Thorlabs, TTL200-S8, f = 200 mm) was used to focus the image onto both the imaging camera and the spectrometer’s slit plane. A non-polarizing cube beamsplitter (Thorlabs, CCM1 = BS014, 50:50) further divided the imaging and spectroscopy arms. For imaging, a monochromatic CMOS camera (Basler, acA4112-30um, 12.3 MP, Sony IMX253 sensor) captured the image, while spectral data were acquired in the spectroscopy arm using an imaging spectrometer (PI, Isoplane SCT320) coupled with a spectroscopy CCD camera (Andor iVac 316 LDC-DD).
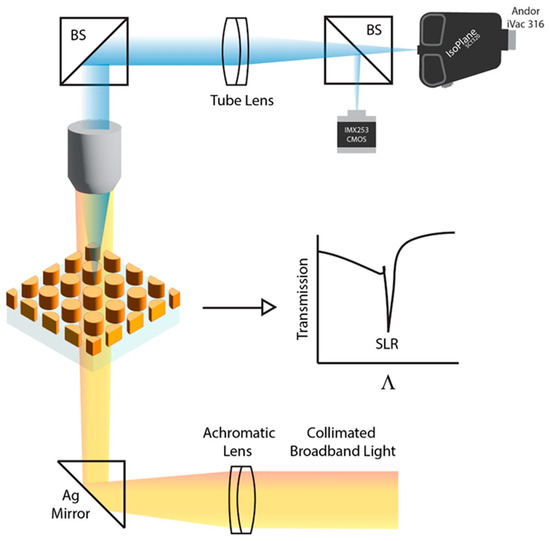
Figure 6.
Schematic illustration of the custom transmission microspectroscopy setup. The microspectroscopy setup utilized a wavelength range of 400–1100 nm to acquire spectral measurements.
3. Results
3.1. Fabrication and Characterization of Plasmonic TiN Thin Films
Plasmonic TiN thin films were first deposited onto FS substrates to fabricate plasmonic nanodisk arrays. The films were produced using the RF magnetron sputtering technique with a gas flow ratio of 1.0:0.5 sccm (Ar:N2) and substrate heating at 400 °C. The resulting TiN thin films, with a thickness of 135 nm, were thoroughly characterized to assess their structural and optical properties, as illustrated in Figure 1 and Figure 2. The Raman spectrum of the TiN thin films reveals two broad bands in the 150 cm−1–300 cm−1 range and another band around 550 cm−1. The bands below 300 cm−1, associated with Ti, are attributed to acoustic transition modes (longitudinal acoustic (LA) mode and transverse acoustic (TA) mode), while the band near 550 cm−1, related to nitrogen, corresponds to the transverse optical (TO) mode [26,31]. In the acoustic range, Raman scattering is also caused by the vibration of heavy Ti ions, whereas in the optical range, it is caused by the vibration of lighter nitrogen ions [31]. Furthermore, a dominant substrate peak at a diffraction angle of 25° can be observed in the XRD result of the TiN thin films deposited on the FS substrate. At 37° and 43° diffraction angles, we also come across the thin films’ distinctive TiN diffraction (111) and (200) peaks [26,32,33,34,35]. The TiN structure was confirmed by Raman and XRD analyses, and a spectroscopic ellipsometer has been used to examine the thin films’ optical characteristics in the Vis-NIR spectral range.
The ellipsometer results shown in Figure 2 indicate that TiN thin films exhibit metallic properties in the Vis-NIR region post-screen plasma frequency (ωp, 520 nm for TiN), with plasmonic characteristics becoming more prominent as the wavelength is extended [26]. We omit the region λ < ωp, where resonance excitation is prevented by significant interband absorption [36]. The quality factor of a plasmonic application can be assessed using metrics such as QSPP and QLSPR. The QSPP factor assesses the propagation length of surface plasmon polarity (SPP), while the QLSPR factor quantifies the field enhancement and refractometric sensitivity of LSPR at the metal/dielectric interface. The results indicate that TiN may be an appropriate alternative to Au in NIR region applications [37].
3.2. Fabrication and Simulation of Plasmonic TiN Nanodisk Arrays
The irregular arrangement of array structures frequently results in considerable disorder, leading to increased broadening at the resonance peaks. Nanofabrication methods such as EBL enable the creation of metal nanoparticle arrays with uniform periodicity and controlled dimensions over patterned areas up to cm2, resulting in enhanced coherent coupling between the nanoparticles and the measurements [8]. Consequently, the nanodisk arrays were fabricated utilizing the EBL technique. As shown in Figure 2, TiN exhibits metallic properties beyond ωp, specifically above 520 nm, and the QLSPR indicates that the quality factor reaches its maximum in the regions of red light and higher wavelengths. Thus, to investigate the hybridization of localized plasmon oscillations with the diffracted grazing wave induced by incident light via resonance, plasmonic TiN and Au nanodisk arrays with lattice periods of 500, 550, and 600 nm were subsequently fabricated using the EBL technique on the FS substrate. Each array features an active area of 200 μm × 200 μm, with TiN nanodisk arrays produced via dry etching and Au nanodisk arrays fabricated using the lift-off technique. For the TiN nanodisk arrays, the disk height has been determined to be 135 nm and the average disk diameter to be 220 nm. Similarly, the height of the Au nanodisk arrays has been determined to be 110nm, consisting of 10 nm Ti and 100 nm Au, and their average diameters are about 160 nm. The dimensions are close to the values required by the Schatz and Markel theory [36,38]. Figure 3 illustrates the schematic fabrication flow of Au and TiN nanodisk arrays. The SEM images reveal the formation of regular nanodisk array structures following production via the EBL method. Furthermore, in photographs of TiN and Au substrates patterned via EBL, the nanopatterns refracted the incident light, producing a spectrum of varying colors based on the lattice spacing of the nanodisk arrays.
Figure 4 and Figure 5 display the SEM images of the fabricated TiN and Au nanodisk arrays for each period. The morphologies reveal a consistent structure in the nanodisk arrays constructed from both materials. Using the nanodisk structure parameters obtained from the SEM images of the produced nanodisks, iteration simulations for each period were performed with the Anys Lumerical FDTD program. In the experimental and simulation transmission measurements indicated in Figure 4, the refractive index of the medium, nmedium, was set to 1.3335 (1.0 wt.% glycerol–water medium). The SEM images show a regular nanodisk array morphology was created for each period. The cross-section (xz) simulations of the nanodisk array reveal that the electric field concentrations (hot spots) occur between the substrate and the TiN nanodisk interference, specifically at the points of light entry. Furthermore, it is noted that the electric field intensity |E|2 increases with the lattice parameters, attaining its optimal value at the maximum period. In TiN nanodisks, the simulated (solid black) and experimental (red dashed) normalized transmission spectra at periods of 500 nm, 550 nm, and 600 nm exhibit overlapping SLR dips that shift from 800 nm to 950 nm with increasing periods [24].
3.3. Comparison of the Characteristic SLR of TiN and Au Nanodisk Arrays
A custom microscopy setup was used to provide bottom-up plane wave illumination to measure the mixed mode of local plasmon vibrations and the diffracted grazing wave in resonance with the incoming light. The schematic of the custom transmission microspectroscopy setup is shown in Figure 6. The arrays were visualized through the microscope’s imaging arm, which incorporated a monochromatic CMOS camera. Additionally, the spectral resolution of the arrays was achieved using an imaging spectrometer coupled with an Andor iVac.
In this study, aqueous glycerol solutions at different concentrations (1.0, 3.0, 5.0, 10.0, 20.0, 30.0, 40.0, 50.0, and 60.0 wt.% in DI water) were used to demonstrate the detection sensitivity of LSPR. With the elevation in the glycerol concentration, the refractive index proportionately increased. The Brix refractive index (n) results for each prepared medium were calculated as 1.3335, 1.3350, 1.3396, 1.3473, 1.3607, 1.3713, 1.3845, 1.3956, and 1.4069, respectively. The normalized transmission spectra of the TiN and Au nanodisk arrays are shown in Figure 7 and Figure 8, with periodicities of 500 nm, 550 nm, and 600 nm in response to changes in the refractive index of the surrounding medium. Through the precise arrangement of nanoparticles in a periodic array with an appropriate morphology and dimensions, the scattered field of one nanoparticle can serve as the driving force for the resonance condition of another, resulting in a diffractive interaction among the nanoparticles [5].
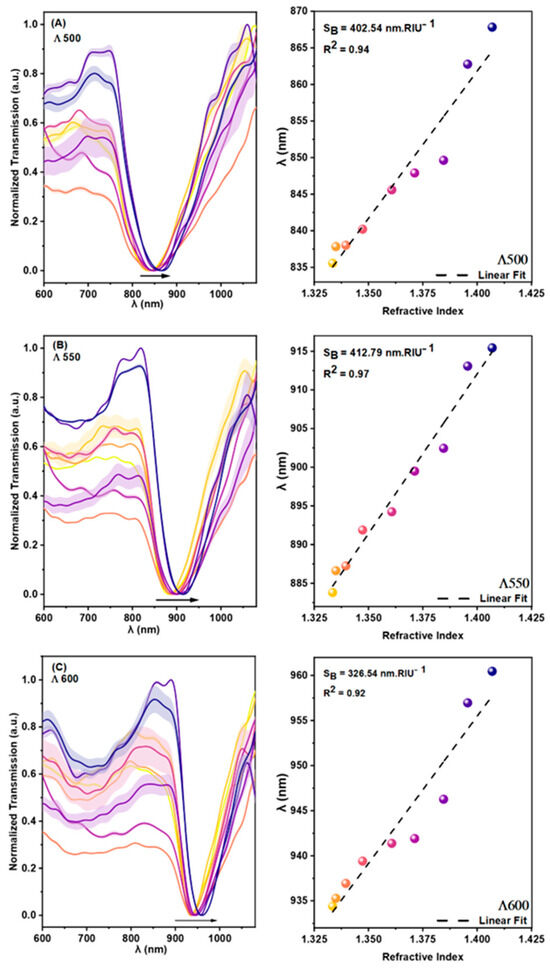
Figure 7.
The normalized transmission spectrums of TiN nanodisk arrays with periods (Λ) of (A) 500 nm, (B) 550 nm, and (C) 600 nm in different glycerol mediums. The refractive index sensitivity of plasmonic TiN nanoarrays with periods of 500 nm, 550 nm, and 600 nm for the varying refractive indices of glycerol. The sensitivity was calculated from the slope of the linear fit according to the plasmonic center wavelength vs. refractive index. The shaded region of each line denotes the error bars of spectral measurements over 5 identically produced 200 μm × 200 μm nanodisk arrays.
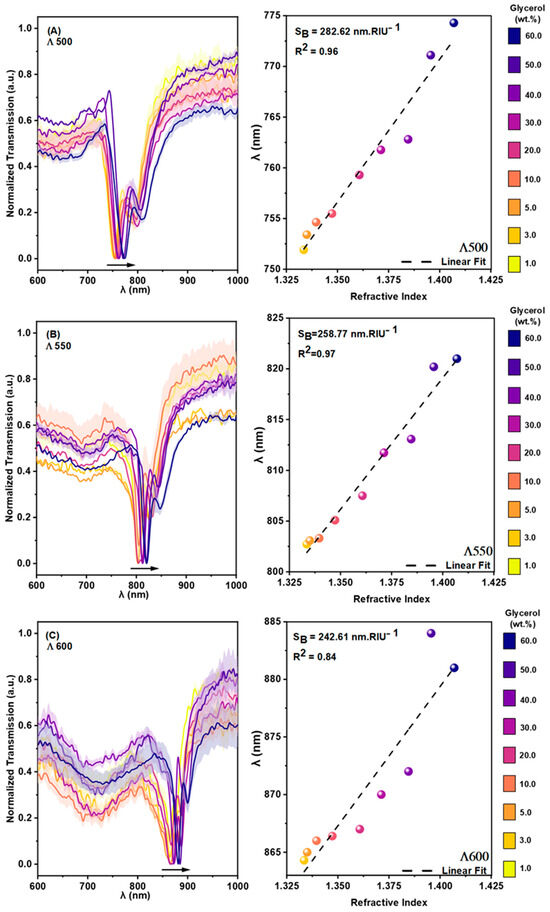
Figure 8.
The normalized transmission spectrums of Au nanodisk arrays with periods (Λ) of (A) 500 nm, (B) 550 nm, and (C) 600 nm in different glycerol mediums. The refractive index sensitivity of plasmonic Au nanodisk arrays with periods of 500 nm, 550 nm, and 600 nm for the varying refractive indices of glycerol. The sensitivity was calculated from the slope of the linear fit according to the plasmonic center wavelength vs. refractive index. The shaded region of each line denotes the error bars of spectral measurements over 5 identically produced 200 μm × 200 μm nanodisk arrays.
Negative ε′ values are crucial for the surface plasmon, and the ε″ value of TiN typically exceeds that of Au, although it may demonstrate minimal optical losses at specific wavelengths, as shown in Figure 2. The stability of TiN, particularly across an extensive wavelength spectrum (Vis-NIR), enhances its applicability in plasmonic materials. The examination of optical transmission sensitivity (Figure 7 and Figure 8) verifies that TiN responds to variations in refractive index with a greater accuracy than Au and serves as a more efficient detection material in biosensors. The adjustable sensitivity coefficients at various periods demonstrate that this material is applicable over a broad spectrum. The analysis of the data reveals that for TiN and Au nanodisk arrays, an increase in the refractive index of the medium results in a shift towards the right of the center wavelength towards the NIR region in each period [16]. In the TiN nanodisk array, at a period of 500 nm, the center wavelength was 835 nm in the lowest refractive index medium (1.0 wt.% glycerol), whereas in the medium with 60.0 wt.% glycerol, the center shifted to 868 nm. The TiN nanodisk arrays exhibit a high level of sensitivity at a period of 550 nm, with the plasmonic center shifting from 883 nm (1.0 wt.% glycerol) to 915 nm (60.0 wt.% glycerol). A comparable center shift trend is also observed in the Au nanodisk array. In a 60.0 wt.% glycerol environment, the center wavelength was 774 nm with a period of 500 nm; however, as the period increased, the center shifted to the NIR region, reaching 883 nm with a period of 600 nm. The higher sensitivity in various glycerol mediums is 412.79 nm·RIU−1 for the TiN nanodisk with a period of 550 nm, as indicated by the bulk refractive index (SB) values, depending upon the medium. The Au nanodisk arrays with a 500 nm period exhibit optimal sensitivity at 282.62 nm·RIU−1. For both materials, there is no proportional enhancement in the sensitivity value with the period because of the CDA [5].
Owing to the high FWHM values in LSPR graphs, an effective method to enhance the quality of LPRs is to employ radiative far-field coupling in regular nanoparticle arrays via their scattered radiation fields [3]. Figure 9 shows that the plasmon resonance width narrows as the distance between the particles, or the period, increases [38]. For the Au nanodisk arrays, the density dip is at a resonance wavelength of 771.11 nm for a period of 500 nm, with an FWHM of 18 nm, ignoring the broad base when defining the width of each dip. As the nanodisks are separated from each other, we see that the FWHM values of the dips narrow as the period increases. For a 600 nm period, the FWHM value narrows dramatically to 12.89 nm and redshifts in the plasmon lineshape to an 880 nm resonance wavelength as the particle separation increases. The same trend was observed in the TiN nanodisk arrays. While the dip width is 211.83 nm at an 860 nm resonance wavelength for a period of 500 nm, as the nanodisks are separated, the coupling between the LSP resonance and the diffraction lattice increases, resulting in the dip width decreasing to 60.11 nm at a 930 nm resonance wavelength for a 600 nm period.

Figure 9.
The representation of the FWHM values with the arrow at 600 nm lattice spacing for Au and TiN nanodisk arrays in the wavelength vs. normalized transmission graphs. Calculations of the surface lattice resonance (QSLR) quality factor for each period of the Au and TiN nanodisk arrays.
The quality factor of resonance, Q, which is fundamentally associated with the ratio of energy stored to energy dissipated by an oscillator, can be calculated as Q = λ/FWHM (where λ represents the resonance wavelength and FWHM denotes the width of the resonance) and increases as the distance between the nanodisk arrays increases [39]. The QLSPR value derived from ellipsometer measurements was approximately one for TiN. However, following the SLR coupling effect, the quality factor exceeds 10. Q is solely determined by the dielectric function of the metal at the plasmon frequency, and Q values of approximately 10−20 are commonly observed for most LSPRs [1,5].
4. Discussion
This study improves the Q of plasmonic TiN to achieve higher Q values and to compare the plasmonic properties of TiN with its Au counterpart. Firstly, plasmonic TiN thin film was obtained using the RF magnetron sputtering method to fabricate TiN nanodisk arrays. XRD, Raman, and ellipsometry analyses revealed the structural and optical properties of the film. Then, the EBL method was selected for the fabrication of TiN and Au nanodisk arrays with different lattice spacing (Λ) since the irregular arrangement of the array structures often causes significant disorder, leading to an increased broadening of the resonance peaks. Nanofabrication methods such as EBL enable the fabrication of metal nanoparticle arrays with regular periodicity and controlled dimensions. The SLR properties of the fabricated nanodisk arrays were compared with the properties of Au. Furthermore, an examination of the TiN versus Au nanodisk array results indicates that TiN is a more appropriate material for applications in the NIR region. The transmission graphs indicate that as the lattice spacing between the particles, or the period, increases, the plasmon resonance linewidth becomes narrower. The findings suggested that an increase in the lattice period diminishes damping effects and enhances the hybridization between localized plasmon resonances and diffracted grazing waves, predicted by the CDA. Nevertheless, as the maximum period analyzed was 600 nm, sharp resonances were not detected for the TiN nanodisk arrays. Upon examining the Au NDA, it is evident that beyond 550 nm, the FWHM values diminish to below about 15 nm. The QLSPR value derived from ellipsometer measurements was approximately one for TiN. However, following the SLR coupling effect, the Q exceeds 10 for TiN nanodisk arrays. The current study is significant in that it assesses the SLR behaviors of TiN and Au nanodisk arrays following varying lattice spacing and indices. TiN outperformed Au in refractometric sensitivity, achieving 412.79 nm·RIU−1 in the NIR region, highlighting its potential as a cost-effective and stable alternative for biosensing and photonic device applications.
Author Contributions
Conceptualization: H.K. and M.Y. Experiments: B.N.G. and S.Ç. Analysis: B.N.G., S.Ç. and H.K. Visualization: H.K. and B.N.G. Funding acquisition: M.Y. and H.K. Project administration: M.Y. and H.K. Supervision: M.Y. and H.K. Writing—original draft: B.N.G. Writing—review and editing: H.K. and M.Y. All authors have read and agreed to the published version of the manuscript.
Funding
This research was financially supported by the Scientific and Technological Research Council of Turkey (TUBITAK) 1001 (Project Number: 120F165).
Institutional Review Board Statement
Not applicable.
Informed Consent Statement
Not applicable.
Data Availability Statement
The raw data supporting the conclusions of this article will be made available by the authors upon request.
Acknowledgments
HK would like to acknowledge the support of the EU Horizon Europe Marie Skłodowska-Curie fellowship (Ref: 101111321) and UKRI MSCA fellowship (EP/Y030273/1).
Conflicts of Interest
The authors declare no conflicts of interest.
References
- Pandey, S.; Baburaj, N.; Joseph, S.; Joseph, J. Resonant optical modes in periodic nanostructures. ISSS J. Micro Smart Syst. 2022, 11, 113–137. [Google Scholar] [CrossRef]
- Cherqui, C.; Bourgeois, M.R.; Wang, D.; Schatz, G.C. Plasmonic Surface Lattice Resonances: Theory and Computation. Acc. Chem. Res. 2019, 52, 2548–2558. [Google Scholar] [CrossRef] [PubMed]
- Kravets, V.G.; Schedin, F.; Grigorenko, A.N. Extremely Narrow Plasmon Resonances Based on Diffraction Coupling of Localized Plasmons in Arrays of Metallic Nanoparticles. Phys. Rev. Lett. 2008, 101, 087403. [Google Scholar] [CrossRef] [PubMed]
- Kurt, H.; Pishva, P.; Pehlivan, Z.S.; Arsoy, E.G.; Saleem, Q.; Bayazıt, M.K.; Yüce, M. Nanoplasmonic biosensors: Theory, structure, design, and review of recent applications. Anal. Chim. Acta 2021, 1185, 338842. [Google Scholar] [CrossRef] [PubMed]
- Kravets, V.G.; Kabashin, A.V.; Barnes, W.L.; Grigorenko, A.N. Plasmonic Surface Lattice Resonances: A Review of Properties and Applications. Chem. Rev. 2018, 118, 5912–5951. [Google Scholar] [CrossRef] [PubMed]
- Yu, L.; Ji, F.; Guo, T.; Yan, Z.; Huang, Z.; Deng, J.; Tang, C. Ultraviolet thermally tunable silicon magnetic plasmon induced transparency. Opt. Commun. 2025, 575, 131312. [Google Scholar] [CrossRef]
- Hasegawa, M.; Watanabe, K.; Namigata, H.; Welling, T.A.J.; Suga, K.; Nagao, D. Surface lattice resonance in three-dimensional plasmonic arrays fabricated via self-assembly of silica-coated gold nanoparticles. J. Colloid Interface Sci. 2023, 633, 226–232. [Google Scholar] [CrossRef]
- Günaydın, B.N.; Çetinkaya, A.O.; Torabfam, M.; Tütüncüoğlu, A.; Kayalan, C.I.; Bayazıt, M.K.; Yüce, M.; Kurt, H. Plasmonic group IVB transition metal nitrides: Fabrication methods and applications in biosensing, photovoltaics and photocatalysis. Adv. Colloid Interface Sci. 2024, 333, 103298. [Google Scholar] [CrossRef] [PubMed]
- Naik, G.V.; Shalaev, V.M.; Boltasseva, A. Alternative Plasmonic Materials: Beyond Gold and Silver. Adv. Mater. 2013, 25, 3264–3294. [Google Scholar] [CrossRef]
- Wang, P.; Krasavin, A.V.; Liu, L.; Jiang, Y.; Li, Z.; Guo, X.; Tong, L.; Zayats, A.V. Molecular Plasmonics with Metamaterials. Chem. Rev. 2022, 122, 15031–15081. [Google Scholar] [CrossRef] [PubMed]
- Khabbaz Abkenar, S.; Tufani, A.; Ozaydin Ince, G.; Kurt, H.; Turak, A.; Ow-Yang, C.W. Transfer printing gold nanoparticle arrays by tuning the surface hydrophilicity of thermo-responsive poly N-isopropylacrylamide (pNIPAAm). Nanoscale 2017, 9, 2969–2973. [Google Scholar] [CrossRef] [PubMed]
- Han, W.; Reiter, S.; Schlipf, J.; Mai, C.; Spirito, D.; Jose, J.; Wenger, C.; Fischer, I.A. Strongly enhanced sensitivities of CMOS compatible plasmonic titanium nitride nanohole arrays for refractive index sensing under oblique incidence. Opt. Express 2023, 31, 17389. [Google Scholar] [CrossRef] [PubMed]
- Günaydın, B.N.; Hız, D.; Cankurtaran, S.E.; Gülmez, M.; Yüce, M.; Kurt, H. Plasmonic (Ti/Hf)N vs. Au nanodisk arrays: A comparative study of refractometric sensitivity. In Optical Sensing and Detection VIII; Berghmans, F., Zergioti, I., Eds.; SPIE: Bellingham, WA, USA, 2024; Volume 12999, p. 29. [Google Scholar] [CrossRef]
- Tütüncüoğlu, A.; Yüce, M.; Kurt, H. Titanium Nitride as an Alternative Plasmonic Material for Plasmonic Enhancement in Organic Photovoltaics. Crystals 2024, 14, 828. [Google Scholar] [CrossRef]
- Kurt, H.; Ow-Yang, C.W. Impedance spectroscopy analysis of the photophysical dynamics due to the nanostructuring of anode interlayers in organic photovoltaics. Phys. Status Solidi A 2016, 213, 3165–3177. [Google Scholar] [CrossRef]
- Wan, Y. Modulation of localized surface plasmon resonance of the titanium nitride nanoparticle array based on graphene. Optik 2020, 200, 163420. [Google Scholar] [CrossRef]
- Zakomirnyi, V.I.; Rasskazov, I.L.; Gerasimov, V.S.; Ershov, A.E.; Polyutov, S.P.; Karpov, S.V. Refractory titanium nitride two-dimensional structures with extremely narrow surface lattice resonances at telecommunication wavelengths. Appl. Phys. Lett. 2017, 111, 123107. [Google Scholar] [CrossRef]
- Patsalas, P.; Kalfagiannis, N.; Kassavetis, S. Optical Properties and Plasmonic Performance of Titanium Nitride. Materials 2015, 8, 3128–3154. [Google Scholar] [CrossRef]
- Patsalas, P.; Kalfagiannis, N.; Kassavetis, S.; Abadias, G.; Bellas, D.; Lekka, C.; Lidorikis, E. Conductive nitrides: Growth principles, optical and electronic properties, and their perspectives in photonics and plasmonics. Mater. Sci. Eng. R Rep. 2018, 123, 1–55. [Google Scholar] [CrossRef]
- Naik, G.V.; Schroeder, J.L.; Ni, X.; Kildishev, A.V.; Sands, T.D.; Boltasseva, A. Titanium nitride as a plasmonic material for visible and near-infrared wavelengths. Opt. Mater. Express 2012, 2, 478–489. [Google Scholar] [CrossRef]
- Shabani, A.; Roknabadi, M.R.; Behdani, M.; Nezhad, M.K.; Rahmani, N. Extraordinary optical transmission of periodic array of subwavelength holes within titanium nitride thin film. J. Nanophotonics 2017, 11, 036006. [Google Scholar] [CrossRef]
- Baturina, O.A.; Epshteyn, A.; Simpkins, B.S.; Bhattarai, N.; Brintlinger, T.H.; Santiago, E.Y.; Govorov, A.O. Comparing Photoelectrochemical Methanol Oxidation Mechanisms for Gold versus Titanium Nitride Nanoparticles Dispersed in TiO2 Matrix. J. Electrochem. Soc. 2019, 166, H485–H4893. [Google Scholar] [CrossRef]
- Cortie, M.B.; Giddings, J.; Dowd, A. Optical properties and plasmon resonances of titanium nitride nanostructures. Nanotechnology 2010, 21, 115201. [Google Scholar] [CrossRef] [PubMed]
- Reese, T.; Reed, A.N.; Sample, A.D.; Freire-Fernández, F.; Schaller, R.D.; Urbas, A.M.; Odom, T.W. Ultrafast Spectroscopy of Plasmonic Titanium Nitride Nanoparticle Lattices. ACS Photonics 2021, 8, 1556–1561. [Google Scholar] [CrossRef]
- Guler, U.; Zemlyanov, D.; Kim, J.; Wang, Z.; Chandrasekar, R.; Meng, X.; Stach, E.; Kildishev, A.V.; Shalaev, V.M.; Boltasseva, A. Plasmonic Titanium Nitride Nanostructures via Nitridation of Nanopatterned Titanium Dioxide. Adv. Opt. Mater. 2017, 5, 1600717. [Google Scholar] [CrossRef]
- Günaydın, B.N.; Gülmez, M.; Torabfam, M.; Pehlivan, Z.S.; Tütüncüoğlu, A.; Kayalan, C.I.; Saatçioğlu, E.; Bayazıt, M.K.; Yüce, M.; Kurt, H. Plasmonic Titanium Nitride Nanohole Arrays for Refractometric Sensing. ACS Appl. Nano Mater. 2023, 6, 20612–20622. [Google Scholar] [CrossRef]
- Asencios, J.; Moro, R.; Luyo, C.; Talledo, A. High Sensitive Biosensors Based on the Coupling Between Surface Plasmon Polaritons on Titanium Nitride and a Planar Waveguide Mode. Sensors 2020, 20, 1784. [Google Scholar] [CrossRef]
- Sato, R.; Ishii, S.; Nagao, T.; Naito, M.; Takeda, Y. Broadband Plasmon Resonance Enhanced Third-Order Optical Nonlinearity in Refractory Titanium Nitride Nanostructures. ACS Photonics 2018, 5, 3452–3458. [Google Scholar] [CrossRef]
- Gui, L.; Bagheri, S.; Strohfeldt, N.; Hentschel, M.; Zgrabik, C.M.; Metzger, B.; Linnenbank, H.; Hu, E.L.; Giessen, H. Nonlinear Refractory Plasmonics with Titanium Nitride Nanoantennas. Nano Lett. 2016, 16, 5708–5713. [Google Scholar] [CrossRef] [PubMed]
- Chang, C.-W.; Huang, C.-T.; Wu, J.-S.; Song, Z.-H.; Liao, C.-H.; Dang, Q.T.; Lu, Y.-J.; Lee, H.W.H.; Ahn, H.; Gwo, S. Ultrathin Titanium Nitride Epitaxial Structures for Tunable Infrared Plasmonics. J. Phys. Chem. C 2023, 127, 21186–21193. [Google Scholar] [CrossRef]
- Ponon, N.K.; Appleby, D.J.; Arac, E.; King, P.; Ganti, S.; Kwa, K.S.; O’Neill, A. Effect of deposition conditions and post deposition anneal on reactively sputtered titanium nitride thin films. Thin Solid Film. 2015, 578, 31–37. [Google Scholar] [CrossRef]
- Zhang, S.; Yan, F.; Yang, Y.; Yan, M.; Zhang, Y.; Guo, J.; Li, H. Effects of sputtering gas on microstructure and tribological properties of titanium nitride films. Appl. Surf. Sci. 2019, 488, 61–69. [Google Scholar] [CrossRef]
- Mascaretti, L.; Barman, T.; Bricchi, B.R.; Münz, F.; Bassi, A.L.; Kment, Š.; Naldoni, A. Controlling the plasmonic properties of titanium nitride thin films by radiofrequency substrate biasing in magnetron sputtering. Appl. Surf. Sci. 2021, 554, 149543. [Google Scholar] [CrossRef]
- Shah, D.; Reddy, H.; Kinsey, N.; Shalaev, V.M.; Boltasseva, A. Optical Properties of Plasmonic Ultrathin TiN Films. Adv. Opt. Mater. 2017, 5, 1700065. [Google Scholar] [CrossRef]
- Ontoria, A.B.; Vasquez, M.R. Color control of titanium nitride thin films. J. Vac. Sci. Technol. B 2023, 41, 32204. [Google Scholar] [CrossRef]
- Markel, V.A. Divergence of dipole sums and the nature of non-Lorentzian exponentially narrow resonances in one-dimensional periodic arrays of nanospheres. J. Phys. B At. Mol. Opt. Phys. 2005, 38, L115–L121. [Google Scholar] [CrossRef]
- Judek, J.; Wróbel, P.; Michałowski, P.P.; Ożga, M.; Witkowski, B.; Seweryn, A.; Struzik, M.; Jastrzębski, C.; Zberecki, K. Titanium Nitride as a Plasmonic Material from Near-Ultraviolet to Very-Long-Wavelength Infrared Range. Materials 2021, 14, 7095. [Google Scholar] [CrossRef]
- Zou, S.; Janel, N.; Schatz, G.C. Silver nanoparticle array structures that produce remarkably narrow plasmon lineshapes. J. Chem. Phys. 2004, 120, 10871–10875. [Google Scholar] [CrossRef] [PubMed]
- Qi, X.; Pérez, L.A.; Alonso, M.I.; Mihi, A. High Q-Factor Plasmonic Surface Lattice Resonances in Colloidal Nanoparticle Arrays. ACS Appl. Mater. Interfaces 2024, 16, 1259–1267. [Google Scholar] [CrossRef]
Disclaimer/Publisher’s Note: The statements, opinions and data contained in all publications are solely those of the individual author(s) and contributor(s) and not of MDPI and/or the editor(s). MDPI and/or the editor(s) disclaim responsibility for any injury to people or property resulting from any ideas, methods, instructions or products referred to in the content. |
© 2025 by the authors. Licensee MDPI, Basel, Switzerland. This article is an open access article distributed under the terms and conditions of the Creative Commons Attribution (CC BY) license (https://creativecommons.org/licenses/by/4.0/).