Abstract
Large organic molecules and metal complexes are promising candidates for organic electronics, optoelectronics, and spintronics, with interfaces to metals being critical. Clean preparation in ultra-high vacuum (UHV) is ideal, but many systems are fragile and cannot be thermally sublimed. This study details the preparation of thin films of the metallacrown Cu(II)[12-MCCu(II)N(Shi)-4] (short: CuCu4) from the liquid phase using electrospray injection (ESI) and, in particular, liquid injection (LI). Both methods produce films with intact CuCu4 complexes, but they differ in the amount of co-adsorbed solvent molecules. Enhancements using an argon stream perpendicular to the molecular beam significantly reduce these contaminants. An additional effect occurs due to the counterions (HNEt3)2 of CuCu4. They are co-deposited by LI, but not by ESI. The advantages and limitations of the LI method are discussed in detail. The CuCu4 films prepared by different methods were analyzed with infrared (IR) spectroscopy, ultraviolet and X-ray photoelectron spectroscopy (UPS, XPS), and scanning tunneling microscopy (STM). For thicker films, ex situ and in situ prepared CuCu4 films to exhibit similar properties, but for studying interface effects or ultrathin films, in situ preparation is necessary.
1. Introduction
Transition metal (TM) organic complexes exhibit intriguing electronic and magnetic properties, making them excellent candidates for new functional materials [1,2,3,4,5,6,7,8,9,10]. Numerous studies on molecular properties and the interaction of such molecules with a wide variety of surfaces are well described in the literature [11,12,13,14,15]. Analyzing the electronic properties of such molecules and their interaction at interfaces is typically performed under ultra-high vacuum (UHV) conditions [16,17,18]. The most common evaporation technique for molecules in UHV is thermal evaporation. Unfortunately, for complex molecules with partially fragile ligand spheres, defragmentation or unwanted reactions happen before reaching their sublimation temperatures. Therefore, ex situ preparation methods such as spin-coating [19,20], doctor blade techniques [21], or simple drop-casting [22] are often used to characterize the bulk properties of such fragile systems. However, these methods provide limited insight into the electronic states at the molecule–substrate interface because the electronic properties of metal complexes can alter due to environmental influences. Glovebox preparation systems [23] with inert gas atmospheres help mitigate these effects but require additional equipment for sample transfer into UHV, making them cumbersome to handle. To date, the only methods available for transferring molecules directly from solution into the UHV have been the more common electrospray injection technique (ESI) [24] as well as the less common fluid pulse injection (liquid injection, LI) [25]. ESI originally comes from the field of mass spectrometry [26] and is a process in which small amounts of liquid are injected into the UHV after ionization. One advantage of the ESI system is the possibility to select the ion species ionized from the solution before ejecting it onto the sample surface. Additional electrostatic filtering devices and guiding stages are then used in several different setups to analyze various organic/inorganic interfaces [27]. However, most of these ESI systems are very elaborate, difficult to handle, and extremely poor in yield. Sensitive ligand spheres can also be influenced by the action of shear forces from the applied electric field. The LI method started developing in 1997 [25]. By using short-pulse valves, organic molecules dissolved in organic solvents were used directly to prepare ultra-thin organic layers on various substrates in UHV [28,29].
In this study, we present the liquid-based in situ preparation and analysis of thin films of the metallacrown Cu(II)[12-MCCu(II)N(Shi)-4] (short: CuCu4). CuCu4 is a non-evaporable multispin molecule with an odd number of coupled paramagnetic copper centers. The spin ground state is determined by competing superexchange interactions [30,31]. Therefore, the resulting electronic structure of these molecules is very interesting to analyze. For the UHV preparation, ESI as well as LI were utilized. Both systems are based on commercially available basic systems, which are directly coupled to the UHV chamber. For the ESI setup, no selection or deviation elements are used, which means that for both basic systems, LI and ESI, not only the target molecules but also the amounts of solvent molecules enter the sample chamber. Our findings indicate that modifications to the LI setup are necessary to minimize solvent interference with molecular adsorption, even for weakly interacting solvent–substrate systems such as methanol/gold. To address this, we enhanced the LI setup with additional pumping stages, an argon inert gas shower, a focusing tube, and apertures. The results shown in this paper clearly indicate that the modified LI apparatus enables us to reveal the electronic properties of non-interacting layers of CuCu4 as well as typical interface parameters such as the work function of the system CuCu4/Au(111).
2. Materials and Methods
2.1. Materials
CuCu4 was synthesized after the method presented in [30].
Four types of substrates were used:
Single-crystal Au(111) (MaTeck, Jülich, Germany, Czochralski method produced 99.999% purity, <0.1° orientation accuracy, <0.03 µm surface roughness) was cleaned by repeated cycles of Ar+ ion bombardment at 1 kV and subsequent annealing to 500 °C.
Silicon wafers (MicroChemicals GmbH, Ulm, Germany, orientation (100) with native oxide, B-doped, σ = 1–10 Ω) were cleaned by subsequent rinsing in acetone, 2-propanol, and ultrapure water, followed by short Ar-plasma treatment (Pico from Diener electronics, Ebhausen, Germany, Ar, 5 sccm, 50 W).
Single-crystal Cu(001) (MaTeck, Jülich, Germany, Czochralski method, 99.999% purity, <0.1° orientation accuracy, <0.03 µm surface roughness) was cleaned by repeated cycles of Ar+ ion bombardment at 1 kV and subsequent annealing until sputter defects can be neglected.
The HOPG substrate (General Electric Advanced Ceramics, Boston, USA, pyrolytic graphite grade ZYH) was prepared shortly before use using the scotch tape method. After introduction into the UHV, an additional annealing at 120 °C was carried out in UHV to get rid of any adsorbed molecules.
2.2. Methods
2.2.1. Liquid Injection (LI)
Liquid preparation was conducted with a modified ALI-DS001 system from BIHURCRYSTAL S.L., Donostia, Spain.
The original injection head, depicted in Figure 1, forms the core component. The LI process is initiated by introducing the solution through an extended cannula (liquid inlet). Using a pre-vacuum line and a gas inlet dosing unit makes it possible to suspend the liquid phase in an inert gas carrier (argon) directly in front of the electromagnetic short pulse valve. The defined mixing of the liquid phase with argon stabilizes the injection process, and, therefore, the dispersion of the molecules once in the vacuum. The valve has an aperture width of 0.1 mm, an opening/closing response time of up to 160 ms, and a leakage ratio of less than 10−7 mbar·s−1. The quick increase in the pressure after opening/closing the valve, in combination with the pumping speed of the vacuum system, causes the droplet to tear, inducing a virtual leak [32]. The original software manages the parameter control for the pulses, pressure equalization control, and pulse counting.
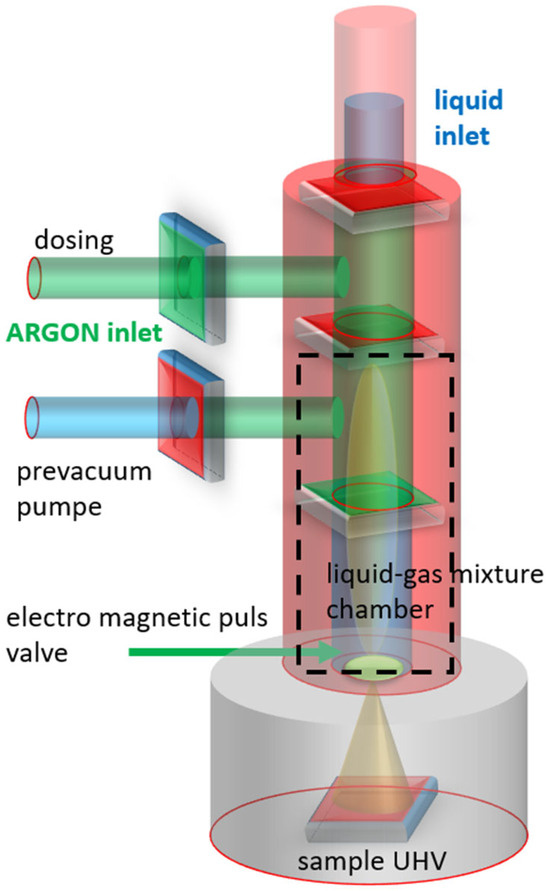
Figure 1.
Schematic representation of the original liquid injection head before modification. For details, see text.
During initial use, it became evident that, despite minimizing pulse times to the lowest possible 3 ms, the solvent’s gas load remained too high. This resulted in extended chamber stabilization times and excessive solvent deposition on the substrate. To reduce solvent content before reaching the UHV region and the substrate, several modifications were implemented, as shown in the updated setup in Figure 2. First, a guiding tube was added, directing flow into an interaction chamber equipped with an additional turbo-pumping stage. Within this chamber, an argon gas stream is introduced perpendicularly to the evaporation cone, creating a vertical pumping channel that enhances the removal of lighter solvent molecules by imparting additional momentum and energy. This helps further reduce the solvent shell surrounding the droplets. Additionally, condensation near the pulse valve caused by adiabatic droplet evaporation at the closed aperture was observed during prolonged operation. To mitigate this, a heating element (35 °C) was installed near the valve aperture. Furthermore, a substrate heater (50 °C) was added to minimize solvent adhesion. The impact of substrate heating was assessed using UPS work function measurements (see Supplementary Materials).
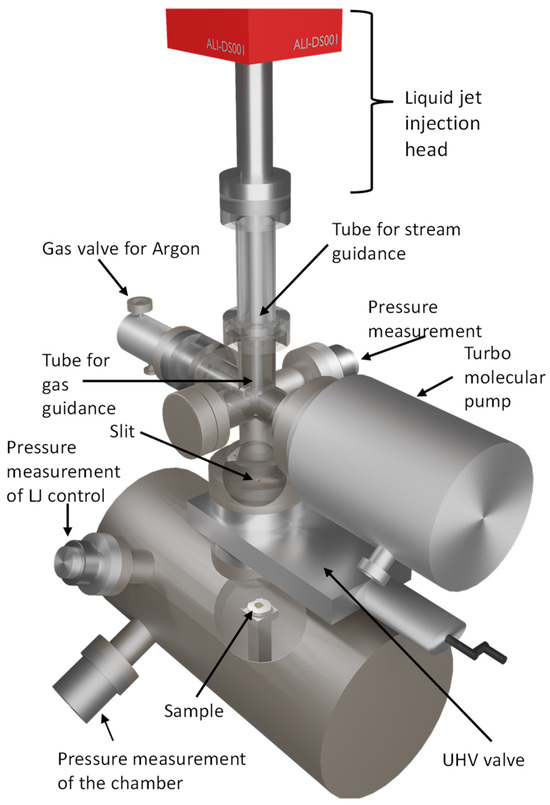
Figure 2.
Schematic representation of the modified vacuum chamber to which the LI (red) was attached [33].
Throughout this paper, we will emphasize that the amount of molecules deposited per pulse varies greatly depending on the valve’s status.
2.2.2. Electrospray Injection (ESI)
Electrospray injection was conducted by a customized setup from MolecularSpray Ltd., Nottingham, UK, in negative mode (−2 kV).
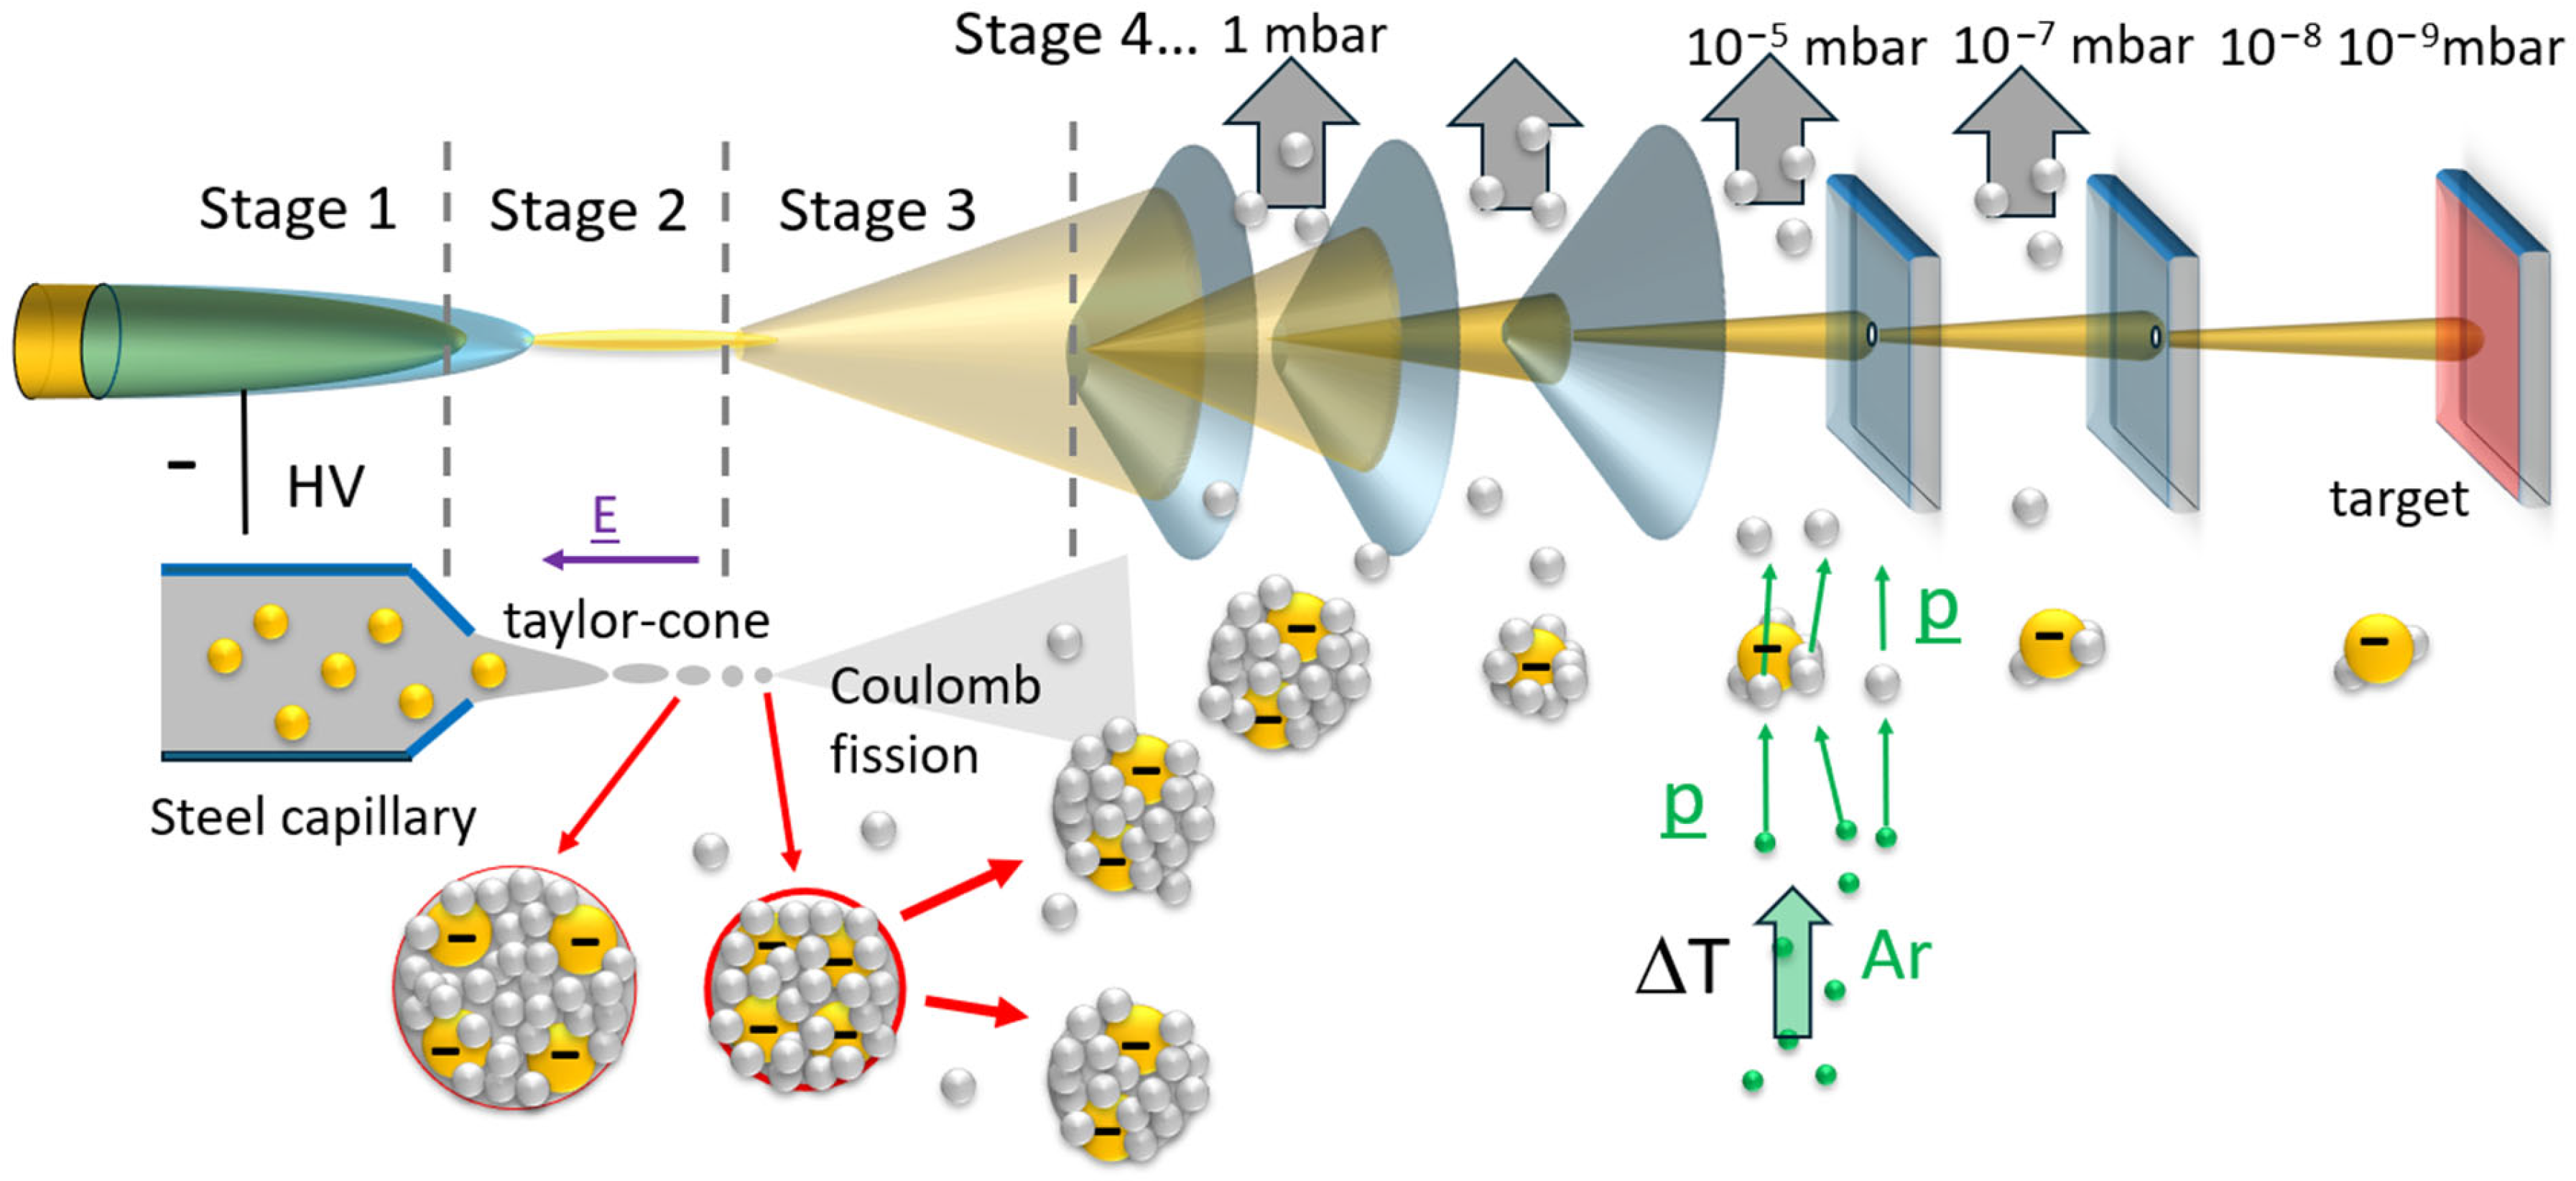
The electrospray injection method enables the deposition of relatively large solvent-based organic molecules onto substrates under ultra-high vacuum (UHV) conditions [24]. The core principle of this technique involves generating gas-phase ions from a solution. The electrospray deposition process consists of four main stages (Figure 3):
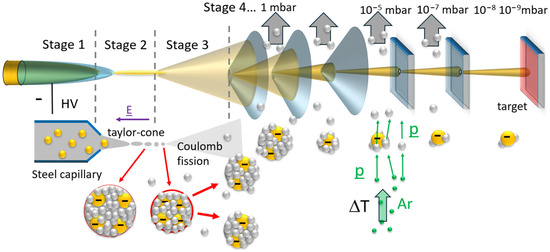
Figure 3.
Schematic representation illustrating the electrospray source with an additional Ar flow. For details, see text.
The first stage of the electrospray apparatus includes a nanoflow capillary steel tip measuring 1–10 µm in diameter. A solution containing molecules passes through this tip at a flow rate exceeding 1 µL/min. Applying a high voltage between the tip and ground causes either positively or, in our case, negatively charged molecules to separate and accumulate at the tip’s end. At stage 2, the electrical field acting on these charged molecules in the solvent creates a cone-shaped liquid at the capillary tip’s end, known as the Taylor cone, from which charged droplets are extracted. In stage 3, the shrinking of droplets and increasing charge density disrupt the balance between surface tension force (resulting from the strong attraction of solvent molecules to each other due to cohesion) and Coulomb repulsion between the equally charged target ions. When Coulomb repulsion surpasses surface tension, the droplet undergoes a process called Coulomb fission which results in a nebulization to much smaller droplets. In stage 4 further removal of solvent molecules occurs, and the beam is focused within the pumping stages. After the first aperture, the ions fly field-free to the substrate. To reduce the kinetic energy gained from acceleration in the electric field, an electric counterfield can be applied at the substrate, decelerating the target molecules. This prevents fragmentation upon impact and enables a soft landing [27].
Since our ESI system lacks additional mass filter units, a solvent load remains. Similar to the LI system, the solvent burden was significantly decreased by incorporating two extra apertures with pumping stages, an argon gas flow perpendicular to the molecular flight path, and an optional sample heating feature.
2.2.3. In Situ Preparation
Cu(II)[12-MCCu(II)N(Shi)-4](HNEt3)2 complexes were dissolved in methanol and then deposited by either electrospray (ESI) or liquid injection (LI) under UHV conditions onto the clean HOPG, Au(111), or Cu(001) single crystal surface kept either at room temperature or, in most cases of LI, at 50 °C.
2.2.4. Ex Situ Preparation
For IR and first XPS characterization, in addition to the UHV-prepared samples, ex situ preparation was also utilized. For drop-casting, the substrate was covered with 100 μL of a 1 mmol CuCu4 solution and then heated at 80 °C for 90 s to evaporate the solvent methanol.
For blade-casting, a 10 μL drop of a 5 mmol CuCu4 solution was brought onto the surface. Subsequently, the solution was homogeneously spread by moving a glass plate edge over the substrate surface. The remaining solvent was blown away by a nitrogen flow.
For spin-coating, the substrate was also covered with solution, kept for 1 min, and then accelerated to 1000 rpm (rate: 300 rpm/s), where it was kept for 30 s, if not otherwise stated. Afterward, the remaining solvent was evaporated at 80 °C for 90 s
2.2.5. Scanning Tunneling Microscopy
STM/STS measurements of CuCu4 on Au(111) and Cu(100) were performed using an RHK Pan-Scan microscope operating with a closed-cycle cryostat, enabling measurements at 9.5 K (on a sample). STM tungsten tips were produced by electrochemical etching, while further in situ annealing and sputtering cycles enabled oxide film removal. The STM images were acquired in constant current mode and then processed by Gwyddion 2.67 open-source SPM analysis software [34].
2.2.6. Infrared Spectroscopy
IR spectra were taken in transmission mode with a Bruker IFS 66v/S spectrometer equipped with an N2-cooled MCT detector (D316/6, InfraRed Associates Inc., Stuart, FL, USA). The sample compartment was evacuated to ensure minimum water and CO2 background signals.
In addition to these ex situ measured samples, measurements of all samples within a UHV chamber were taken. For this, the spectrometer was moved to the UHV chamber so that the sample compartment encloses the chamber. The chamber is equipped with KBr windows. The small slits between these windows and the windows of the spectrometer were purged with dry air.
2.2.7. Photoemission Spectroscopy
Photoemission studies were performed with a hemispherical energy analyzer PHOIBOS 150 (SPECS Surface Nano Analysis GmbH, Berlin, Germany).
For ultraviolet photoelectron spectroscopy, a conventional gas discharge lamp was used with an excitation energy of 21.22 eV for the He I and 40.81 eV for the He II line; the pass energy was set to 20 eV. During photoelectron collection, the chamber pressure was kept at 10−10 mbar, and on the samples, a −6 V bias was applied to ensure accurate determination of the low kinetic energy cut-off. The work function was determined from the secondary electron cut-off in normal emission.
X-ray photoemission was performed with a non-monochromatized Mg Kα source (1253.6 eV) and a pass energy of 50 eV.
3. Results and Discussion
3.1. STM
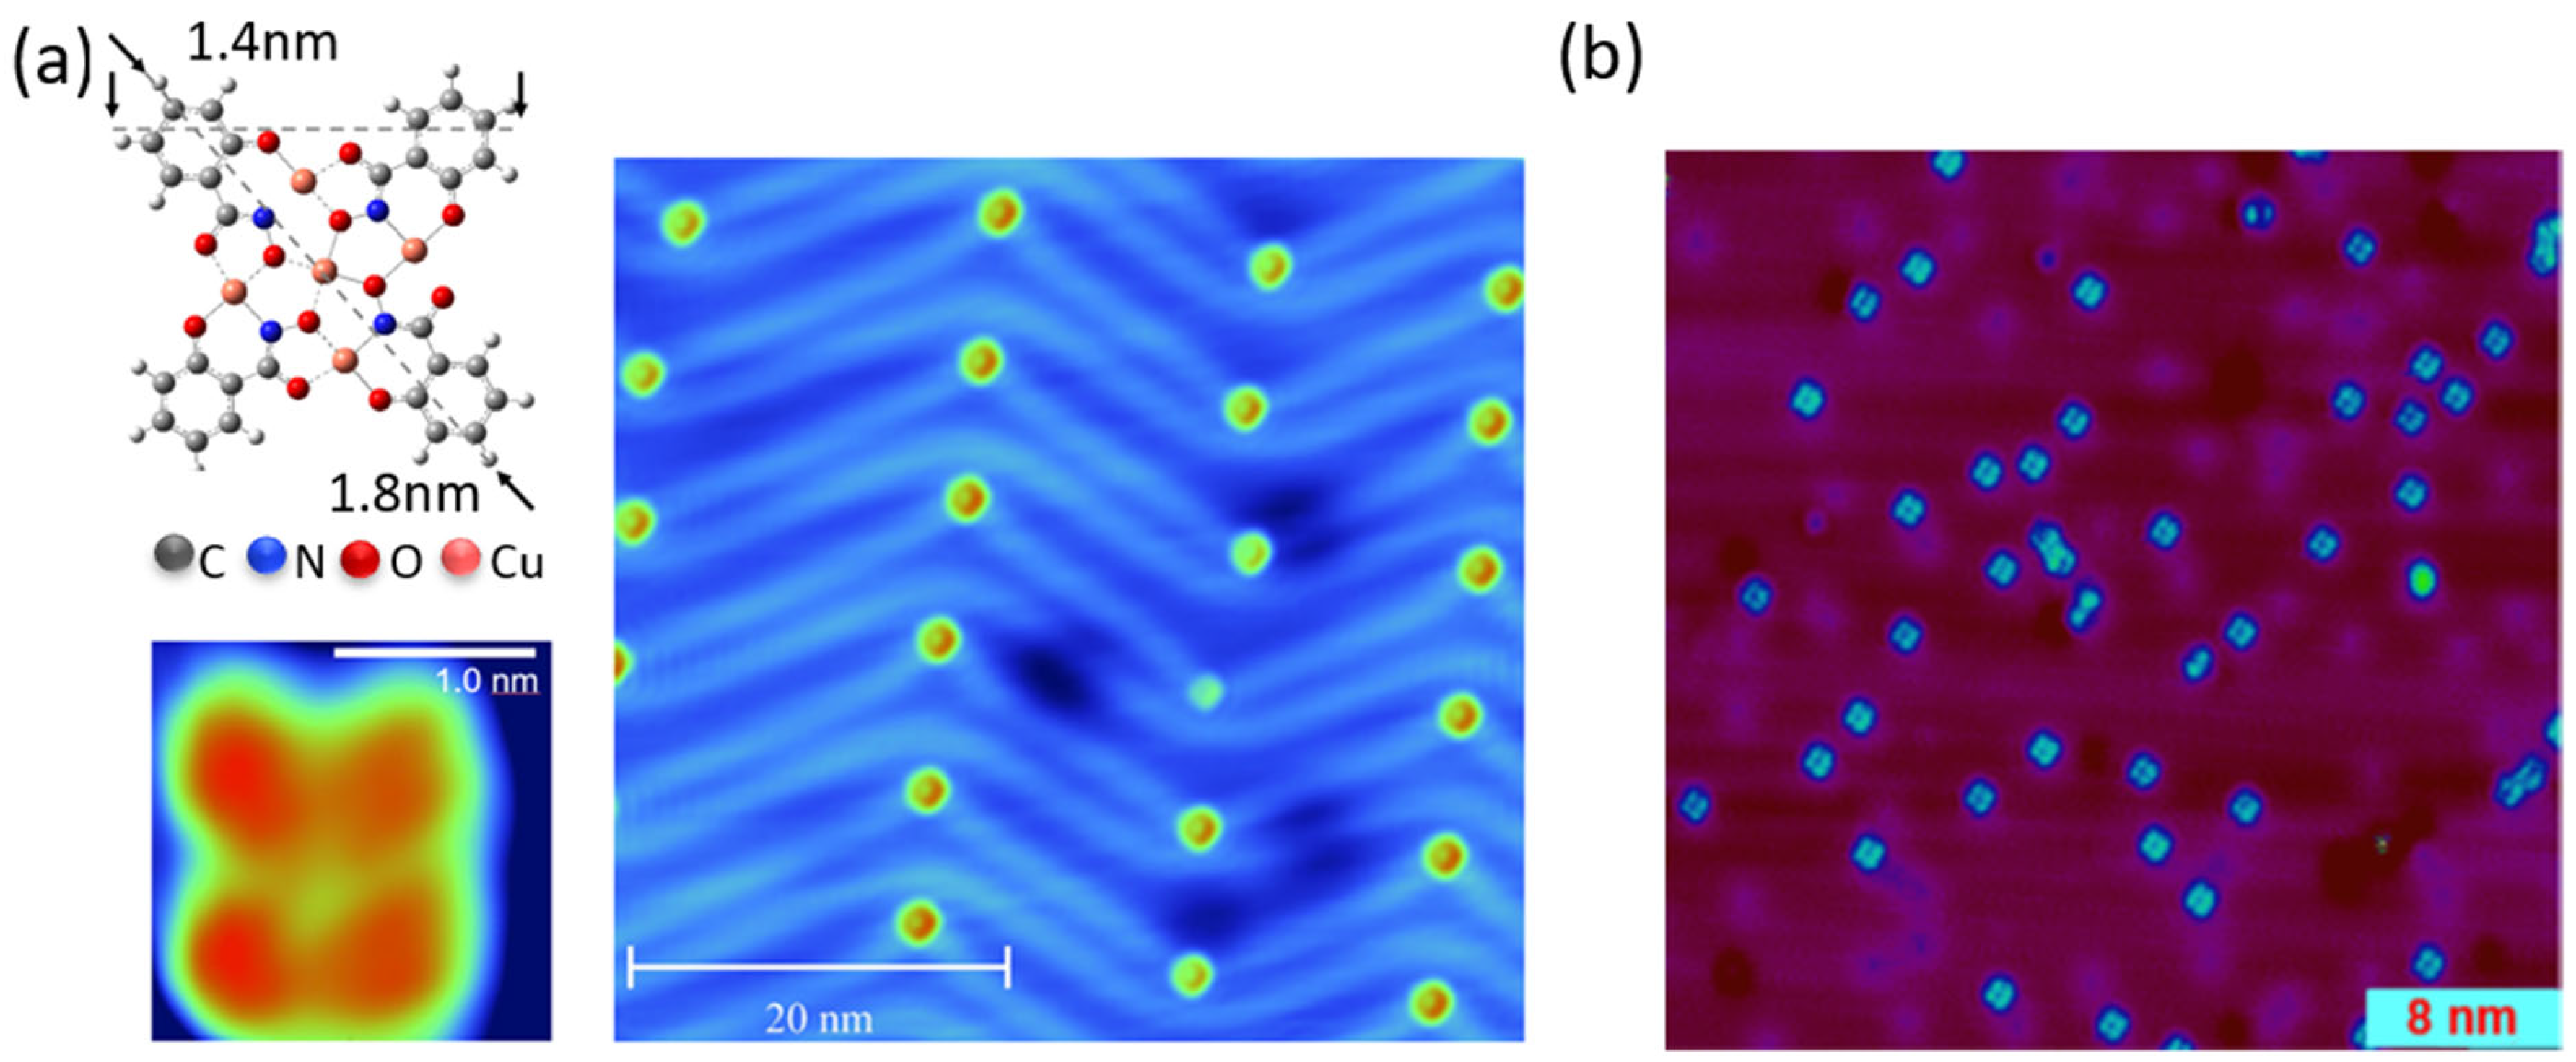
The successful evaporation of CuCu4 onto Au(111) and Cu(100) via electrospray ionization is shown by STM (Figure 4). The four-fold symmetry of the complex was resolved on both substrates. Almost no contaminating solvent molecules are present.

Figure 4.
STM images of CuCu4 electrosprayed onto (a) Au(111) (VT = −3 V; I = 55 pA) and (b) Cu(001) (VT = 1.5 V; I = 50 pA). The substrate temperatures were at room temperature during the deposition and at 9.5 K during the measurements. The image (a) is reprinted with permission from Ref. [35]. Copyright 2023 American Chemical Society.
With LI, we have so far not been able to obtain STM images of comparable quality.
3.2. Comparison of Ex Situ and In Situ Prepared CuCu4 Films
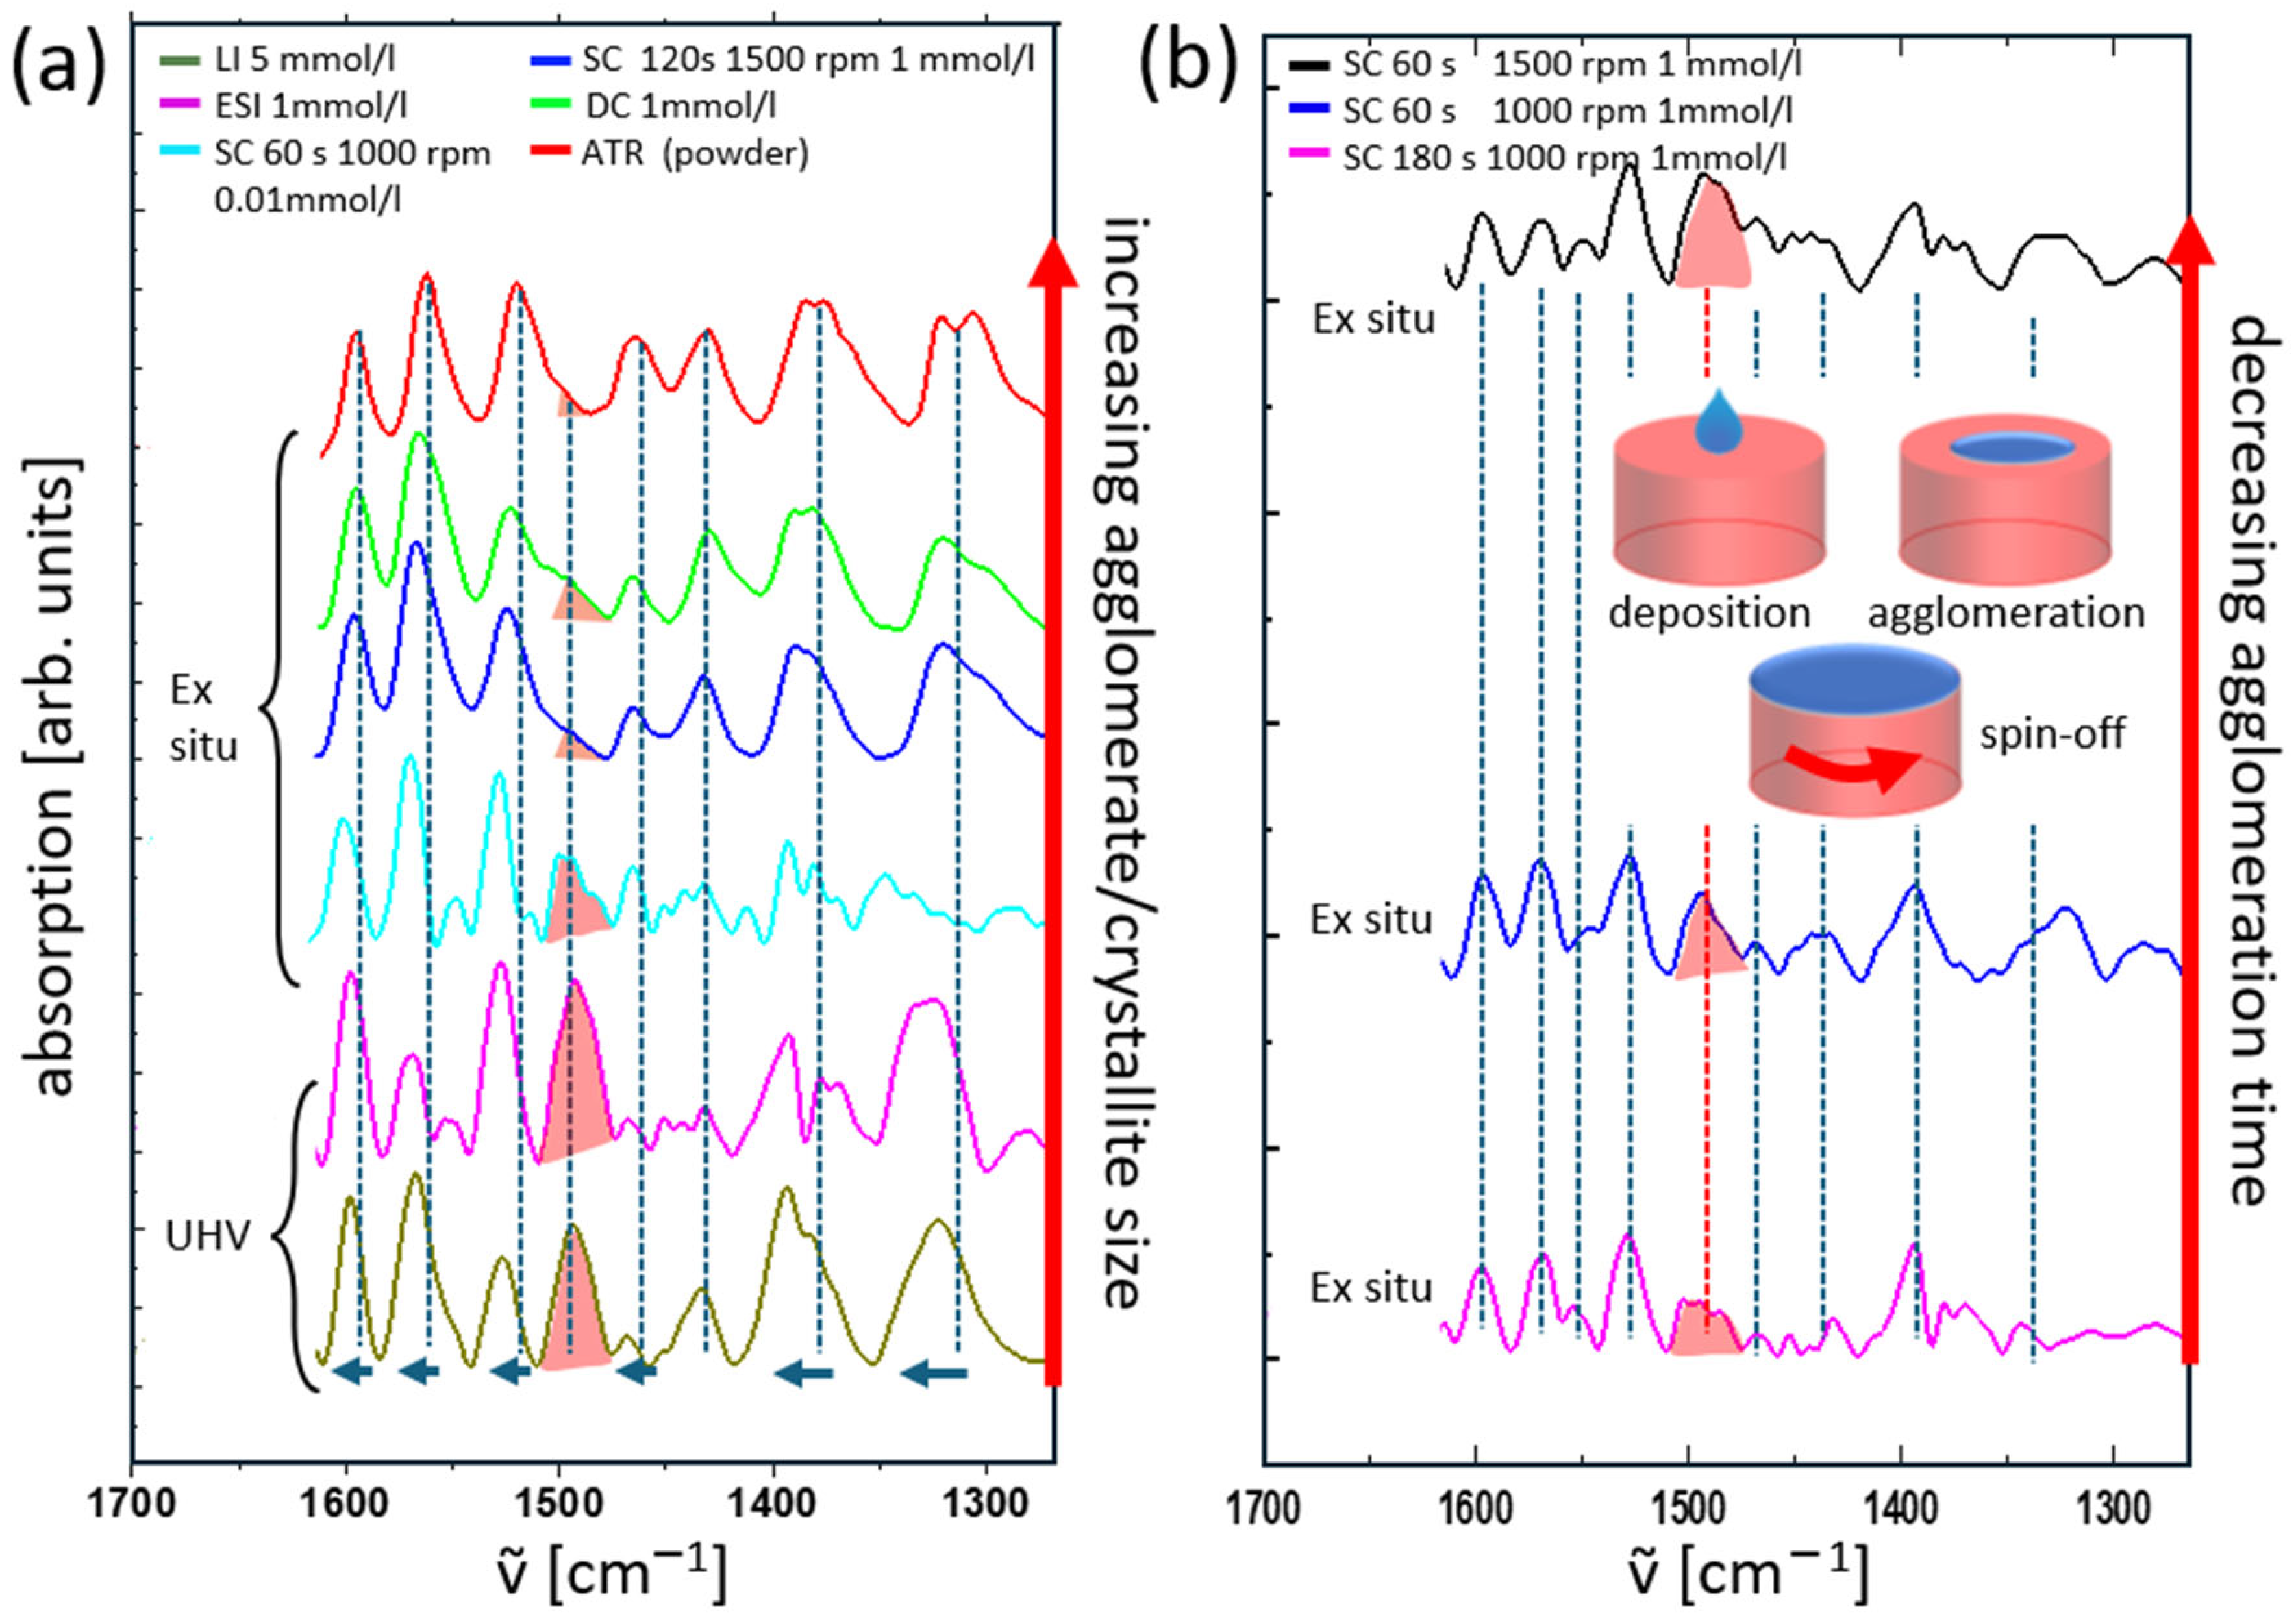
IR spectra were recorded for ex situ and UHV-prepared CuCu4 films on silicon wafers and compared to a bulk powder (ATR) spectrum (Figure 5). This provided an initial reference for assessing the integrity of the CuCu4 complexes after film preparation.
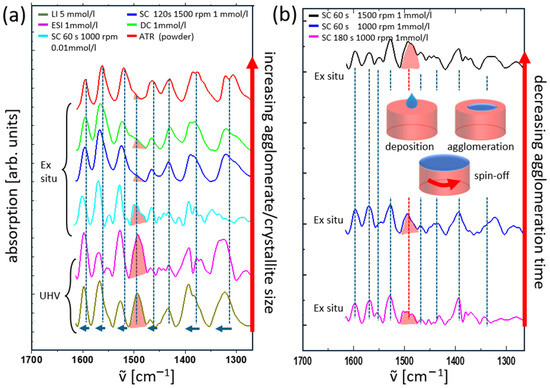
Figure 5.
FT-IR transmission spectra of CuCu4 (on Si-wafer) for ex situ and UHV preparation methods. All measurements were performed ex situ. (a) Direct comparison of the ex situ and UHV-prepared layers with a crystallized powder sample (ATR). The marked peak at 1495 cm−1 is evaluated as an indication of the change in crystallinity. (b) FT-IR spectra of spin-coated layers when varying residence time and spin-off frequency. Increasing residence time Δt or decreasing spin-off frequency leads to the formation of larger agglomerates/crystallites, which manifests in an increase in the peak intensity at 1495 cm−1. For details, see text. Adapted from [36].
The spectra of the ex situ prepared drop-casting (DC) and spin-coating (SC) samples and the in situ prepared ESI and LI samples are plotted alongside the powder spectrum (ATR). Due to the methods and the selected process parameters, the layer thickness increases from the UHV to the ex situ preparation methods. We find congruent patterns in the peak structures for all methods. The pattern structure in the region 1600 cm−1–1255 cm−1 is dominated by the complex forming salicylhydroxamic acid ligand system. All the main peaks in Figure 5a can be assigned not only to the peaks of the powder sample (ATR reference spectra AG Rentschler and [30]) but also to the main frequencies reported for similar metallacrowns in the literature [37,38,39,40,41]. Since significant structural changes would be expected in the event of molecular decomposition, the results confirm that the CuCu4 complexes remain intact across all preparation methods.
For ESI and LI, an additional concern is the potential agglomeration of molecules. This might happen if droplets were still present upon contact with the substrate. For the basic LI system, a drop pattern with significant agglomeration was indeed observed in the literature during the preparation of solvated gold nanoparticles [32]. However, agglomeration would be detrimental to a further characterization of the interfacial properties of CuCu4. For the sample of the ATR spectrum, it could be seen that the metallacrown complex was slowly crystallizing out of the solution. This means that relatively large crystallites can be expected so that the ATR spectrum can be used as a reference spectrum for molecules in a crystalline environment. In drop-casting, the formation of crystallites is also to be expected. However, the growth process is much faster; therefore, the crystals are not as large as in the powder. For the spin-coating method, the rotation speed and the time until the film was spun off were varied (Figure 5b). If more time is allowed for the liquid film to settle before being spun off, larger crystal nuclei can form than if the waiting time is shorter or if the liquid film is spun off immediately. This results in a presumed increase in crystallite size from the bottom to the top of the spectra in Figure 5. An analysis of the IR spectra shows a peak at 1495 cm−1, which is only weakly pronounced for all ex situ preparation methods with relatively thick films, i.e., larger crystallites. The situation is different for the thinner films prepared in UHV using ESI and LI, where a distinct increase in absorption intensity is observed. The change in intensity for the peak at 1495 cm−1 shows that for both UHV methods, homogeneous coverage of the CuCu4 molecules without significant agglomeration is to be expected.
The ESI method is the only method in which, in principle, no counterion should be present in the prepared layer. Therefore, we measured the IR spectra of triethylamine (see Supplementary Materials). In fact, in the region of these vibrations, no large signals are found in the spectrum of the ESI-prepared CuCu4.
In summary, all methods lead to CuCu4 thin films. However, they have different morphologies, and those prepared by ESI lack the counter ions.
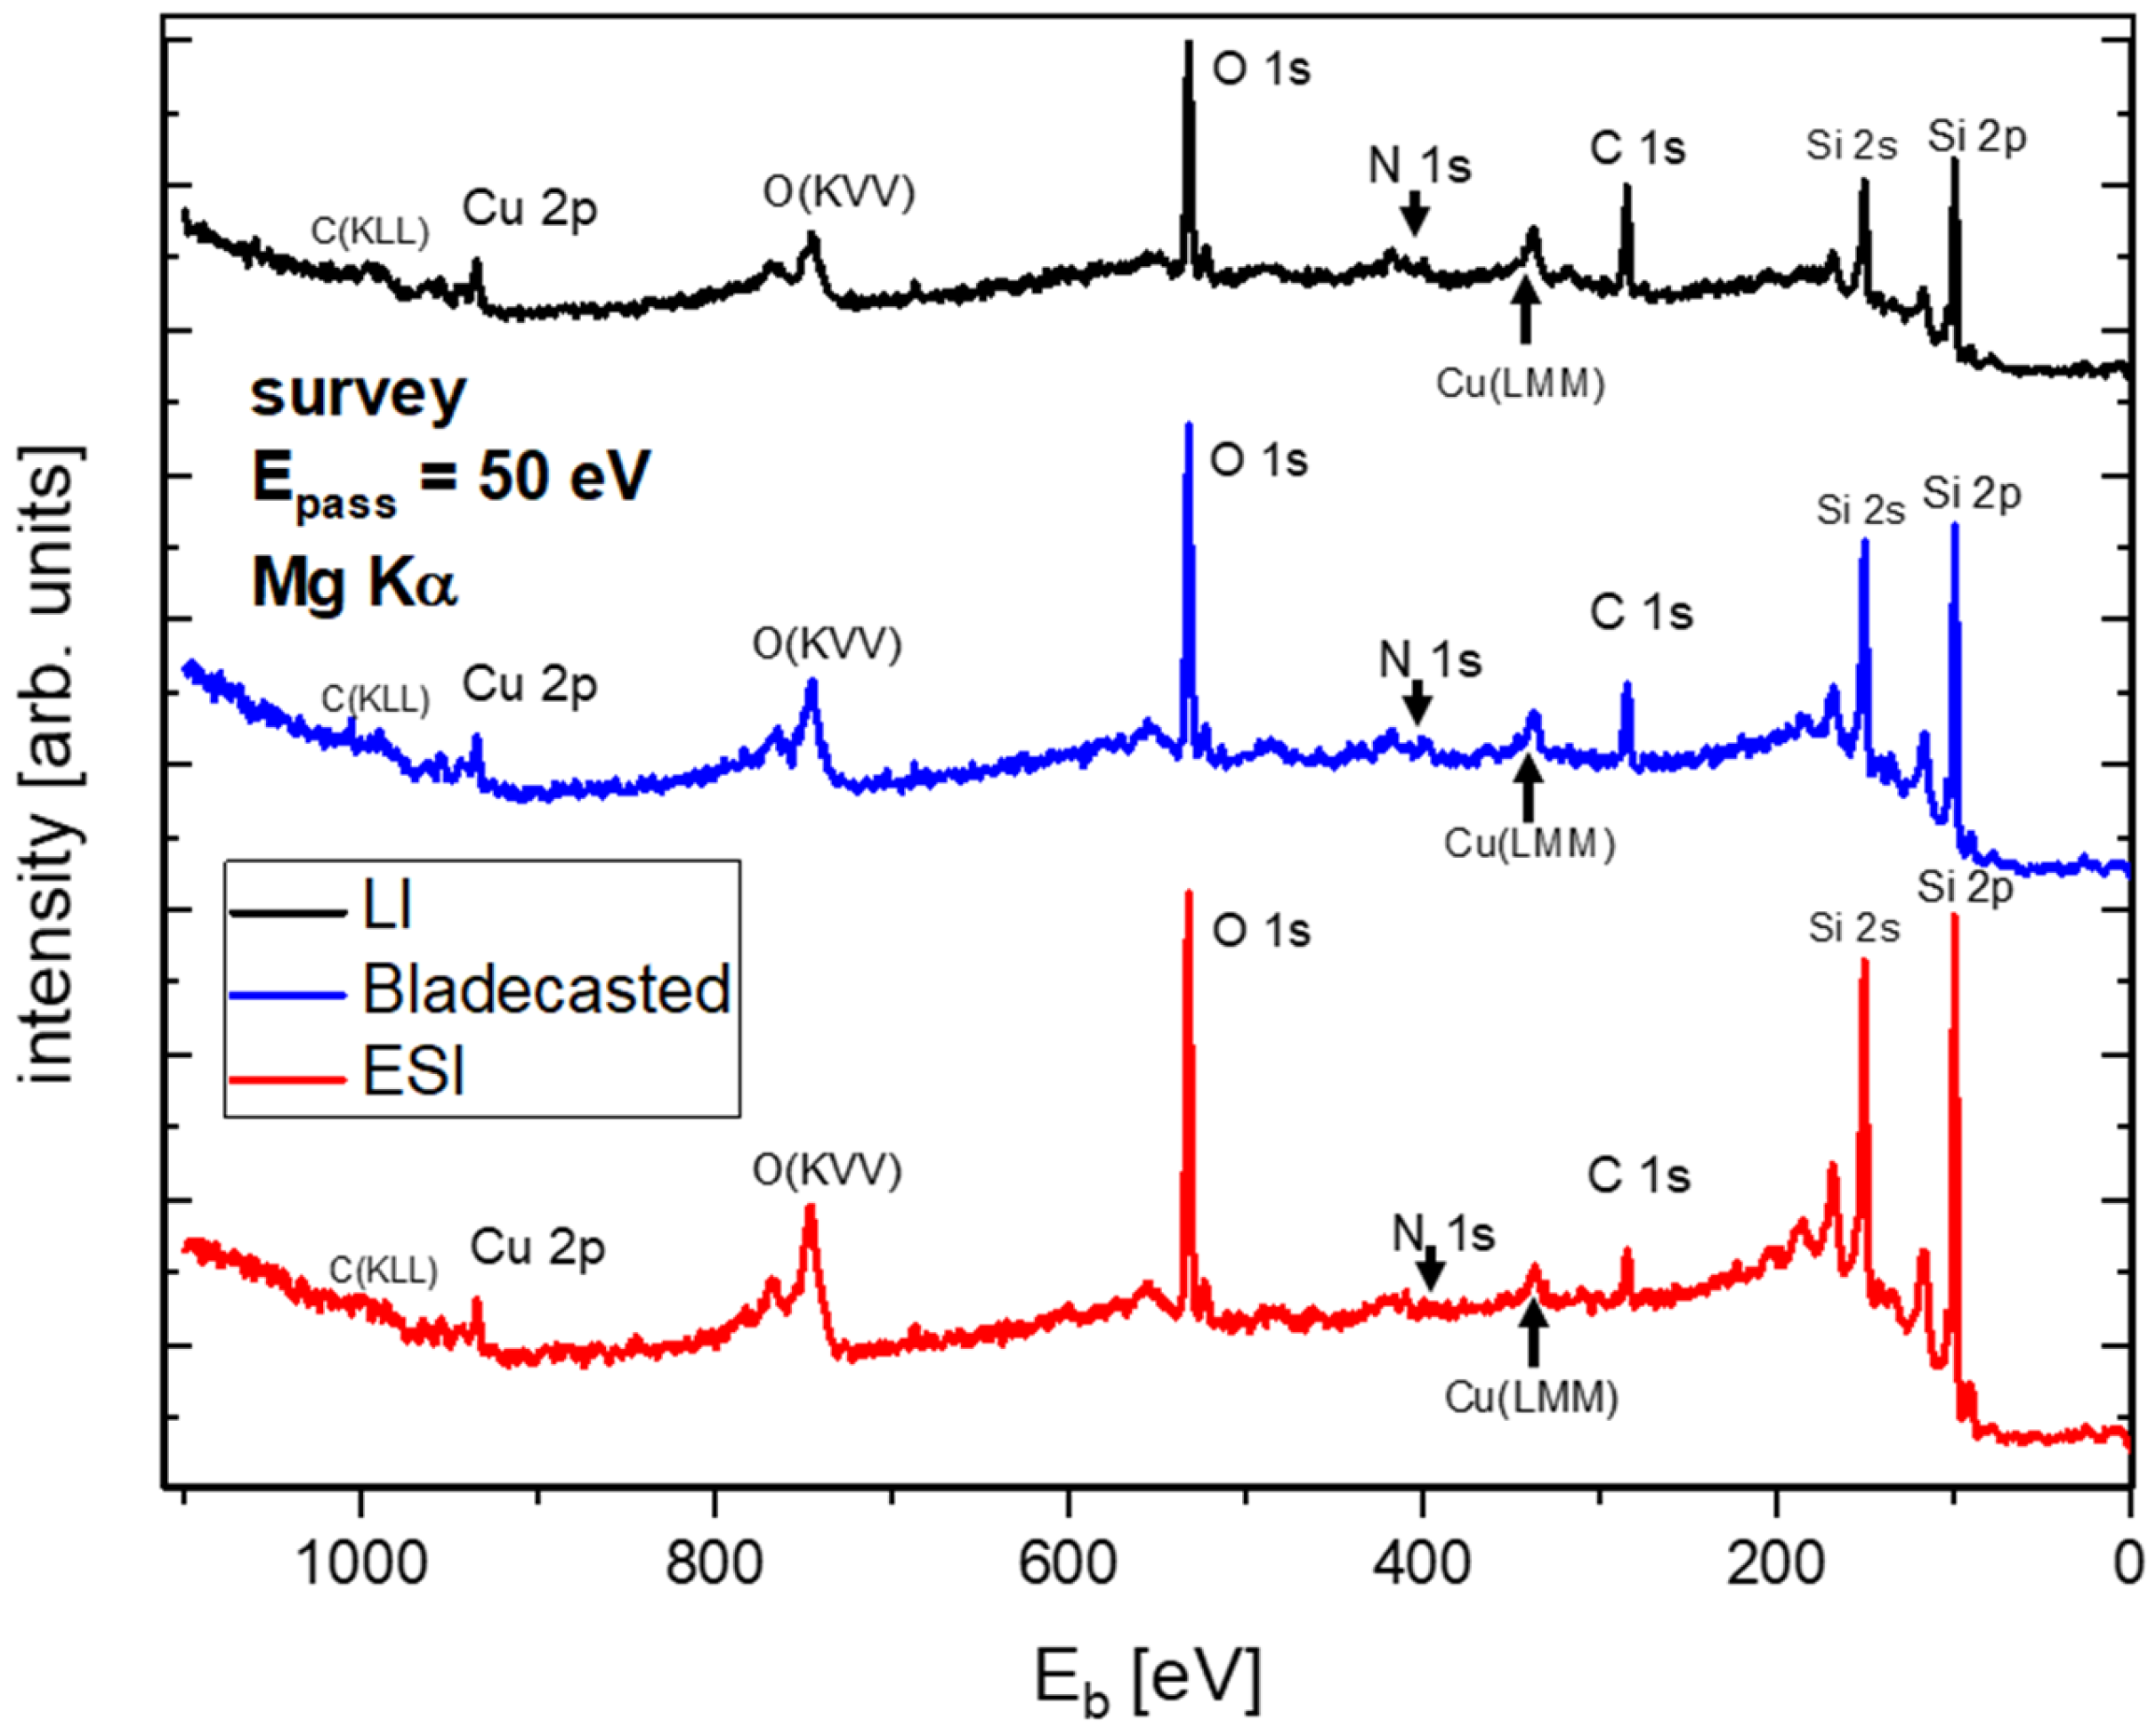
To further support the IR data, X-ray photoemission spectra (XPS) were taken for ex situ and in situ prepared films. Figure 6 shows a comparison of an ex situ blade-casted CuCu4 film and in situ prepared LI and ESI films. The spectra appear similar, with differences primarily in the attenuation of the Si substrate signals, which varies according to film thickness (ESI < blade-casting < LI).
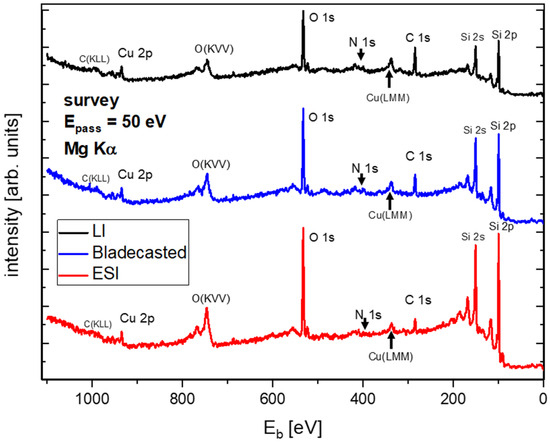
Figure 6.
Survey XPS Mg Kα spectra of CuCu4-MCs on SiO2 (wafer surface); prepared by ex situ blade-casting and in situ LI and ESI deposition [42].
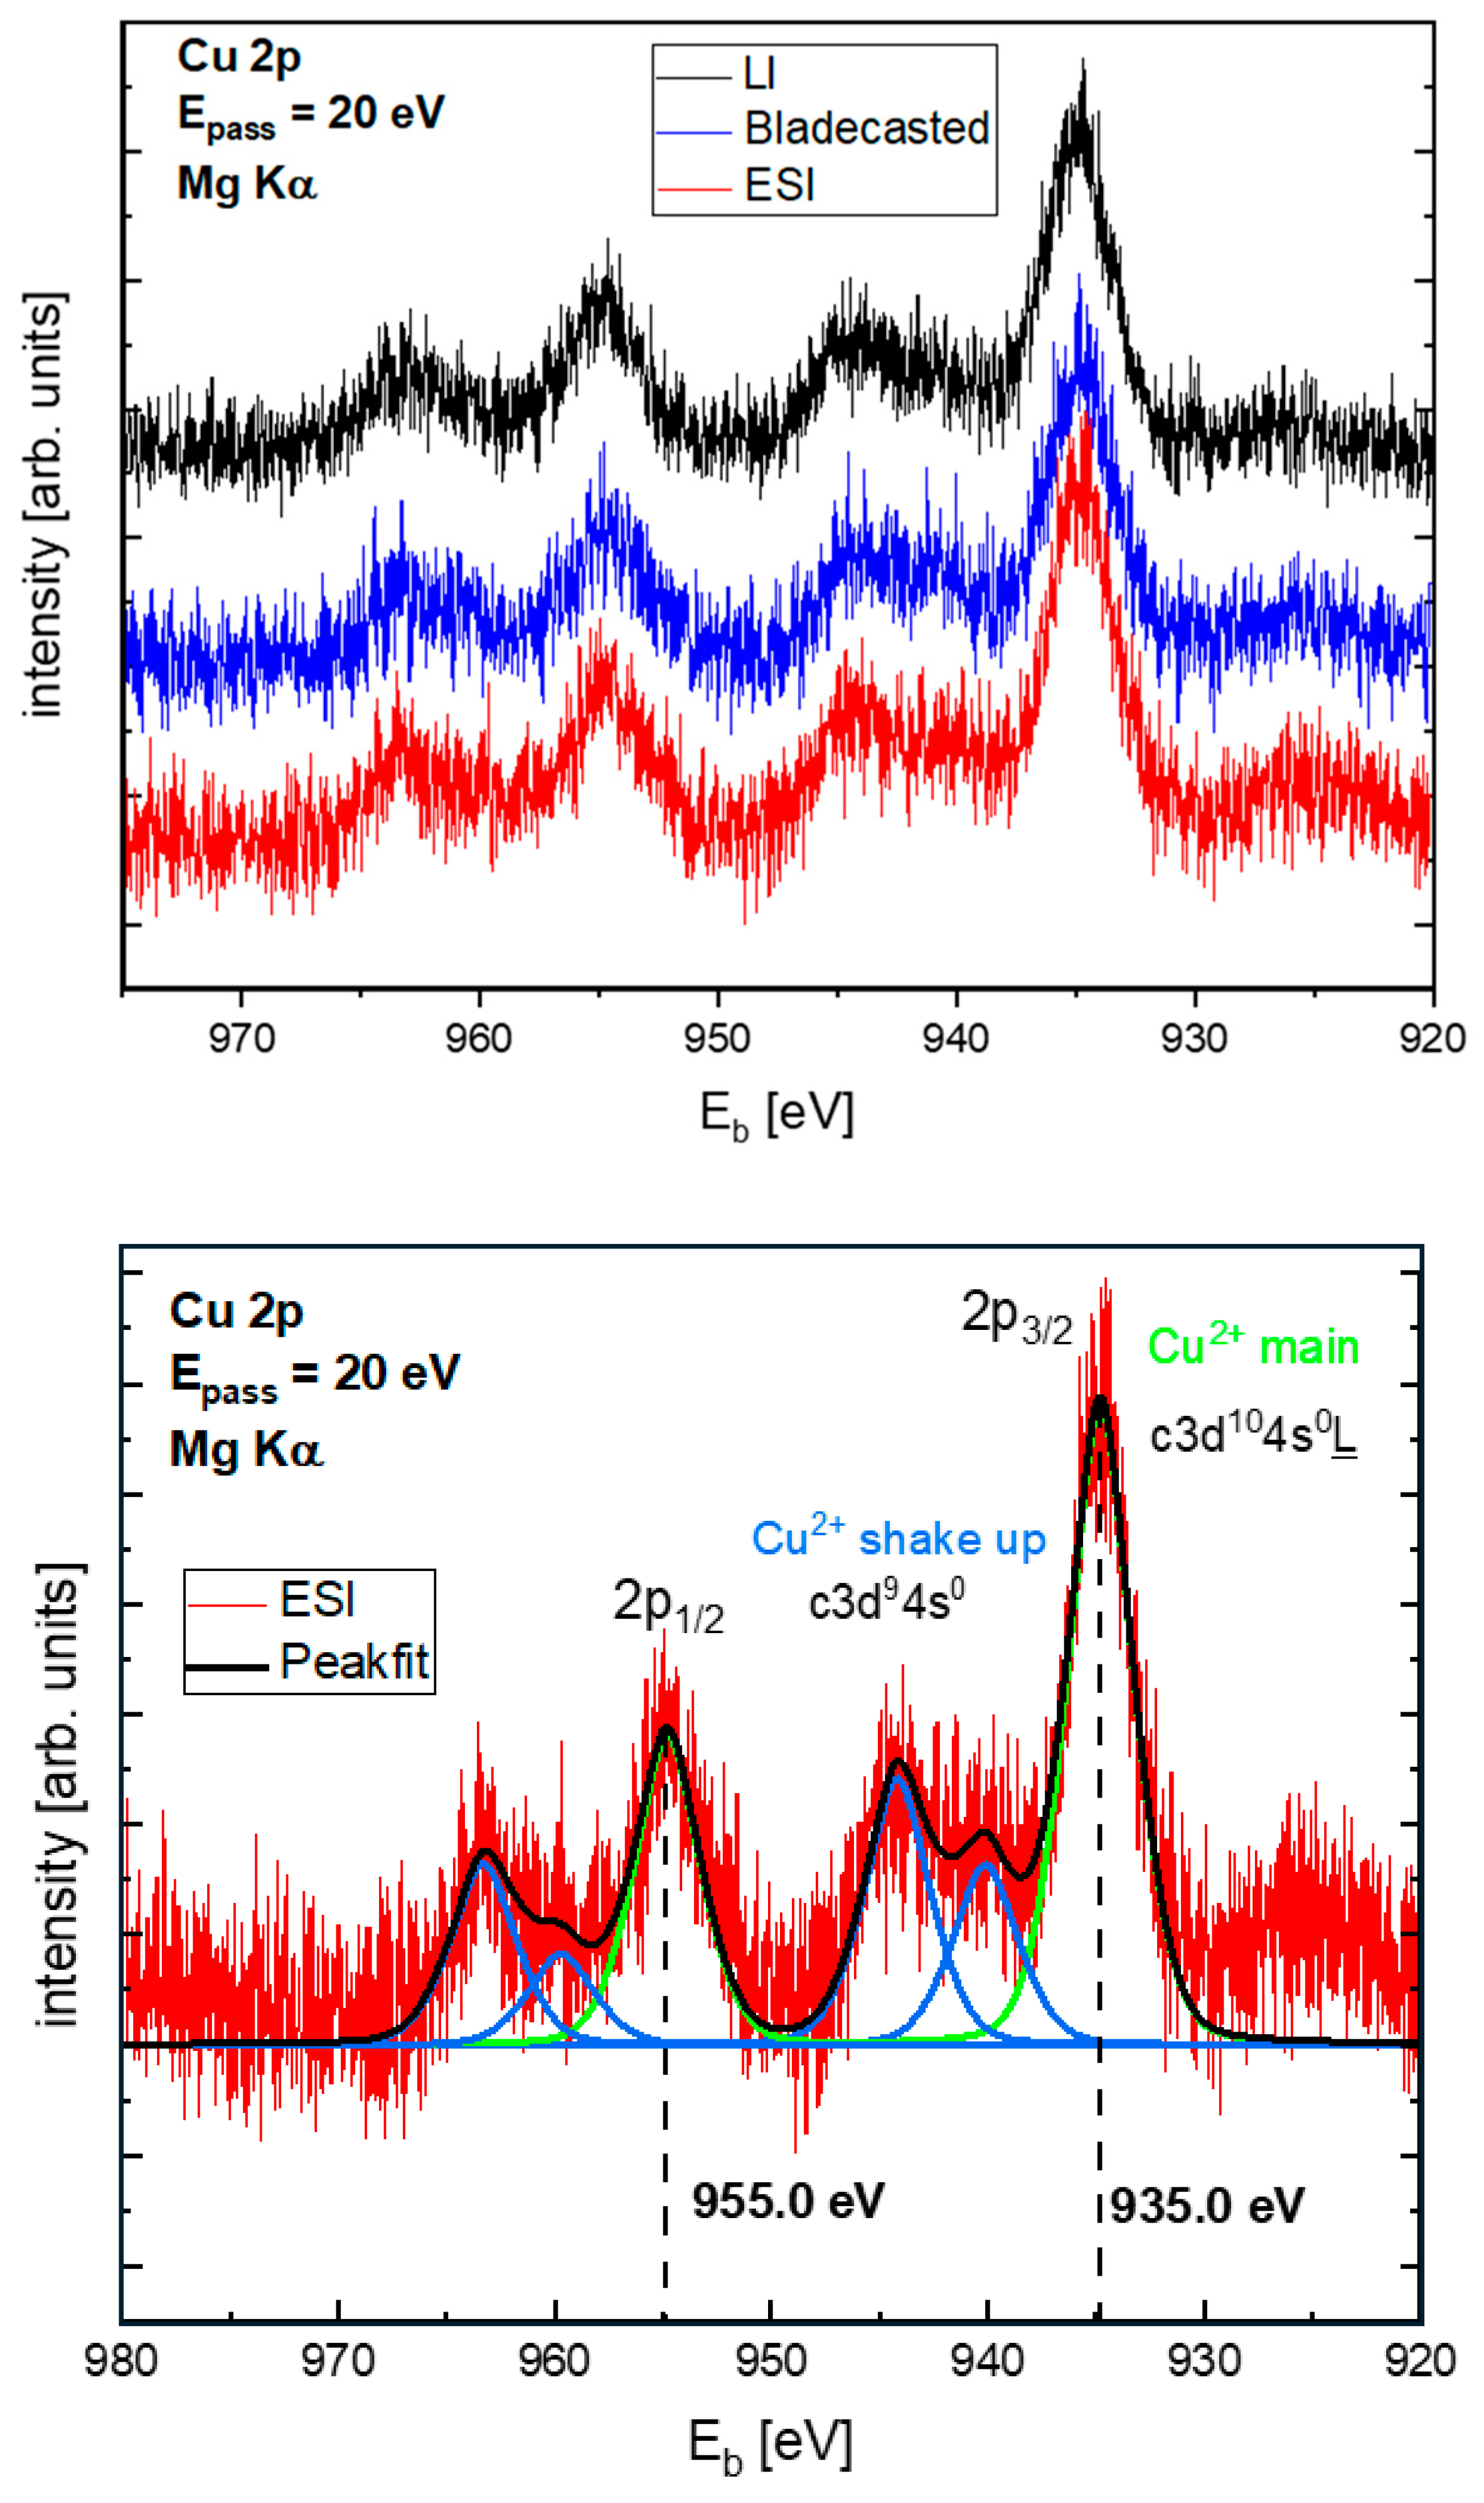
This is even better visible in the Cu 2p detail spectra (Figure 7). The distinctive feature of the CuCu4 molecule’s inner structure is the presence of five Cu(II) ions at its core. In the case of a possible fragmentation or inhomogeneous agglomeration, the respective local environment of the Cu ions would change. Such a local change would be reflected in the Cu 2p core level spectra. For all layers, the Cu 2p spectra showed the expected typical satellite structure of Cu in the oxidation state +II (Figure 7 top). The detailed fit of this peak is shown in Figure 7 (bottom) for the film prepared by ESI. The Cu 2p3/2 peak has a binding energy of 935 eV in comparison to a value of 934.7 eV for a Cu ion in Cu(II)-hydroxide [43] that is similarly coordinated as the Cu ions in the core of CuCu4. The peak structure was fitted with 3 peaks, following the approach by Biesinger et al. [43] and Torres-Ochoa et al. [44]. The peaks are labeled according to [45], i.e., the main peak (green curve in Figure 7 bottom) stems not from the ground state of Cu2+ but from the d10 configuration, where one electron is transferred from the ligand to the Cu ion. Based on the position and intensity of the satellite peaks (blue curves in Figure 7 bottom), in addition to the position and symmetric shape of the Cu 2p3/2 peak, the layers prepared show no indications of inhomogeneities or possible fragmentation of the molecules.

Figure 7.
(Top) Cu 2p XPS spectra of CuCu4 on SiO2 (wafer surface); prepared by ex situ blade-casting and in situ LI and ESI deposition. Note the smaller pass energy in comparison to Figure 6. (Bottom) Peakfit with Voigt functions for the ESI-prepared thin film [42].
These findings, alongside the IR spectra, indicate that both ex situ and in situ prepared films yield similar results when considering thick films without interface contributions. However, in an upcoming paper, we will demonstrate that in situ prepared films are essential for studying interface properties. Such effects will influence, for example, the Cu 2p satellite structure.
A critical note is necessary at this point. Although both UHV methods are effective for CuCu4, this does not necessarily apply to other molecules. The related complex CuFe4, Cu(ii)(DMF)2Cl2[12-MCFe(III)N(Shi)-4](DMF)4·2DMF, does not survive the stress of the electrical field in ESI. This can be proved by classical ESI mass spectrometry beforehand (see Supplementary Materials). Therefore, in the following, we place greater emphasis on the performance of the liquid injection method due to its broader applicability.
3.3. Improvements of the LI System
UV photoemission spectroscopy (UPS) was utilized to follow the CuCu4 deposition. Figure 8 shows the UPS spectrum of a multilayer CuCu4 film.
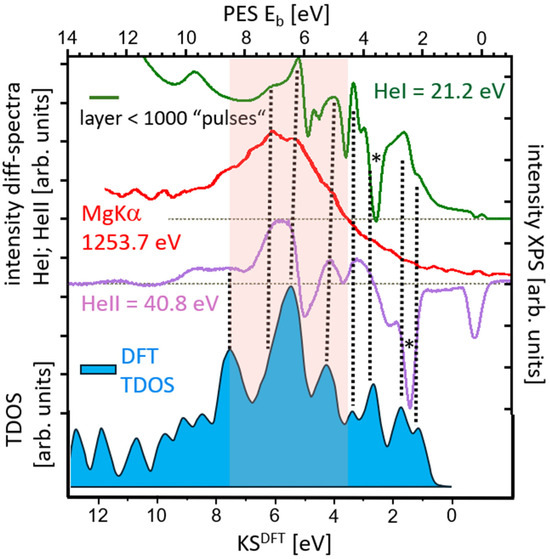
Figure 8.
Photoelectron spectra (PES) of the valence band region of a CuCu4 multilayer film on Au(111); prepared by LI with argon flow and substrate heating. Three different excitation energies are used. The data are shown as difference spectra, in which the spectrum of the substrate was subtracted. The dips marked with an asterisk are related to the subtraction. The zero lines are shown as horizontal dotted lines. For comparison, we show the theoretical total density of states (TDOS) in this region for a single CuCu4 molecule in the gas phase (DFT, uB3LYP). Graphic after [33].
Due to the d-states typical of the gold substrate, which overlap with the expected CuCu4 states, a correction was applied to all spectra by subtracting the measured native Au spectrum. As shown in Figure 8, we examined the individual energy ranges of the spectra to determine their element-specific origins. By using different excitation energies, we could assign individual peaks or peak areas to specific atomic species in the molecule based on their well-known differences in photoionization cross-sections at different photon energies [46]. For He I radiation, the carbon 2p states are quite intense, while for He II, the spectra are dominated by the 2p states of oxygen and nitrogen, and primarily by the 3d states of the copper ions. In the X-ray-induced (XPS) valence band spectrum, the copper 3d states clearly dominate. The peak group at a binding energy of around 6.5 eV, which is particularly prominent in the He II spectrum, can be identified as the region with MOs dominated by the copper 3d states. As expected for these d-states, the corresponding maximum also appears in the XPS spectrum. A comparison of the He I and He II spectra revealed regions with dip artifacts from the substrate subtraction (marked by an asterisk in Figure 8). To gain deeper insights into the molecular structure of bulk-like CuCu4, we performed a theoretical molecular orbital (MO) analysis using DFT (uB3LYP) to generate a theoretical total density of states (TDOS) spectrum (see Supplementary Materials). The calculated TDOS shown here is comparable to the recently published TDOS data for a single CuCu4 molecule using a PBE0 broken symmetry approach [47] and GGA+U [48]. The TDOS region dominated by the 3d states also appears around 5.5 eV (KSDFT), aligning very well with the observed intensity in the He II spectra at 6.5 eV. Overall, the measured spectra are in excellent agreement with the theoretical spectrum. The precise energetic positioning of the d-states plays a crucial role, especially when considering the magnetic states of spin-unsaturated systems, such as the CuCu4 complex used here. Considering the d-band structure of a Cu(II) ion with a coordination sphere similar to that of Cu ions in CuCu4, the copper phthalocyanine molecule (CuPc) exhibits comparable energy positions of the d-states relative to EF, as well as a similar relative d-state-HOMO energy difference for multilayer systems [49,50] as well as molecules on metallic substrates [48,51]. In multilayers of CuPc, the determination of the Cu d-states was carried out by comparing He I and soft X-ray radiation with hν = 210 eV [50]. The observed CuPc d-state energy of Eb = 5.8 eV and a relative d-state-HOMO gap of 4.3 eV align closely with the values of 6.5 and 4.1 eV obtained for the CuCu4 molecule in this study. Thus far, the contribution of the counterion (C2H3-NH⁺) has not been discussed. Due to the LI preparation method, an additional MO signature from the counterion (C2H3-NH⁺) should be expected in the measured spectra in Figure 8. These additional molecules will also influence the electronic properties of this complex interface, particularly in ultra-thin layers. To investigate possible spectral contributions from the counterions, Figure 9 (red line) presents the He I spectra for a multilayer sample of CuCu4 prepared by ESI (red line) and LI (light green line) on HOPG (highly oriented pyrolytic graphite), alongside an ex situ (spin-coating, SC) prepared film (petrol-colored line) to check for any influence of the environment. For these comparative measurements, HOPG was chosen because it is characterized by predominantly low reactivity and, in the He I range, exhibits only a weakly structured TDOS.
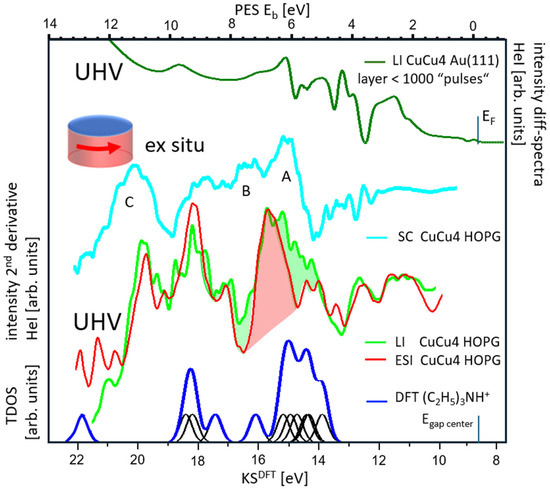
Figure 9.
Comparison of the HeI photoelectron spectra (PES) of the valence band region of a CuCu4 multilayer film prepared by UHV LI on Au(111) and by ex situ SC and UHV ESI and LI on HOPG. The Cu d-State DOS is red-shaded. A theoretical TDOS (DFT, uB3LYP) of a gas phase (C2H5)3NH+ counterion is given in blue as an overall function of the individual Gaussian broadened KS states (black curves). A, B are areas with a contribution from the counterion. Area C could indicate small traces of water. For details, see text.
As observed in Figure 9, the spectrum of the ex situ preparation shows a significant deviation from that of the UHV in situ preparation. Specifically, in contrast to the two in situ methods (ESI and LI), the HOMO region around 2 eV in the SC preparation is heavily smeared, making it very difficult to identify. At first glance, the peak structure labeled “A” appears to represent the d-band structure of the Cu ions. However, comparing the spectra of the two samples prepared in UHV (ESI and LI) with peaks A and B, it becomes evident that these peaks can be interpreted as part of an additional component added to the pure CuCu4 spectrum.
This additional component likely originates from the TDOS of the counterion and/or a change in the electronic properties of the CuCu4 molecule due to environmental conditions. Given that the solution and the molecules were always prepared under ambient conditions for all UHV measurements, with no changes in their IR signature even after prolonged exposure to air, it seems unlikely that the electronic structure of the molecule itself is deviating due to interaction with atmospheric oxygen or water. Nevertheless, the broad peak C at 11.6 eV, which is not found in the UHV spectra, could indicate small traces of water (O p-orbitals [52,53]) left over from the ex situ preparation, which overlays the actual CuCu4 structure. As mentioned above, the oppositely charged (CH3H2)3NH⁺ counterions are significantly reduced during the ESI preparation of the CuCu4 layer. Therefore, it is reasonable to assume that the two structures A and B, which are not present in the neighborhood of the clearly identified d-states of the ESI sample (red shaded area in Figure 9), represent portions of the counterion. To estimate the potential TDOS contributions from the counterions, a DFT TDOS calculation was performed for a (CH3H2)3NH⁺ molecule in the gas phase (see Supplementary Materials). The corresponding theoretical spectrum was aligned to the Fermi energy EF of the measured samples (Egap center = EF). It turns out that the observed states A and B can indeed be explained by the density of states of the counterions. This is also reflected in the spectrum of the LI-prepared sample, where they are also present.
In summary, this analysis shows that the spectrum of the ex situ prepared sample is predominantly influenced by the signature of the counterions and a small amount of residual amount of water (peak C). The associated states A and B obscure the true range of the Cu d-states, complicating their clear assignment. In contrast, for the UHV samples, the localization of the HOMO and, especially, the d-states is well defined.
These measurements of a multilayer film of CuCu4 now allow for the precise identification of the Cu d-states in the spectrum. This facilitates the investigation of potential interactions between the Cu d-orbitals of a CuCu4 molecule and a metallic substrate in ultrathin films (to be published separately).
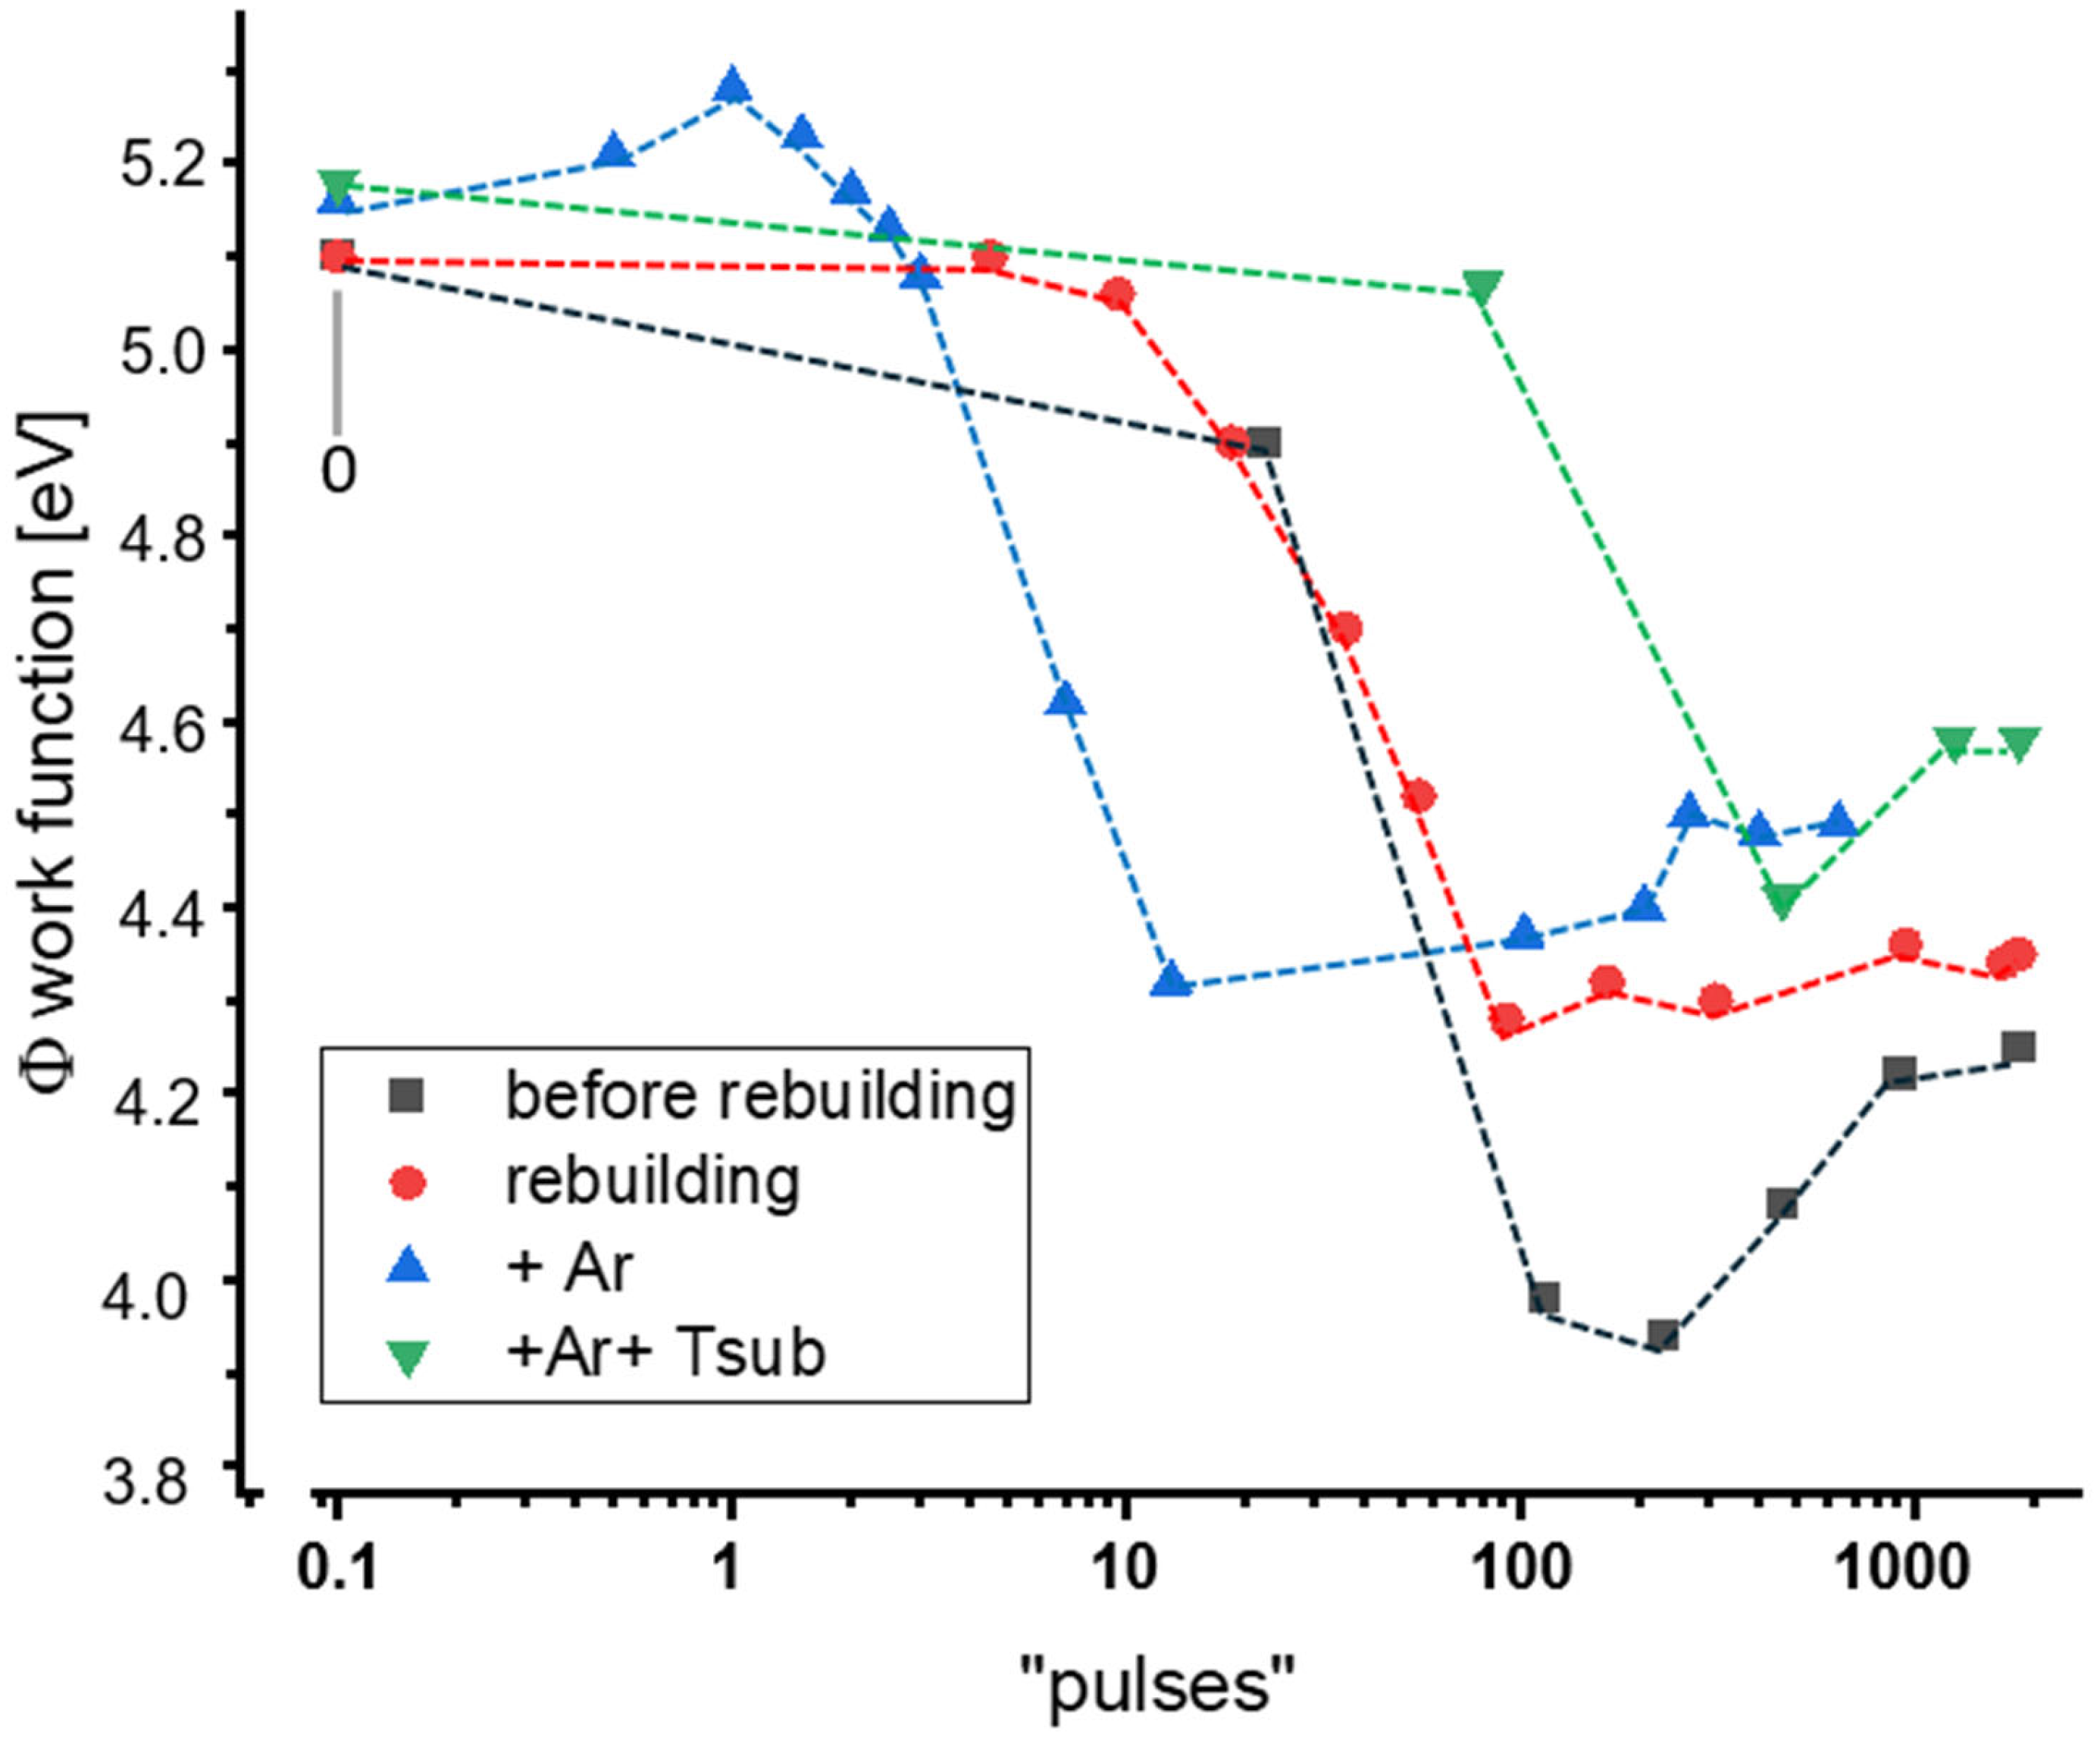
The work functions were derived from the He I spectra for different stages of expansion of the LI system (Figure 10). Before discussing the outcome, a critical remark must be made concerning the number of pulses on the x-axis. Initially, the idea was that each pulse would deliver the same amount of liquid into the system and onto the substrate. By re-evaluating the photoemission data (UPS and XPS) by comparing the substrate signal attenuation, we found this assumption to be incorrect. At the very beginning, a lot more material was deposited. Later, material stuck to the valve, leading to a smaller apparent opening and lesser deposited material. In a later stage, we used the consumed liquid, i.e., the amount of liquid sprayed into the system, as a much better measure. However, with longer pulse durations, the material also sticks to the walls of the guiding tube and aperture systems in slightly varying amounts. Therefore, the deposited amount of material has always to be determined by an independent method.
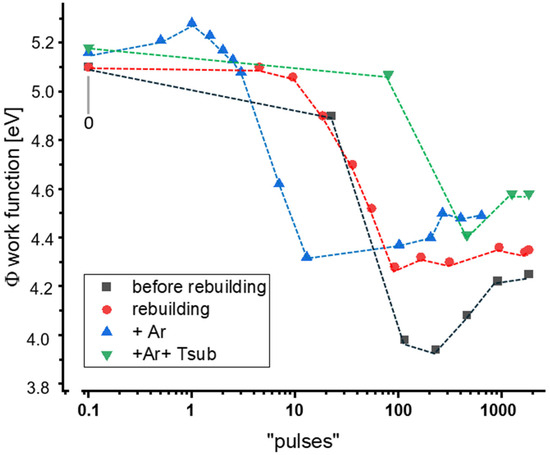
Figure 10.
From UPS experimentally determined work functions for different stages of LI expansion. The number of pulses is only a rough number (for details, see text). However, the relative amount of deposited CuCu4 is the same for each given number of “pulses”. After [33].
Figure 10 illustrates the success of the different expansion steps of the LI system. The work function of a non-interacting layer of CuCu4 is approximately 4.6 eV, which is in excellent agreement with work function calculations for a single CuCu4 molecule on Au(111) [46]. Smaller values indicate contamination.
The original system (black squares) shows a very low work function at the beginning and increases for thicker layers. The final value, however, remains well below the value of a clean CuCu4 film. Although the exact reason for this behavior is unclear, it suggests that the original system produces films with different compositions compared to those prepared after modification. One possible explanation is the deposition of substantial amounts of the solvent methanol.
The introduction of an additional pumping stage (red dots) resulted in a higher final work function, and further improvements were observed with the addition of an Ar flow. Heating the sample surface to 50 °C during deposition achieved the highest work function, while additional flange heating did not affect the work function [33]. Nonetheless, flange heating is essential to prevent the material from freezing at the outlet into the UHV system.
The evaluation of the carbon-to-copper ratio from the corresponding XPS measurements [33] provides insights into the extent of carbon contamination reduction due to solvent molecules. The reduction in unwanted carbon was approximately 10% after the introduction of the pumping stage. The Ar flow reduced carbon contamination by more than 70%, and substrate heating led to a reduction of over 80%.
4. Conclusions
This paper demonstrates preparation methods for non-sublimable complexes, using the metallacrown complex CuCu4 as an example. For multilayer films, where interface effects are not present, both ex situ and in situ prepared films to yield comparable results. The most versatile in situ method is liquid injection (LI), as it avoids shear stress on the molecules, which can occur due to the electric field in electrospray ionization (ESI).
However, LI does have some limitations. In its initial configuration, a considerable amount of unwanted material, primarily solvent molecules, is co-deposited. While this does not significantly impact the Au and Si wafer substrates used here, more reactive surfaces typically cannot be coated by LI. In our setup, the co-adsorption of unwanted material can be notably reduced by combining a perpendicular Ar flow with substrate heating, as shown in this study.
Additionally, the amount of material deposited per pulse can vary significantly depending on the system’s status, particularly the valve. Coverage can only be roughly estimated and only over a short series of measurements. If coverage investigations via scanning tunneling microscopy (STM) are not feasible or are prone to error, the coverage dependence for a coherent series of measurements must be calibrated using UPS and/or XPS spectra. It is also highly recommended to clean the entire system after each deposition of molecular species. This does not only comprise simple rinsing according to the instructions in the manual of the basis system; the whole system should be disassembled and rinsed in a suitable solvent.
With the system expansions shown here, we were able to prepare clean CuCu4 thin films. The photoemission, IR, and STM data are presented, corroborating that LI and ESI are feasible UHV deposition methods for such systems. The comparison of the structural and electronic spectra of the different preparation methods clearly shows differences, especially in the electronic structure. By their analysis, we were able to unequivocally identify the areas of pure CuCu4 states. In a subsequent step, ultra-thin layers of CuCu4 and CuFe4 prepared on Au(111) down to the ML range can now be analyzed on the basis of this work.
Supplementary Materials
The following supporting information can be downloaded at https://www.mdpi.com/article/10.3390/solids6010013/s1. Figure S1: Effect of sample heating on the preparation using LI. The black squares show the change in the work function of an Au(111) substrate to which methanol (with very low CuCu4 contamination) was applied (left) and then heated to different temperatures (right, red dots). The blue triangle represents the work function when the substrate is kept at 50 °C during the same preparation; Figure S2: Comparison of IR spectra in the signature range (CH-stretching vibrations) of N(C2H5)3 used as the counterion. For better comparability, the curves for ESI and LI preparation were multiplied by the factors 40 and 80, respectively; Figure S3: UPS spectra simulation for a single CuCu4 anion. (a) Simulated UPS Spectra using Gaussian KS state broadening of 0.2 eV, α- and β-KS-states are shown at the bottom. Special areas in the UPS spectrum are marked (1–9). (b) Molecular orbitals of the areas 1–9 shown in (a). For details, see text [54,55,56,57,58].
Author Contributions
Conceptualization, S.L., E.R. and C.Z.; formal analysis, F.P., R.B., Y.K., L.B., D.S., P.S., R.R., E.B., A.L., B.B. and S.L.; funding acquisition, E.R. and C.Z.; investigation, F.P., R.B., Y.K., L.B., S.E., R.W., D.S., P.S., R.R., E.B., A.L. and D.L.; methodology, R.R., B.B., S.L. and C.Z.; resources, E.R. and C.Z.; supervision, B.B., S.L., E.R. and C.Z.; visualization, S.L.; writing—original draft, S.L. and C.Z.; writing—review and editing, F.P., R.B., Y.K., L.B., S.E., R.W., D.S., P.S., R.R., E.B., A.L., D.L., B.B., S.L., E.R. and C.Z. All authors have read and agreed to the published version of the manuscript.
Funding
This work was funded by the Deutsche Forschungsgemeinschaft (DFG, German Research Foundation) Grant No. TRR 173-268565370 (project B06, with contribution from A09).
Data Availability Statement
The raw data supporting the conclusions of this article will be made available by the authors upon request.
Acknowledgments
Thanks to Ariyan Tavakoli, Peter Puschnik, and Hans-Christian Schneider for helpful discussions and for calculating the work function of CuCu4 on Au(111). The DFT calculations performed on the single molecule (see Supplementary Materials) are based on a preliminary calculation by Benjamin Stadtmüller, which he kindly made available to us. The ESI-MS measurements (Supplementary Materials) were measured in the group Niedner-Schatteburg, Dep. of Chemistry, RPTU.
Conflicts of Interest
The authors declare no conflicts of interest.
References
- Atodiresei, N.; Brede, J.; Lazić, P.; Caciuc, V.; Hoffmann, G.; Wiesendanger, R.; Blügel, S. Design of the Local Spin Polarization at the Organic-Ferromagnetic Interface. Phys. Rev. Lett. 2010, 105, 066601. [Google Scholar] [CrossRef] [PubMed]
- Sanvito, S. Molecular spintronics: The rise of spinterface science. Nat. Phys. 2010, 6, 562–564. [Google Scholar] [CrossRef]
- Schmaus, S.; Bagrets, A.; Nahas, Y.; Yamada, T.K.; Bork, A.; Bowen, M.; Beaurepaire, E.; Evers, F.; Wulfhekel, W. Giant magnetoresistance through a single molecule. Nat. Nanotech. 2011, 6, 185–189. [Google Scholar] [CrossRef] [PubMed]
- Cinchetti, M.; Dediu, V.A.; Hueso, L.E. Activating the molecular spinterface. Nat. Mater. 2017, 16, 507–515. [Google Scholar] [CrossRef] [PubMed]
- Droghetti, A.; Thielen, P.; Rungger, I.; Haag, N.; Groszmann, N.; Stockl, J.; Stadtmuller, B.; Aeschlimann, M.; Sanvito, S.; Cinchetti, M. Dynamic spin filtering at the Co/Alq3 interface mediated by weakly coupled second layer molecules. Nat. Commun. 2016, 7, 12668. [Google Scholar] [CrossRef]
- Dediu, V.A.; Hueso, L.E.; Bergenti, I.; Taliani, C. Spin routes in organic semiconductors. Nat. Mater. 2009, 8, 707–716. [Google Scholar] [CrossRef]
- Pardo, E.; Ruiz-García, R.; Cano, J.; Ottenwaelder, X.; Lescouëzec, R.; Journaux, Y.; Lloret, F.; Julve, M. Ligand design for multidimensional magnetic materials: A metallosupramolecular perspective. Dalton Trans. 2008, 21, 2780–2805. [Google Scholar] [CrossRef]
- Homberg, J.; Weismann, A.; Berndt, R.; Gruber, M. Inducing and Controlling Molecular Magnetism through Supramolecular Manipulation. ACS Nano 2020, 14, 17387–17395. [Google Scholar] [CrossRef]
- Kipgen, L.; Bernien, M.; Tuczek, F.; Kuch, W. Spin-Crossover Molecules on Surfaces: From Isolated Molecules to Ultrathin Films. Adv. Mater. 2021, 33, 2008141. [Google Scholar] [CrossRef]
- Viswanatha, C.B.; Stöckl, J.; Arnoldi, B.; Becker, S.; Aeschlimann, M.; Stadtmüller, B. Vectorial Electron Spin Filtering by an All-Chiral Metal–Molecule Heterostructure. J. Phys. Chem. Lett. 2022, 13, 6244–6249. [Google Scholar] [CrossRef]
- Kahn, A.; Koch, N.; Gao, W. Electronic structure and electrical properties of interfaces between metals and π-conjugated molecular films. J. Polym. Sci. B 2003, 41, 2529–2548. [Google Scholar] [CrossRef]
- Koch, N. Organic electronic devices and their functional interfaces. ChemPhysChem 2007, 8, 1438–1455. [Google Scholar] [CrossRef] [PubMed]
- Braun, S.; Salaneck, W.R.; Fahlman, M. Energy-level alignment at organic/metal and organic/organic interfaces. Adv. Mater. 2009, 21, 1450–1472. [Google Scholar] [CrossRef]
- Fahlman, M.; Fabiano, S.; Simon, V.G.D.; Berggren, M.; Crispin, X. Interfaces in organic electronics. Nat. Rev. Mater. 2019, 4, 627–650. [Google Scholar] [CrossRef]
- Zhan, Y.Q.; Fahlman, M. The study of organic semiconductor/ferromagnet interfaces in organic spintronics: A short review of recent progress. J. Polym. Sci. B 2012, 50, 1453–1462. [Google Scholar] [CrossRef]
- Panish, M.; Holtkamp, D.; Lange, W.; Jirikowsky, M.; Benninghoven, A. UHV preparation of organic overlayers by a molecular beam technique. Appl. Surf. Sci. 1984, 17, 296–308. [Google Scholar]
- Forrest, S.R. Ultrathin Organic Films Grown by Organic Molecular Beam Deposition and Related Techniques. Chem. Rev. 1997, 97, 1793–1896. [Google Scholar] [CrossRef]
- Kowarik, S.; Gerlach, A.; Schreiber, F. Organic molecular beam deposition: Fundamentals, growth dynamics, and in situ studies. J. Phys. Condens. Matter 2008, 20, 184005–184017. [Google Scholar] [CrossRef]
- Mustafa, H.A.; Jameel, D.A. Modeling and the main stages of spin coating process: A review. J. Appl. Sci. Technol. Trends 2021, 2, 119–123. [Google Scholar] [CrossRef]
- Tyona, M.D. A theoretical study on spin coating technique. Adv. Mater. Res. 2013, 2, 195–208. [Google Scholar] [CrossRef]
- Ramos-Hernández, R.; Calvo, F.D.; Pérez-Gutiérrez, E.; Percino, M.J. Large area small-molecule thin films deposited by the doctor blade technique implemented with computer numerical control machine. Thin Solid Films 2023, 771, 139787–139796. [Google Scholar] [CrossRef]
- Kumar, A.K.S.; Zhang, Y.; Li, D.; Compton, R.G. A mini-review: How reliable is the drop casting technique? Electrochem. Comm. 2020, 121, 106867–106877. [Google Scholar] [CrossRef]
- Rasool, S.; Kim, J.Y. Prospects of glove-box versus air-processed organic solar cells. Phys. Chem. Chem. Phys. 2023, 25, 19337–19357. [Google Scholar] [CrossRef] [PubMed]
- Fenn, J.B. Electrospray Wings for Molecular Elephants (Nobel Lecture). Angew. Chem. Int. Ed. 2003, 42, 3871–3894. [Google Scholar] [CrossRef]
- Kawai, T.; Tanaka, H.; Nakagawa, T. Low dimensional self-organization of DNA-base molecules on Cu(111) surfaces. Surf. Sci. 1997, 386, 124–136. [Google Scholar] [CrossRef]
- Yamashita, M.; Fenn, J.B. Electrospray Ion-Source−Another Variation on the Free-Jet Theme. J. Phys. Chem. 1984, 88, 4451–4459. [Google Scholar] [CrossRef]
- Rauschenbach, S.; Vogelgesang, R.; Malinowski, N.; Gerlach, J.W.; Benyouce, M.; Costantini, G.; Deng, Z.; Thontasen, N.; Kern, K. Electrospray Ion Beam Deposition: Soft-Landing and Fragmentation of Functional Molecules at Solid Surfaces. Nano 2009, 3, 2901–2910. [Google Scholar] [CrossRef]
- Grill, L.; Stass, I.; Rieder, K.H.; Moresco, F. Preparation of self-ordered molecular layers by pulse injection. Surf. Sci. 2006, 600, L143–L147. [Google Scholar] [CrossRef]
- Zambelli, T.; Boutayeb, Y.; Gayral, F.; Lagoute, J.; Girdhar, N.K.; Gourdon, A.; Gauthier, S.; Blanco, M.-J.; Chambron, J.-C.; Heitz, V.; et al. Deposition of large organic molecules in ultra-high vacuum: A comparison between thermal sublimation and pulse-injection. Int. J. Nanosci. 2004, 3, 12. [Google Scholar] [CrossRef]
- Happ, P.; Rentschler, E. Enforcement of a High-Spin Ground State for the First 3d Heterometallic 12-Metallacrown-4 Complex. Dalton Trans. 2014, 41, 15308–15312. [Google Scholar] [CrossRef]
- Ranecki, R.; Lach, S.; Lüpke, A.; Rentschler, E.; Ziegler, C. Spin-Flip Inelastic Electron Tunneling Spectroscopy on a CuCu4 Metallacrown Complex on Au(111). J. Phys. Chem. C 2023, 127, 13186–13195. [Google Scholar] [CrossRef]
- Sobrado, J.M.; Martin-Gago, J.A. Controlled injection of a liquid into ultra-high vacuum: Submonolayers of adenosine triphosphate deposited on Cu(110). J. Appl. Phys. 2016, 120, 145307. [Google Scholar] [CrossRef]
- Pütz, F. Präparation Organischer Schichten Aus Der Flüssigphase. Master’s Thesis, TU Kaiserslautern, Kaiserslautern, Germany, 2022. [Google Scholar]
- Necas, D.; Klapetek, P. Gwyddion: An Open-Source Software for SPM Data Analysis. Cent. Eur. J. Phys 2012, 10, 181–188. [Google Scholar]
- Ranecki, R.; Lach, S.; Lüpke, A.; Athanasopoulou, A.; Rentschler, E.; Ziegler, C. Competing Intramolecular Superexchange Interactions in the CuFe4 Metallacrown on Au(111)—An Inelastic Tunneling Spectroscopy Study. J. Phys. Chem. C 2022, 126, 15907–15914. [Google Scholar]
- Kurek, Y. Infrarotspektroskopische Untersuchungen von In-Situ und Ex-Situ Präparierten CuCu4-Metallakronen-Komplexen. Ph.D. Thesis, TU Kaiserslautern, Kaiserslautern, Germany, 2022. [Google Scholar]
- Dendrinou-Samara, C.; Psomas, G.; Iordanidis, L.; Tangoulis, V.; Kessissoglou, D.P. Host–Guest Interaction of 12-MC-4, 15-MC-5, and Fused 12-MC-4 Metallacrowns with Mononuclear and Binuclear Carboxylato Complexes: Structure and Magnetic Behavior. Chem. Eur. J. 2001, 7, 5041–5051. [Google Scholar] [CrossRef]
- Kessissoglou, D.P.; Bodwin, J.J.; Kampf, J.; Dendrinou-Samara, C.; Pecoraro, V.L. Pseudohalide complexation by manganese 12-metallacrowns-4 complexes. Inorg. Chimica Acta 2002, 331, 73–80. [Google Scholar] [CrossRef]
- Dendrinou-Samara, C.; Alevizopoulou, L.; Iordanidis, L.; Samaras, E.; Kessissoglou, D.P. 15-MC-5 manganese metallacrowns hosting herbicide complexes. Structure and bioactivity. J. Inorg. Biochem. 2002, 89, 89–96. [Google Scholar] [CrossRef]
- Alexiou, M.; Tsivikas, I.; Dendrinou-Samara, C.; Pantazaki, A.A.; Trikalitis, P.; Lalioti, N.; Kyriakidis, D.A.; Kessissoglou, D.P. High nuclearity nickel compounds with three, four or five metal atoms showing antibacterial activity. J. Inorg. Biochem. 2003, 93, 256–264. [Google Scholar] [CrossRef]
- Dendrinou-Samara, C.; Papadopoulos, A.N.; Malamatari, D.A.; Tarushi, A.; Raptopoulou, C.P.; Terzis, A.; Samaras, E.; Kessissoglou, D.P. Inter-conversion of 15-MC-5 to 12-MC-4 manganese metallacrowns: Structure and bioactivity of metallacrowns hosting carboxylato complexes. J. Inorg. Biochem. 2005, 99, 864. [Google Scholar] [CrossRef]
- Blättner, R. Vergleich von Methoden Zur Präparation von Metallakronen-Komplexen. Bachelor Thesis, TU Kaiserslautern, Kaiserslautern, Germany, 2022. [Google Scholar]
- Biesinger, M.C.; Laua, L.W.M.; Gerson, A.R.; Smart, R.S.C. Resolving surface chemical states in XPS analysis of first row transition metals, oxides and hydroxides: Sc, Ti, V, Cu and Zn. Appl. Surf. Sci. 2010, 257, 887–898. [Google Scholar] [CrossRef]
- Torres-Ochoa, J.A.; Cabrera-German, D.; Cortazar-Martinez, O.; Bravo-Sanchez, M.; Gomez-Sosa, G.; Herrera-Gomez, A. Peak-fitting of Cu 2p photoemission spectra in Cu0, Cu1+, and Cu2+ oxides: A method for discriminating Cu0 from Cu1+. Appl. Surf. Sci. 2023, 622, 156960–156971. [Google Scholar] [CrossRef]
- Parmigiani, F.; Depero, L.E.; Minerva, T.; Torrance, J.J.B. The fine structure of the Cu2p32 X-ray photoelectron spectra of copper oxide based compounds. J. Electron Spectrosc. Relat. Phenom. 1992, 58, 315–323. [Google Scholar] [CrossRef]
- Yeh, J.J.; Lindau, I. Atomic subshell photoionization cross sections and asymmetry parameters: 1 ≤ Z ≤ 103. At. Data Nucl. Data Tables 1985, 32, 1–155. [Google Scholar] [CrossRef]
- Pavlyukh, Y.; Rentschler, E.; Elmers, H.-J.; Hübner, W.; Lefkidis, G. Broken symmetry states of metallacrowns: Distribution of spins and the g-tensor. Phys. Rev. B 2019, 99, 144418. [Google Scholar] [CrossRef]
- Tavakoli, A. (RPTU Kaiserslautern, Kaiserslautern, Germany); Puschnik, P. (University of Graz, Graz, Austria); Schneider, H.-C. (RPTU Kaiserslautern, Kaiserslautern, Germany). Private communication, 2024.
- Toader, T.; Gavrila, G.; Braun, W.; Ivanco, J.; Zahn, D.T. Valence band fine structure of copper phtahlocyanine thin films: Effect of molecular orientation. Phys. Status Solidi 2009, 7, 1510–1518. [Google Scholar] [CrossRef]
- Evangelista, F.; Carravetta, V.; Stefani, G.; Jansik, B.; Alagia, M.; Stranges, S.; Ruocco, A. Elektronic Structure of copper phthalocyanine: An experimental and theoretical study of occupied an unoccupied levels. J. Chem. Phys. 2007, 126, 124709. [Google Scholar] [CrossRef]
- Lach, S.; Altenhof, A.; Tarafder, K.; Schmidt, F.; Ali, E.; Vogel, M.; Sauther, J.; Oppeneer, P.M.; Ziegler, C. Metal–organic hybrid interface states of a ferromagnet/organic semiconductor hybrid junction as basis for engineering spin injection in organic spintronics. Adv. Funct. Mater. 2012, 22, 989–997. [Google Scholar] [CrossRef]
- Faubel, M.; Steiner, B.; Toennies, J.P. Measurement of He I photoelectron spectra of liquid water, formamide and ethylene glycol in fast-flowing microjets. J. Electron Spectrosc. Relat. Phenom. 1998, 95, 159–169. [Google Scholar] [CrossRef]
- Salim, M.; Hurst, J.; Montgomery, M.; Tolman, N.; Liu, H. Airborne contamination of graphite as analyzed by ultra-violet photoelectron spectroscopy. J. Electron Spectrosc. Relat. Phenom. 2019, 235, 8–15. [Google Scholar] [CrossRef]
- NIST Chemistry WebBook, SRD 69. Available online: https://webbook.nist.gov/cgi/cbook.cgi?ID=C121448&Type=IR-SPEC&Index=0 (accessed on 7 January 2025).
- Hamid, Y.; Fathi, M.R. A Novel Cationic Surfactant-Assisted Switchable Solvent-Based Dispersive Liquid–Liquid Microextraction for Determination for Orange II in Food Samples. Food Analyt. Methods 2018, 11, 2131–2140. [Google Scholar] [CrossRef]
- Dennington, R.; Keith, T.A.; Millam, J.M. GaussView, Version 6; Gaussian, Inc.: Wallingford, CT, USA, 2016.
- Happ, P.; Sapozhnik, A.; Klanke, J.; Czaja, P.; Chernenkaya, A.; Medanik, K.; Schuppler, S.; Nagle, P.; Merz, M.; Rentschler, E.; et al. Analyzing the enforcement of a high-spin ground state for a metallacrown single-molecule magnet. Phys. Rev. B 2016, 93, 174404. [Google Scholar] [CrossRef]
- Marom, N.; Kronik, L. Density functional theory of transition metal phthalocyanines II: Electronic structure of MnPc and FePc—symmetry and symmetry breaking. Appl. Phys. A 2009, 95, 165–172. [Google Scholar] [CrossRef]


Disclaimer/Publisher’s Note: The statements, opinions and data contained in all publications are solely those of the individual author(s) and contributor(s) and not of MDPI and/or the editor(s). MDPI and/or the editor(s) disclaim responsibility for any injury to people or property resulting from any ideas, methods, instructions or products referred to in the content. |
© 2025 by the authors. Licensee MDPI, Basel, Switzerland. This article is an open access article distributed under the terms and conditions of the Creative Commons Attribution (CC BY) license (https://creativecommons.org/licenses/by/4.0/).