2. Materials and Methods
The objects of this study were solid solutions (SS) of the composition Bi
1-xHo
xFeO
3 x = 0.00–0.50 and Δx = 0.05–0.10. The samples were obtained using conventional ceramic technology (CCT), which includes a two-stage synthesis with intermediate grinding followed by sintering without applying pressure [
12]. The selection of optimal technological modes was carried out on a series of experimental samples with X-ray control of the phase composition.
Bi
2O
3, Fe
2O
3, Ho
2O
3 oxides of high purity (AR, LR grade with a base content > 99.95%) were used as starting reagents. Optimal conditions for synthesis and sintering of BiFeO
3: T
synt.1 = T
synt.2 = 1030 K and holding times τ
synt.1 = τ
synt.2 = 10 h, T
sint. = 1140 K, τ
sint. =2 h. Optimal regimes for obtaining SS of composition Bi
1-xHo
xFeO
3 x = 0.05–0.50: T
synt.1 = 1070 K (
x = 0.05–0.20); T
synt.2 = 1090 K (
x = 0.05), T
synt.2 = 1110 K (
x = 0.10), T
synt.2 = 1130 K (
x = 0.15), T
synt.2 = 1150 K (
x = 0.20); τ
synt.1 = τ
synt.2 =10 h; T
sint. = 1180 K (
x = 0.05, 0.10), T
sint.= 1200 K (
x = 0.15, 0.20), τ
sint. = 1.5 h (
Table 1) [
13]. Mechanical activation (MA) of synthesized SS powders with
x = 0.30–0.50 was carried out at the stage of production of press powders prepared for sintering. MA was carried out in a high-energy grinding planetary ball mill AGO-2. The grinding was carried out in an alcoholic medium for 15 min, the drum rotation speed was 1820 rpm.
Table 2 and
Table 3 show the process of optimizing the conditions for obtaining the SS of the Bi
1−xHo
xFeO
3 system with
x = 0.30–0.50. It can be seen that at T
synt.1 = 870 K, in the solution with
x = 0.30, Bi
25FeO
40 is formed as the main phase, and BiFeO
3 and Ho
2O
3, which did not participate in the reaction, are also formed in small amounts. When the temperature is increased to T
synt.1 = 1120 K, BiFeO
3 becomes the main phase and the composition of the impurity phase changes to Bi
2Fe
4O
9 and HoFeO
3. In SS with
x = 0.40 and
x = 0.50 at first synthesis temperatures T
synt.1 = 1020–1070 K, BiHoO
3 and HoFeO
3 act as the main phase. Bismuth ferrite is only formed as the main phase at temperatures of the second synthesis T
synt.1 = 1070–1120 K.
In SS with x = 0.30, the use of mechanical activation favours the incorporation of Ho into the BiFeO3 structure, which occurs gradually as the temperature of the first synthesis is increased to 1070 K. With a further increase in the synthesis temperature, the number of impurity phases increases again, indicating their decomposition. In SS with x = 0.40 and x = 0.50, mechanical activation did not give a positive result. The positive result of the use of mechanical activation appeared only in the case of SS with x = 0.30.
The sintered ceramic pieces were subjected to mechanical processing (cutting along a plane, grinding and polishing along flat surfaces and ends) in order to obtain cylindrical measurement samples with a diameter of 10 mm and a height of 1 mm. Each composition contained (8–10) such samples.
X-ray studies were carried out by powder diffraction on a DRON-3 diffractometer (Co
Kα radiation) with an installed IR-2 X-ray intensimeter, connected to a PC and equipped with special software developed by an employee of the organization for a specific device. Ground ceramic objects were studied, which made it possible to exclude the influence of surface effects, stresses and textures that occur during the production of ceramics. The structural parameters were calculated using standard methods [
14]. The errors in the measurements of the structural parameters had the following values: linear Δ
a = Δ
b = Δ
c = ± (0.002–0.004) Å; angular Δ
β = 3′; volume Δ
V = ±0.05 Å
3 (Δ
V/
V∙100% = 0.07%), C—cubic phase, Pcs—pseudocubic. Sample density was determined by the Archimedean method using
N-octane.
To study the microstructure of the cleavages of the samples, a JSM-6390L scanning electron microscope (JEOL, Tokyo, Japan) with a system of microanalyzers (Oxford Instruments, Abingdon, Great Britain) was used. The resolution of the microscope is up to 1.2 nm at an accelerating voltage of 30 kV (image in secondary electrons), the limits of the accelerating voltage are from 0.5 kV to 30 kV, the magnification is from ×10 to ×1,000,000, the beam current is up to 200 nA. The grain landscape was also studied using a KEYENCE VK-9700 color laser scanning 3D microscope (KEYENCE, Osaka, Japan) and a Hitachi TM1000 electron microscope (Hitachi, Marunouchi, Japan).
Microwave studies were carried out using a P9375A “Keysight” vector network analyzer (VNA) (Keysight, Santa Rosa, CA, USA), which has an operating frequency range of 300 kHz–26.5 GHz, and a waveguide measuring cell. Instrument calibration was performed using the X11644A “Keysight” calibration kit (Keysight, Santa Rosa, CA, USA).
A waveguide measurement cell was used to measure the samples, consisting of a 23 × 10 mm (X band, (8.2–12.4) GHz) waveguide line with a heating element insulated by plates of heat-resistant material. The sample was placed in the center of the waveguide, in the H plane, using a rectangular insert made of fireclay bricks, completely filling the section of the waveguide (
Figure 1).
Coaxial waveguide junctions (CWJs) from the calibration kit were used to connect the measurement cell to the VNA measurement cables.
Forward (
) and reverse (
) loss factors were calculated using the following formula [
15,
16,
17]:
where
and
are the squared modules of the elements of the quadripole scattering matrix, expressed in relative units, which have the physical meaning of the power reflection coefficient and the power transmittance coefficient, respectively. These parameters were determined during the experiment.
Reflection coefficients (
S11,
S22) in an empty waveguide measuring cell over the entire frequency range do not exceed −20 dB (
Figure 2a), and direct and return losses are no more than 10% (
Figure 2b). The indicated level of agreement is satisfactory within the framework of this experiment. Reflection coefficient pulsations (
S11,
S22) with a small frequency step are probably associated with the interference of waves reflected from the junctions of the coaxial cables with the coaxial-to-waveguide transition (CWT) and the measurement cell with the CWT. In all the following figures, all the ripples associated with the technical characteristics are filtered by the moving average method. It should also be noted that the level of the forward and return losses is the same, which indicates the symmetry of the 4-port network measured.
The presence of a measuring insert (made of fireclay brick) in the waveguide leads to an increase in the reflection coefficients (
S11,
S22) up to −10 dB (
Figure 3a), as well as an increase in direct (
dF) and reverse (
dR) losses by 10% (here and other percentages relative to the power of the incident electromagnetic wave) (approximately 2 times) (
Figure 3b) in comparison with the parameters of an empty measuring cell (
Figure 2). The minima of the reflection coefficient are caused by the interference of reflected waves from the air–material interface of the insert. The
dF,R maxima at frequencies (11–12.4) GHz are probably due to the resonance of the electromagnetic wave in the sample hole.
At high temperatures, the level of losses in an empty waveguide measurement cell (curve wg 503 K in
Figure 4) remains almost unchanged compared to similar studies at room temperature (curve wg 302 K in
Figure 4). At the same time, the level of losses in the waveguide measurement cell with a measuring insert when exposed to temperature (curve i503 K in
Figure 4) is 10% higher compared to similar measurements at room temperature (curve i302 K in
Figure 4). The increase in loss is probably due to an increase in the imaginary part of the dielectric constant of the insert material with increasing temperature.
Considering the small changes in the loss level of an empty waveguide test cell with increasing temperature, it is possible to exclude its influence on the level of losses introduced into the system by calculating the difference between the loss coefficients of the filled insert and the empty test cell:
where
Di is the electromagnetic loss coefficient in the measuring insert,
is the average loss value in the measuring cell with the insert,
is the average loss value in the empty waveguide measuring cell.
and
were calculated as the arithmetic mean of the forward and reverse loss coefficients, which is due to their similarity for all the experiments performed (in our case the system is a symmetrical four-port network). Previously, this method was used by a team of authors to evaluate the microwave absorption of ferroelectric ceramic materials [
18]. The absorption parameters of materials can therefore be considered either as losses of the whole system or as differential losses due to the presence of an experimental sample in the measurement cell.
The dynamics of changes in the microwave response of the measuring insert with increasing temperature can be assessed by analyzing the dependence of
Di in the measuring insert as a function of frequency and temperature (
Figure 5a). For ease of analysis, the data obtained are presented in the form of a heat map (
Figure 5b), which is a top view of the image (
Figure 5a) (loss maxima on the heat map are light areas, minima are dark).
When the waveguide is heated with the probe, all maxima of Di shift monotonically to the low-frequency region on ~100 MHz, so that the maxima at the frequencies 11.12 GHz and 11.94 GHz at high temperature are at the frequencies 11.02 GHz and 11.86 GHz. This is probably due to an increase in the value of the real part of the dielectric constant of the insert material with increasing temperature.
This section may be divided by subheadings. It should provide a concise and precise description of the experimental results, their interpretation, as well as the experimental conclusions that can be drawn.
3. Results and Discussion
Bi
1−xHo
xFeO
3 samples with
x = 0.00–0.20 and ∆
x = 0.05 contain two impurity phases Bi
25FeO
40 and Bi
2Fe
4O
9, and relative density (
ρrel) is in the range 83.78–88.33 depending on
x. The work [
13] present the results of previous studies.
Figure 6 show X-ray diffraction patterns of Bi
1-xHo
xFeO
3 SS with
x = 0.30–0.50. It can be seen that, a SS with a perovskite-type structure without impurity phases has not been formed; moreover, the perovskite structure itself has not been fully formed in all SS. The content of impurities increases with increasing
x. The relative intensities of the Bi
36Fe
2O
57 peaks are 34, 41, 50 in samples with
x = 0.30, 0.40, 0.50, respectively. The
ρrel. of the ceramics with
x = 0.30, 0.40, 0.50 are 89, 82, 86%, respectively.
The result obtained is not unexpected, since the substitution Bi3+ ↔ Ho3+ does not satisfy the empirical rules of Goldschmidt isomorphism: the difference in ionic radii, ΔR, is not more than 15%, the difference in electronegativity, ΔEN, is not more than 0.4.
In this SS, Δ
R is 39% (Bi
3+ = 1.20,
R Ho
3+ = 0.86 for c. n. 6 according to Belov-Bokiy [
19]) and ΔEN = 0.8, in such cases only microisomorphism is possible [
20]. The cell parameter of the perovskite phase, calculated from a single diffraction reflection of 110, is the same for all SS:
a = 3.948 Å, and is smaller than the BiFeO
3 parameter,
a = 3.959 Å (PDF set 14, card 181), by Δ = 0.011 Å. This suggests that a small amount of Ho nevertheless replaces Bi in the SS structure, since the ionic radius of Ho
3+ is smaller than that of Bi
3+. The remainder of the Ho is probably part of an unidentified impurity phase.
Figure 7,
Figure 8 and
Figure 9 show fragments of the microstructure of ceramic samples of bismuth ferrite containing holmium (Ho) in the composition Bi
1−xHo
xFeO
3 x = 0.30 (
Figure 7),
x = 0.40 (
Figure 8),
x = 0.50 (
Figure 9) (previously in [
13] the grain structure in ceramics was studied with 0.00 ≤
x ≤ 0.20). In each of the figures, different views of the same object are shown at different scales.
In all cases, the heterogeneity of the grain landscape is noted with crystallites whose habit is parallelepiped (“tiles”) or cube (larger grains are highlighted with dashed lines in
Figure 7a–c) or formations of indeterminate shape (near cubic, small grains). In each case, the size of the large and small grains is noted several times (sometimes by an order of magnitude). The size of large grains increases as the bismuth ferrite is enriched with holmium from ~4 μm (
x = 0.30) to ~10 μm (
x = 0.50), and the size of small grains decreases slightly, remaining in the range (0.5–1.0) μm. The packing of the grains is chaotic, loose in places (
Figure 8c,f), areas of looseness (highlighted by dashed lines) with areas of denser structures (
Figure 8g, dashed lines), sometimes in the form of radial ring areas (
Figure 7c), winding lines).
An increase in the concentration of introduced holmium leads, in addition to the enlargement of plate-like grains, to the conglomeration of small grains (
Figure 8b,d, dashed lines) at
x = 0.40 and subsequently (
x = 0.50) to an increase in their number and the displacement of large crystallites (
Figure 9b–e).
The fact that during the recrystallization sintering process, in all the cases considered, grains of almost regular geometric shape are formed, with clear edges, indicates that they grow in the bulk, in which, in addition to solid grains and gaseous pores, there is a liquid phase (LP), in which the grains are immersed [
21]. In most cases, such ideomorphic grains are characteristic of secondary discontinuous recrystallization processes, in which impurities located at the grain boundary at the recrystallization temperature form a liquid phase that actively interacts with the base material, acting not so much as a “lubricant” as a transport medium, i.e., a solvent. The selective growth of large grains in this case is due to ordinary dissolution and precipitation from solution, not to boundary movement. In this case, the liquid covering the surface of such grains with a film causes them to acquire a certain growth form and regular cut, identical to the habit of crystals growing from a molten solution. As a result, idiomorphic grains crystallize in the form of polyhedra with almost straight edges [
22].
The formation of the liquid phase may be related to the presence of unreacted bismuth oxide, Bi
2O
3, with a low melting point, T
melt. = 1098 K, in the mixtures of the studied materials, as well as to the composition of Fe
2O
3-Bi
2O
3, T
melt which may be even lower than in Bi
2O
3 (see figure from [
23]).
The results of this study are as follows the microwave absorption properties of ceramic samples of BiFeO
3 with different amounts of Ho, where in all cases the electromagnetic loss coefficient
D has been calculated according to Formula (2), where instead of
di(av)—the average value of the losses in the measurement cell with an empty insert—a similar coefficient obtained for a measurement cell with a sample of the material under study has been used. When studying the microwave absorption of ceramic samples of original and modified BiFeO
3, it was found that, in addition to the features previously observed when measuring an empty insert (maxima marked with number 1 in
Figure 10), the measuring insert with sample has additional loss maxima due to the presence of samples in the measuring insert (maxima marked with number 2 in
Figure 10).
In particular, for the original BiFeO3, these maxima are located at frequencies of 8.75 GHz and 10.21 GHz and it is difficult to determine their nature unambiguously from the data obtained. They can be of both resonant and non-resonant nature. However, by studying the dynamics of changes in the position and intensity of these maxima, it is possible to draw some tentative conclusions about the process of changing the values of the complex dielectric and magnetic permeability in their vicinity. The reason for the shift in the position of the maxima in the frequency domain is a change in the length of the electromagnetic wave, λ, in the material: , where ɛ′ and μ′ are the real parts of the dielectric and magnetic permeabilities, respectively. A decrease in intensity and an increase in the half-width of the maxima, as well as an increase in the general background losses, indicate an increase in the imaginary part of the dielectric (ɛ″) and magnetic (μ″) permeabilities. We then analyzed the dynamics of changes in the microwave response of samples of the materials under investigation as a function of Ho concentration and temperature.
First, the dependence of the loss coefficient (
D) of the insert with a BiFeO
3 sample on frequency (
f) and temperature (T) was analyzed. In order to assess the dynamics of the changes in the microwave response of the material with increasing temperature, plots similar to
Figure 5b. To assess the temperature hysteresis of the microwave response dependence on temperature, the dependence was plotted for both the heating mode (
Figure 11a) and the cooling mode (
Figure 11b). With increasing temperature, the maxima
D of the sample (maxima 1 and 2—M1 and M2—in
Figure 11 and below) shift linearly towards the lower-frequency region, while their intensity increases.
Both during heating and cooling, the dynamics of the changes in intensity and frequency of the loss maxima are the same, so there is no temperature hysteresis in the material under study. However, in order to avoid unnecessary inaccuracies due to inadequate temperature control, 320 K and 480 K have been chosen here and below as the reference temperatures for the comparative analysis. The shift in the frequency domain when the sample is heated from 320 K to 480 K is 320 MHz for the first maximum and 250 MHz for the second. The increase in intensity is 4% for the first maximum and 8% for the second. The shift in the position of the loss maxima in the frequency domain is probably due to an increase in the value of the real part of the dielectric or magnetic permeability of the insert material with increasing temperature. The increase in the height of the maxima is probably related to an increase in the value of the imaginary part of the dielectric or magnetic permeability of the sample material with increasing temperature [
9]. It is not possible to unambiguously determine the contribution of magnetic and dielectric permittivity to the position and intensity of the loss maxima from the data obtained. The difference between the positions of the peaks is 1.47 GHz at low and 1.55 GHz at high temperatures.
With the introduction of 5 mol% Ho, the D maxima have a significantly larger half-width but lower intensity (
Figure 12), probably due to an increase in
ɛ″ and
μ″. When the sample is heated from 320 K to 480 K, the shift in M1 is 280 MHz, for M2—250 MHz, and the increase in intensity is ~5% and ~9%, respectively. It was found that in the temperature range of ~320 K the distance between the maxima in the frequency domain is 1.42 GHz and 1.46 GHz at ~480 K. It is shown that in the dependence of D on temperature during cooling, an intensity hysteresis is observed in the vicinity of the M2 frequencies (
Figure 12b), and its intensity and half-width do not return to their original form (
Figure 12a). This is probably due to the memory effects of the material.
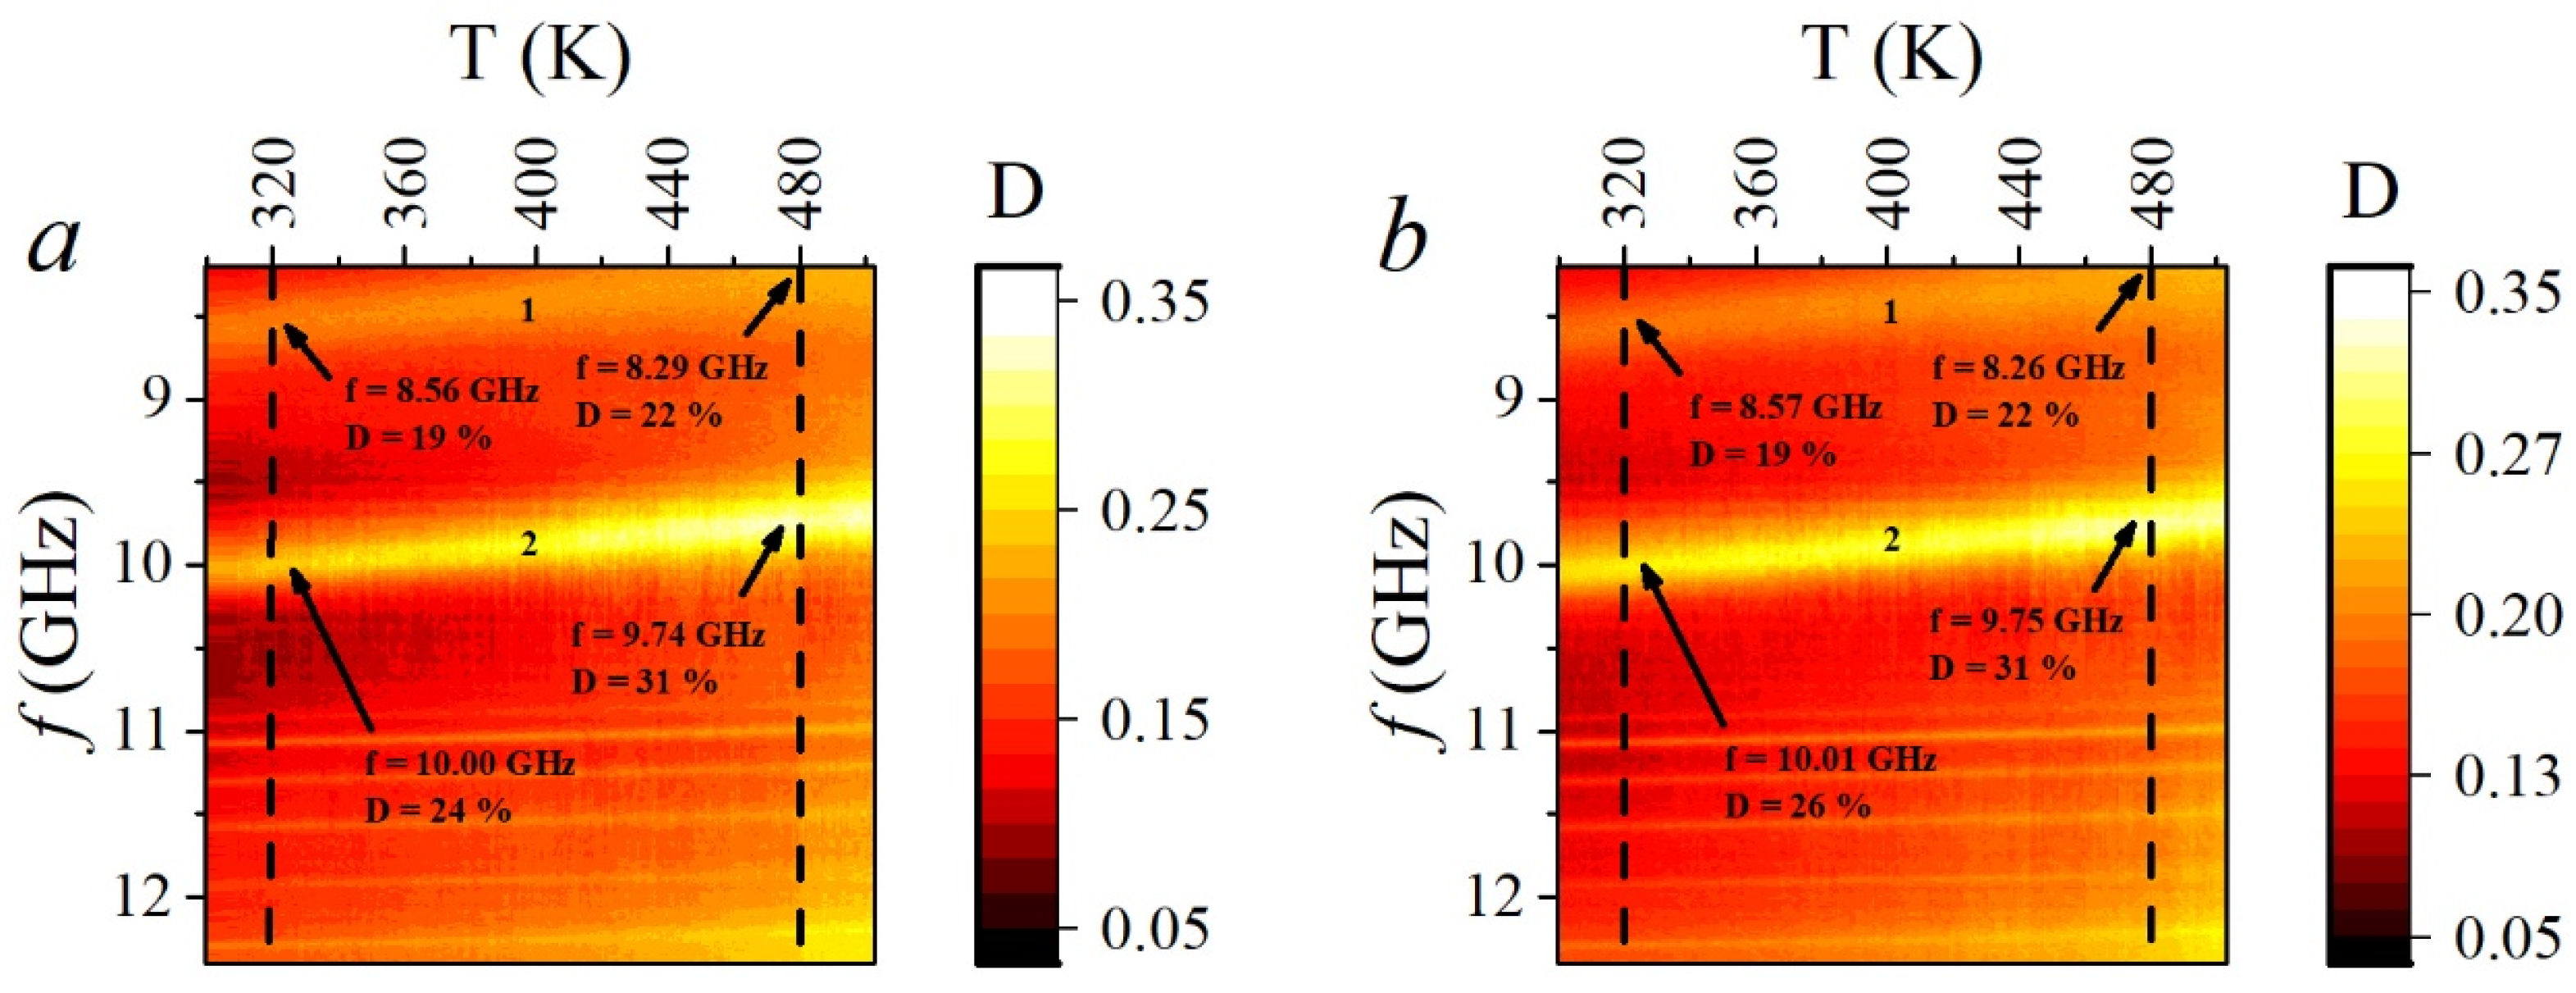
When
x = 0.10 is introduced (
Figure 13), the M2 intensity in the samples is on average 5% higher. When the sample was heated from 320 K to 480 K, the shift was ~270 MHz and ~260 MHz for M1 and M2, respectively. At the same time, the increase in intensity was about 3% and 7%, respectively. The distance between the maxima, compared to
x = 0.05, did not change practically and was 1.44 GHz at low temperatures and 1.45 GHz at high temperatures. It should be noted that the behavior of the sample with
x = 0.10 is similar to the case of BiFeO
3 with 5 mol% of Ho, as upon cooling an intensity hysteresis is observed in the vicinity of the frequencies of the first and second maxima (
Figure 13b).
At
x = 0.15, the high-frequency maximum (
Figure 14, marked with number 2) is significantly shifted to the low-frequency region compared to the data obtained for objects with
x < 0.15 (
Figure 11,
Figure 12 and
Figure 13), while the distance between M1 and M2 is much smaller, being 0.95 GHz at ~320 K and 1 GHz at ~480 K.
In addition, the intensity of M2 increased significantly while the values for M1 remained at the same level. The bias when heating the sample from 320 K to 480 K is 190 MHz for M1 and 250 MHz for M2. In this case the intensity increased by 2% for M1 and 3% for M2 compared to
x = 0.10 (
Figure 13). It was found that compared to
x < 0.15 (
Figure 11,
Figure 12 and
Figure 13), both the shift in the D maxima and the increase in their intensity with increasing temperature decreased significantly.
At
x = 0.20, the low-frequency maximum (M1) is absent (
Figure 15), probably due to either its significant shift to the low-frequency region, beyond the measurement range, or a decrease in its intensity to the general loss level. It was found that the shift in the maximum when the sample is heated from 320 K to 480 K is 200 MHz and the increase in intensity is 3%. Therefore, as in the case of SS with
x = 0.15 (
Figure 14), a small frequency shift in the
D maximum and a change in its intensity were observed.
At
x = 0.30, the intensity of the second maximum (
Figure 16) is comparable to the value obtained for SS with
x = 0.15 (
Figure 14), and averages 50%, and its shift when heating the sample from 320 K to 480 K is less than at
x = 0.15–0.20 (
Figure 14 and
Figure 15) and is carried out within 120 MHz. The increase in its intensity is ~3%.
It should be noted that in samples with
x = 0.30, two additional high-frequency maxima are observed (maxima marked with numbers 3 and 4 in
Figure 17), which are of low intensity. At lower holmium concentrations, these features were not found.
At
x = 0.40 (
Figure 18), maxima 3 and 4 have higher intensity in contrast to samples with
x = 0.30. The shift in maximum 2 when the sample is heated from 320 K to 480 K is less than 50 MHz and the increase in intensity is ~4%. The shift in the third and fourth maxima is also small, 20 and 30 MHz, respectively.
It should be noted that the dynamics of the changes in the microwave response of the ceramic SS with
x = 0.50 (
Figure 19) with increasing temperature is similar to that of the BiFeO
3 modified with 40 mol% Ho (
Figure 18). The shift in the second maximum in the frequency domain when the sample is heated from 320 K to 480 K is small and amounts to less than 50 MHz.
Since the main observed variables were the frequencies and intensities of loss maxima, as well as their shift and increase in intensity with increasing temperature, to summarize the results obtained, these parameters are presented depending on the concentration of the modifier (
Figure 20). It is clear (
Figure 20a) that the shift in the loss maxima with increasing modifier concentration is non-monotonic, indicating a non-monotonic increase in ɛ′ with increasing modifier concentration. However, it should be noted that when the modifier concentration reaches ~30% or more, the shift in the maxima in the frequency domain practically stops, which is probably due to the dispersion of λ.
The method used in our work to determine reflection losses associated with interferences is not without drawbacks, as in [
8], but it does enable us to clarify the nature of the absorption maxima that occur. In the present study, no losses were detected in the vicinity of ~8–9 GHz, but the detected anomalies at other frequencies are likely to be due to interferences at the sample boundary or resonance. Further research using other methods and sample shapes is required to clarify this hypothesis.
When a small amount of Ho
x ≤ 0.05 is added, the half-width of the loss maxima in the sample increases sharply while their intensity decreases (
Figure 20b). A further increase in the concentration of Ho
x= 0.05–0.20 leads to an increase in the intensity of the loss maxima, as well as an increase in the total background, while maintaining the half-width of the peaks. This is probably due to an increase in
ɛ″ and
μ″ in the microwave region as the concentration of the modifier changes. At
x = 0.20 and above, the loss maxima observed at small
x shift out of the frequency measurement window and all other loss maxima behave stochastically.
Using X-ray data from [
13] for Bi
1-xHo
xFeO
3 with
x = 0.00–0.20, as well as data obtained in this work for
x = 0.30–0.50, it is possible to detect a correlation between the relative density of the solid solution and the intensity of the loss maxima, especially the second one (
Figure 21).
In compositions with a higher relative density, as well as with a higher relative intensity of the X-ray maxima of the impurity phases, a higher level of loss maxima is observed, indicating a significant influence of the homogeneity (rather stoichiometry) of the elemental composition on the losses in the materials studied. In the case of SS with x = 0.00–0.10, the correlation shown is like that of SS with x = 0.15–0.50, but the level of maximum losses is lower in the first case. This indicates the existence of a certain boundary between the base perovskite and the impurity phases, near which an increase in the amount of impurities leads to a sharp increase in the level of losses.
It should be noted that the microstructural features at high Ho content (x = 0.30–0.50) have no visible effect on the absorption properties of the objects studied.


 ,
, 


