
MOF@chitosan Composites with Potential Antifouling Properties for Open-Environment Applications of Metal-Organic Frameworks


Abstract
:
1. Introduction
2. Material and Methods
2.1. Materials and Instrumentation
2.2. Syntheses
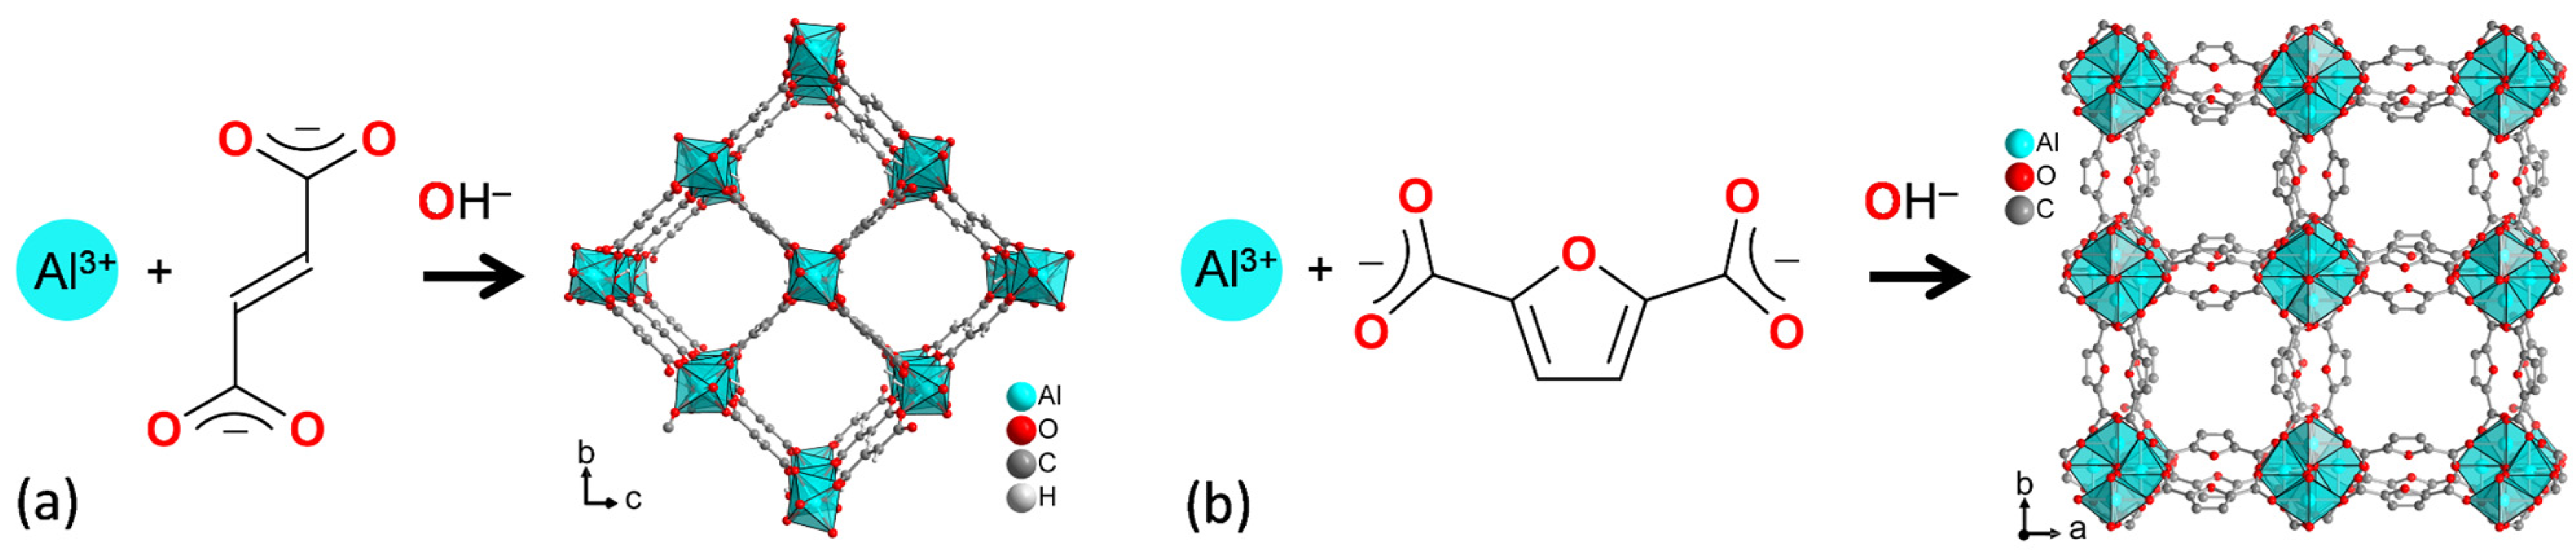
2.2.1. MIL-160 Synthesis
2.2.2. Chitosan Bead Synthesis
2.2.3. Synthesis of MOF@chitosan
2.2.4. Synthesis of MOF@PVA
2.2.5. Synthesis of MOF@Silikophen®
2.3. Antifouling Tests
3. Results and Discussion
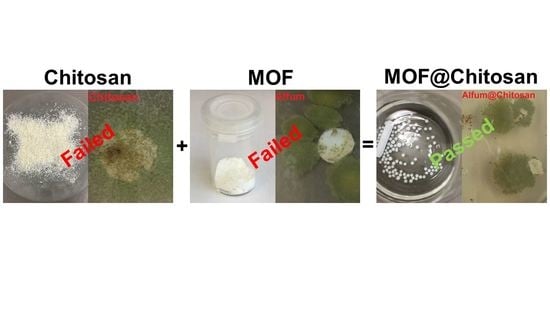
3.1. MOF@chitosan Composites
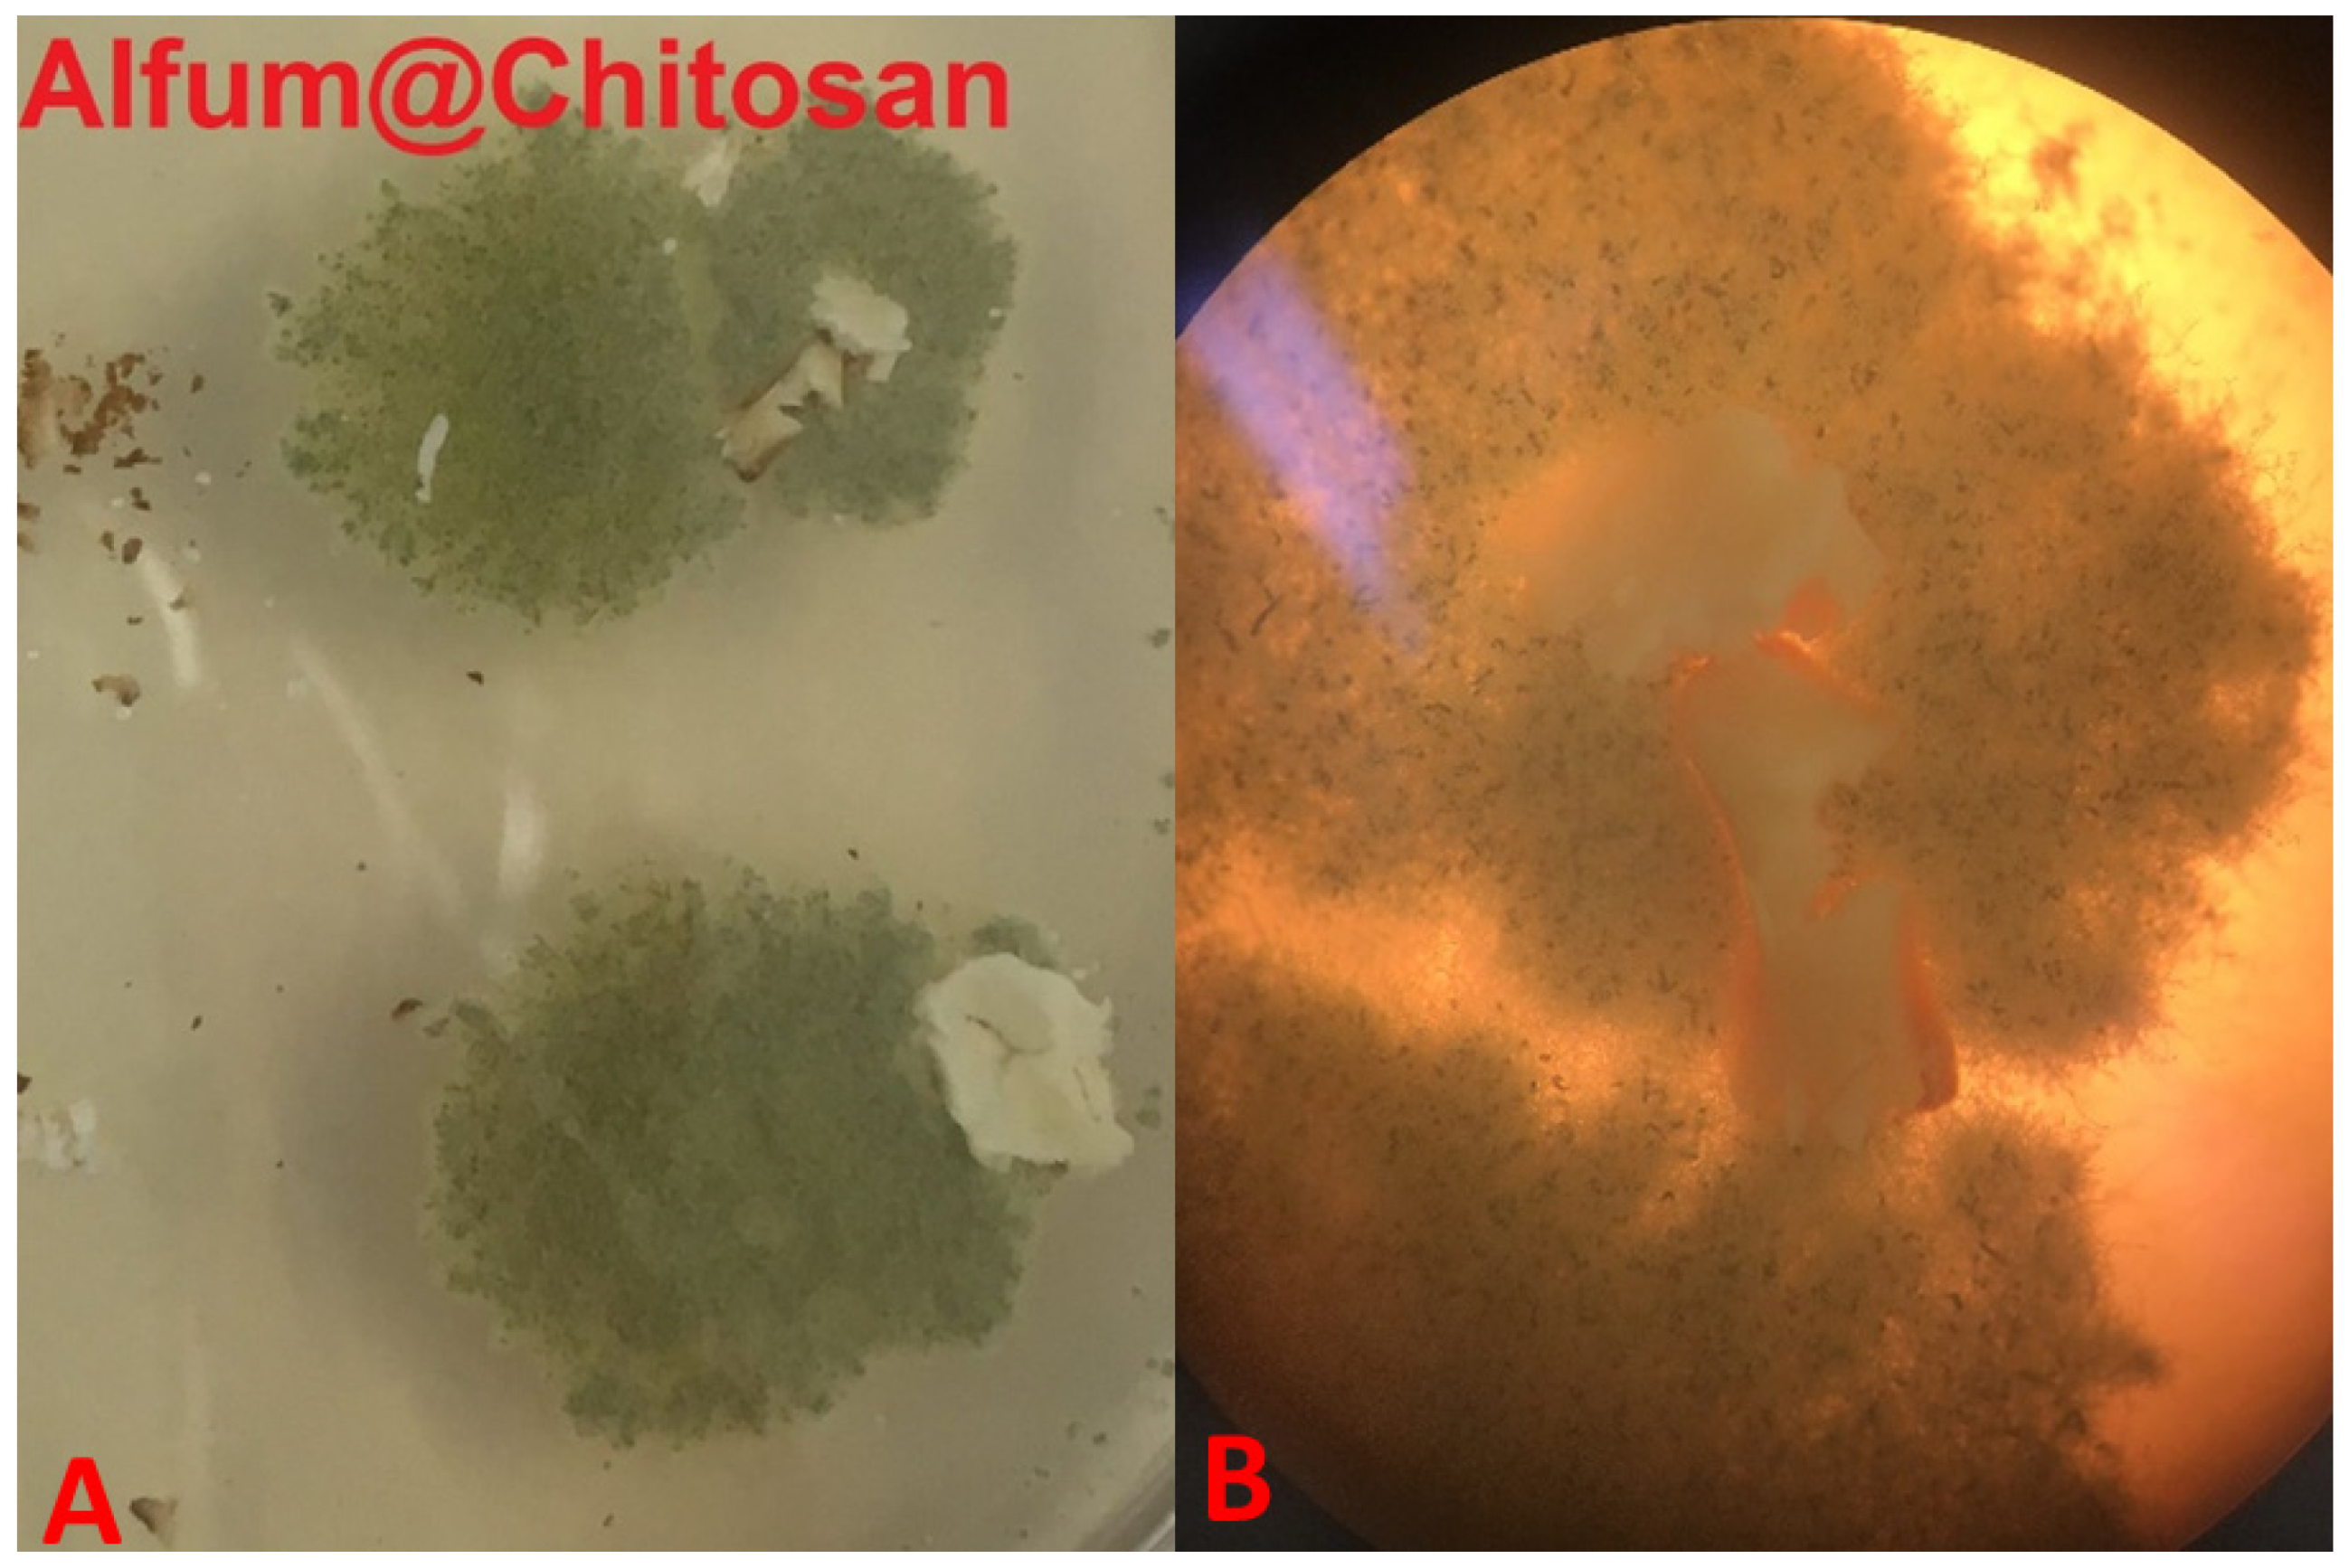
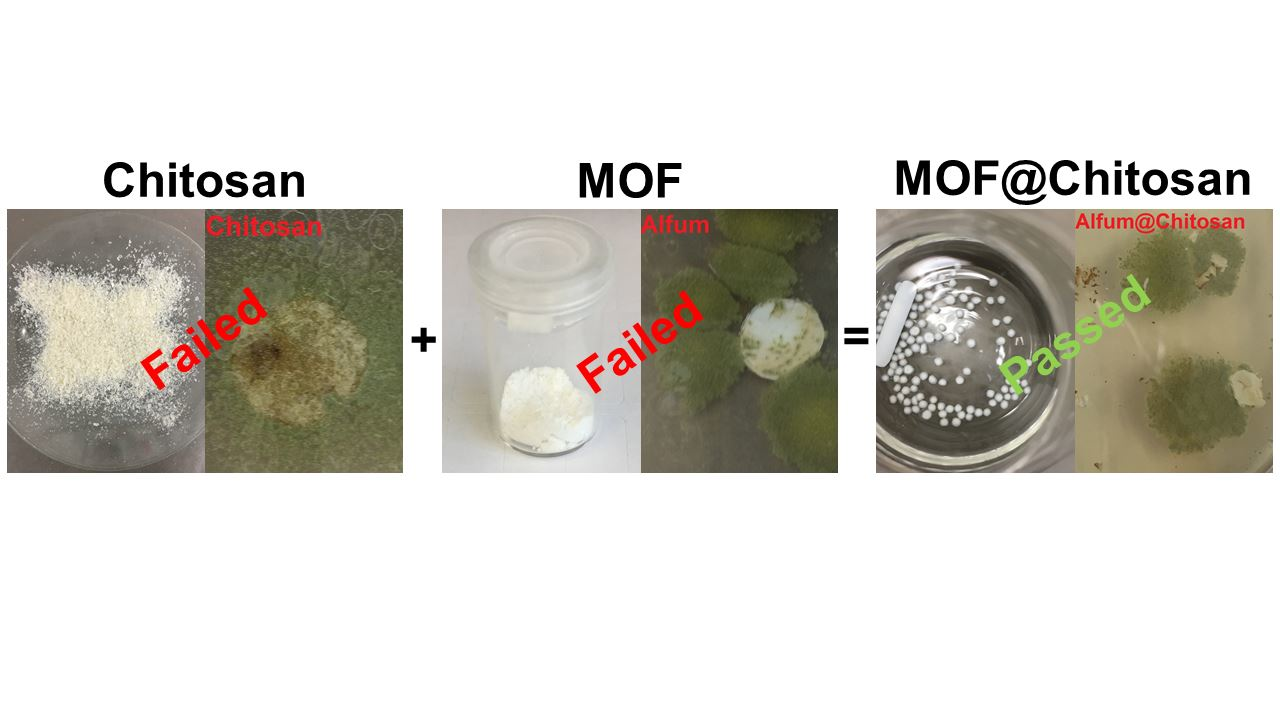
3.1.1. Alfum@chitosan
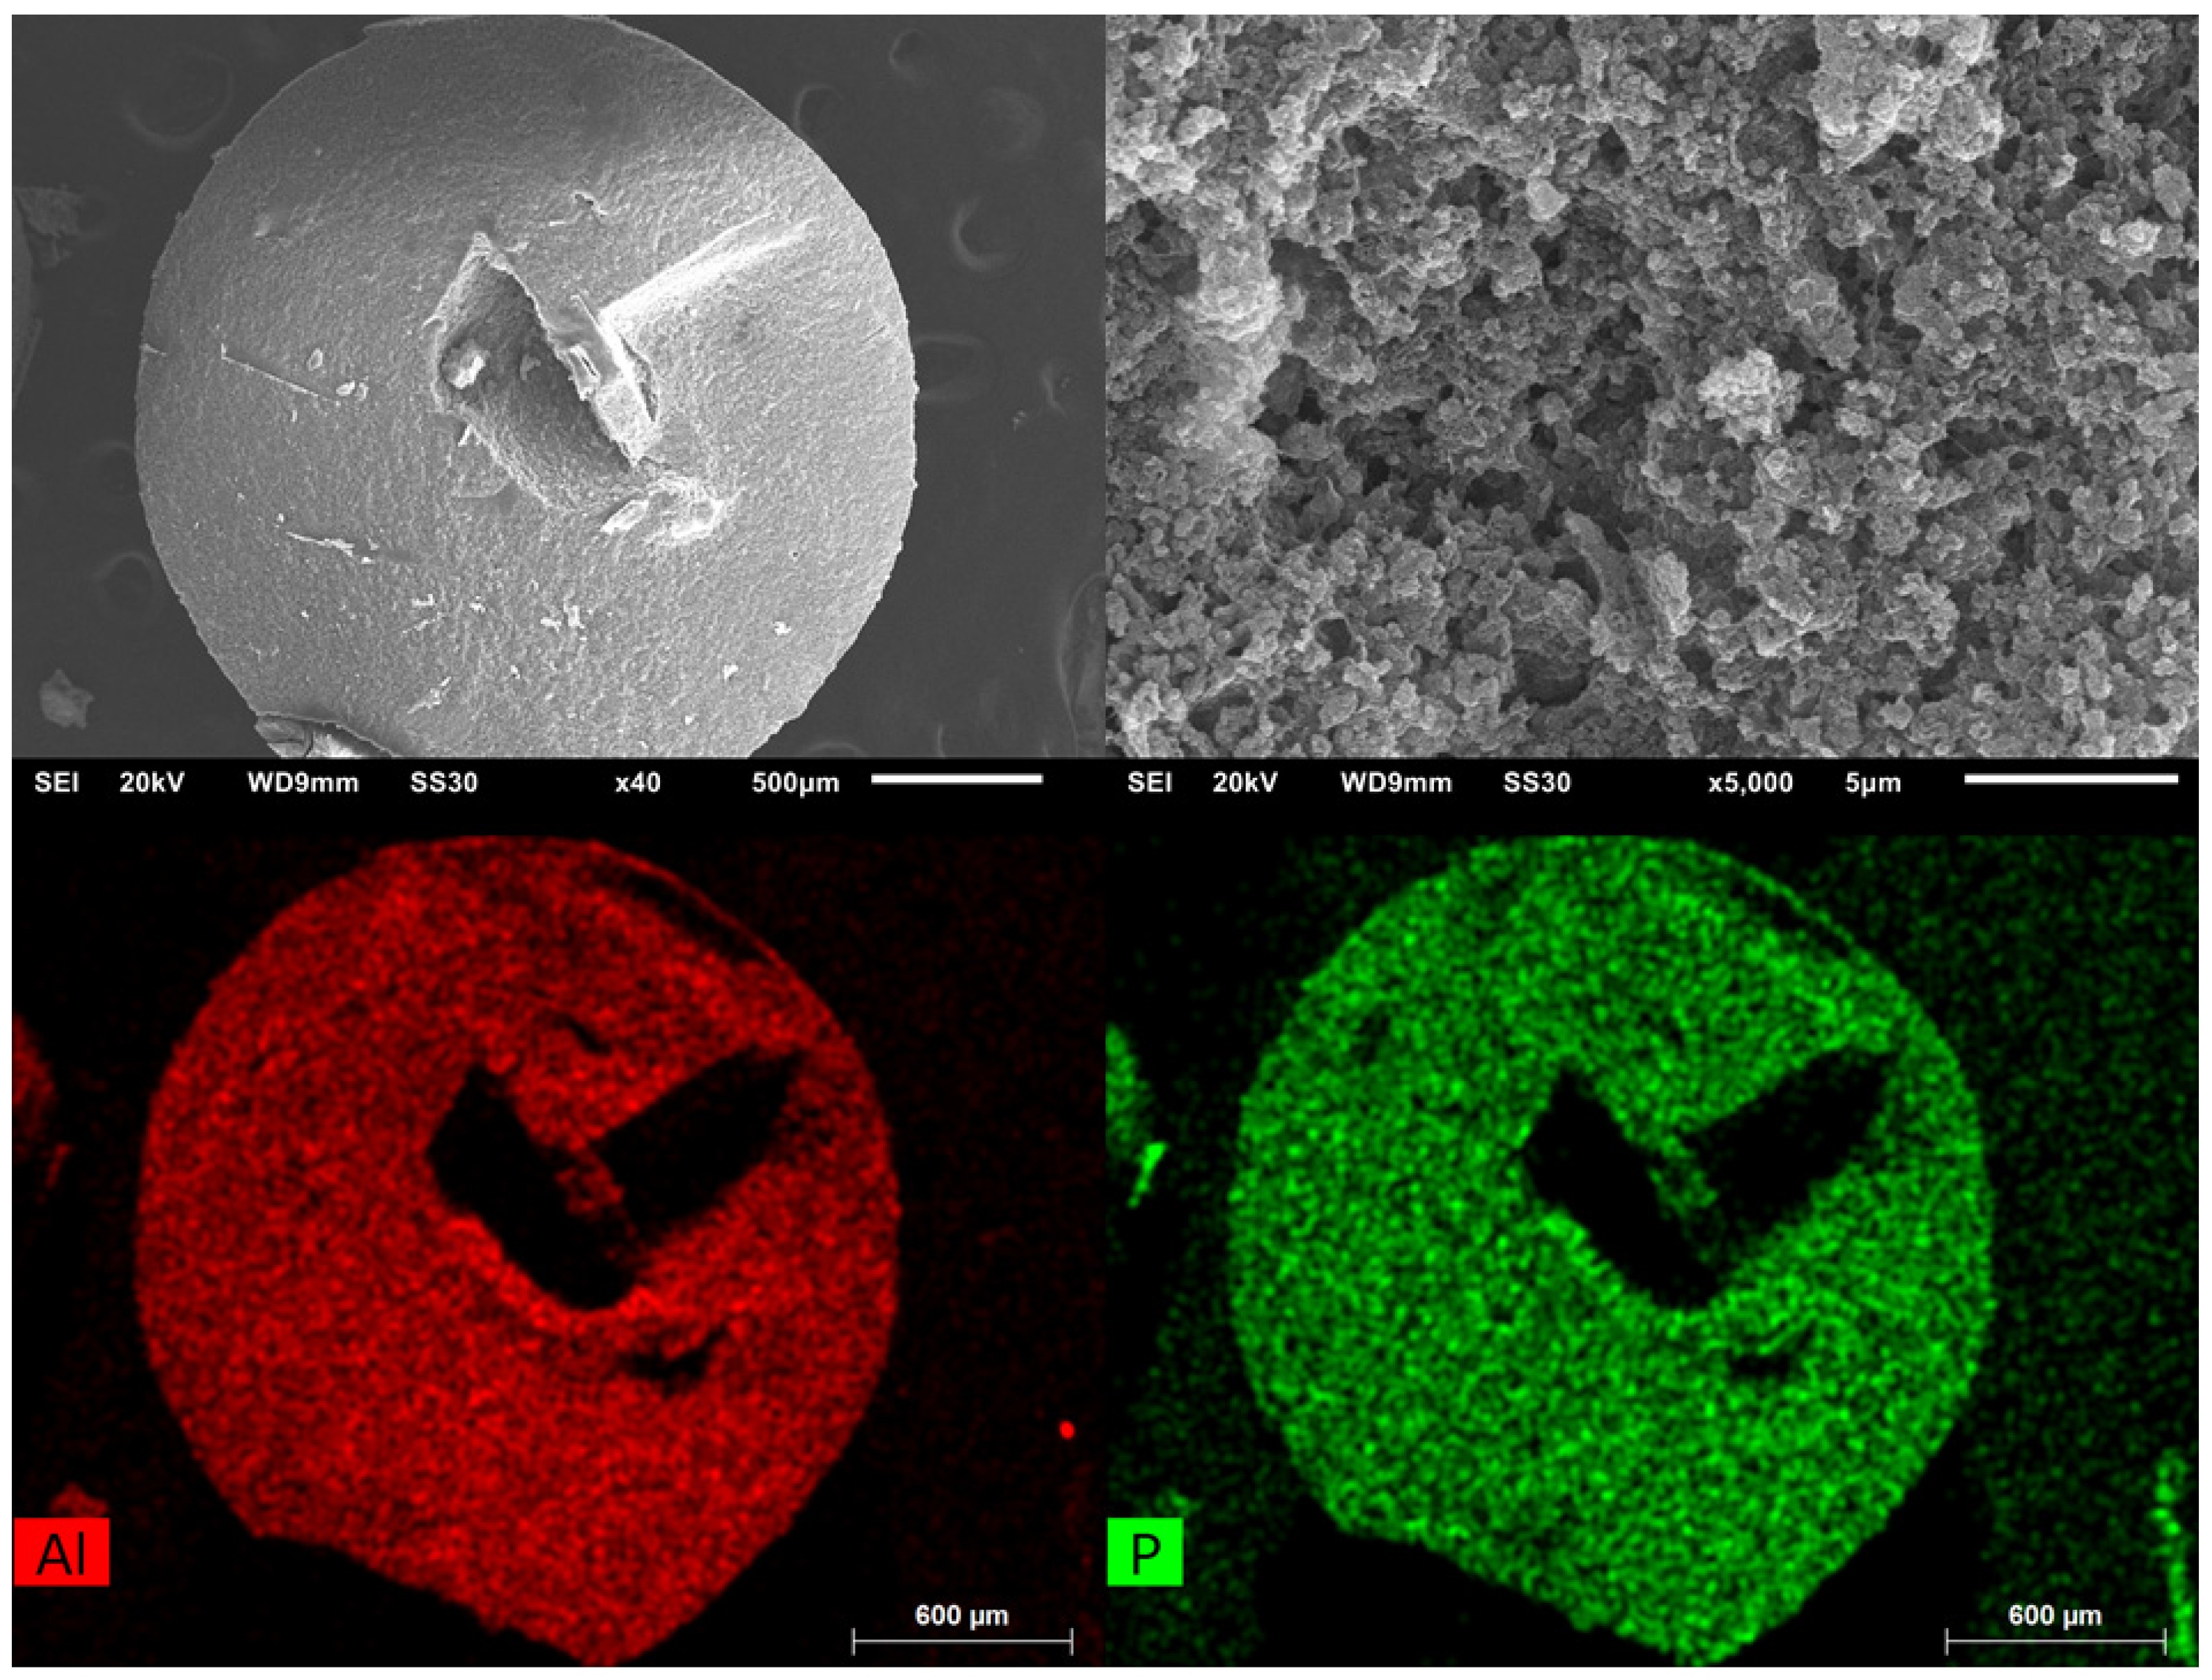
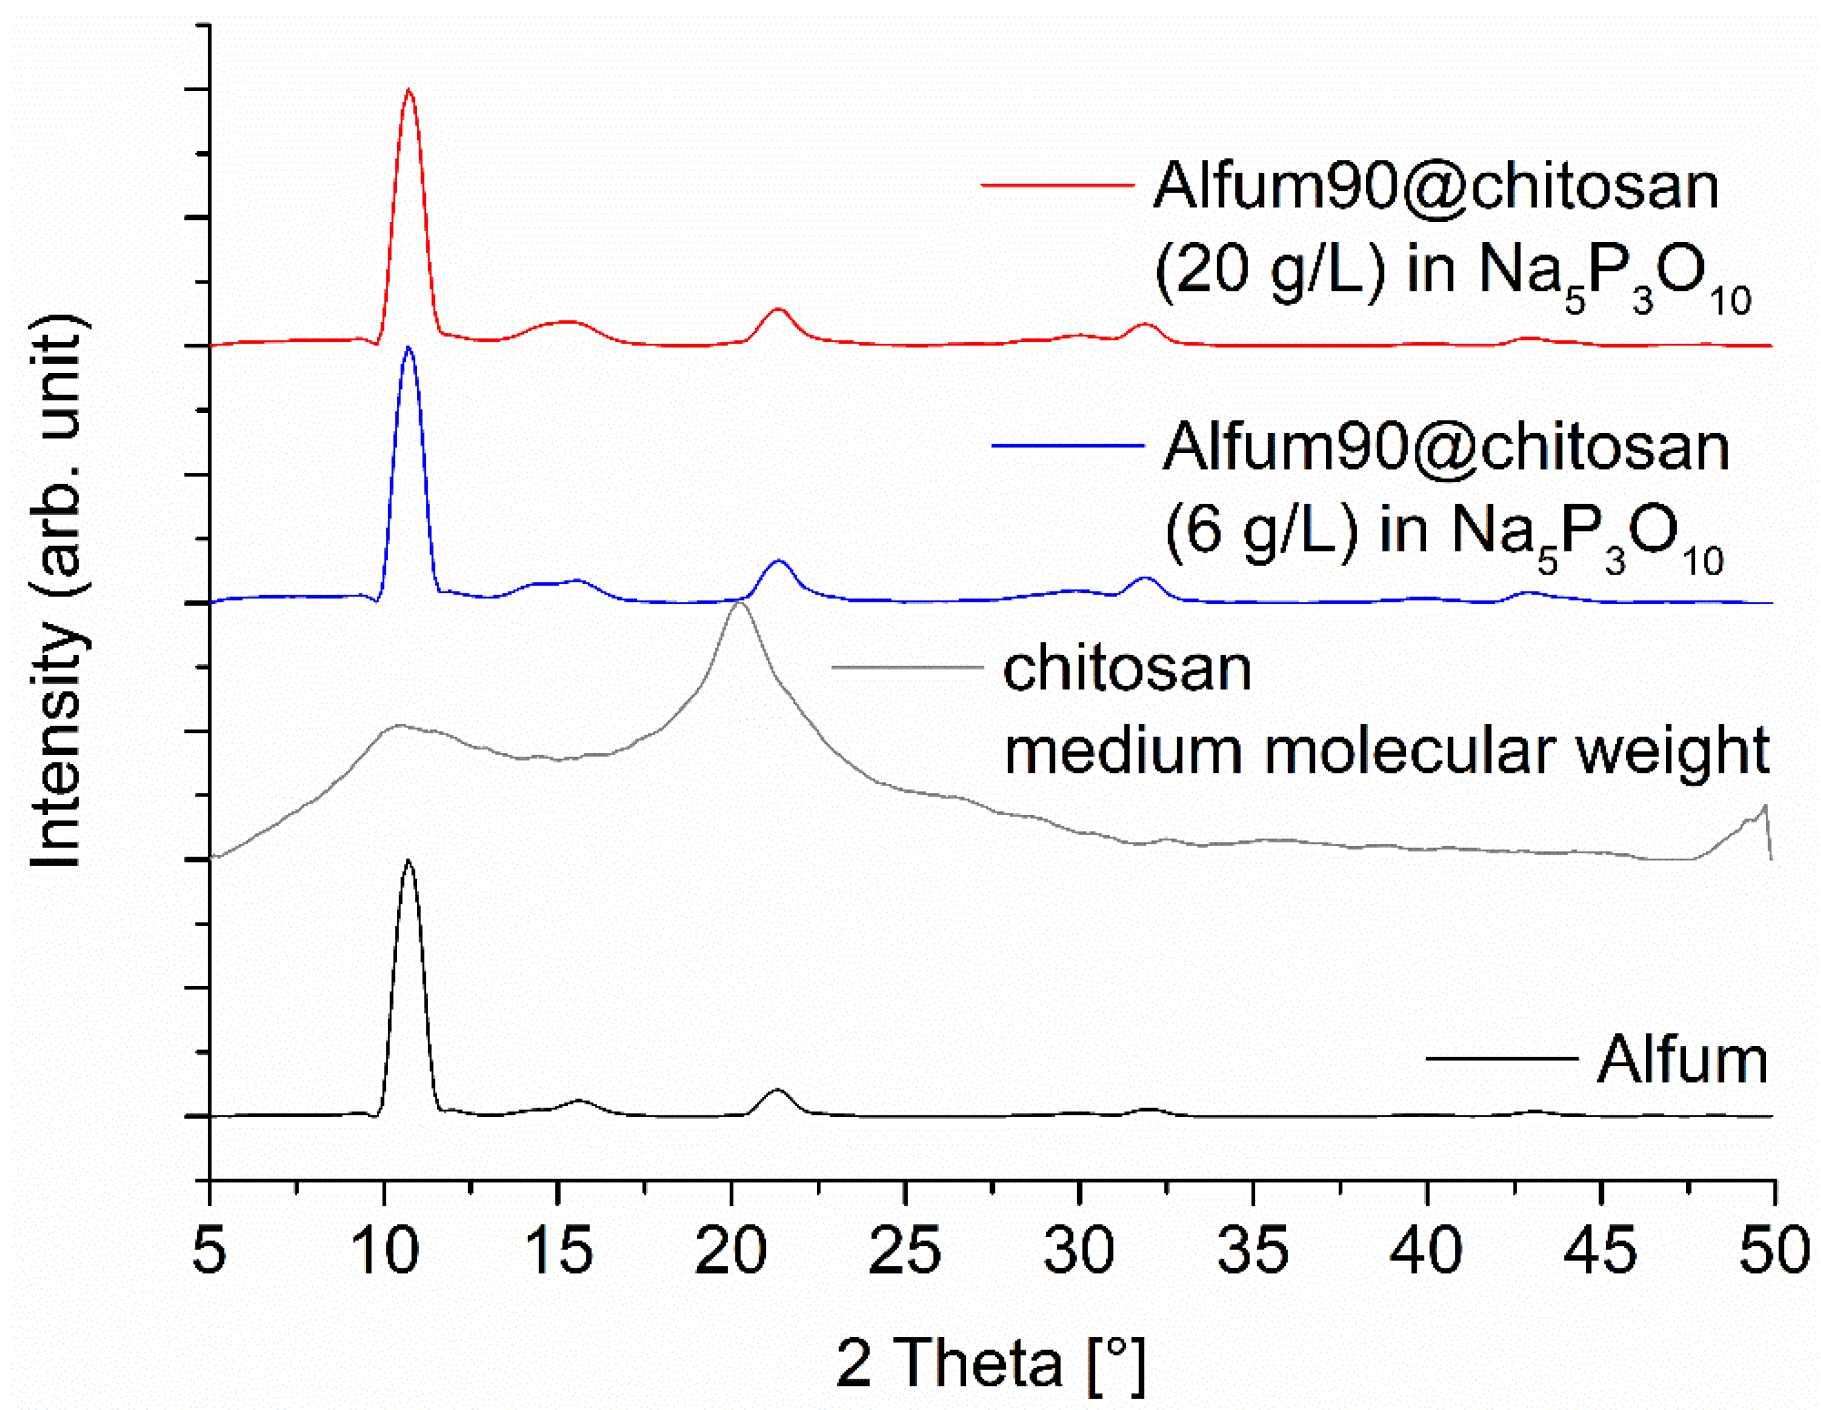
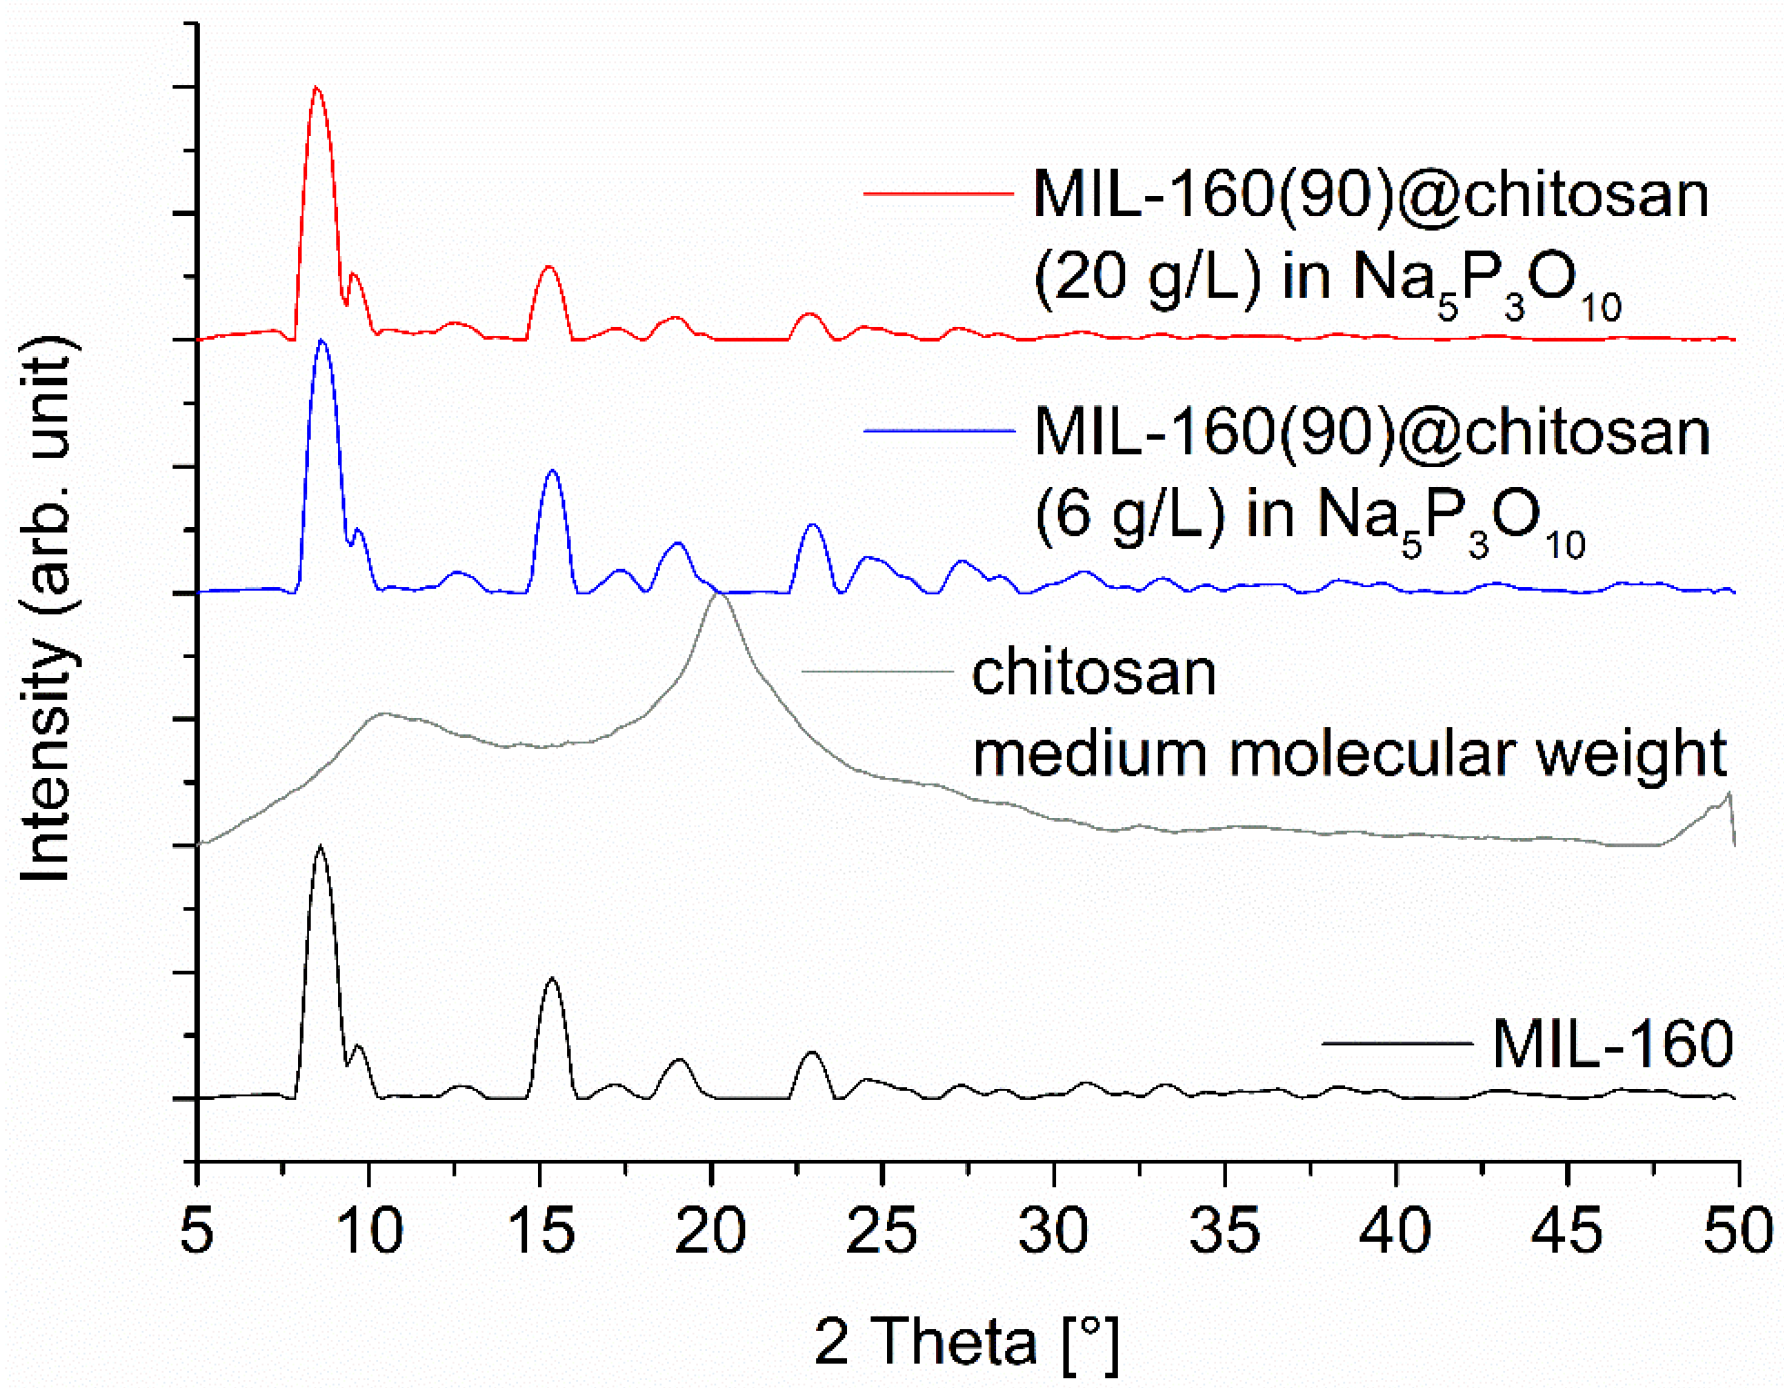
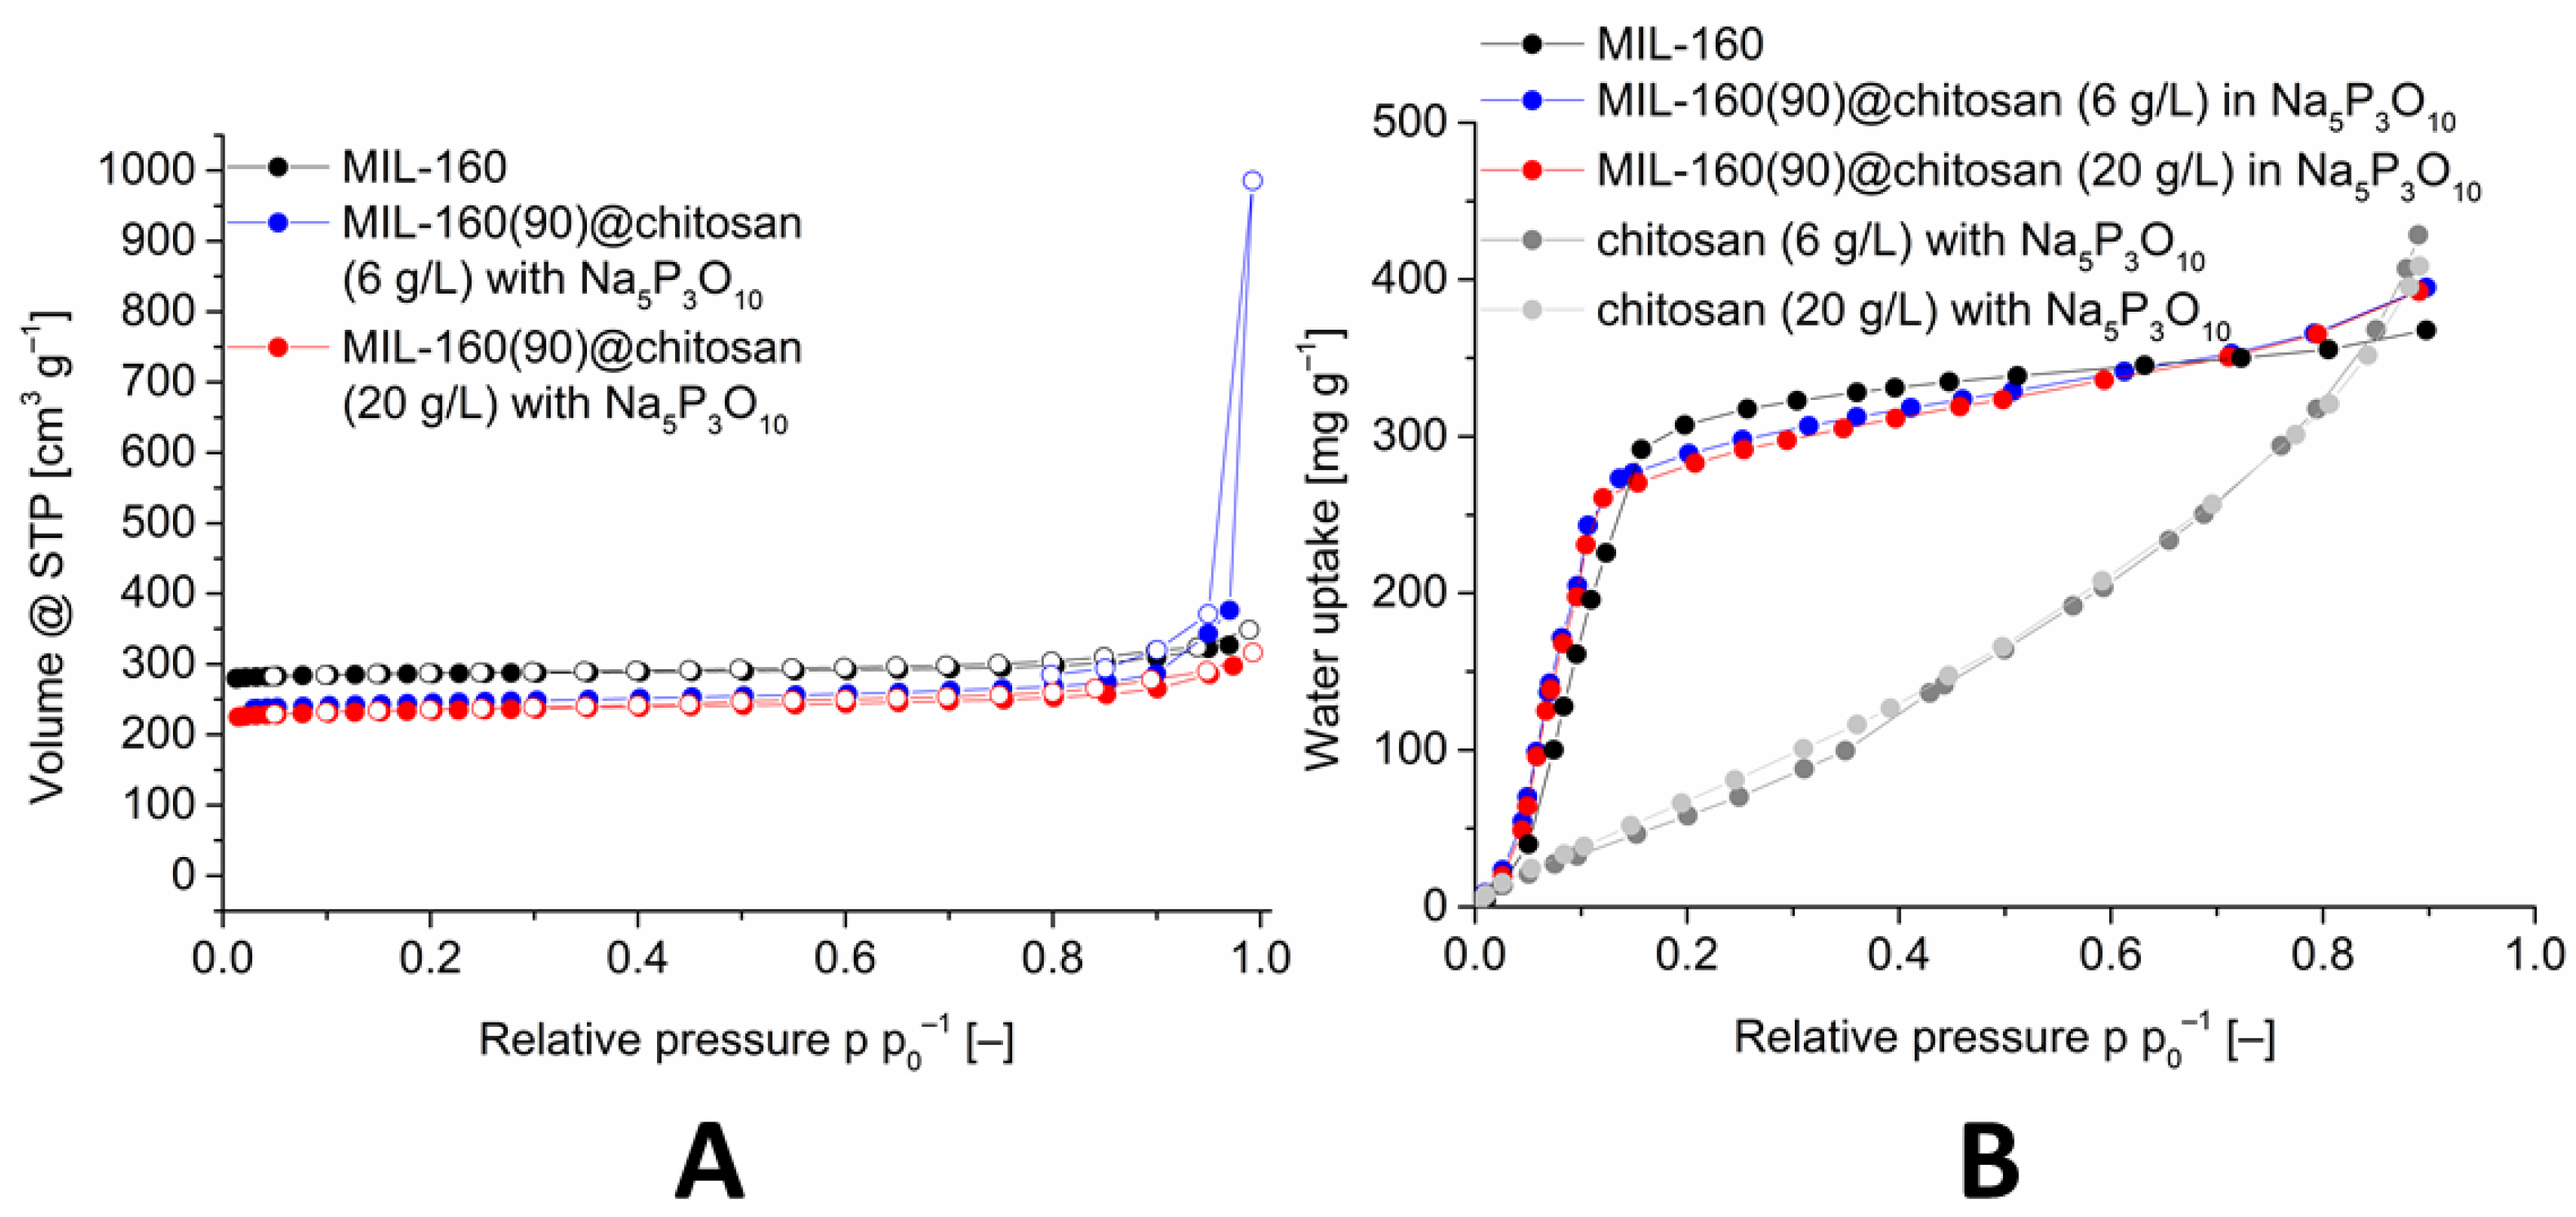
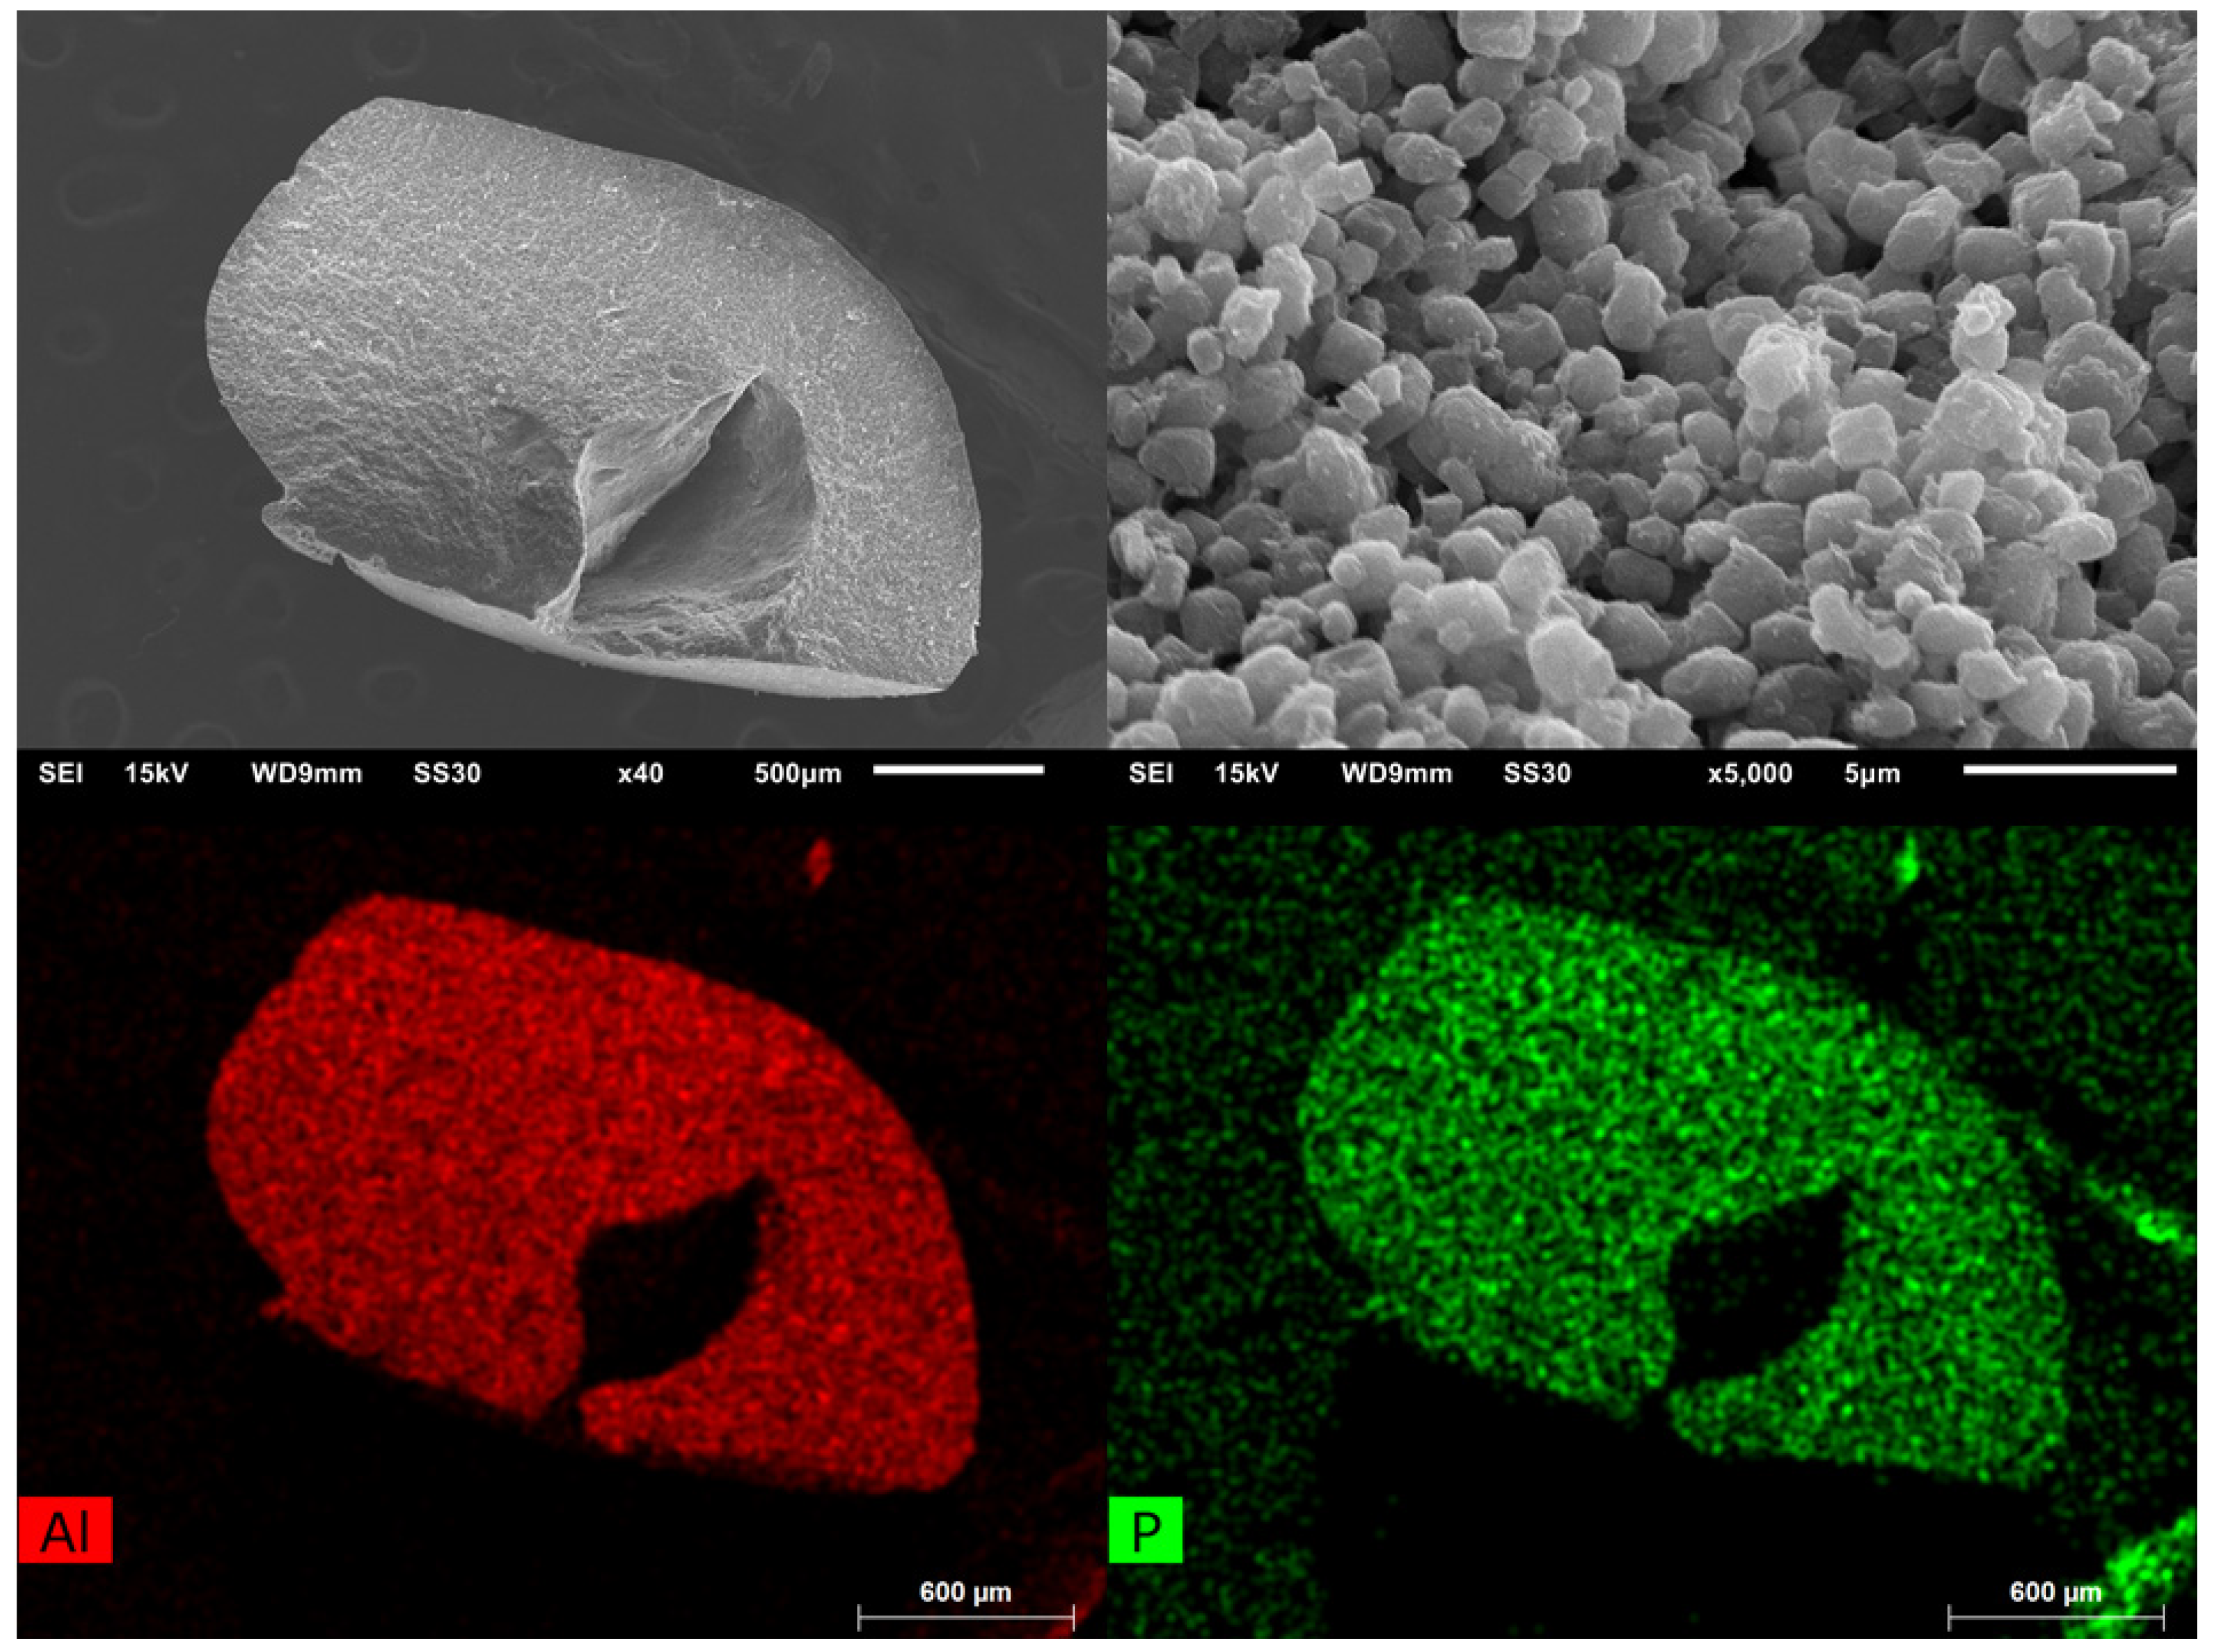
3.1.2. MIL-160@chitosan
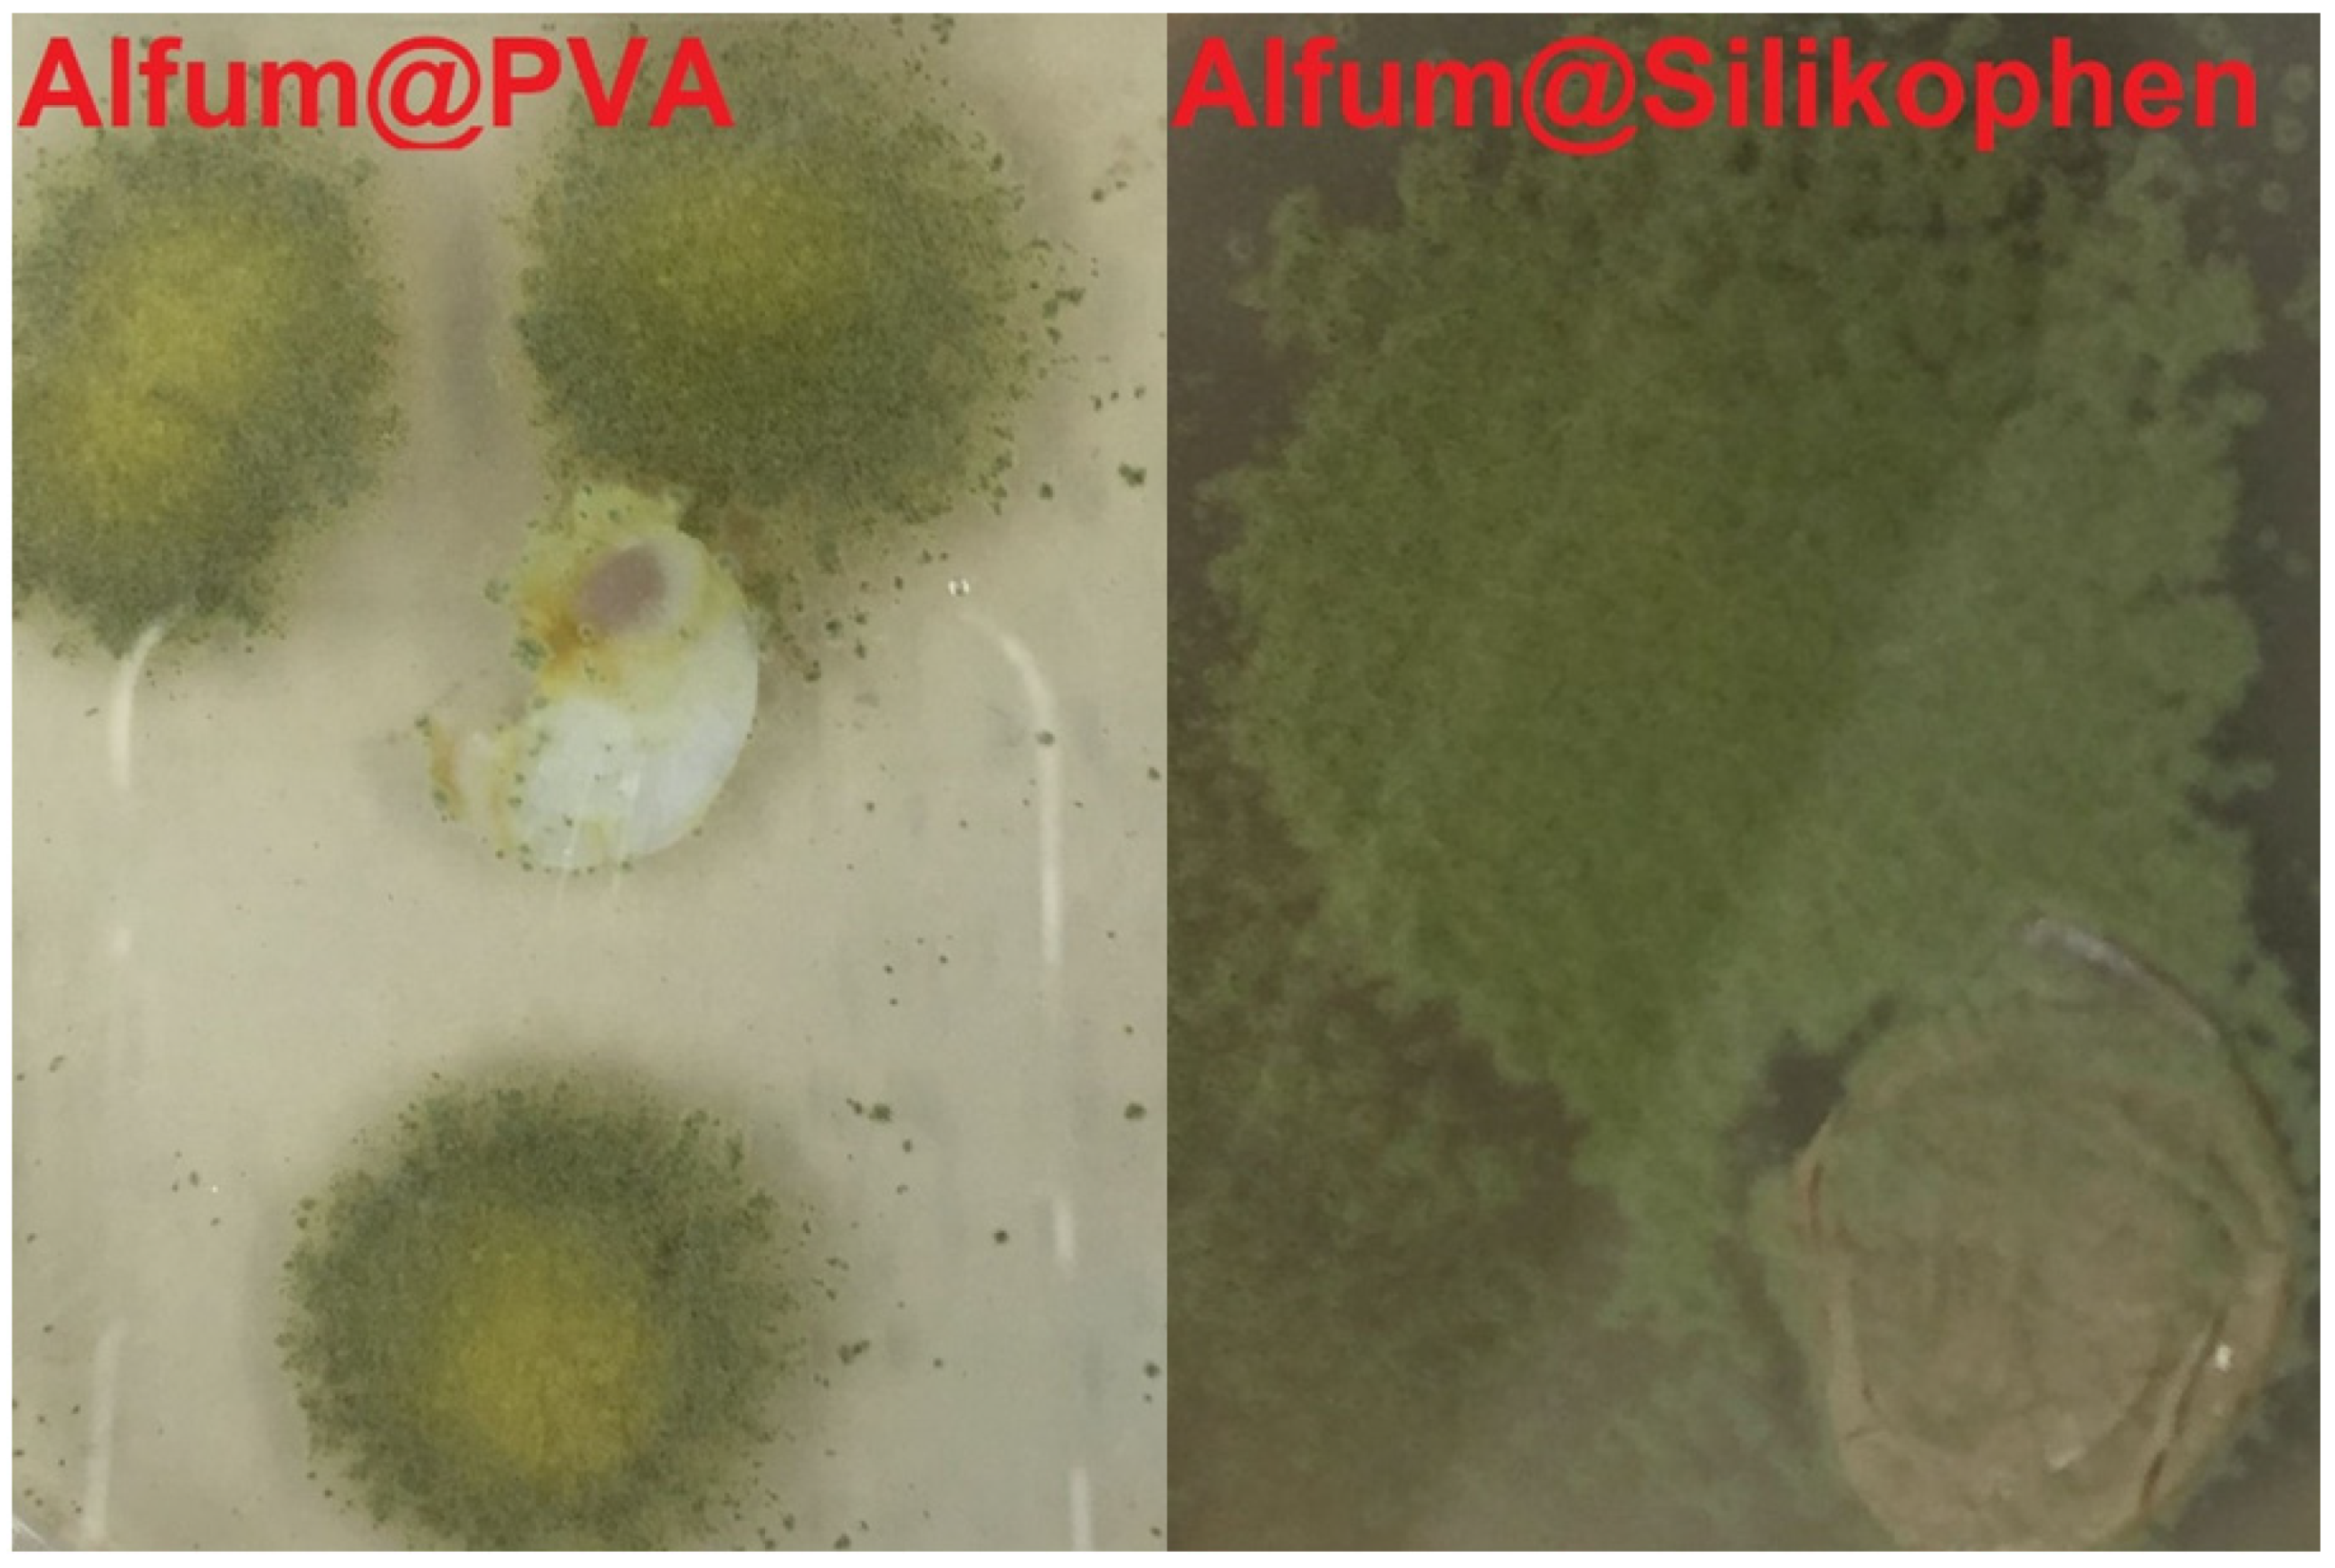
3.2. MOF@PVA Composites and MOF@Silikophen® Composites
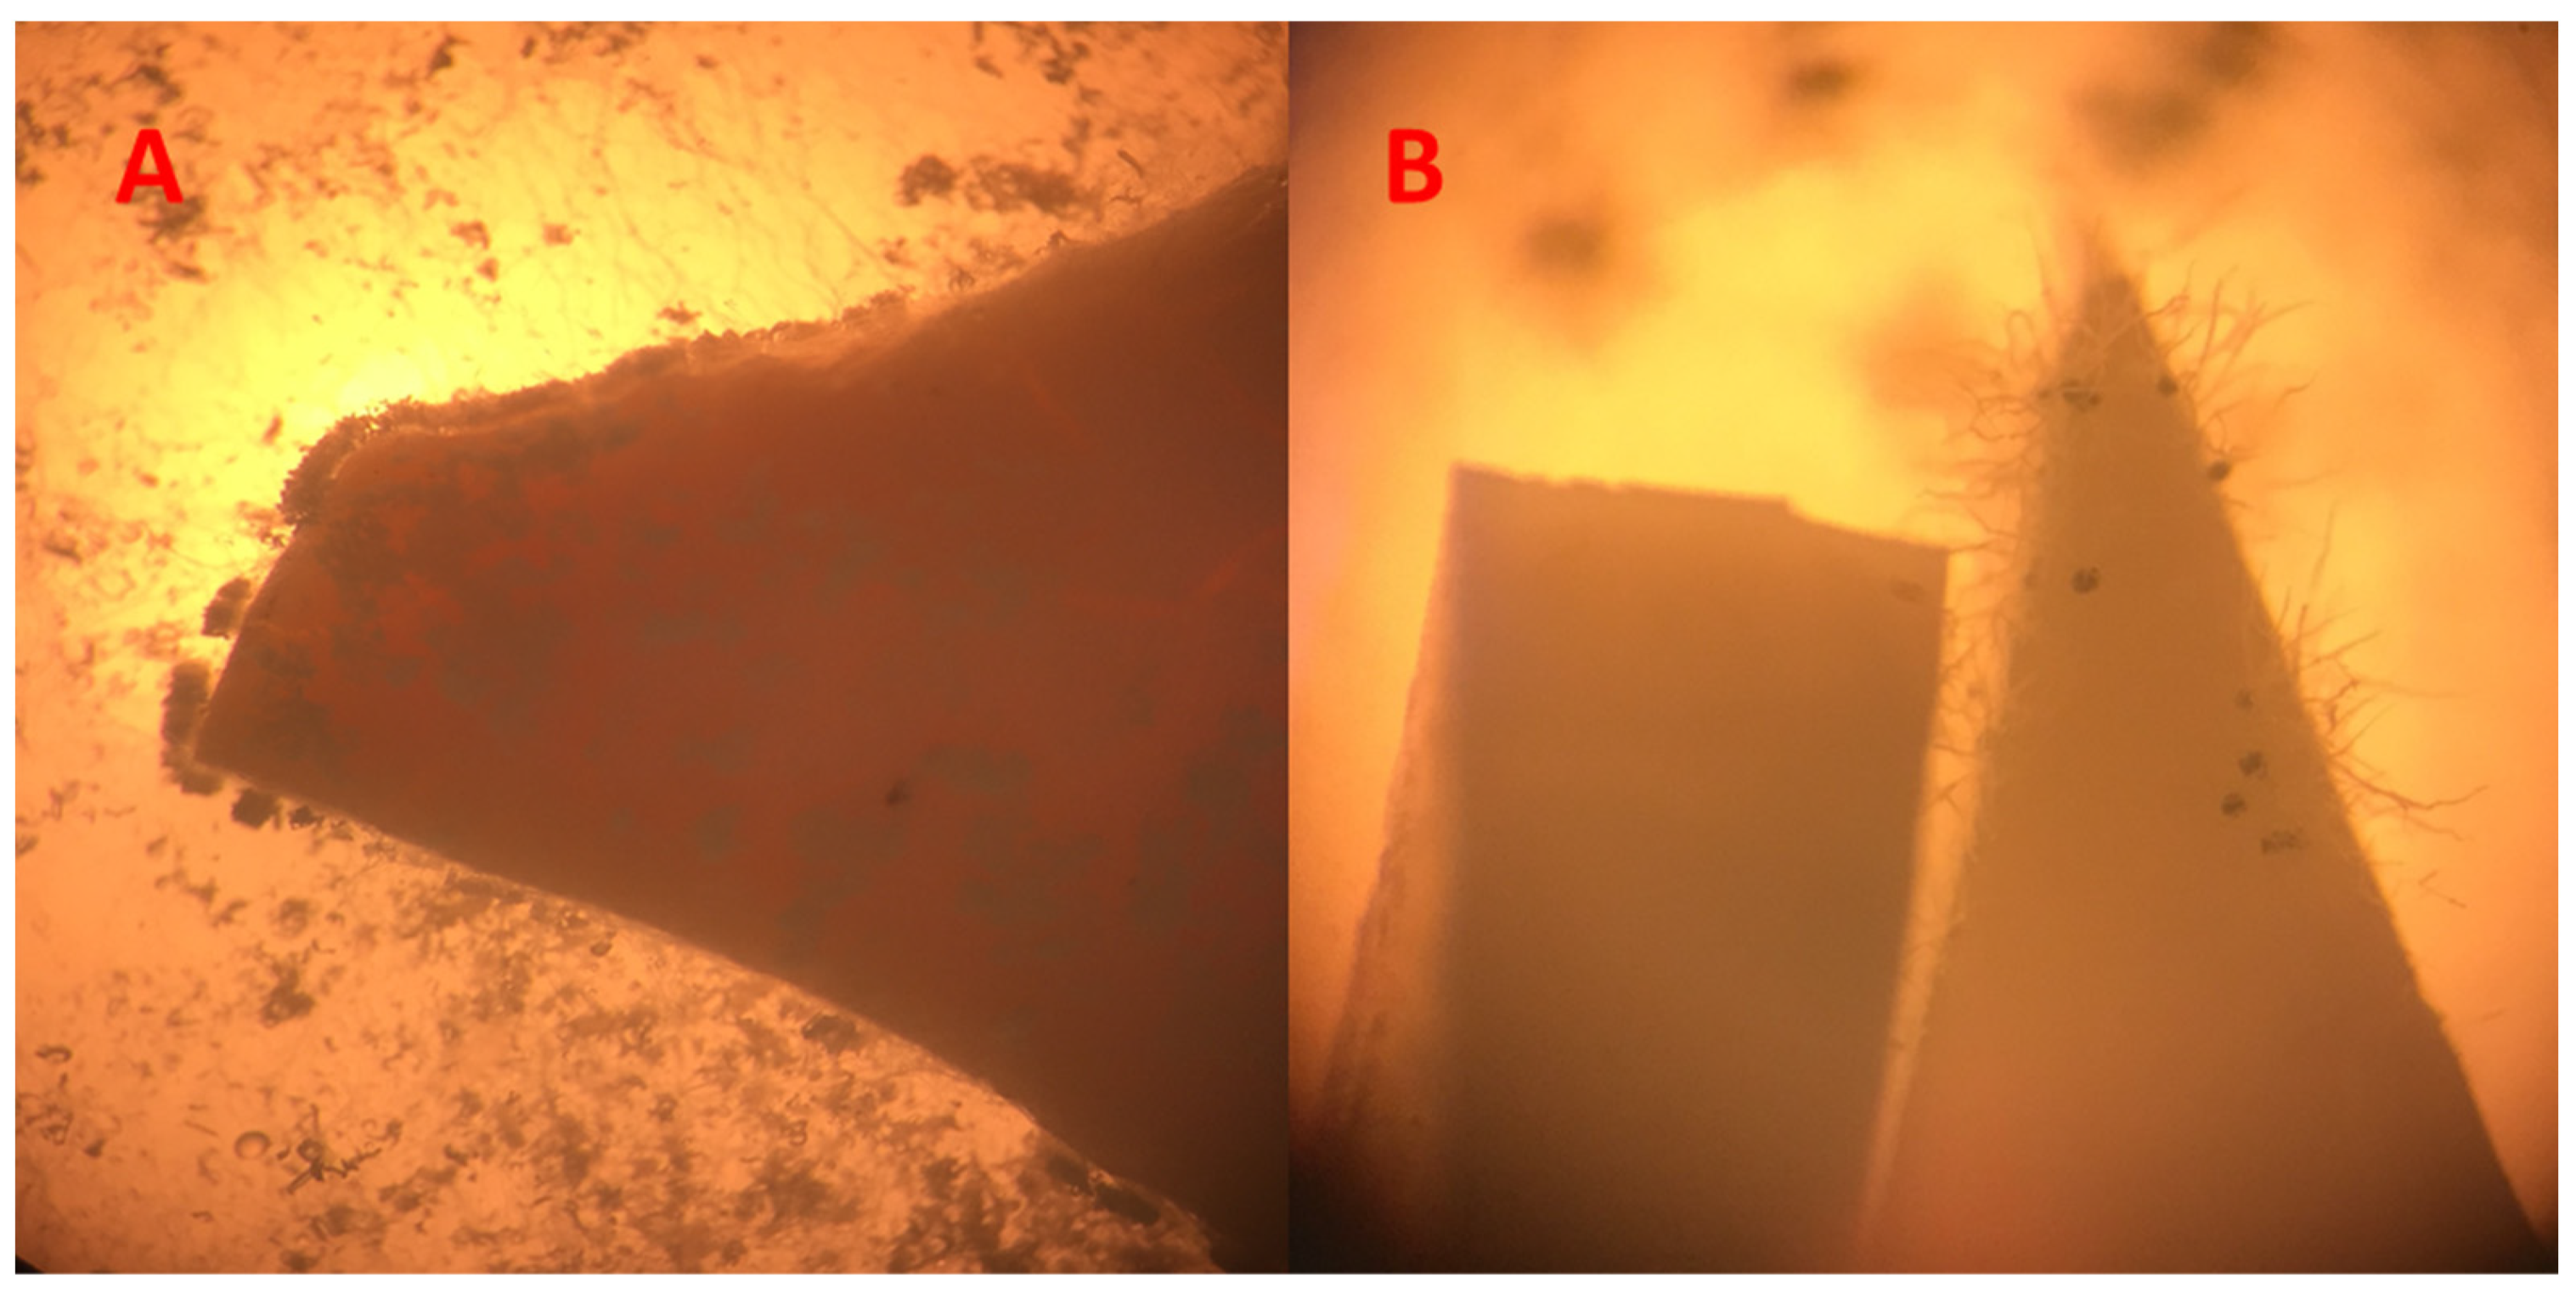
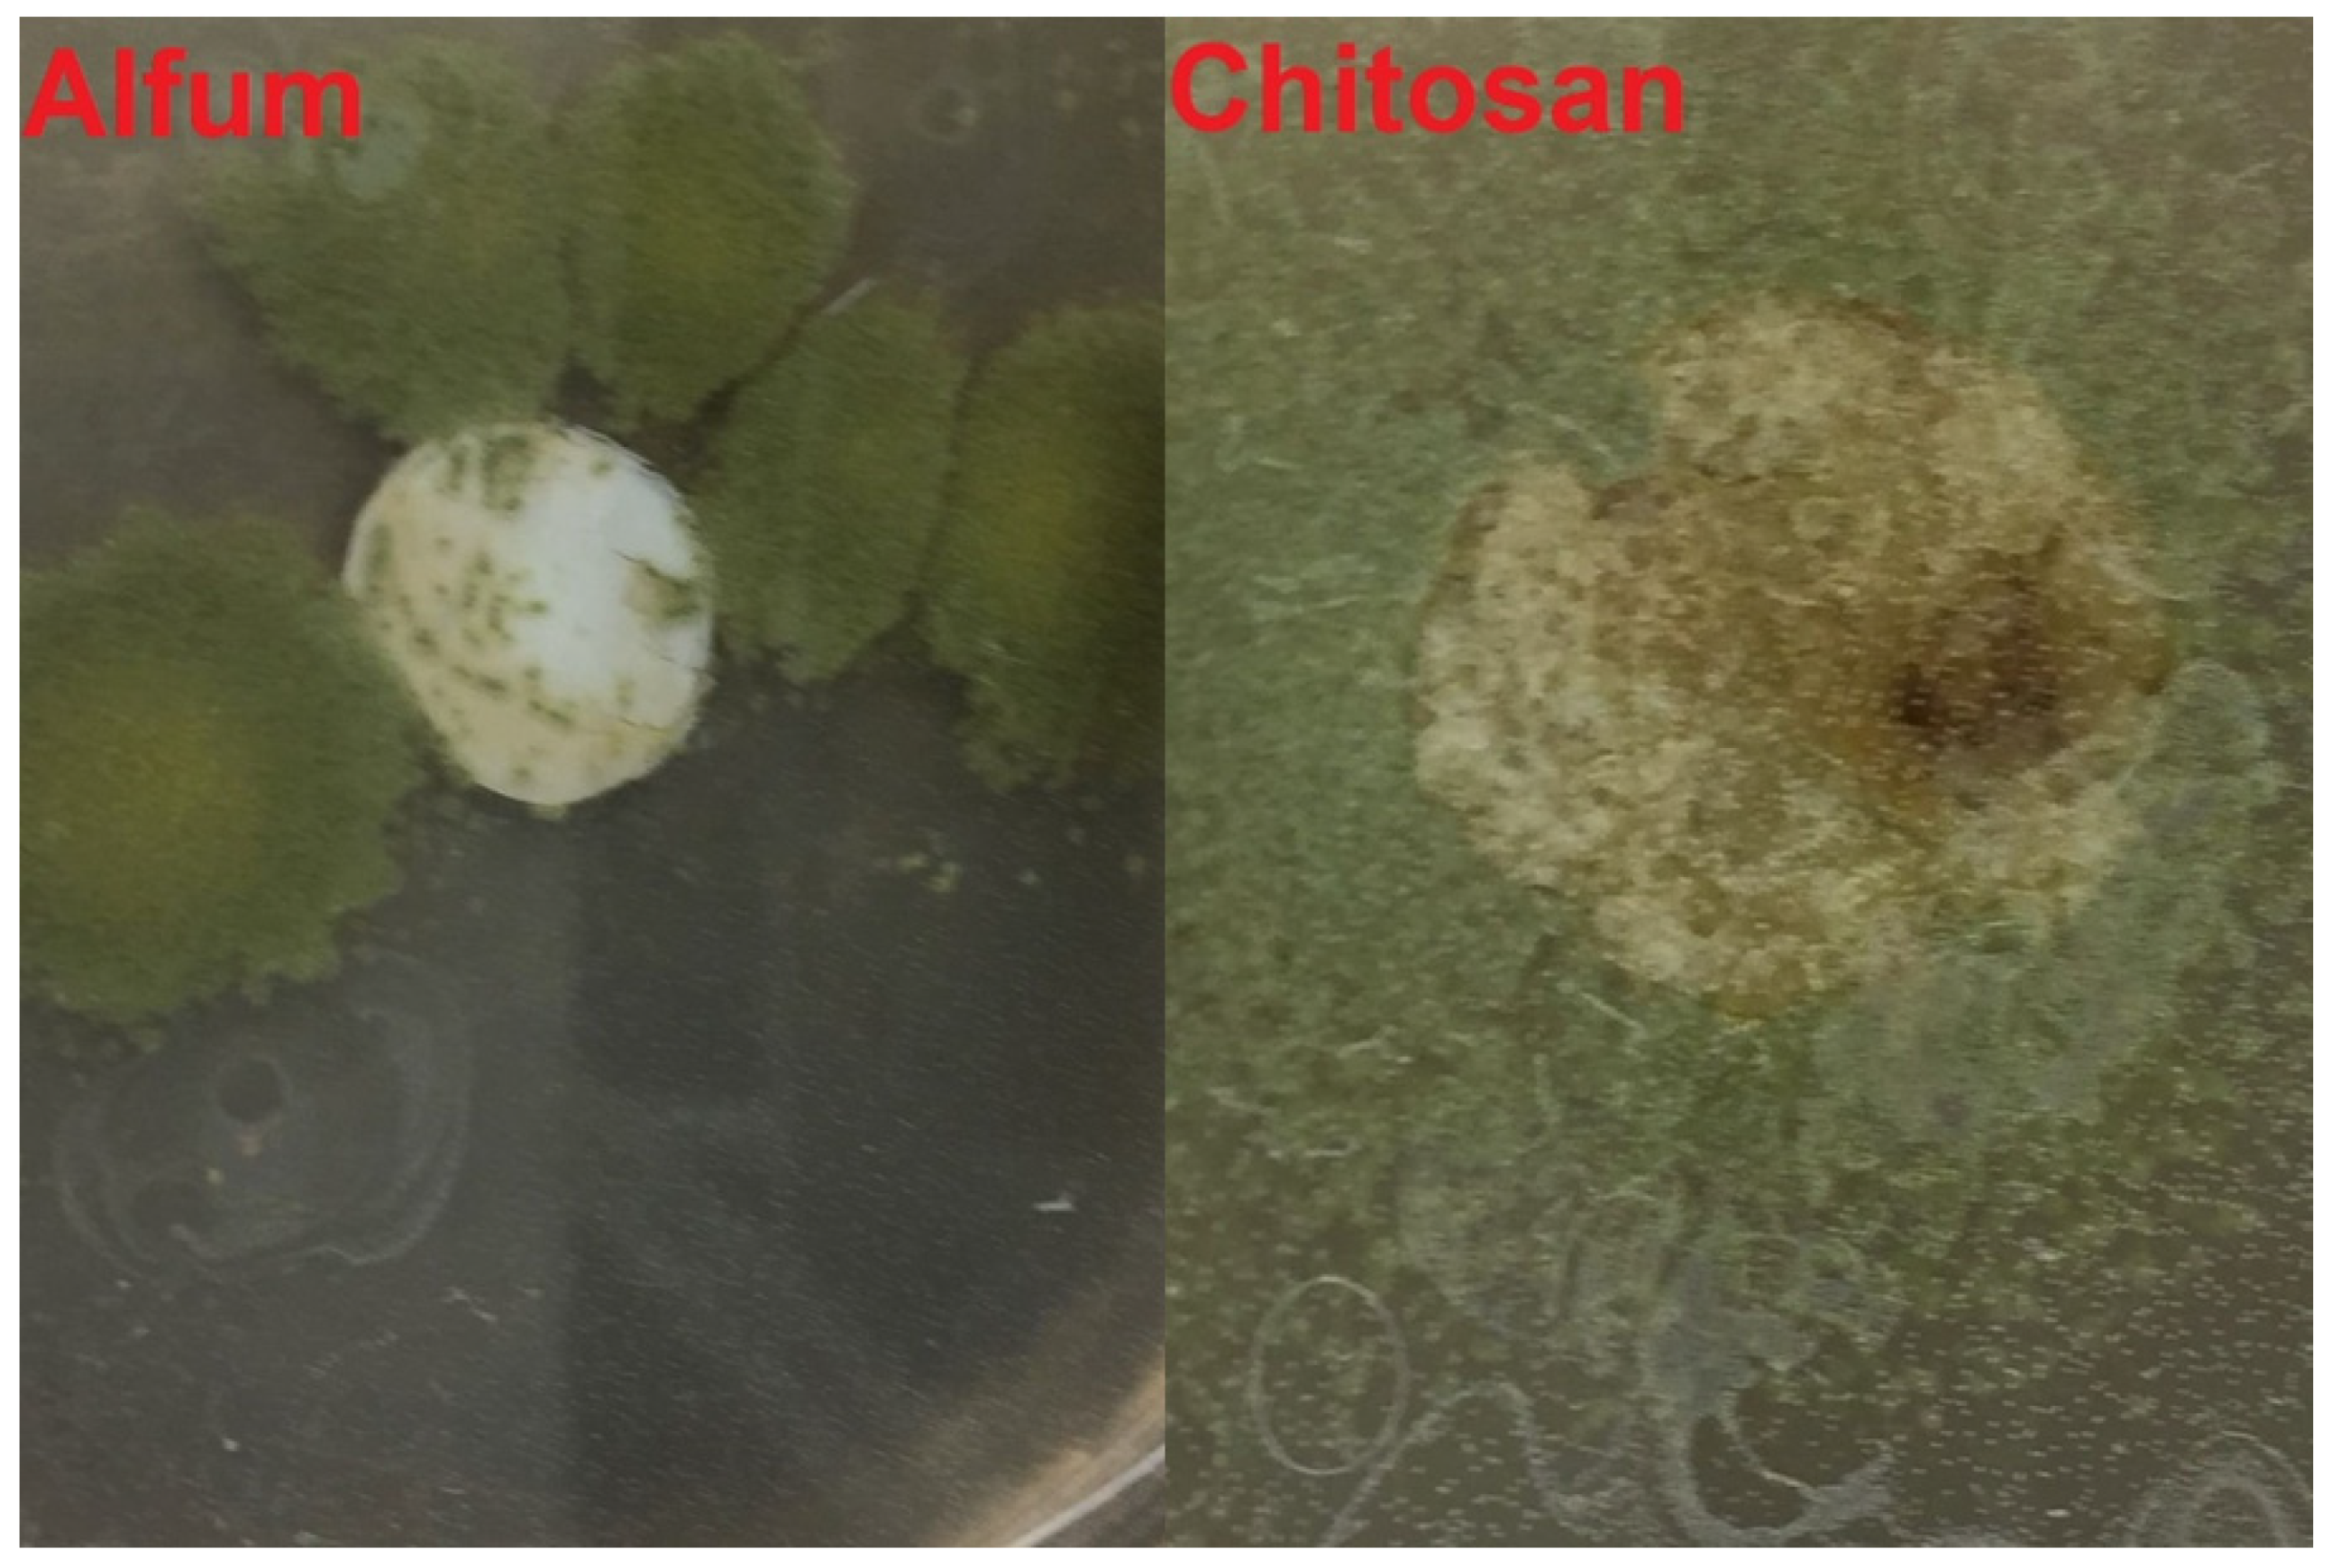
3.3. Antifouling Tests
4. Conclusions
Supplementary Materials
Author Contributions
Funding
Data Availability Statement
Conflicts of Interest
References
- Batten, S.R.; Champness, N.R.; Chen, X.-M.; Garcia-Martinez, J.; Kitagawa, S.; Öhrström, L.; O’Keeffe, M.; Paik Suh, M.; Reedijk, J. Terminology of metal–organic frameworks and coordination polymers (IUPAC Recommendations 2013). Pure Appl. Chem. 2013, 85, 1715–1724. [Google Scholar] [CrossRef] [Green Version]
- Zhou, H.-C.J.; Kitagawa, S. Metal-organic frameworks (MOFs). Chem. Soc. Rev. 2014, 43, 5415–5418. [Google Scholar] [CrossRef] [PubMed] [Green Version]
- Farha, O.K.; Hupp, J.T. Rational design, synthesis, purification, and activation of metal-organic framework materials. Acc. Chem. Res. 2010, 43, 1166–1175. [Google Scholar] [CrossRef] [PubMed] [Green Version]
- Taddei, M. When defects turn into virtues: The curious case of zirconium-based metal-organic frameworks. Coord. Chem. Rev. 2017, 343, 1–24. [Google Scholar] [CrossRef] [Green Version]
- Evans, J.D.; Garai, B.; Reinsch, H.; Li, W.; Dissegna, S.; Bon, V.; Senkovska, I.; Fischer, R.A.; Kaskel, S.; Janiak, C.; et al. Metal–organic frameworks in Germany: From synthesis to function. Coord. Chem. Rev. 2019, 380, 378–418. [Google Scholar] [CrossRef] [Green Version]
- Nuhnen, A.; Dietrich, D.; Millan, S.; Janiak, C. Role of Filler Porosity and Filler/Polymer Interface Volume in Metal-Organic Framework/Polymer Mixed-Matrix Membranes for Gas Separation. ACS Appl. Mater. Interfaces 2018, 10, 33589–33600. [Google Scholar] [CrossRef]
- Aykac Ozen, H.; Ozturk, B. Gas separation characteristic of mixed matrix membrane prepared by MOF-5 including different metals. Sep. Purif. Technol. 2019, 211, 514–521. [Google Scholar] [CrossRef]
- He, Y.; Zhou, W.; Qian, G.; Chen, B. Methane storage in metal-organic frameworks. Chem. Soc. Rev. 2014, 43, 5657–5678. [Google Scholar] [CrossRef]
- Karimzadeh, Z.; Javanbakht, S.; Namazi, H. Carboxymethylcellulose/MOF-5/Graphene oxide bio-nanocomposite as antibacterial drug nanocarrier agent. BioImpacts 2019, 9, 5–13. [Google Scholar] [CrossRef]
- Abánades Lázaro, I.; Forgan, R.S. Application of zirconium MOFs in drug delivery and biomedicine. Coord. Chem. Rev. 2019, 380, 230–259. [Google Scholar] [CrossRef] [Green Version]
- Rogge, S.M.J.; Bavykina, A.; Hajek, J.; Garcia, H.; Olivos-Suarez, A.I.; Sepúlveda-Escribano, A.; Vimont, A.; Clet, G.; Bazin, P.; Kapteijn, F.; et al. Metal-organic and covalent organic frameworks as single-site catalysts. Chem. Soc. Rev. 2017, 46, 3134–3184. [Google Scholar] [CrossRef] [PubMed] [Green Version]
- Solovyeva, M.V.; Gordeeva, L.G.; Aristov, Y.I. “MIL-101(Cr)–methanol” as working pair for adsorption heat transformation cycles: Adsorbent shaping, adsorption equilibrium and dynamics. Energy Convers. Manag. 2019, 182, 299–306. [Google Scholar] [CrossRef]
- Hastürk, E.; Ernst, S.-J.; Janiak, C. Recent advances in adsorption heat transformation focusing on the development of adsorbent materials. Curr. Opin. Chem. Eng. 2019, 24, 26–36. [Google Scholar] [CrossRef]
- Gordeeva, L.G.; Aristov, Y.I. Adsorptive heat storage and amplification: New cycles and adsorbents. Energy 2019, 167, 440–453. [Google Scholar] [CrossRef]
- Liu, X.; Wang, X.; Kapteijn, F. Water and Metal-Organic Frameworks: From Interaction toward Utilization. Chem. Rev. 2020, 120, 8303–8377. [Google Scholar] [CrossRef] [PubMed]
- Steinert, D.M.; Ernst, S.-J.; Henninger, S.K.; Janiak, C. Metal-Organic Frameworks as Sorption Materials for Heat Transformation Processes. Eur. J. Inorg. Chem. 2020, 2020, 4502–4515. [Google Scholar] [CrossRef]
- Jeremias, F.; Fröhlich, D.; Janiak, C.; Henninger, S.K. Water and methanol adsorption on MOFs for cycling heat transformation processes. New J. Chem. 2014, 38, 1846–1852. [Google Scholar] [CrossRef] [Green Version]
- Rieth, A.J.; Wright, A.M.; Rao, S.; Kim, H.; LaPotin, A.D.; Wang, E.N.; Dincă, M. Tunable Metal-Organic Frameworks Enable High-Efficiency Cascaded Adsorption Heat Pumps. J. Am. Chem. Soc 2018, 140, 17591–17596. [Google Scholar] [CrossRef] [Green Version]
- Elsayed, E.; AL-Dadah, R.; Mahmoud, S.; Elsayed, A.; Anderson, P.A. Aluminium fumarate and CPO-27(Ni) MOFs: Characterization and thermodynamic analysis for adsorption heat pump applications. Appl. Therm. Eng. 2016, 99, 802–812. [Google Scholar] [CrossRef]
- AL-Dadah, R.; Mahmoud, S.; Elsayed, E.; Youssef, P.; Al-Mousawi, F. Metal-organic framework materials for adsorption heat pumps. Energy 2020, 190, 116356. [Google Scholar] [CrossRef]
- O’Neill, L.D.; Zhang, H.; Bradshaw, D. Macro-/microporous MOF composite beads. J. Mater. Chem. 2010, 20, 5720. [Google Scholar] [CrossRef]
- Rowe, M.D.; Thamm, D.H.; Kraft, S.L.; Boyes, S.G. Polymer-modified gadolinium metal-organic framework nanoparticles used as multifunctional nanomedicines for the targeted imaging and treatment of cancer. Biomacromolecules 2009, 10, 983–993. [Google Scholar] [CrossRef] [PubMed]
- Hastürk, E.; Höfert, S.-P.; Topalli, B.; Schlüsener, C.; Janiak, C. Shaping of MOFs via freeze-casting method with hydrophilic polymers and their effect on textural properties. Microporous Mesoporous Mater. 2020, 295, 109907. [Google Scholar] [CrossRef]
- Hastürk, E.; Schlüsener, C.; Quodbach, J.; Schmitz, A.; Janiak, C. Shaping of metal-organic frameworks into mechanically stable monoliths with poly(vinyl alcohol) by phase separation technique. Microporous Mesoporous Mater. 2019, 280, 277–287. [Google Scholar] [CrossRef]
- Gökpinar, S.; Ernst, S.-J.; Hastürk, E.; Möllers, M.; El Aita, I.; Wiedey, R.; Tannert, N.; Nießing, S.; Abdpour, S.; Schmitz, A.; et al. Air-Con Metal–Organic Frameworks in Binder Composites for Water Adsorption Heat Transformation Systems. Ind. Eng. Chem. Res. 2019, 58, 21493–21503. [Google Scholar] [CrossRef]
- Tsobnang, P.K.; Hastürk, E.; Fröhlich, D.; Wenger, E.; Durand, P.; Ngolui, J.L.; Lecomte, C.; Janiak, C. Water Vapor Single-Gas Selectivity via Flexibility of Three Potential Materials for Autonomous Indoor Humidity Control. Cryst. Growth Des. 2019, 19, 2869–2880. [Google Scholar] [CrossRef]
- Kim, S.-I.; Yoon, T.-U.; Kim, M.-B.; Lee, S.-J.; Hwang, Y.K.; Chang, J.-S.; Kim, H.-J.; Lee, H.-N.; Lee, U.-H.; Bae, Y.-S. Metal–organic frameworks with high working capacities and cyclic hydrothermal stabilities for fresh water production. Chem. Eng. J. 2016, 286, 467–475. [Google Scholar] [CrossRef]
- Trapani, F.; Polyzoidis, A.; Loebbecke, S.; Piscopo, C.G. On the general water harvesting capability of metal-organic frameworks under well-defined climatic conditions. Microporous Mesoporous Mater. 2016, 230, 20–24. [Google Scholar] [CrossRef]
- Kim, H.; Yang, S.; Rao, S.R.; Narayanan, S.; Kapustin, E.A.; Furukawa, H.; Umans, A.S.; Yaghi, O.M.; Wang, E.N. Water harvesting from air with metal-organic frameworks powered by natural sunlight. Science 2017, 356, 430–434. [Google Scholar] [CrossRef] [Green Version]
- Hanikel, N.; Prévot, M.S.; Fathieh, F.; Kapustin, E.A.; Lyu, H.; Wang, H.; Diercks, N.J.; Glover, T.G.; Yaghi, O.M. Rapid Cycling and Exceptional Yield in a Metal-Organic Framework Water Harvester. ACS Cent. Sci. 2019, 5, 1699–1706. [Google Scholar] [CrossRef]
- Bouson, S.; Krittayavathananon, A.; Phattharasupakun, N.; Siwayaprahm, P.; Sawangphruk, M. Antifungal activity of water-stable copper-containing metal-organic frameworks. R. Soc. Open Sci. 2017, 4, 170654. [Google Scholar] [CrossRef] [PubMed] [Green Version]
- Celis-Arias, V.; Loera-Serna, S.; Beltrán, H.I.; Álvarez-Zeferino, J.C.; Garrido, E.; Ruiz-Ramos, R. The fungicide effect of HKUST-1 on Aspergillus niger, Fusarium solani and Penicillium chrysogenum. New J. Chem. 2018, 42, 5570–5579. [Google Scholar] [CrossRef]
- Firouzjaei, M.D.; Shamsabadi, A.A.; Aktij, S.A.; Seyedpour, S.F.; Sharifian Gh, M.; Rahimpour, A.; Esfahani, M.R.; Ulbricht, M.; Soroush, M. Exploiting Synergetic Effects of Graphene Oxide and a Silver-Based Metal-Organic Framework to Enhance Antifouling and Anti-Biofouling Properties of Thin-Film Nanocomposite Membranes. ACS Appl. Mater. Interfaces 2018, 10, 42967–42978. [Google Scholar] [CrossRef] [PubMed]
- Alvarez, E.; Guillou, N.; Martineau, C.; Bueken, B.; Van de Voorde, B.; Le Guillouzer, C.; Fabry, P.; Nouar, F.; Taulelle, F.; Vos, D.D.; et al. The structure of the aluminum fumarate metal-organic framework A520. Angew. Chem. 2015, 54, 3664–3668. [Google Scholar] [CrossRef] [PubMed]
- Leung, E.; Müller, U.; Trukhan, N.; Mattenheimer, H.; Cox, G.; Blei, S. Process for Preparing Porous Metal-Organic Framework Based on Aluminium Fumarate. U.S. Patent 2012/0082864 A1, 30 September 2011. [Google Scholar]
- Kummer, H.; Jeremias, F.; Warlo, A.; Füldner, G.; Fröhlich, D.; Janiak, C.; Gläser, R.; Henninger, S.K. A Functional Full-Scale Heat Exchanger Coated with Aluminum Fumarate Metal–Organic Framework for Adsorption Heat Transformation. Ind. Eng. Chem. Res. 2017, 56, 8393–8398. [Google Scholar] [CrossRef]
- Jeremias, F.; Fröhlich, D.; Janiak, C.; Henninger, S.K. Advancement of sorption-based heat transformation by a metal coating of highly-stable, hydrophilic aluminium fumarate MOF. RSC Adv. 2014, 4, 24073–24082. [Google Scholar] [CrossRef] [Green Version]
- Reinsch, H.; Waitschat, S.; Stock, N. Mixed-linker MOFs with CAU-10 structure: Synthesis and gas sorption characteristics. Dalton Trans. 2013, 42, 4840–4847. [Google Scholar] [CrossRef]
- Fröhlich, D.; Pantatosaki, E.; Kolokathis, P.D.; Markey, K.; Reinsch, H.; Baumgartner, M.; van der Veen, M.A.; de Vos, D.E.; Stock, N.; Papadopoulos, G.K.; et al. Water adsorption behaviour of CAU-10-H: A thorough investigation of its structure–property relationships. J. Mater. Chem. A 2016, 4, 11859–11869. [Google Scholar] [CrossRef] [Green Version]
- Lenzen, D.; Bendix, P.; Reinsch, H.; Fröhlich, D.; Kummer, H.; Möllers, M.; Hügenell, P.P.C.; Gläser, R.; Henninger, S.; Stock, N. Scalable Green Synthesis and Full-Scale Test of the Metal-Organic Framework CAU-10-H for Use in Adsorption-Driven Chillers. Adv. Mater. 2018, 30. [Google Scholar] [CrossRef]
- Lenzen, D.; Zhao, J.; Ernst, S.-J.; Wahiduzzaman, M.; Ken Inge, A.; Fröhlich, D.; Xu, H.; Bart, H.-J.; Janiak, C.; Henninger, S.; et al. A metal-organic framework for efficient water-based ultra-low-temperature-driven cooling. Nat. Commun. 2019, 10, 3025. [Google Scholar] [CrossRef]
- Cadiau, A.; Lee, J.S.; Damasceno Borges, D.; Fabry, P.; Devic, T.; Wharmby, M.T.; Martineau, C.; Foucher, D.; Taulelle, F.; Jun, C.-H.; et al. Design of hydrophilic metal organic framework water adsorbents for heat reallocation. Adv. Mater. 2015, 27, 4775–4780. [Google Scholar] [CrossRef]
- Permyakova, A.; Skrylnyk, O.; Courbon, E.; Affram, M.; Wang, S.; Lee, U.-H.; Valekar, A.H.; Nouar, F.; Mouchaham, G.; Devic, T.; et al. Synthesis Optimization, Shaping, and Heat Reallocation Evaluation of the Hydrophilic Metal-Organic Framework MIL-160(Al). Chem. Sus. Chem. 2017, 10, 1419–1426. [Google Scholar] [CrossRef] [PubMed]
- Tschense, C.B.L.; Reimer, N.; Hsu, C.-W.; Reinsch, H.; Siegel, R.; Chen, W.-J.; Lin, C.-H.; Cadiau, A.; Serre, C.; Senker, J.; et al. New Group 13 MIL-53 Derivates based on 2,5-Thiophenedicarboxylic Acid. Z. Anorg. Allg. Chem. 2017, 643, 1600–1608. [Google Scholar] [CrossRef] [Green Version]
- Tannert, N.; Ernst, S.-J.; Jansen, C.; Bart, H.-J.; Henninger, S.K.; Janiak, C. Evaluation of the highly stable metal–organic framework MIL-53(Al)-TDC (TDC = 2,5-thiophenedicarboxylate) as a new and promising adsorbent for heat transformation applications. J. Mater. Chem. A 2018, 6, 17706–17712. [Google Scholar] [CrossRef]
- Gaab, M.; Trukhan, N.; Maurer, S.; Gummaraju, R.; Müller, U. The progression of Al-based metal-organic frameworks—From academic research to industrial production and applications. Microporous Mesoporous Mater. 2012, 157, 131–136. [Google Scholar] [CrossRef]
- Fröhlich, D.; Henninger, S.K.; Janiak, C. Multicycle water vapour stability of microporous breathing MOF aluminium isophthalate CAU-10-H. Dalton Trans. 2014, 43, 15300–15304. [Google Scholar] [CrossRef] [Green Version]
- Jeremias, F.; Khutia, A.; Henninger, S.K.; Janiak, C. MIL-100(Al, Fe) as water adsorbents for heat transformation purposes—a promising application. J. Mater. Chem. 2012, 22, 10148–10151. [Google Scholar] [CrossRef]
- Wisser, D.; Wisser, F.M.; Raschke, S.; Klein, N.; Leistner, M.; Grothe, J.; Brunner, E.; Kaskel, S. Biological Chitin-MOF Composites with Hierarchical Pore Systems for Air-Filtration Applications. Angew. Chem. 2015, 54, 12588–12591. [Google Scholar] [CrossRef]
- Percot, A.; Viton, C.; Domard, A. Optimization of chitin extraction from shrimp shells. Biomacromolecules 2003, 4, 12–18. [Google Scholar] [CrossRef]
- Islam, S.; Bhuiyan, M.A.R.; Islam, M.N. Chitin and Chitosan: Structure, Properties and Applications in Biomedical Engineering. J. Polym. Environ. 2017, 25, 854–866. [Google Scholar] [CrossRef]
- Goy, R.C.; de Britto, D.; Assis, O.B.G. A review of the antimicrobial activity of chitosan. Polimeros 2009, 19, 241–247. [Google Scholar] [CrossRef]
- Asiabi, M.; Mehdinia, A.; Jabbari, A. Spider-web-like chitosan/MIL-68(Al) composite nanofibers for high-efficient solid phase extraction of Pb(II) and Cd(II). Microchim. Acta 2017, 184, 4495–4501. [Google Scholar] [CrossRef]
- Fu, Q.; Wen, L.; Zhang, L.; Chen, X.; Pun, D.; Ahmed, A.; Yang, Y.; Zhang, H. Preparation of Ice-Templated MOF-Polymer Composite Monoliths and Their Application for Wastewater Treatment with High Capacity and Easy Recycling. ACS Appl. Mater. Interfaces 2017, 9, 33979–33988. [Google Scholar] [CrossRef]
- Hidalgo, T.; Giménez-Marqués, M.; Bellido, E.; Avila, J.; Asensio, M.C.; Salles, F.; Lozano, M.V.; Guillevic, M.; Simón-Vázquez, R.; González-Fernández, A.; et al. Chitosan-coated mesoporous MIL-100(Fe) nanoparticles as improved bio-compatible oral nanocarriers. Sci. Rep. 2017, 7, 43099. [Google Scholar] [CrossRef] [PubMed]
- Li, Q.; Liu, Q.; Zhao, J.; Hua, Y.; Sun, J.; Duan, J.; Jin, W. High efficient water/ethanol separation by a mixed matrix membrane incorporating MOF filler with high water adsorption capacity. J. Membr. Sci. 2017, 544, 68–78. [Google Scholar] [CrossRef]
- Singo, M.C.; Molepo, X.C.; Oluwasina, O.O.; Daramola, M.O. Chitosan-impregnated Sod-Metal Organic Frameworks (Sod-ZMOF) for CO2 Capture: Synthesis and Performance Evaluation. Energy Procedia 2017, 114, 2429–2440. [Google Scholar] [CrossRef]
- Zhuo, N.; Lan, Y.; Yang, W.; Yang, Z.; Li, X.; Zhou, X.; Liu, Y.; Shen, J.; Zhang, X. Adsorption of three selected pharmaceuticals and personal care products (PPCPs) onto MIL-101(Cr)/natural polymer composite beads. Sep. Purif. Technol. 2017, 177, 272–280. [Google Scholar] [CrossRef]
- Liu, L.; Ge, J.; Yang, L.-T.; Jiang, X.; Qiu, L.-G. Facile preparation of chitosan enwrapping Fe3O4 nanoparticles and MIL-101(Cr) magnetic composites for enhanced methyl orange adsorption. J. Porous Mater. 2016, 23, 1363–1372. [Google Scholar] [CrossRef]
- Asiabi, M.; Mehdinia, A.; Jabbari, A. Electrospun biocompatible Chitosan/MIL-101 (Fe) composite nanofibers for solid-phase extraction of Δ9-tetrahydrocannabinol in whole blood samples using Box-Behnken experimental design. J. Chromatogr. A 2017, 1479, 71–80. [Google Scholar] [CrossRef] [Green Version]
- Sivakumar, P.; Priyatharshni, S.; Nagashanmugam, K.B.; Thanigaivelan, A.; Kumar, K. Chitosan capped nanoscale Fe-MIL-88B-NH 2 metal-organic framework as drug carrier material for the pH responsive delivery of doxorubicin. Mater. Res. Express 2017, 4, 85023. [Google Scholar] [CrossRef]
- Liang, X.-X.; Wang, N.; Qu, Y.-L.; Yang, L.-Y.; Wang, Y.-G.; Ouyang, X.-K. Facile Preparation of Metal-Organic Framework (MIL-125)/Chitosan Beads for Adsorption of Pb(II) from Aqueous Solutions. Molecules 2018, 23, 1524. [Google Scholar] [CrossRef] [PubMed] [Green Version]
- Kirisits, M.J.; Parsek, M.R. Does Pseudomonas aeruginosa use intercellular signalling to build biofilm communities? Cell. Microbiol. 2006, 8, 1841–1849. [Google Scholar] [CrossRef] [PubMed]
- Ramage, G.; Rajendran, R.; Gutierrez-Correa, M.; Jones, B.; Williams, C. Aspergillus biofilms: Clinical and industrial significance. FEMS Microbiol. Lett. 2011, 324, 89–97. [Google Scholar] [CrossRef] [Green Version]
- Greenberger, P.A. Allergic bronchopulmonary aspergillosis. J. Allergy Clin. Immunol. 2002, 110, 685–692. [Google Scholar] [CrossRef] [PubMed] [Green Version]
- Ustianowski, A.P.; Sieu, T.P.M.; Day, J.N. Penicillium marneffei infection in HIV. Curr. Opin. Infect. Dis. 2008, 21, 31–36. [Google Scholar] [CrossRef]
- Duong, T.A. Infection Due to Penicillium marneffei, an Emerging Pathogen: Review of 155 Reported Cases. Clin. Infect. Dis. 1996, 23, 125–130. [Google Scholar] [CrossRef] [Green Version]
- Supparatpinyo, K.; Khamwan, C.; Baosoun, V.; Nelson, K.E.; Sirisanthana, T. Disseminated Penicillium marneffei infection in Southeast Asia. Lancet 1994, 344, 110–113. [Google Scholar] [CrossRef]
- Naidu, J.; Singh, S.M.; Pouranik, M. Onychomycosis caused by Chaetomium globosum Kunze. Mycopathologia 1991, 113, 31–34. [Google Scholar] [CrossRef]
- Abbott, S.P.; Sigler, L.; McAleer, R.; McGough, D.A.; Rinaldi, M.G.; Mizell, G. Fatal cerebral mycoses caused by the ascomycete Chaetomium strumarium. J. Clin. Microbiol. 1995, 33, 2692–2698. [Google Scholar] [CrossRef] [Green Version]
- McFeters, G.A.; Bazin, M.J.; Mirelman, D.; Bryers, J.D.; Mitchell, R.; Caldwell, D.E.; Schubert, R.H.W.; Characklis, W.G.; Tanaka, T.; Lund, D.B.; et al. Biofilm Development and Its Consequences. In Microbial Adhesion and Aggregation: Report of the Dahlem Workshop on Microbial Adhesion and Aggregation Berlin 1984, January 15–20; Marshall, K.C., Ed.; Springer: Berlin/Heidelberg, Germany, 1984; pp. 108–124. ISBN 978-3-642-70139-9. [Google Scholar] [CrossRef]
- Characklis, W.G. Bioengineering report: Fouling biofilm development: A process analysis. Biotechnol. Bioeng. 1981, 23, 1923–1960. [Google Scholar] [CrossRef]
- Herxheimer, H.; Hyde, H.; Williams, D. Allergic asthma caused by fungal spores. Lancet 1966, 1, 572–573. [Google Scholar] [CrossRef]
- Baillie, G.S.; Douglas, L.J. Matrix polymers of Candida biofilms and their possible role in biofilm resistance to antifungal agents. J. Antimicrob. Chemother. 2000, 46, 397–403. [Google Scholar] [CrossRef] [PubMed] [Green Version]
- Teughels, W.; van Assche, B.; Sliepen, I.; Quirynen, M. Effect of material characteristics and/or surface topography on biofilm development. Clin. Oral Imp. Res. 2006, 17, 68–81. [Google Scholar] [CrossRef] [PubMed]
- Deutsches Institut für Normung. DIN EN ISO 846 Plastics—Evaluation of the Action of Microorganisms; Beuth: Berlin, Germany, 2018. [Google Scholar]
- Thommes, M.; Kaneko, K.; Neimark, A.V.; Olivier, J.P.; Rodriguez-Reinoso, F.; Rouquerol, J.; Sing, K.S.W. Physisorption of gases, with special reference to the evaluation of surface area and pore size distribution (IUPAC Technical Report). Pure Appl. Chem. 2015, 87, 1051–1069. [Google Scholar] [CrossRef] [Green Version]
- Bodmeier, R.; Oh, K.-H.; Pramar, Y. Preparation and Evaluation of Drug-Containing Chitosan Beads. Drug Dev. Ind. Pharm. 1989, 15, 1475–1494. [Google Scholar] [CrossRef]
- Wu, S.-J.; Liou, T.-H.; Yeh, C.-H.; Mi, F.-L.; Lin, T.-K. Preparation and characterization of porous chitosan-tripolyphosphate beads for copper(II) ion adsorption. J. Appl. Polym. Sci. 2013, 127, 4573–4580. [Google Scholar] [CrossRef]
- Khabzina, Y.; Dhainaut, J.; Ahlhelm, M.; Richter, H.-J.; Reinsch, H.; Stock, N.; Farrusseng, D. Synthesis and Shaping Scale-up Study of Functionalized UiO-66 MOF for Ammonia Air Purification Filters. Ind. Eng. Chem. Res. 2018, 57, 8200–8208. [Google Scholar] [CrossRef]


| Composite | Crosslinker a | MOF Amount | Polymer Amount | Solution Volume and Concentration |
|---|---|---|---|---|
| MOF60@Chitosan | Na5P3O10 | 60% | 40% | 20 or 6 mL, |
| (180 mg) | (120 mg) | 6 or 20 g L−1 | ||
| MOF80@Chitosan | Na5P3O10 | 80% | 20% | 10 or 3 mL, |
| (240 mg) | (60 mg) | 6 or 20 g L−1 | ||
| MOF90@Chitosan | Na5P3O10 | 90% | 10% | 10 or 3 mL, |
| (540 mg) | (60 mg) | 6 or 20 g L−1 | ||
| MOF@PVA | - | 80% | 20% | 2 mL, |
| (480 mg) | (120 mg) | 60 g L−1 | ||
| MOF@Silikophen® | - | High | low only on surface b | 10 mL of Silikophen in 30 mL of xylene |
| Method | Category | Growth Intensity, Observation | Assessment of the Sample Material |
|---|---|---|---|
| A | 0 | no growth visible under microscopic observation | material does not serve as a nutrient for microorganisms; it is “inert” or “fungistatic” |
| 1 | no growth visible with the naked eye, but clearly visible under the microscope at 50 times magnification | material contains nutrients or is only slightly soiled, so that only slight growth is possible | |
| 2 | growth visible to the naked eye, up to 25% of the sample surface overgrown | material is not resistant to fungal attack and contains nutrients for the development of microorganisms | |
| 3 | growth visible to the naked eye, up to 50% of the sample surface overgrown | ||
| 4 | significant growth, over 50% of the sample surface overgrown | ||
| 5 | strong growth, entire sample surface overgrown |
| Educt/Composite Materials | CTS Conc. [g L−1] | BET-Surface [m2 g−1] | Pore Volume [cm3 g−1] a | Water Uptake [mg g−1] at 0.9 p p0−1 | |||
|---|---|---|---|---|---|---|---|
| Meas. (% of Calc.) | Calc. b | Meas. (% of Calc) | Calc. b | Meas. (% of Calc.) | Calc. a | ||
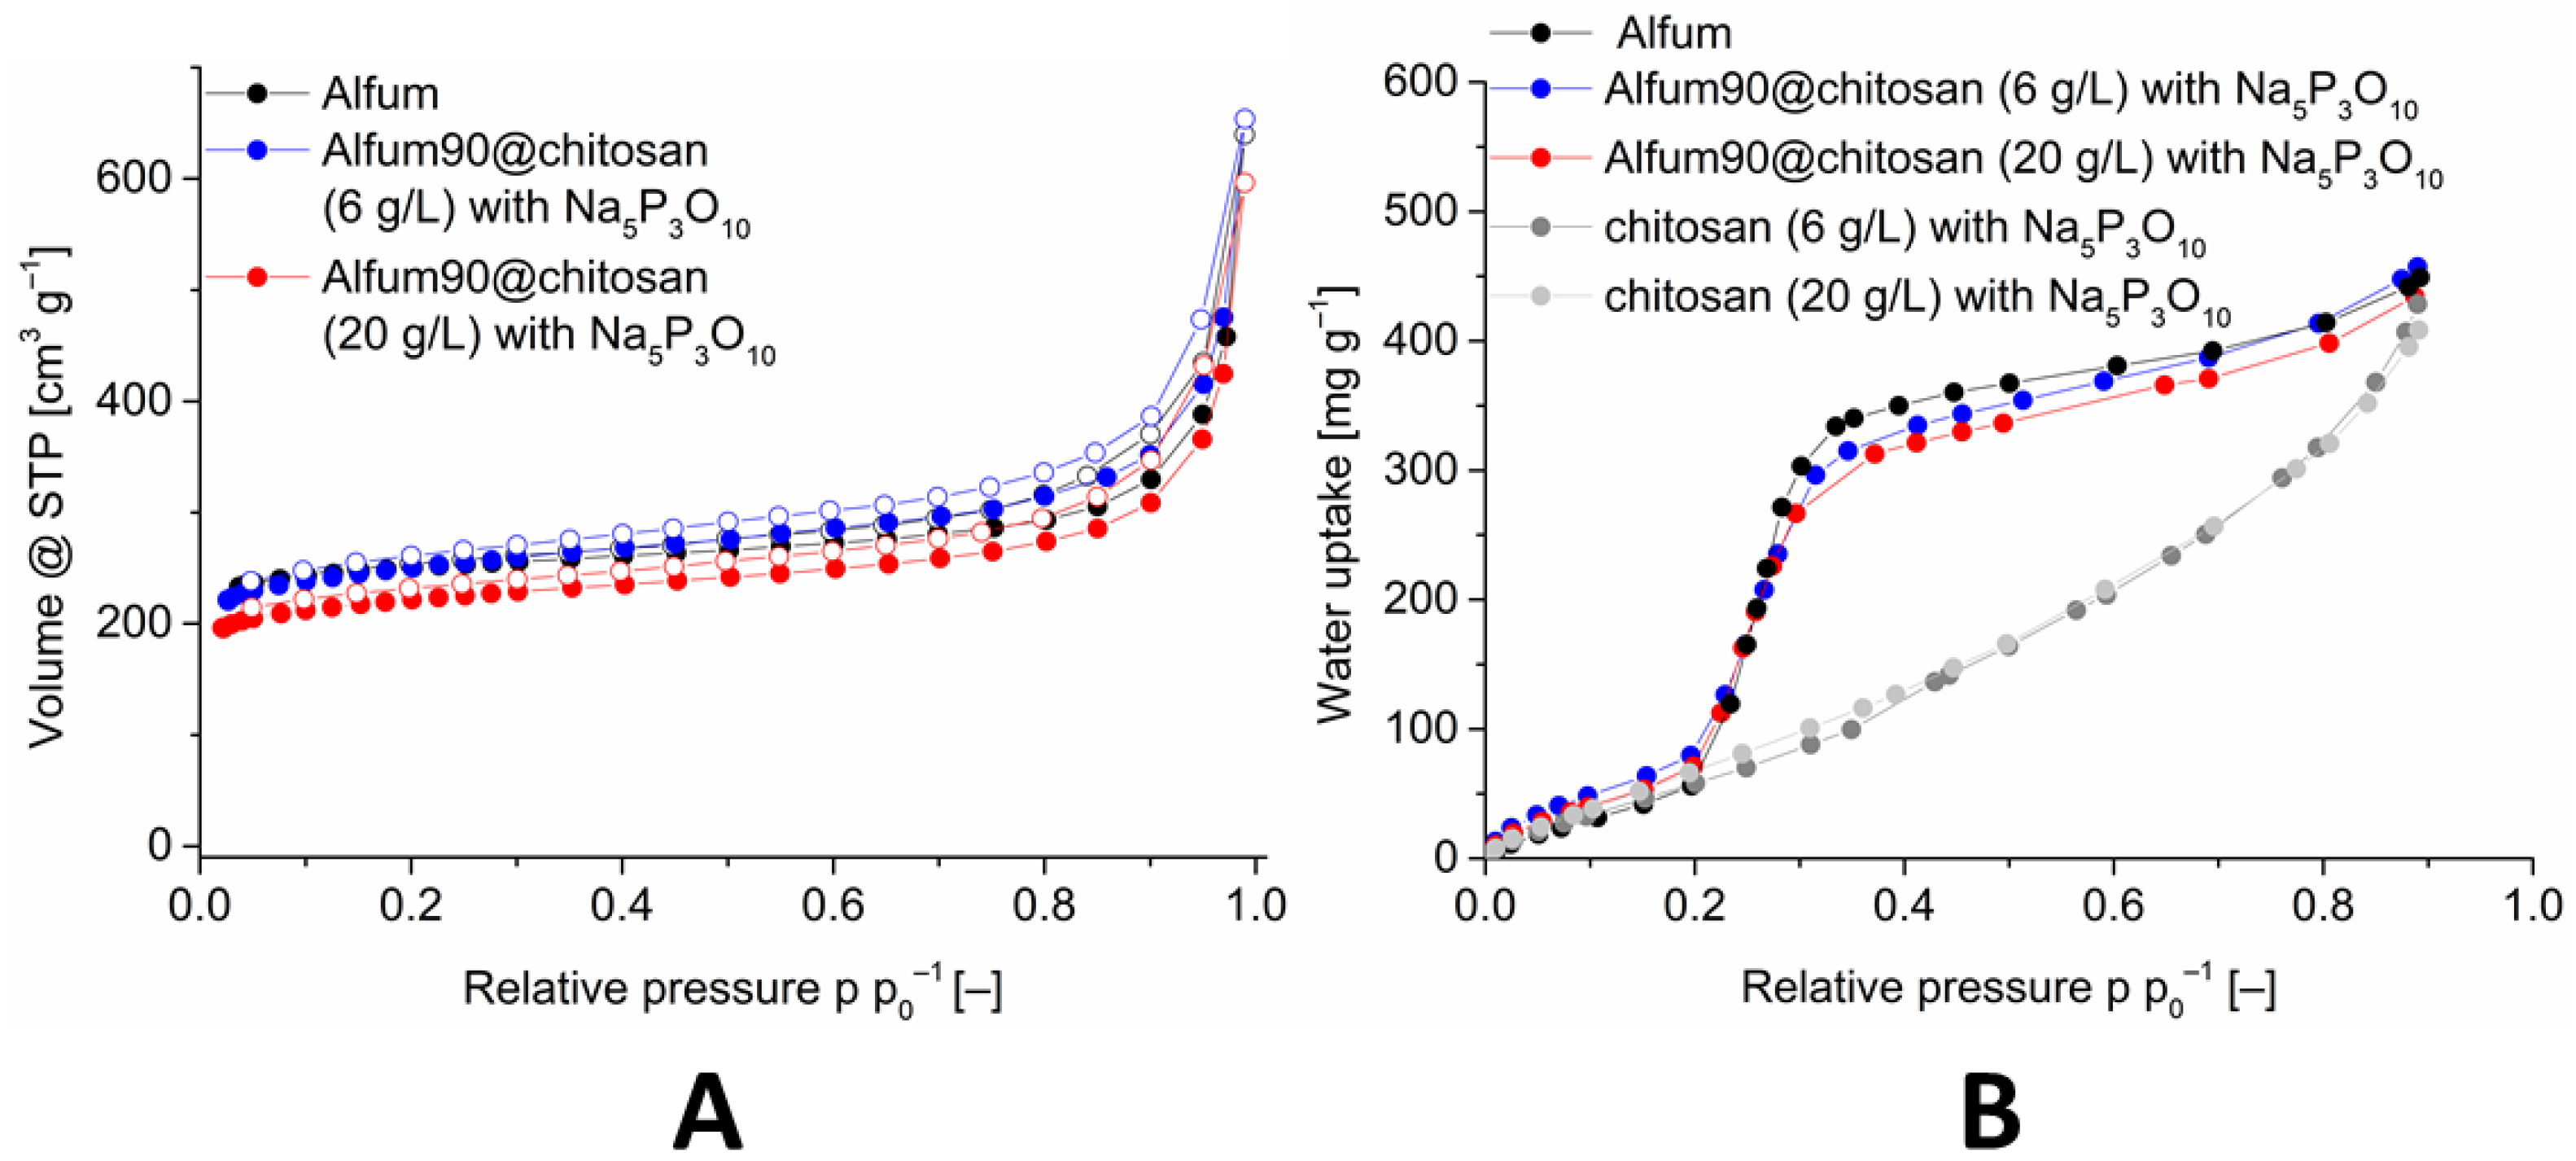
| chitosan | 6 | 144 | - | 0.30 | - | 428 | - |
| chitosan | 20 | 230 | - | 0.46 | - | 408 | - |
| chitosan | 30 | 220 | - | 0.45 | - | - | - |
| chitosan | 40 | 202 | - | 0.40 | - | - | - |
| Alfum (Basolite® A520) | - | 988 | - | 0.51 | - | 449 | - |
| Alfum60@chitosan | 6 | 20 (3) | 650 | 0.23 (53) | 0.43 | - | - |
| Alfum60@chitosan | 20 | 294 (43) | 685 | 0.18 (37) | 0.49 | - | - |
| Alfum60@chitosan | 30 | 202 (30) | 681 | 0.16 (33) | 0.49 | - | - |
| Alfum60@chitosan | 40 | 26 (4) | 674 | 0.43 (91) | 0.47 | - | - |
| Alfum80@chitosan | 6 | 474 (58) | 819 | 0.29 (62) | 0.47 | 393 (88) | 445 |
| Alfum80@chitosan | 20 | 587 (70) | 836 | 0.35 (70) | 0.50 | 468 (106) | 441 |
| Alfum80@chitosan d.s. c | 6 | 844 (103) | 819 | 0.67 (143) | 0.47 | - | - |
| Alfum80@chitosan d.s. c | 20 | 893 (107) | 836 | 0.58 (116) | 0.50 | - | - |
| Alfum90@chitosan | 6 | 964 (107) | 904 | 0.54 (110) | 0.49 | 457 (102) | 447 |
| Alfum90@chitosan | 20 | 856 (94) | 912 | 0.48 (94) | 0.51 | 434 (98) | 445 |
| MIL-160 | - | 1186 | - | 0.48 | - | 368 | - |
| MIL-160(60)@chitosan | 6 | 32 (4) | 769 | 0.22 (54) | 0.41 | - | - |
| MIL-160(60)@chitosan | 20 | 138 (17) | 804 | 0.47 (100) | 0.47 | - | - |
| MIL-160(80)@chitosan | 6 | 720 (74) | 978 | 0.34 (77) | 0.44 | 347 (91) | 380 |
| MIL-160(80)@chitosan | 20 | 610 (61) | 995 | 0.29 (60) | 0.48 | 370 (98) | 376 |
| MIL-160(80)@chitosan d.s. c | 6 | 858 (88) | 978 | 0.46 (105) | 0.44 | - | - |
| MIL-160(80)@chitosan d.s. c | 20 | 918 (92) | 995 | 0.47 (98) | 0.48 | - | - |
| MIL-160(90)@chitosan | 6 | 1068 (99) | 1082 | 0.44 (96) | 0.46 | 395 (106) | 374 |
| MIL-160(90)@chitosan | 20 | 964 (88) | 1090 | 0.41 (85) | 0.48 | 392 (105) | 372 |
| Composite Material | Aspergillus falconensis n = 3 | ||
|---|---|---|---|
| 1 | 2 | 3 | |
| chitosan medium molecular weight | 3 | 5 | 5 |
| chitosan crosslinked with Na5P3O10 | 0 | 5 | 5 |
| Alfum60@chitosan | 0 | 0 | 0 |
| Alfum80@chitosan | 0 | 0 | 0 |
| Alfum90@chitosan | 2 | 0 | 0 |
| MIL-160(60)@chitosan | 2 | 0 | 0 |
| MIL-160(80)@chitosan | 1 | 0 | 0 |
| MIL-160(90)@chitosan | 2 | 0 | 0 |
| Alfum | 3 | 5 | 5 |
| MIL-160 | 1 | 1 | 1 |
| Alfum@PVA | 2 | 3 | 3 |
| MIL-160@PVA | 0 | 2 | 2 |
| Alfum@Silikophen® | 5 | 5 | 5 |
| MIL-160@Silikophen® | 1 | 2 | 2 |
Publisher’s Note: MDPI stays neutral with regard to jurisdictional claims in published maps and institutional affiliations. |
© 2022 by the authors. Licensee MDPI, Basel, Switzerland. This article is an open access article distributed under the terms and conditions of the Creative Commons Attribution (CC BY) license (https://creativecommons.org/licenses/by/4.0/).
Share and Cite
Jansen, C.; Tran-Cong, N.M.; Schlüsener, C.; Schmitz, A.; Proksch, P.; Janiak, C. MOF@chitosan Composites with Potential Antifouling Properties for Open-Environment Applications of Metal-Organic Frameworks. Solids 2022, 3, 35-54. https://doi.org/10.3390/solids3010004
Jansen C, Tran-Cong NM, Schlüsener C, Schmitz A, Proksch P, Janiak C. MOF@chitosan Composites with Potential Antifouling Properties for Open-Environment Applications of Metal-Organic Frameworks. Solids. 2022; 3(1):35-54. https://doi.org/10.3390/solids3010004
Chicago/Turabian StyleJansen, Christian, Nam Michael Tran-Cong, Carsten Schlüsener, Alexa Schmitz, Peter Proksch, and Christoph Janiak. 2022. "MOF@chitosan Composites with Potential Antifouling Properties for Open-Environment Applications of Metal-Organic Frameworks" Solids 3, no. 1: 35-54. https://doi.org/10.3390/solids3010004
APA StyleJansen, C., Tran-Cong, N. M., Schlüsener, C., Schmitz, A., Proksch, P., & Janiak, C. (2022). MOF@chitosan Composites with Potential Antifouling Properties for Open-Environment Applications of Metal-Organic Frameworks. Solids, 3(1), 35-54. https://doi.org/10.3390/solids3010004