Abstract
Dynamic mechanical analysis (DMA) provides reliable information about the viscoelastic behavior of neat and filled polymers. The properties of filled polymers are relevant to different industries as protective organic coatings, composites etc. Interfacial interactions in filled polymers play an important role in determining their bulk properties and performance during service life. In this brief review article, studies that used DMA to characterize the interfacial interactions in filled polymers have been reviewed. The available open literature provides a mixed opinion about the influence of interfacial interactions on the glass transition temperature of filled polymers. Nevertheless, it appears that in the case of strong interfacial interactions between the filler particles and the polymeric matrix, the peak value of tan δ is reduced in comparison to that of a filled polymer where these interactions are weak.
1. Introduction
Interfaces play an important role in determining the bulk properties and performance during the service life of filled polymers. Filled polymers generally refer to polymers blended with different particles, which are commonly called fillers. Certain additives are also used in filled polymers to improve their properties. Organic coatings are a special case of filled polymers. As commercial organic coatings are composed of binders, co-binders, dispersing agents, defoaming agents, extenders/fillers, pigments, solvents, co-solvents, curing agents etc., the interface(s) between different constituents of an organic coating influences the uniform dispersion of each ingredient, which then translates into good film formation and isotropic properties of the final coating. In a broader sense, all other components of a commercial coating are liquid (or get dissolved into the solvent(s)) except the extenders/fillers/pigments. After application and curing, the extenders are considered as the dispersed phase, whereas the binder (including cross-linked curing agent, residual solvents, additives such as dispersing agents, defoamers etc.) is considered as the matrix. A variety of extenders are used in the organic coatings commercially e.g., inorganic particles (such as titanium dioxide, silica, talc, feldspar, calcium carbonate, kaolin etc.), metallic particles (such as zinc, zinc oxide etc.), carbonaceous materials (carbon black, etc.). Nanoparticles (non-functionalized or functionalized) of various materials such as silica, carbon (graphene, graphene oxide, reduced graphene oxide, carbon nanotubes etc.), Fe, Zn, etc. are being heavily investigated for the enhancement of various properties (e.g., hydrophobicity, anti-corrosivity etc.) of organic coatings, but their commercial application is limited mainly due to the dispersion and high cost-related issues [1,2,3]. An interface is formed between the matrix and the surface of solid extender particles. It is believed that the interfacial interactions (in the interphase region) between the matrix and the extender(s) play a major role in deciding the performance of an organic coating (or a composite) during service. The interphase region is supposed to consist of two nanolayers, as shown schematically in Figure 1. The first nanolayer (around 1–20 Å from the surface of the nanoparticle) contains polymer chains that are highly immobile due to strong attachment with the surface of the particles. The second nanolayer is thicker than the first one, which is formed around 25–90 Å away from the surface of the particles and contains polymer chains that are considered to be loosely bound to the nanoparticles. The thickness of the interphase region depends upon polymer/matrix type, surface chemistry of the extenders, volume fraction of the extenders used, particle size (and distribution) of the extenders, and the quality of dispersion of extenders inside the matrix [4,5,6,7,8]. Properties of the interphase region are known to be different from the bulk of the polymer. For example, a diffusion coefficient of 50 Å thick film of polystyrene deposited on silicon wafers was found to be 1–2 orders of magnitude less than that of the bulk polymer [9]. The glass transition temperature (Tg) of poly(propylene glycol) confined in controlled pores of 100 Å was found to be higher than that of the bulk polymer [10].
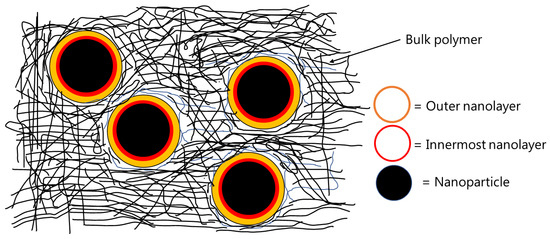
Figure 1.
Schematic representation of inner and outer nanolayer formed in nanocomposites.
Once closer to the surface of the (micrometer and/or nanometer) extender particles, the polymer chains can be tied strongly to the surface via a series of interactions developed via dangling tails, loops and adsorbed segments slowing down and broadening the segmental relaxation process. Segmental relaxations are related to the glass transition temperature (Tg), which defines the flexibility of an organic coating (or composite) [11]. Typically, the change (i.e., increase or decrease) in Tg of the filled polymers is attributed to the nature of interactions (i.e., attractive, repulsive, or neutral) between the polymer and the extender particles. For example, attractive interactions (i.e., the hydrogen bonding) between the hydroxyl groups of hydrophilic silica and carbonyl groups of poly(vinyl acetate) have been shown to influence the Tg of the nanocomposite [5]. Similarly, covalent bonding between the filler surface and the resin has been shown to increase the Tg of the composite with increasing filler volume fraction in the composite [12]. Covalent bond formation between the particle surface and the polymer matrix can be achieved by different ways e.g., by the surface treatment of the extender particles with a polymer-reactive group, the addition of chemicals such as silanes to the filled system that are capable of reacting both with the polymer and the extender particles, or by grafting the polymer chains with functional groups, which can react with the functional groups present on the surface of the extender particles. A detailed discussion about different methods to achieve covalent bond formation between the extender particles and the polymer matrix is beyond the scope of this work. The attractive interfacial interactions have also been observed in polymer melts (by neutron scattering) when the nanopores of hydrophilic anodic aluminum oxide were filled with the hydrophilic polydimethylsiloxane, where the authors showed that the segmental dynamics of the interfacial layer were slower than those of the bulk [13]. The same authors showed that by using hydrophobic poly(ethylene-alt-propylene) instead of hydrophilic polydimethylsiloxane, the nature of interfacial interactions between the anodic aluminum oxide and the polymer becomes repulsive, resulting in bulk-like segmental dynamics in the interphase region [14]. However, in some filled systems, Tg may not change, which is indicative of neutral or weak interactions. In addition to Tg, the elastic storage modulus of the filled polymers is known to be higher than the corresponding unfilled polymers, especially in the rubbery region [15].
In addition to other factors, filler concentration in the filled polymers (e.g., coatings, composites etc.) strongly influences the volume of the interphase region, especially if nanoparticles are used as filler/extender. At low (≈0.1 to 0.4 wt %) nanofiller concentrations, the nanoparticles are uniformly dispersed inside the matrix with reasonably large distance between them. This may lead to either no change or a reduction in Tg because the mobility of the loosely bound chains in the interfacial regions is not reduced. In contrast, at higher concentrations of the nanoparticles, the distance between the particles reduces, which may also cause an overlap of the interfacial nanolayers, thereby increasing the volume of the immobilized chains, and consequently, the Tg of the nanocomposite increases as compared to unfilled polymer or a less filled composite. Note that achieving the uniform dispersion of nanoparticles at high nanofiller concentrations is difficult [4].
Several interfaces are formed when a coating is applied, and together, they play an important role during the service life of protective organic coatings. For example, if a scratch is formed on an anticorrosive epoxy coating applied on a metallic substrate during service, the interface between the coating and the substrate (along with rate of oxygen ingress and diffusion rate of alkali metal ions) determines the overall rate of cathodic delamination of the applied coating [16]. Several layers of chemically different coatings are commercially applied to protect metallic structures. Adhesion between different layers of a coating system (and, hence its performance) is dependent upon the interfacial properties [17]. Similarly, the properties at the interface between the matrix and the extenders influence the macroscopic mechanical properties of an applied coating [6,18]. The interface between the matrix and fillers is considered to be a more dissipative component of filled polymers. At high filler concentration, when strain is applied to the filled polymers, the strain is mainly controlled by the filler in a way that the interface is strained to a lesser extent [4]. Therefore, in order to characterize the interfacial interactions (and the interphase region), different methods have been developed and tested over time. It is important to mention that this review is focused on the interfacial interactions between the matrix and the extenders (also referred to as fillers) in filled polymer systems (e.g., coatings, composites etc.). Nuclear magnetic resonance (NMR) spectroscopy has been used to study the effect of different fillers on the chain dynamics of polymers, especially the elastomers used in the rubber industry [19,20,21,22,23,24,25,26]. Raman spectroscopy [27,28,29,30] and the dielectric relaxation spectrum [31,32,33,34,35,36,37] have also been used to characterize the interaction between different fillers and polymeric matrices. Different research groups have used atomic force microscopy (AFM) to study the interfacial interactions of filled polymeric systems [38,39,40], whereas some researchers [18,41,42,43,44,45] have used AFM for the quantitative characterization of the polymer–filler interface (e.g., for measuring the thickness of the interfacial layer between the polymer and the filler particles) and the microscopic mechanical properties of the nanocomposites. Dynamic mechanical analysis (DMA) is also among the analytical techniques heavily used by researchers to characterize the interfacial interactions of filled polymer systems. This brief review article aims to provide an overview of such studies, which used DMA to understand the interfacial interactions of filled polymers. The terms filler and extender have been used interchangeably here and refer to the solid particles added in the polymers to enhance their properties. It is important to highlight that the interfacial interactions exist in nearly all types of filled polymers with varying magnitudes depending upon several factors, and this has been depicted here by discussing briefly the research published in various fields such as composites, rubber technology, organic coatings, compounded thermoplastics, etc. Extensive review on the topic covering all these fields is beyond the scope of this work. Furthermore, macroscopic and/or microscopic modeling approaches using DMA data to model the viscoelastic behavior of filled polymers [46,47,48,49] are not reviewed in this article.
DMA can be considered as standard equipment for the measurement of dynamic mechanical properties of filled polymers. In a typical DMA experiment, an oscillating force is applied to a sample at a given temperature and/or frequency, and the material’s response to this force is measured. The applied force is called the stress (σ), and the deformation in the sample is called the strain (γ). For viscoelastic materials, such as polymers, the magnitude of the material’s response (i.e., the amplitude of deformation) to the applied oscillating force is shifted by a phase angle δ (see Figure 2a). This relation between the applied stress and the strain produced in the sample, elastic storage modulus (E′), and the loss modulus (E″) is calculated. E′ shows the sample’s ability to store or return energy, whereas E″ represents the ability of the sample to lose or dissipate energy. The ratio between E″ and E′ is called damping and is generally represented as tan δ (δ = E″/E′). Samples in DMA can be deformed by using different clamps e.g., tension (see Figure 2b), parallel plate bending, or shear stress. In the coatings industry, free coating samples, as shown in Figure 2b, are frequently used for measurements in DMA. Figure 2c shows the storage modulus, loss modulus, and tan δ of a typical free coating film sample. The Tg of the sample can be estimated from the peak values of loss modulus or tan δ. More details about the DMA can be found elsewhere [8,50].
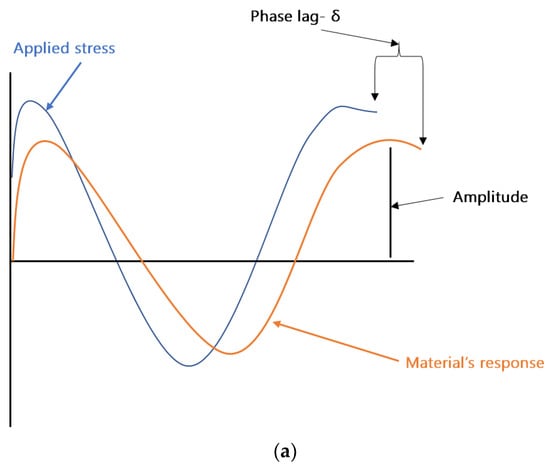
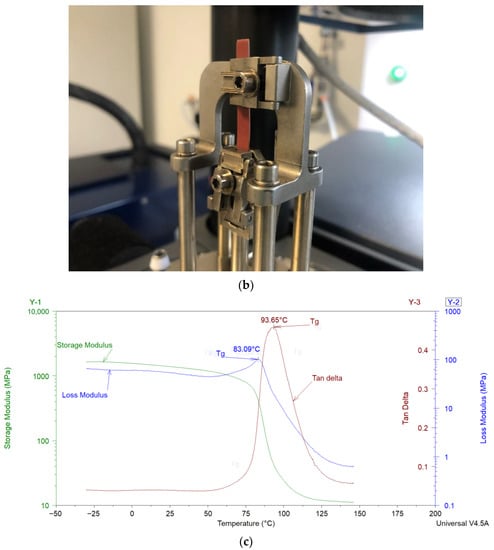
Figure 2.
(a) Schematic representation of an applied stress to a sample and the sample’s response in dynamic mechanical analysis (DMA). (b) Free coating sample in tension clamps of DMA. (c) Storage modulus, loss modulus, and tan δ results of a sample analyzed in tension mode in DMA.
While understanding the interfacial interactions in the particulate filled polymers using DMA tension mode results, it has been noticed that the peak value of tan δ is used to qualitatively indicate the internal friction of the polymer chains. At a given filler loading, particle size, and surface area, if the dispersion of the filler inside the matrix is good, the amount of mobile chain segments is assumed to be higher than in a filled system where the filler’s dispersion is relatively poor. More chain segments moving at the same time can increase the internal friction, and therefore, the loss modulus is increased, giving higher peak value of the tan δ at Tg. Generally, if the interfacial interactions between the matrix and filler particles are strong enough, the peak value of tan δ is reduced and the Tg shifts toward higher temperatures [11]. With increasing concentration of micro- or nanoparticles in a filled polymer, the value of the tan δ peak, typically, reduces due to increased interfacial interactions [51,52,53]. Therefore, DMA results (alone or in combination with other analytical techniques) can provide important information about the degree of filler dispersion (filler–filler interaction, filler–polymer interaction) and the extent of interfacial interactions in the interphase region.
2. Investigating Interfacial Interactions in Filled Polymers with DMA
The glass transition temperature (Tg) of the organic coatings is among the most important and famous thermal properties of the coatings. It determines the application conditions and application area of the coating. In general, most of the available open literature investigating the effects of interfacial interactions on the Tg of the filled polymer systems using DMA is directly related to the composites industry. However, polymeric coatings and composites share similarities, and therefore, the experimental results obtained for polymeric composites are, in most cases, applicable to polymeric coatings. As discussed above, an interfacial layer exists between the polymeric matrix and the filler particles independent of their size. If the size of filler particles is in the nanometer range, the volume fraction of this interfacial layer is higher than in the case where the filler particles are of micrometer size. In both cases, it is believed that the properties of the matrix located within this interfacial layer are different from the properties of the bulk of the matrix, which impacts the Tg of the total system, and DMA has been proven to an important tool in understanding the effect of interfacial interactions on the Tg of the filled polymers [54].
The work of Eisenberg et al. [6] shows that silica nanocomposites with different polymers (poly(dimethylsiloxane) (PDMS), styrene–butadiene–rubber (SBR), poly(viny1 acetate) (PVAc), poly(methy1 methacrylate) (PMMA), and poly(styrene) (PS)) can have two distinct Tgs. The authors used DMA to investigate the effect of the content of silica nanoparticles on a variety of different polymers. The peak of the tan δ curve was used to estimate the Tg. The wt % of silica nanoparticles (7 nm diameter) was varied from zero to as high as 50 wt %. Nearly all filled nanocomposites showed two distinct Tgs. The authors attributed the first Tg to the bulk of the polymer, whereas the second Tg was attributed to the polymer chains located in the interphase region of the nanocomposites. The interphase region was proposed to consist of two nanolayers, as shown schematically in Figure 1. The first nanolayer (around 1–20 Å from the surface of the nanoparticle) contains polymer chains that are highly immobile due to strong attachment with the surface of highly charged nanoparticles. The second nanolayer is thicker than the first one, which is formed around 25–90 Å away from the surface of the nanoparticles and contains the polymer chains, which are considered to be loosely bound to the nanoparticles. With increasing amounts of the nanosilica, the location of the first Tg did not change, but the value of tan δ was found to decrease. This decrease in the tan δ value of the first Tg was attributed to the reduction in the fraction of polymer chains available to participate in the first transition with increasing silica content in the nanocomposite. The second tan δ peak was broader, and depending upon the polymer type, it was located 40 to 110 °C higher than the first one. With increasing silica content, the second Tg reduced, and the size of the second peak decreased. The area under the two tan δ peaks was found to decrease with increasing the silica content; i.e., the tan δ curves became narrower at high filler content, indicating fewer polymer chains participating in the glass transition. Up to 20 wt % silica content, the area under the second tan δ peak was found to decrease much faster than that seen for the first tan δ peak. It was proposed that at high filler content (i.e., >20 wt %), the volume fraction of the polymer bound tightly with the filler surface increases, significantly causing a decrease in the width of the tan δ curves. It was also shown that the second Tg depends upon the nature and molecular weight of the polymer as well as the thermal history and filler content of the nanocomposite. Other researchers [55,56] have shown that the first or the innermost interfacial nanolayer determines the Tg of the nanocomposites.
It is important to mention the work of Robertson et al. [15], using rheometry and AFM to study the effect of filler particle size on the viscoelastic properties of filled SBR, which indicated that the second high temperature Tg seen in the work of Eisenberg et al. [6] may be related to the suppressed terminal flow of polymer chains. Robertson et al. [15] used precipitated silica of micrometer size with and without a coupling agent (3-mercaptopropyltrimethoxysilane), filler–filler shielding agent (n-octyltriethoxysilane), and as-received carbon black nanoparticles of different particle sizes. Rheometery was used to measure the shear storage modulus (G´), shear loss moduli (G´´), and the tan δ. Using temperature sweep experiments, the authors showed that by increasing the particle size of the used fillers (i.e., treated or untreated silica or carbon black nanoparticles), there is only one tan δ peak whose magnitude increases with increasing filler particle size, but the Tg remains nearly the same. The authors suggested that in comparison to composites with smaller particle size fillers, the higher peak value of tan δ for the rubber composites filled with bigger particles is due to the lower shear storage modulus of these composites in the region above the glass transition. Composites with big filler particles showed reinforcement above Tg, which was significantly less than that of the composites filled with small filler particles (i.e., polymeric chain dynamics are affected but not the segmental motion of the chains). Since tan δ is the ratio of G´´ to G´, it is easy to understand why the peak tan δ value is influenced by the differences in the G´, which were related to the particle size of the fillers used. As a result, the authors suggested that the difference in the peak value of tan δ is probably not indicative of the interfacial interactions between the filler and the resin. Nevertheless, AFM analysis of the same samples showed that the polymer chains closer to the surface of the fillers were stiffer than those situated away from the particle surface.
In a similar vein, DMA was used by Robertson et al. [57] to confirm the above-mentioned results; i.e., the dynamic modulus of composites in the rubbery state controls the height of the tan δ peak, and the higher the rubbery modulus, the lower the peak value of tan δ. A material-independent perspective was provided by employing a Havriliak–Negami (HN) model, which is heavily used for modeling polymer relaxations measured by DMA and dielectric spectroscopy in the frequency domain. E´, E´´, and tan δ were simulated by fixing the value of glassy modulus while changing the rubber modulus and careful selection of other model parameters. In agreement with the previous study where a single Maxwell element model was used [15], simulations with the HN model also showed that the peak value of tan δ (plotted again the angular frequency) reduced significantly by increasing the rubbery modulus value at a constant glassy modulus. Unlike tan δ, the peak value of the model-generated E´´ remained unaffected by the changes in the rubbery modulus. As a result, it was proposed that the dependence of the tan δ peak on the value of the rubbery modulus is a general viscoelastic effect that should not be discussed in relation to the interactions between the polymer and the used filler. Furthermore, the peak value of E´´ provides a more reliable measurement of the Tg of the composites in comparison to the peak value of tan δ.
Fragiadakis et al. [54] used a variety of analytical instruments to study the effect of sol–gel-based silica nanoparticles on the Tg of poly(dimethylsiloxane). The volume fraction of silica particles in the filled PDMS samples was varied from 0 to 16%, whereas the particle size was kept similar. Differential scanning calorimetry (DSC) results showed that by increasing the silica content in the composites, the fraction of the polymer layer immobilized on the surface of the silica particles (i.e., the interfacial layer) increased. The thickness of the interfacial layer was estimated to be approximately 2–3 nm. DMA results showed that in comparison to unfilled PDMS, the Tg (estimated from the peak of E´´) of the filled PDMS increased by about 10 K with increasing silica volume fraction. The E´ and E´´ moduli showed an increasing tendency with increasing volume fraction of the nanoparticle below Tg of the nanocomposite. A single E´´ and tan δ peak was observed in all nanocomposites. The authors concluded that the increase in Tg of the nanocomposite in comparison to the unfilled PDMS is an indication of the reduced mobility of the polymer chain segments in the interfacial layer.
Sattar et al. [11] showed that the addition of phosphonium ionic liquid (PIL) to the formulations of solution polymerized styrene butadiene rubber (SSBR), poly(butadiene) rubber, bis[3-(triethoxysilyl) propyl] tetrasulfide (TESPT) (a silane coupling agent), and precipitated silica can improve the interfacial interactions between the matrix and the filler particles. Transmission electron microscopy (TEM) revealed that the dispersion of silica particles in the matrix was improved by the addition of PIL. DMA analysis showed that the peak value of tan δ of the composite samples containing PIL was higher than that of the samples without PIL. The peak value of tan δ for samples with PIL increased because more chain segments were moving at that temperature, which consequently increased the internal friction, i.e., the loss modulus. The authors attributed this observation to the improved filler dispersion and reduced filler–filler interaction inside the matrix of samples with PIL. Tg of the composites with TESPT and PIL was found to be (≈10 °C) higher than those with TESPT but without PIL, which was attributed to the restricted segmental chain motion due to nonbonding interactions between PIL and SSBR. Nonbonding interactions between the PIL and SSBR include ionic cross-links and hydrogen bonding, cation−π, and supramolecular interactions.
Bindu et al. [4] showed that the addition of nanometer-sized zinc oxide (nano ZnO) to the natural rubber (NR) formulations increased the Tg of the composite in comparison to the neat NR. DMA results showed only one peak in the tan δ curve. Increasing the amount of nano ZnO up to 2 phr increased the E´ and Tg while reducing the peak value of tan δ. The measured tan δ curves became broader with increasing nano ZnO content. By comparing the ratio of theoretical and experimental area under the tan δ curves with the wt % of nano ZnO used, it was shown that the volume of the constrained polymer chains in the nanocomposites increased with increasing filler content. The authors attributed these observations to the increased interfacial interactions between the polymer chains and the filler particles. As in the glassy region, the E´ modulus of the nanocomposites in the rubbery region showed values higher than those measured for the neat polymer. The highest E´ modulus of the nanocomposite in the rubbery region was noticed for the sample with 2 phr nano ZnO. The authors concluded that this is a clear indication of homogeneous dispersion of the nano filler in the matrix and strong interfacial interactions between them. At nano ZnO phr greater than 2, these effects were not seen, which the authors attributed to the poor dispersion of the nanofiller particles in the composite.
DMA was used to study the interphase of polyester filled with glass fiber by Chua et al. [12]. Before addition to the polyester, the glass fibers were first treated with a variety of organosilanes that were supposed to improve the adhesion between the filler and the matrix. Filled polyester was cured with 1% methyl ethyl ketone, and the fiber volume fraction was kept at 0.50 for most of the samples. The apparent interfacial shear strength was measured according to ASTM D2344. DMA results showed that when γ-methactyloxypropyltrirnethoxysilane (MPS), vinyltriethoxysilane (VES), or rn, p-styrylethyltrimethoxysilane (SMS) coated glass fibers were filled in the polyester, the interfacial shear strength increased, and the peak value of tan δ decreased. The author attributed this observation to the presence of a functional group on the above-mentioned organosilanes capable of reacting with the polyester resin. Covalent bond formation between the moieties on the surface of the filler and the resin matrix reduced the motion of the polymeric chains, thereby resulting in a lower peak value of tan δ, indicating better interfacial strength. By increasing the volume fraction of glass fiber coated with MPS in the polyester, the Tg of the composite also increased, which is in agreement with the observation related to the peak value of tan δ. On the other hand, polyester filled with glass fiber treated with organosilanes that were not capable of reacting with the matrix showed a high peak value of tan δ indicative of low interfacial strength. Similar results were reported by Kubat et al. [53] using high-density polyethylene (HDPE) filled with glass spheres of different sizes. In some experiments, glass spheres were treated with azide functional alkoxysilane prior to filling in HDPE. The used silane-coupling agent provided a covalent bond between the HDPE and the glass spheres. In addition to temperature sweep experiments in DMA, Kubat et al. [53] used strain sweep experiments and showed that for the sample with high interfacial strength, the tan δ value at a given strain under isothermal conditions is significantly lower than those with poor interfacial strength. DMA-based results reported by Liang et al. [51] using low-density polyethylene (LDPE) filled with silane-treated glass beads complement the works of Chua et al. [12] and Kubat et al. [53].
Using model epoxy–amine coatings, Bashir et al. [52] analyzed the effect of micrometer-sized commercial feldspar on the Tg of coatings. DSC was mainly used in this study, but DMA also provided important insights into the interfacial interaction of epoxy resin with feldspar. Feldspar of two different particle sizes (i.e., d98 = 30 µm and 100 µm) was used, and the wt % of each feldspar was varied from 0 to 70 wt % in the coating. A few samples with micrometer and nanometer-sized silica at the same lambda value were also analyzed with DMA. Figure 3a shows that when particle size of the feldspar is kept constant, increasing the amount of feldspar decreases the peak value of tan δ while shifting the Tg to a slightly higher value. This indicates the dependence of filler–polymer interactions on feldspar content in the formulation. However, at the same feldspar content, it was expected to get a lower tan δ value for the coating with smaller feldspar as compared to the one having bigger sized feldspar (due to the fact that smaller particles have a high surface area leading to interfacial interactions higher than those observed with a bigger feldspar filled coating). The authors attributed this observation to the minute differences in the particle size distribution of the used feldspars. By using two silicas of significantly different particle size (i.e., one with an average particle size of 80 nm and the other with 13.5 µm), the authors were able to show that the interfacial interactions increase with decreasing the particle size of the filler used, which can be detected by the low peak of tan δ, as shown in Figure 3b.
Figure 3.
(a) Effect of particle size and content of feldspar used on the dynamic mechanical properties of model epoxy–amine coatings. (b) Effect of particle size of silica on the on E’ and tan δ of model epoxy–amine coating at the same lambda value [52].
With respect to the reduction in Tg upon using and increasing amounts of nanosilica, Sun et al. [58] reported similar results for epoxy–anhydride nanocomposites. According to the authors, a reduction in Tg with increasing amounts of nanosilica indicated the repulsive interfacial interactions between the resin and filler particle’s surface. In addition, the adsorbed water on the silica surface may have acted as a plasticizer, causing an appreciable depression in the Tg of the nanocomposite. An experimental investigation of Preghenella et al. [59] showed that water absorbed by the neat epoxy can also cause significant Tg depression. Moreover, the dependence of Tg and peak value of tan δ on the fumed silica content in epoxy composites reported by these authors was similar to that reported by Sun et al. [58] and Bashir et al. [52]. Dermani et al. [60] studied the effect of ionic liquid (IL) modified graphene oxide (GO) addition on the mechanical properties of model epoxy–amine coatings. 1-Butyl-3-methylimidazolium chloride (BMIM-Cl)-based IL was non-covalently supported on the surface of GO nanosheets before their dispersion in bisphenol A-based epoxy. The amount of IL-modified GO in the nanocomposites was varied from 0 to 0.12%. DMA of the samples showed an increase in the Tg of the nanocomposite up to 0.09% addition of IL-modified GO followed by a decrease in the Tg of 0.12%. The authors attributed the increase in Tg to the improved interfacial interactions between the nanofiller and the resin, while the decrease in Tg at higher nanofiller content was attributed to poor dispersion of the nanosheets in the composite. Yang et al. [61] studied the mechanical properties of poly(methylmethacrylated) (PMMA) reinforced with IL-modified nanosheets of reduced GO (rGO). The IL used to non-covalently modify the surface of rGO was based upon 1,6-bis[3-(vinyl-benzyl) imidazolium-1-yl] hexane chloride (Imi-IL). Compared to neat PMMA, a 58% rise in the storage modulus of the nanocomposites containing 2.08 vol% Imi-IL modified rGO was seen in the glassy region. The Tg of the nanocomposites shifted to higher values with increasing content of Imi-IL modified rGO, while the peak value of tan δ reduced. The authors attributed the rise in E´ to the good dispersion of nanofiller in the resin matrix, whereas strong interfacial interactions between the nanofiller in the resin matrix were considered as the reason for the rise in the Tg and reduction in the peak value of tan δ. The nanoscale roughness of the Imi-IL modified rGO promoted mechanical interlocking, Imi-IL mediated interactions of cation–π and/or π–π stacking along with the electrostatic and Van der Waals forces at the filler/polymer interface, and the possible hydrogen bonding between the oxygen groups on the surface of rGO and the carbonyl groups of PMMA have certainly helped improve the interfacial adhesion, therefore increasing the Tg of the nanocomposite.
For waterborne coatings, Kunniger et al. [62] studied the effect of the aging process on the viscoelastic properties of coatings for wood protection using DMA and Fourier Transform Infrared (FTIR) Spectroscopy. Nanofibrillated cellulose (NFC) was used as the nanofiller for 10 different types of commercial binders including acrylates, alkyd resins, polyurethane/acrylate hybrid resin, and vinyl acetate-based resin. In the coating formulations, a defoamers wetting agent, film-forming agent, and drying agents were also used to mimic industrially relevant formulations. The prepared aging specimens were aged in a fluorescent UV-accelerated weather tester at 60 °C and dry humidity conditions for up to 480 h. Viscoelastic properties of neat polymers and the NFC-filled coatings were measured with DMA before and after aging. For the unaged coating based upon the acrylic acid/methacrylic acid–styrene copolymer (Acr 3) with 0 to 3.5 wt % NFC, DMA results showed that the tan δ had two peaks, and the value of both the tan δ peaks decreased with increasing content of NFC, indicating the strong interfacial interactions of the binder with the NFC. The first Tg remained constant (around 10 °C), whereas the second Tg (around 80 °C) slightly increased with the increasing content of the NFC. These two peaks in the tan δ curve and the dependence of the second (high-temperature peak) on the NFC content are in good agreement with the above-mentioned results of Eisenberg et al. [6]. The E´ of the coatings in the glass transition region and the rubbery region increased with the increasing NFC content, which was aligned with the behavior of most filled thermoplastics. As compared to the acrylic binder-based coatings, the unaged coatings made with alkyd binders showed viscoelastic properties similar to those of thermosets. The E´ of the coating made with anionic, surfactant free long oil alkyd (Alk2) resin decreased in the glass transition region while it increased in the rubbery region upon adding NFC. The tan δ of the same coating showed one peak, and the peak value decreased with the increasing content of NFC, while the Tg decreased slightly when compared to neat Alk2. Once again, the reduction in peak value of tan δ indicated strong interfacial interactions between the alkyd resin and the NFC filler. After aging, acrylic resin-based coatings showed an increase in Tg (and storage moduli), which was less than that observed in alkyd resin-based coatings under similar conditions. The authors attributed this result to the fact that the chemical crosslinking in the alkyd resins was accelerated and reinitiated during aging experiments at 60 °C, causing an increase in Tg. The obtained results were not discussed with respect to the interfacial interactions between the binders used and the NFC filler.
3. Conclusions
From the discussion above involving a variety of polymers and fillers, it is evident that the interfacial interactions exist between the polymer matrix and the filler particles and DMA are an important analytical tool for investigating and understanding the interphase region of filled polymers. However, the magnitude of the effect of interfacial interactions on the bulk dynamic mechanical properties of the filled polymers depends upon several factors. These factors include (but are not limited to) the physical properties of the fillers (i.e., particle size, surface area, particle size distribution, geometry of the particles, etc.), chemical properties of the filler (e.g., original chemistry of the filler, type of surface treatment of the filler etc.), chemical and physical properties of the polymer used, quality of filler dispersion in the matrix, concentration of the filler in the composite, etc. Nevertheless, most of the studies involving a variety of polymers and (micrometer and nanometer sized) fillers suggest that in case of a strong interfacial interaction between the matrix and the filler, the peak value of tan δ reduces, whereas a significant increase in Tg of the composite is not always seen. Based upon experimental and modeling work, there also exists credible evidence showing that the reduction in the peak value of tan δ of filled polymers (with increasing filler content) is linked to the higher rubbery storage modulus and not to the interfacial interactions between the polymer matrix and the filler particles. Such studies are extremely relevant for the industries such as coatings, composites, polymer processing, etc., as they help in designing robust products. Finally, it should be highlighted that in commercial products (e.g., coatings), a range of different additives are used, and the effect of such additives on the interfacial interactions is relatively less understood. Therefore, there is significant space for more detailed and systematic studies about understanding the interfacial interactions in the filled polymers using versatile analytical tools such as DMA.
Funding
This research received no external funding.
Institutional Review Board Statement
Not Applicable.
Data Availability Statement
Not Applicable.
Conflicts of Interest
The authors declare no conflict of interest.
References
- Necolau, M.-I.; Pandele, A.-M. Recent Advances in Graphene Oxide-Based Anticorrosive Coatings: An Overview. Coatings 2020, 10, 1149. [Google Scholar] [CrossRef]
- Dalawai, S.P.; Saad Aly, M.A.; Latthe, S.S.; Xing, R.; Sutar, R.S.; Nagappan, S.; Ha, C.-S.; Kumar Sadasivuni, K.; Liu, S. Recent Advances in durability of superhydrophobic self-cleaning technology: A critical review. Prog. Org. Coat. 2020, 138, 105381. [Google Scholar] [CrossRef]
- Hooda, A.; Goyat, M.S.; Pandey, J.K.; Kumar, A.; Gupta, R. A review on fundamentals, constraints and fabrication techniques of superhydrophobic coatings. Prog. Org. Coat. 2020, 142, 105557. [Google Scholar] [CrossRef]
- Bindu, P.; Thomas, S. Viscoelastic Behavior and Reinforcement Mechanism in Rubber Nanocomposites in the Vicinity of Spherical Nanoparticles. J. Phys. Chem. B 2013, 117, 12632–12648. [Google Scholar] [CrossRef]
- Lin, Y.; Liu, L.; Xu, G.; Zhang, D.; Guan, A.; Wu, G. Interfacial Interactions and Segmental Dynamics of Poly(vinyl acetate)/Silica Nanocomposites. J. Phys. Chem. C 2015, 119, 12956–12966. [Google Scholar] [CrossRef]
- Tsagaropoulos, G.; Eisenberg, A. Dynamic Mechanical Study of the Factors Affecting the Two Glass Transition Behavior of Filled Polymers. Similarities and Differences with Random Ionomers. Macromolecules 1995, 28, 6067–6077. [Google Scholar] [CrossRef]
- Bailey, E.J.; Winey, K.I. Dynamics of polymer segments, polymer chains, and nanoparticles in polymer nanocomposite melts: A review. Prog. Polym. Sci. 2020, 105, 101242. [Google Scholar] [CrossRef]
- Schlesing, W.; Buhk, M.; Osterhold, M. Dynamic mechanical analysis in coatings industry. Prog. Organ. Coat. 2004, 49, 197–208. [Google Scholar] [CrossRef]
- Zheng, X.; Sauer, B.B.; Van Alsten, J.G.; Schwarz, S.A.; Rafailovich, M.H.; Sokolov, J.; Rubinstein, M. Reptation Dynamics of a Polymer Melt near an Attractive Solid Interface. Phys. Rev. Lett. 1995, 74, 407–410. [Google Scholar] [CrossRef]
- Schüller, J.; Mel’nichenko, Y.B.; Richert, R.; Fischer, E.W. Dielectric Studies of the Glass Transition in Porous Media. Phys. Rev. Lett. 1994, 73, 2224–2227. [Google Scholar] [CrossRef] [PubMed]
- Sattar, M.A.; Patnaik, A. Role of Interface Structure and Chain Dynamics on the Diverging Glass Transition Behavior of SSBR-SiO2-PIL Elastomers. ACS Omega 2020, 5, 21191–21202. [Google Scholar] [CrossRef]
- Chua, P.S. Dynamic mechanical analysis studies of the interphase. Polym. Compos. 1987, 8, 308–313. [Google Scholar] [CrossRef]
- Krutyeva, M.; Pasini, S.; Monkenbusch, M.; Allgaier, J.; Maiz, J.; Mijangos, C.; Hartmann-Azanza, B.; Steinhart, M.; Jalarvo, N.; Richter, D. Polymer dynamics under cylindrical confinement featuring a locally repulsive surface: A quasielastic neutron scattering study. J. Chem. Phys. 2017, 146, 203306. [Google Scholar] [CrossRef] [PubMed]
- Krutyeva, M.; Wischnewski, A.; Monkenbusch, M.; Willner, L.; Maiz, J.; Mijangos, C.; Arbe, A.; Colmenero, J.; Radulescu, A.; Holderer, O.; et al. Effect of Nanoconfinement on Polymer Dynamics: Surface Layers and Interphases. Phys. Rev. Lett. 2013, 110, 108303. [Google Scholar] [CrossRef]
- Robertson, C.G.; Lin, C.J.; Rackaitis, M.; Roland, C.M. Influence of Particle Size and Polymer−Filler Coupling on Viscoelastic Glass Transition of Particle-Reinforced Polymers. Macromolecules 2008, 41, 2727–2731. [Google Scholar] [CrossRef]
- Lyon, S.B.; Bingham, R.; Mills, D.J. Advances in corrosion protection by organic coatings: What we know and what we would like to know. Prog. Org. Coat. 2017, 102, 2–7. [Google Scholar] [CrossRef]
- Hinder, S.J.; Lowe, C.; Maxted, J.T.; Perruchot, C.; Watts, J.F. Intercoat adhesion failure in a multilayer organic coating system: An X-ray photoelectron spectroscopy study. Prog. Org. Coat. 2005, 54, 20–27. [Google Scholar] [CrossRef]
- Yang, C.; Zhu, D.; Yang, F.; Liu, Q.; Sun, C.; Lei, K.; Zheng, Z.; Wang, X. Quantitative analysis based on atomic force microscopy characterization of interfacial properties between carbon fibers and epoxy resin subjected to hygrothermal and thermal treatments. Compos. Sci. Technol. 2020, 198, 108278. [Google Scholar] [CrossRef]
- Kaufman, S.; Slichter, W.P.; Davis, D.D. Nuclear magnetic resonance study of rubber–carbon black interactions. J. Polym. Sci. Part A-2 Polym. Phys. 1971, 9, 829–839. [Google Scholar] [CrossRef]
- Nishi, T. Effect of solvent and carbon black species on the rubber–carbon black interactions studied by pulsed NMR. J. Polym. Sci. Polym. Phys. Ed. 1974, 12, 685–693. [Google Scholar] [CrossRef]
- Sadasivuni, K.K.; Cabibihan, J.-J.; Al-Maadeed, M.A.S.A. Chapter 8—NMR spectroscopy of polymer nanocomposites. In Spectroscopy of Polymer Nanocomposites; Thomas, S., Rouxel, D., Ponnamma, D., Eds.; William Andrew Publishing: Norwich, NY, USA, 2016; pp. 181–201. [Google Scholar] [CrossRef]
- Pazur, R.J.; Lee, D.; Walker, F.J.; Kasai, M. Low field 1H NMR investigation of plasticizer and filler effects in epdm. Rubber Chem. Technol. 2012, 85, 295–312. [Google Scholar] [CrossRef]
- Papon, A.; Saalwächter, K.; Schäler, K.; Guy, L.; Lequeux, F.; Montes, H. Low-Field NMR Investigations of Nanocomposites: Polymer Dynamics and Network Effects. Macromolecules 2011, 44, 913–922. [Google Scholar] [CrossRef]
- Ozisik, R.; Zheng, J.; Dionne, P.J.; Picu, C.R.; Meerwall, E.D.V. NMR relaxation and pulsed-gradient diffusion study of polyethylene nanocomposites. J. Chem. Phys. 2005, 123, 134901. [Google Scholar] [CrossRef] [PubMed]
- Douglass, D.C.; McBrierty, V.J. Interfacial effects on the NMR of composite polymers. Polym. Eng. Sci. 1979, 19, 1054–1063. [Google Scholar] [CrossRef]
- Legrand, A.P.; Lecomte, N.; Vidal, A.; Haidar, B.; Papirer, E. Application of NMR spectroscopy to the characterization of elastomer/filler interactions. J. Appl. Polym. Sci. 1992, 46, 2223–2232. [Google Scholar] [CrossRef]
- Bokobza, L.; Bruneel, J.-L.; Couzi, M. Raman spectroscopic investigation of carbon-based materials and their composites. Comparison between carbon nanotubes and carbon black. Chem. Phys. Lett. 2013, 590, 153–159. [Google Scholar] [CrossRef]
- Yan, X.; Itoh, T.; Kitahama, Y.; Suzuki, T.; Sato, H.; Miyake, T.; Ozaki, Y. A Raman Spectroscopy Study on Single-Wall Carbon Nanotube/Polystyrene Nanocomposites: Mechanical Compression Transferred from the Polymer to Single-Wall Carbon Nanotubes. J. Phys. Chem. C 2012, 116, 17897–17903. [Google Scholar] [CrossRef]
- Yan, X.; Sato, H.; Ozaki, Y. Chapter 4—Raman and tip-enhanced Raman scattering spectroscopy studies of polymer nanocomposites. In Spectroscopy of Polymer Nanocomposites; Thomas, S., Rouxel, D., Ponnamma, D., Eds.; William Andrew Publishing: Norwich, NY, USA, 2016; pp. 88–111. [Google Scholar] [CrossRef]
- Yan, X.; Suzuki, T.; Kitahama, Y.; Sato, H.; Itoh, T.; Ozaki, Y. A study on the interaction of single-walled carbon nanotubes (SWCNTs) and polystyrene (PS) at the interface in SWCNT–PS nanocomposites using tip-enhanced Raman spectroscopy. Phys. Chem. Chem. Phys. 2013, 15, 20618–20624. [Google Scholar] [CrossRef]
- Vo, L.T.; Anastasiadis, S.H.; Giannelis, E.P. Dielectric study of Poly(styrene-co-butadiene) Composites with Carbon Black, Silica, and Nanoclay. Macromolecules 2011, 44, 6162–6171. [Google Scholar] [CrossRef]
- Wu, S.; Tang, Z.; Guo, B.; Zhang, L.; Jia, D. Effects of interfacial interaction on chain dynamics of rubber/graphene oxide hybrids: A dielectric relaxation spectroscopy study. RSC Adv. 2013, 3, 14549–14559. [Google Scholar] [CrossRef]
- Klonos, P.; Kyritsis, A.; Bokobza, L.; Gun’ko, V.M.; Pissis, P. Interfacial effects in PDMS/titania nanocomposites studied by thermal and dielectric techniques. Colloids Surf. A Physicochem. Eng. Asp. 2017, 519, 212–222. [Google Scholar] [CrossRef]
- Eesaee, M.; David, E.; Demarquette, N.R. Dielectric Relaxation Dynamics of Clay-Containing Low-Density polyethylene Blends and Nanocomposites. Polym. Eng. Sci. 2020, 60, 968–978. [Google Scholar] [CrossRef]
- Li, H.; Zhang, X.; Wang, J.; Li, C.; Liu, S.; Wu, H.; Guo, S. The mechanism for the temperature-dependency of the interfacial interaction in polyamide/tin-fluoro-phosphate glass composites. Compos. Sci. Technol. 2018, 159, 273–282. [Google Scholar] [CrossRef]
- Klonos, P.; Pissis, P. Effects of interfacial interactions and of crystallization on rigid amorphous fraction and molecular dynamics in polylactide/silica nanocomposites: A methodological approach. Polymer 2017, 112, 228–243. [Google Scholar] [CrossRef]
- Klonos, P.; Bolbukh, Y.; Koutsiara, C.S.; Zafeiris, K.; Kalogeri, O.D.; Sternik, D.; Deryło–Marczewska, A.; Tertykh, V.; Pissis, P. Morphology and molecular dynamics investigation of low molecular weight PDMS adsorbed onto Stöber, fumed, and sol-gel silica nanoparticles. Polymer 2018, 148, 1–13. [Google Scholar] [CrossRef]
- Tadiello, L.; D’Arienzo, M.; Di Credico, B.; Hanel, T.; Matejka, L.; Mauri, M.; Morazzoni, F.; Simonutti, R.; Spirkova, M.; Scotti, R. The filler-rubber interface in styrene butadiene nanocomposites with anisotropic silica particles: Morphology and dynamic properties. Soft Matter 2015, 11, 4022–4033. [Google Scholar] [CrossRef] [PubMed]
- Wang, D.; Fujinami, S.; Nakajima, K.; Niihara, K.-I.; Inukai, S.; Ueki, H.; Magario, A.; Noguchi, T.; Endo, M.; Nishi, T. Production of a cellular structure in carbon nanotube/natural rubber composites revealed by nanomechanical mapping. Carbon 2010, 48, 3708–3714. [Google Scholar] [CrossRef]
- Maiti, M.; Bhowmick, A.K. New insights into rubber–clay nanocomposites by AFM imaging. Polymer 2006, 47, 6156–6166. [Google Scholar] [CrossRef]
- Zhang, S.; Liu, H.; Gou, J.; Ying, J.; Wang, Y.; Liu, C.; Shen, C. Quantitative nanomechanical mapping on poly(lactic acid)/poly(ε-caprolactone)/carbon nanotubes bionanocomposites using atomic force microscopy. Polym. Test. 2019, 77, 105904. [Google Scholar] [CrossRef]
- Ning, N.; Mi, T.; Chu, G.; Zhang, L.-Q.; Liu, L.; Tian, M.; Yu, H.-T.; Lu, Y.-L. A quantitative approach to study the interface of carbon nanotubes/elastomer nanocomposites. Eur. Polym. J. 2018, 102, 10–18. [Google Scholar] [CrossRef]
- Tian, C.; Chu, G.; Feng, Y.; Lu, Y.; Miao, C.; Ning, N.; Zhang, L.; Tian, M. Quantitatively identify and understand the interphase of SiO2/rubber nanocomposites by using nanomechanical mapping technique of AFM. Compos. Sci. Technol. 2019, 170, 1–6. [Google Scholar] [CrossRef]
- Tian, C.; Feng, Y.; Chu, G.; Lu, Y.; Miao, C.; Ning, N.; Zhang, L.; Tian, M. Interfacial nanomechanical properties and chain segment dynamics of fibrillar silicate/elastomer nanocomposites. Compos. Part B Eng. 2020, 193, 108048. [Google Scholar] [CrossRef]
- Zhang, M.; Li, Y.; Kolluru, P.V.; Brinson, L.C. Determination of Mechanical Properties of Polymer Interphase Using Combined Atomic Force Microscope (AFM) Experiments and Finite Element Simulations. Macromolecules 2018, 51, 8229–8240. [Google Scholar] [CrossRef]
- Jayanarayanan, K.; Rasana, N.; Mishra, R.K. Chapter 6—Dynamic Mechanical Thermal Analysis of Polymer Nanocomposites. In Thermal and Rheological Measurement Techniques for Nanomaterials Characterization; Thomas, S., Thomas, R., Zachariah, A.K., Mishra, R.K., Eds.; Elsevier: Amsterdam, The Netherlands, 2017; pp. 123–157. [Google Scholar] [CrossRef]
- Jia, Z.; Amirkhizi, A.V.; Nantasetphong, W.; Nemat-Nasser, S. Experimentally-based relaxation modulus of polyurea and its composites. Mech. Time-Depend. Mater. 2016, 20, 155–174. [Google Scholar] [CrossRef]
- Zeltmann, S.E.; Prakash, K.A.; Doddamani, M.; Gupta, N. Prediction of modulus at various strain rates from dynamic mechanical analysis data for polymer matrix composites. Compos. Part B Eng. 2017, 120, 27–34. [Google Scholar] [CrossRef]
- Diani, J.; Gilormini, P.; Merckel, Y.; Vion-Loisel, F. Micromechanical modeling of the linear viscoelasticity of carbon-black filled styrene butadiene rubbers: The role of the filler–rubber interphase. Mech. Mater. 2013, 59, 65–72. [Google Scholar] [CrossRef]
- Kevin, P.M. Dynamic Mechanical Analysis, A Practical Introduction, 2nd ed.; CRC Press: Boca Raton, FL, USA, 2008; p. 240. [Google Scholar] [CrossRef]
- Liang, J.Z. Dynamic Mechanical Properties and Characterization of Inorganic Particulate-filled Polymer Composites. J. Thermoplast. Compos. Mater. 2011, 24, 207–220. [Google Scholar] [CrossRef]
- Bashir, M.A.; Jakobsen, M.G.; Farstad, V.B. The Effect of Extender Particle Size on the Glass Transition Temperature of Model Epoxy Coatings. Polymers 2020, 12, 196. [Google Scholar] [CrossRef] [PubMed]
- Kubát, J.; Rigdahl, M.; Welander, M. Characterization of interfacial interactions in high density polyethylene filled with glass spheres using dynamic-mechanical analysis. J. Appl. Polym. Sci. 1990, 39, 1527–1539. [Google Scholar] [CrossRef]
- Fragiadakis, D.; Pissis, P. Glass transition and segmental dynamics in poly(dimethylsiloxane)/silica nanocomposites studied by various techniques. J. Non-Cryst. Solids 2007, 353, 4344–4352. [Google Scholar] [CrossRef]
- Mayes, A.M. Softer at the boundary. Nat. Mater. 2005, 4, 651–652. [Google Scholar] [CrossRef]
- Starr, F.W.; Schrøder, T.B.; Glotzer, S.C. Effects of a nanoscopic filler on the structure and dynamics of a simulated polymer melt and the relationship to ultrathin films. Phys. Rev. E 2001, 64, 021802. [Google Scholar] [CrossRef] [PubMed]
- Warasitthinon, N.; Robertson, C.G. Interpretation of the tanδ peak height for particle-filled rubber and polymer nanocomposites with relevance to tire tread performance balance. Rubber Chem. Technol. 2018, 91, 577–594. [Google Scholar] [CrossRef]
- Sun, Y.; Zhang, Z.; Moon, K.-S.; Wong, C.P. Glass transition and relaxation behavior of epoxy nanocomposites. J. Polym. Sci. Part B Polym. Phys. 2004, 42, 3849–3858. [Google Scholar] [CrossRef]
- Preghenella, M.; Pegoretti, A.; Migliaresi, C. Thermo-mechanical characterization of fumed silica-epoxy nanocomposites. Polymer 2005, 46, 12065–12072. [Google Scholar] [CrossRef]
- Dermani, A.K.; Kowsari, E.; Ramezanzadeh, B.; Amini, R. Screening the effect of graphene oxide nanosheets functionalization with ionic liquid on the mechanical properties of an epoxy coating. Prog. Org. Coat. 2018, 122, 255–262. [Google Scholar] [CrossRef]
- Yang, Y.-K.; He, C.-E.; Peng, R.-G.; Baji, A.; Du, X.-S.; Huang, Y.-L.; Xie, X.-L.; Mai, Y.-W. Non-covalently modified graphene sheets by imidazolium ionic liquids for multifunctional polymer nanocomposites. J. Mater. Chem. 2012, 22, 5666–5675. [Google Scholar] [CrossRef]
- Künniger, T.; Grüneberger, F.; Fischer, B.; Walder, C. Nanofibrillated cellulose in wood coatings: Viscoelastic properties of free composite films. J. Mater. Sci. 2017, 52, 10237–10249. [Google Scholar] [CrossRef]


Publisher’s Note: MDPI stays neutral with regard to jurisdictional claims in published maps and institutional affiliations. |
© 2021 by the author. Licensee MDPI, Basel, Switzerland. This article is an open access article distributed under the terms and conditions of the Creative Commons Attribution (CC BY) license (http://creativecommons.org/licenses/by/4.0/).