Article

Research on Dust Concentration and Migration Mechanisms on Open-Pit Coal Mining Roads: Effects of Meteorological Conditions and Haul Truck Movements

by
Fisseha Gebreegziabher Assefa
1,2,
Lu Xiang
1,
Zhongao Yang
1,
Angesom Gebretsadik
2,3,
Abdoul Wahab
1,
Yewuhalashet Fissha
2,4,*,
N. Rao Cheepurupalli
2 and
Mohammed Sazid
5,*
1
School of Mines, China University of Mining and Technology, Xuzhou 221000, China
2
Faculty of Mines, Aksum Institute of Technology, Aksum University, Aksum 7080, Ethiopia
3
Division of Sustainable Resources Engineering, Graduate School of Engineering, Hokkaido University, Sapporo 060-8628, Japan
4
Department of Electrical and Computer Engineering, National Institute of Technology, Asahikawa College, 2-2-1-6 Syunkodai, Asahikawa 071-8142, Japan
5
Department of Mining Engineering, King Abdulaziz University, Jeddah 21589, Saudi Arabia
*
Authors to whom correspondence should be addressed.
Mining 2025, 5(3), 43; https://doi.org/10.3390/mining5030043
Submission received: 27 May 2025 / Revised: 27 June 2025 / Accepted: 1 July 2025 / Published: 7 July 2025

Abstract

Dust emissions from unpaved haul roads in open-pit coal mining pose a significant risk to air quality, health, and operational efficiency of mining operations. This study integrated real-time field monitoring with numerical simulations using ANSYS Fluent 2023 R1 to investigate the generation, dispersion, and migration of particulate matter (PM) at the Ha’erwusu open-pit coal mine under varying meteorological conditions. Real-time measurements of PM2.5, PM10, and TSP, along with meteorological variables (wind speed, wind direction, humidity, temperature, and air pressure), were collected and analyzed using Pearson’s correlation and multivariate linear regression analyses. Wind speed and air pressure emerged as dominant factors in winter, whereas wind and temperature were more influential in summer (R2 = 0.391 for temperature vs. PM2.5). External airflow simulations revealed that truck-induced turbulence and high wind speeds generated wake vortices with turbulent kinetic energy (TKE) peaking at 5.02 m2/s2, thereby accelerating particle dispersion. The dust migration rates reached 3.33 m/s within 6 s after emission and gradually decreased with distance. The particle settling velocities ranged from 0.218 m/s for coarse dust to 0.035 m/s for PM2.5, with dispersion extending up to 37 m downwind. The highest simulated dust concentration reached 4.34 × 10⁻² g/m3 near a single truck and increased to 2.51 × 10⁻¹ g/m3 under multiple-truck operations. Based on spatial attenuation trends, a minimum safety buffer of 55 m downwind and 45 m crosswind is recommended to minimize occupational exposure. These findings contribute to data-driven, weather-responsive dust suppression planning in open-pit mining operations and establish a validated modeling framework for future mitigation strategies in this field.

1. Introduction

Open-pit mining operations, from exploration to final processing, generate significant amounts of particulate matter (PM), which poses serious challenges to air quality, human health, and mining efficiency [1]. Among the dust sources in open-pit mines, transportation activities on unpaved haul roads are the most significant, accounting for 80–96% of PM10 emissions from surface mining operations [2,3,4]. These activities generate substantial amounts of PM, with unpaved road haulage alone producing approximately 0.180 kg of PM10 and 0.726 kg of total suspended particles (TSP) per ton of coal output [5]. Dust particles, particularly those with diameters less than 10 µm (PM10) and 2.5 µm (PM2.5), are highly hazardous to both human health and the environment [6]. In the Ha’erwusu open-pit coal mine, dust is mainly PM10 and PM2.5, with aerodynamic diameters smaller than 10 µm and 2.5 µm, respectively [7].
Respirable dust, a major contributor to pneumoconiosis, the most common occupational illness in China, is a critical concern in mining areas [8]. Studies have indicated that PM concentrations are typically higher in underground coal mines than in surface mines; however, respirable crystalline silica concentrations tend to be considerably higher in open-pit mining environments due to surface exposure and high mechanization levels [9,10,11]. The health risks associated with dust are substantial, with particles as small as 1.0 µm posing a 99.4% probability of danger when passing through the nasal cavity [12]. Additionally, dust pollution significantly impedes the expansion of open-pit mines and is a crucial factor for the sustainable growth of the mining industry [13]. In arid regions, open-pit coal mines generate large amounts of dust, seriously polluting the air and posing a threat to public health and safety [14,15]. Mine geometry and local meteorological conditions influence dust dispersion within open-pit mines. Terrain affects dust distribution, concentrating it on the downwind side due to high-speed wind flow, making this area critical for dust control [4,16]. Wind flow is the primary driver of particle pollution, and dust mass concentration is correlated with vehicle velocity, road dust load, moisture content, wind speed, and wind direction [17,18,19]. Research has shown shallow mines experience higher wind speeds than deeper mines, leading to more tremendous dust uplift and migration [20]. Studies on blasting dust migration have highlighted how pit depth influences dust diffusion, with more bottomless pits exhibiting slower dissipation rates without strong winds [21,22]. In deep open-pit mines, recirculation flows can cause dust to aggregate towards upwind slopes, exacerbating pollution levels. This phenomenon is particularly pronounced under certain blast locations and wind conditions [23]. Blasting operations can produce dust concentrations as high as 3.45 × 10⁻² kg/m3 immediately after detonation [24]. Seasonal variations also play a critical role; according to Li et al.’s research, spring in northern China experiences the highest dust emissions from dry land and strong winds [25]. In addition, winter seasons tend to have higher dust arrival rates, exacerbating pollution levels [26].
The expansion of open-pit mines is significantly hindered by dust pollution, making accurate dust measurement and mitigation crucial for sustainable industrial development. Research has shown that vehicle weight, travel distance, frequency of movement, and speed are key factors influencing dust emissions from haul roads [27]. Operational aspects, such as haul road conditions, vehicle types, and mining layout, influence dust generation and dispersion mechanisms. Studies have shown that high truck speeds contribute significantly to dust resuspension, increasing PM concentrations in the surrounding air [25]. In addition, the nature of the road surface, including moisture levels and compaction, determines the dust emission rate [28]. Mitigation strategies such as road wetting and chemical dust suppressants have been widely studied, with some research suggesting that polymer-based stabilizers could offer long-term dust control solutions [29,30]. However, their effectiveness depends on the environmental conditions and application frequency, highlighting the need for further optimization of dust suppression techniques. Meteorological disturbances, including temperature fluctuations and pressure variations, are critical for dust entrainment and migration [31].
Researchers have employed various methods to monitor and model dust dispersion to address the challenges of dust pollution. For example, Wei et al. [32] used filter paper weight and photoelectric direct reading methods to assess dust concentration, expressed as mass concentration. Unmanned aerial vehicles (UAVs) have also been used to monitor dust distribution patterns in open-pit mines, providing valuable data on vertical and horizontal dust dispersion [33]. Remote sensing technologies offer a cost-effective solution for dynamically monitoring coal mining dust zones [34]. In recent years, computational models have increasingly been used to predict dust concentrations and dispersion patterns. For instance, the LSTM-attention model has demonstrated higher stability and prediction accuracy than traditional methods, such as autoregressive integrated moving average (ARIMA) [25]. Similarly, artificial neural networks (ANN) have been employed to predict particle concentrations at specific locations, with results showing close alignment with the experimental data [35]. Computational fluid dynamics (CFD) software such as ANSYS CFX has proven to be an accurate and adaptable tool for simulating wind effects around piles and other mining structures [36].
Despite these advancements, significant gaps remain in our understanding of dust dispersion in open-pit mines. Previous studies have focused on flat or simplified terrain models, neglecting the complex mining topography, such as bench faces and crosswind effects [20]. Additionally, while CFD models have been used to simulate wind effects, studies have not integrated terrain features with multiple vehicles into CFD-DPM (discrete phase model) simulations to predict dust migration patterns accurately [37,38]. Moreover, most studies have focused on single-vehicle scenarios, overlooking the dynamic interactions between multiple trucks traveling on the same path, which can significantly amplify dust generation and dispersion [39]. This limits the ability of existing models to provide actionable insights into dust mitigation in real-world mining scenarios.
This study advances the current understanding of dust dispersion on open-pit mining roads by integrating field measurements with advanced CFD-DPM coupling simulations. Unlike previous research, which has primarily focused on overall dust concentration patterns, this study provides a detailed analysis of the dust particle size distribution along transportation paths, considering the combined effects of meteorological conditions on PM concentration by Pearson correlation and multivariate linear regression analysis, and simulation of vehicle movements with and without terrain topography. An additional novelty of this study is the simulation of multiple trucks traveling on the same path, which captures the dynamic interactions between vehicles and their cumulative impact on dust generation and dispersion. Using Eulerian-Lagrangian FLUENT simulations, we accurately represented the dust migration dynamics in complex terrains with bench faces and crosswinds. Our findings offer practical recommendations for dust mitigation, such as optimal safety distances, and contribute to sustainable mining practices by highlighting the critical roles of meteorological factors, terrain features, and multiple-vehicle interactions in dust dispersion.

2. Materials and Methods

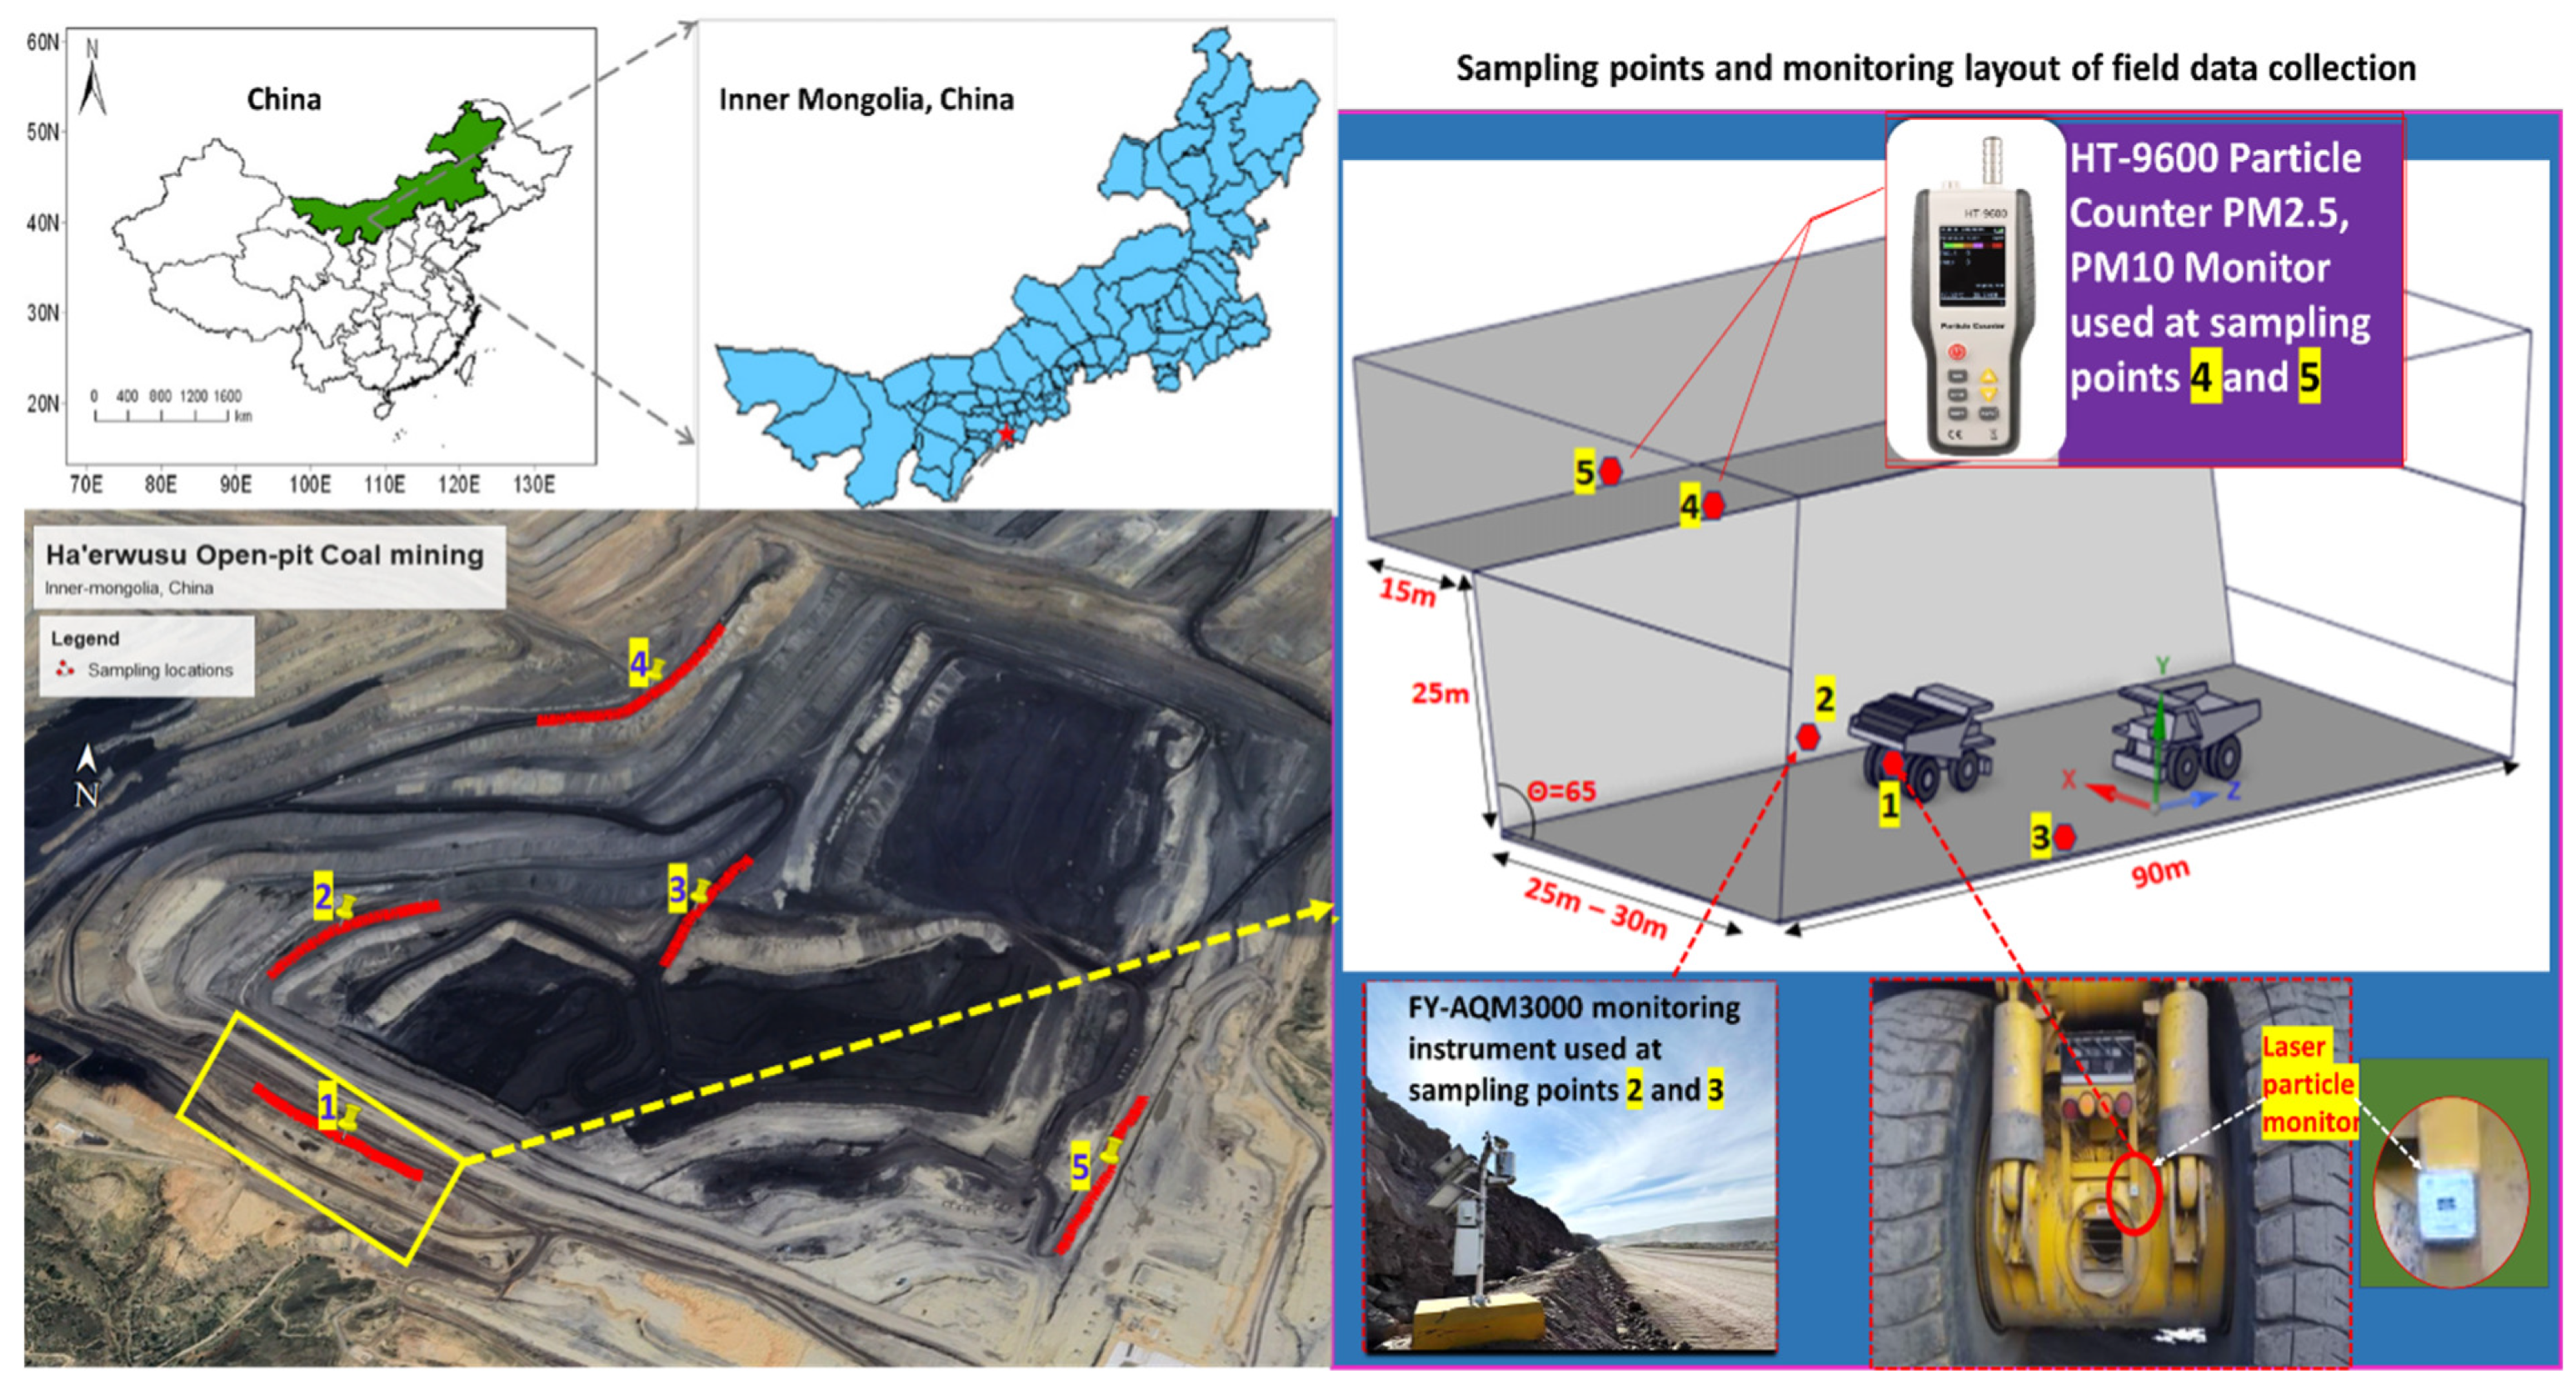
2.1. Study Site and Data Sources

The Ha’erwusu Surface Coal Mine (HSCM), one of China’s largest open-pit coal mines, was selected as the study site because of its high levels of dust generation from haul roads. The mine is located at 39°43′1″ to 39°43′52″ N and 111°15′06″ to 111°16′7″ E. As shown in Figure 1, the study area includes active haul roads, where trucks operate regularly, ensuring realistic field conditions. The collected data included meteorological measurements (temperature, humidity, air pressure, wind direction, and wind speed), haul road surface conditions, road moisture content, and truck speeds based on onsite observations. Sampling regions were selected based on active work areas with significant dust generation potential, including the haul road downwind and crosswind sections.

2.2. Field Monitoring Layout and Sampling Design

The field experiment aimed to quantify the dust dispersion from moving truck transportation under various meteorological conditions. A comprehensive monitoring setup was established along the haul road to capture real-time dust concentrations and environmental parameters. To accurately assess the mechanisms of dust generation and diffusion in an open-pit coal mine environment, a carefully structured field monitoring and sampling design was implemented at five key sampling locations strategically distributed across the open pit. These locations were selected based on their elevation, proximity to dust sources, and exposure to prevailing wind conditions to capture both vertical and horizontal movement of particulate matter (PM). As shown in Figure 1, Sampling Location 1 was selected as the primary and most detailed analysis site due to its environmental complexity, high traffic density, and strong wind influence. It was also adopted as the reference location for simulation validation. Sampling Locations 1, 4, and 5 are placed on higher benches, while Locations 2 and 3 are located at the pit bottom, representing contrasting elevation levels. This arrangement enables the study of elevation-driven differences in wind-driven dispersion, with higher points experiencing more turbulent and varied wind patterns and lower points being more enclosed and potentially subject to dust settling. These elevation differences were fundamental in assessing how dust behaves vertically, including uplift from the pit bottom and long-range horizontal transport. Point 1 is positioned directly behind a haul truck to monitor the continuous dust generation at the emission source.
A laser particle counter, manufactured in Qingdao, China, was deployed here for 25 consecutive days during the summer, recording TSP, PM10, and PM2.5 in real-time (Table 1). This high-frequency dataset captures the dynamic nature of truck-induced dust emissions and serves as the baseline for comparing dispersion at other points. Points 2 and 3 are set up 4 m laterally from the haul road edge on the left and right sides, respectively. These positions monitor the initial horizontal dispersion of dust under wind influence and vehicular turbulence. The FY-AQM3000 monitoring station (as shown in Figure 1 and Table 1), manufactured by Scince Purge Technology (Qingdao, China) Co., Ltd., was used to collect PM concentration data (PM2.5, PM10, and TSP) and real-time meteorological information such as wind speed, direction, temperature, and humidity, enabling integrated analysis of dust behavior under natural conditions.
To assess the lateral extent of dust migration, points 4 and 5 are located at a higher elevation bench, approximately 25 m above the road and up to 15 m and 30 m, respectively, horizontal distance from the loaded truck dust emission source. These points are purposefully placed in inactive zones with no ongoing mining activities, eliminating interference and allowing for a clear assessment of long-range and vertical dust dispersion, particularly influenced by wind effects. The HT-9600 handheld particle counter manufactured by Oumij, China, was employed at these stations to track PM2.5 and PM10 (as shown in Table 1), helping to determine the extent and concentration gradients of dispersed dust over distance and elevations, which are further from the emission source and experience lower average concentrations (e.g., PM2.5 ≈ 102 µg/m3), staying within the linear detection range of the instrument, and measurements were conducted in short bursts (typically 60 s) at multiple intervals rather than continuous long-term exposure, minimizing the risk of optical window contamination or laser scattering interference. Sampling Location 1 was specifically chosen for this detailed layout because it experiences the highest traffic flow throughout the monitoring period, making it a representative site for scenarios involving intense dust generation. Moreover, its high elevation exposes it significantly to varying wind speeds and directions, creating ideal conditions for examining wind-induced dispersion patterns. These unique environmental dynamics also make Location 1 suitable for numerical simulation, allowing field data to be cross-validated with computational models of dust movement under realistic conditions.
Importantly, the entire field monitoring campaign was conducted in both summer and winter, enabling the study to assess seasonal variability in dust behavior. This dual-seasonal approach provides insight into how cold, humid winter conditions and hot, dry summer conditions affect both dust emission rates and diffusion distances, which is critical for improving dust control strategies and modeling accuracy across different climatic scenarios. The design captures the full spectrum of dust dynamics by integrating real-time source monitoring, crosswind lateral dispersion, and long-range vertical movement. The focus on Sampling Location 1 as a detailed case study and simulation base adds a layer of depth and scientific rigor, enhancing both the practical relevance and novelty of the study.

2.3. Meteorological Data Monitoring and Data Analysis

To assess how atmospheric conditions affect dust generation and migration on roads in open-pit mines, extensive meteorological data collection was conducted along with particulate matter (PM) sampling during winter and summer. The monitoring aimed to capture seasonal variations in temperature, humidity, wind speed, wind direction, and air pressure, which are known to significantly affect dust behavior in terms of emission intensity, travel distance, and settling characteristics. At sampling points 2 and 3, located on opposite sides of the haul road, FY-AQM3000 manufactured by environmental monitoring instruments were installed to continuously record real-time PM concentration and meteorological data throughout the study period. The parameters measured included wind speed (m/s), wind direction (°), ambient temperature (°C), relative humidity (%), and atmospheric pressure (hPa). These instruments operated alongside PM sensors (monitoring PM2.5, PM10, and TSP), ensuring synchronized temporal resolution between meteorological and air quality data. The meteorological data served as the foundation for the simulation study, providing the necessary boundary conditions for accurately modeling wind fields and dust plume behavior. Average summer wind speed and direction data were input into the CFD model to simulate airflow over realistic mining topography. In contrast, temperature and pressure data informed the atmospheric stability profiles used in the simulations.
Quantitative statistical analysis was performed to strengthen the understanding of relationships between meteorological factors and PM concentration. Pearson’s correlation coefficient was applied to examine linear associations between variables such as wind speed, humidity, and PM levels across the monitoring stations. Data were recorded per hour over multiple passes to determine representative peak values per season, and processed using statistical filtering to remove outliers and missed values and obtain peak representative values. This analysis identified the dominant environmental drivers influencing dust behavior in different seasons. Furthermore, multivariate linear regression analysis was conducted to evaluate the combined effect of multiple meteorological parameters on PM2.5, PM10, and TSP concentrations. This provided predictive insight into how complex environmental interactions affect dust dispersion, supporting the development of more effective dust control and forecasting strategies.
Statistical analysis was performed using Pearson’s correlation coefficient (Equation (1)) and multivariate linear regression (Equation (2)) to assess the relationship between the meteorological factors and dust concentrations. The correlation coefficient ( r p c c ) was calculated using the following equations:
r p c c = i = 1 n   x i x ¯ y i y ¯ i = 1 n   x i x ¯ 2 i = 1 n   y i y ¯ 2  
where x and y represent the sample mean of the x and y variables, respectively, and i represents the sample number of the x and y variables. This analysis helped to identify the key factors influencing dust concentrations and provided insights into the mechanisms of dust dispersion in mines.
Y = β 0 + β 1 X 1 + β 2 X 2 + β 3 X 3 + + β n X n + ε
where, Y : Dependent variable (e.g., PM2.5, PM10, or TSP concentration), X 1 ,   X 2 ,   X 3   Independent variables (e.g., wind speed, temperature, humidity, etc.), β 0 : Intercept (baseline value of Y when all X are zero), β 1 ,   β 2 ,   β 3 : Regression coefficients representing the effect size of each independent variable, ε : Error term (residual differences not explained by the model).
The multicollinearity assumption and regression output are combined to form the Variance Inflation Factor (VIF), whose average value must be less than ten to show there is no multicollinearity issue between the independent variables [40,41]. The VIF equation displays as (Equation (3)).
V I F i = 1 1 R i 2  
where, R i 2 is the result of a regression of the ith predictor on all other predictors, and V I F i is the variance inflation factor with the i th predictor.

3. Numerical Simulation Settings and Parameters

A comprehensive 3d Computational Fluid Dynamics (CFD) simulation study was conducted using ANSYS Fluent to analyze dust generation, dispersion, and migration under realistic mining operating conditions to complement the statistical evaluation of meteorological factors and dust concentration dynamics. The simulation study focused on the summer season, utilizing the corresponding field-recorded meteorological data to replicate typical warm-weather operating scenarios. This seasonal focus was chosen because summer conditions in the study area are characterized by higher temperatures, drier road surfaces, and consistent wind flows, which significantly influence dust emission and transport behavior. As shown in Table 2 and Table 3, the simulations employed the Eulerian–Lagrangian framework and the Discrete Phase Model (DPM) to track the movement of individual dust particles within a continuous airflow. This approach enables the accurate simulation of dust particle dynamics, including interactions with turbulent air currents, moving vehicles, and complex terrain features, making it ideal for open-pit mining environments.
Airflow turbulence was modeled using the RNG k-ε turbulence model, which is well-suited for simulating high Reynolds number flows and solves small-scale turbulent eddies caused by vehicle movement and terrain-induced wind deflection. This model effectively captures the fine-scale turbulent structures critical to understanding how dust plumes evolve in real-world mining settings. The simulation domain was based on the real geometry of Sampling Location 1, which includes active haul roads and elevated bench surfaces. The topography was imported to reflect bench gradients and geometry, allowing the model to consider how elevation differences and terrain shape influence airflow behavior and dust uplift. Boundary conditions were assigned as follows: the inlet boundary was defined as a velocity inlet with wind speeds of 3, 5, 8, and 10 m/s, based on summer field measurements; the outlet boundary was set as a pressure outlet to allow natural air and dust exit; and domain walls, including haul road surfaces, truck bodies, and terrain features, were modeled as stationary no-slip walls. Truck wheels were modeled with a rotational speed of 7.12 rad/s to replicate real vehicle dynamics. Two distinct simulation scenarios were conducted: a single-truck simulation, representing a single haul truck moving along the road to isolate direct dust emissions and near-source dispersion behavior; and a multiple-truck simulation, where two trucks were introduced sequentially or simultaneously to assess the cumulative effect of traffic-induced turbulence, dust concentration buildup, and potential interaction of multiple dust plumes.
Dust particle emissions were modeled via surface injection at the tire-road interface and the rear of the truck body. Emission rates were set based on road surface conditions observed in the summer and based on empirical values: 0.1 kg/s for dry roads, 0.01 kg/s for partially watered roads (after 1 h), and 0.001 kg/s for fully wetted conditions, and similar findings have been reported in previous studies [42]. The particle size distribution followed a Rosin-Rammler distribution, with diameters ranging from 1 to 100 µm, representing the full range of PM2.5, PM10, and TSP observed in the field. This distribution was used based on the particle characteristics of dust sampled during field experiments. The spherical drag law was applied to the dust particles, with motion influenced by gravitational force, drag force, Saffman lift, and pressure gradients. These forces determine the particles’ settling behavior and transport distance under varying airflow and topographic conditions.
The simulation produced detailed data on dust concentration profiles, particle settling velocities, migration distances across bench and road segments, vehicle-induced turbulent kinetic energy (TKE), effects of wind speed and wind direction, and the influence of terrain elevation and slope on dust plume behavior. Combining field-recorded data and realistic traffic conditions, the simulation provided a robust and physically accurate representation of dust dispersion. It enabled comparative assessment of single vs. multiple-truck operations, quantified the influence of terrain-induced flow modifications, and validated field observations with predictive modeling. This integrative approach enhances our understanding of dust transport mechanisms and informs the development of targeted mitigation strategies for dust control in open-pit mining operations.

4. Mathematical and Development of Physical Grid Model

4.1. Mathematical Model and Theoretical Basis of Gas-Phase Turbulence

This study employed a gas-phase turbulence model to simulate the complex airflow patterns in an open-pit mine, which is critical for understanding dust dispersion. This research covers these models’ fundamental concepts, development methods, and applications, referencing two primary texts: “An Introduction to Computational Fluid Dynamics (CFD)”. “A key element of computational fluid dynamics (CFD) is modeling gas-phase turbulence, which is essential in modern industry. Computational Fluid Dynamics: The Finite Volume Method, 2nd Edition” [36], and “Computational Fluid Dynamics: The Basics with Applications” [43]. The simulation employed the RNG k-ε turbulence model, ideal for capturing the complex, high-Reynolds-number flow characteristics induced by vehicle movement and terrain features. This model simulates air and dust particle interactions, using the Discrete Phase Model (DPM) to track individual particles and their dispersion under various wind conditions. The model is based on Reynolds-averaged Navier-Stokes (RANS) equations, which decompose the flow into mean and fluctuating components. The governing equations for the RNG k-ε model are as follows:
  • Turbulent Kinetic Energy (k)
t ρ k + x i ρ k u i = x j α k μ e f f k x j + G k + G b ρ ϵ Y M + S k
  • Dissipation Rate (ε)
t ρ ϵ + x i ρ ϵ u i = x j α ϵ μ e f f ϵ x j + C 1 ϵ ϵ k G k + C 3 ϵ G b C 2 ϵ ρ ϵ 2 k R ε + S ϵ
where Gk represents the generation of turbulence kinetic energy due to the mean velocity gradients, Gb is the generation of turbulence kinetic energy due to buoyancy, and Y M   represents the contribution of the fluctuating dilatation in compressible turbulence to the overall dissipation rate, including the quantities α k and α ϵ , which are the inverse effective Prandtl numbers for k and ϵ, respectively. Sk and Sϵ are user-defined source terms.

4.2. Gas-Solid Two-Phase Flow Models

A gas-solid two-phase flow model was employed to simulate the dispersion of dust particles in the airflow. This model treats air as a continuous phase and dust particles as a discrete phase, allowing the tracking of individual particles within the flow field. The following equation of motion governs the motion of dust particles: the particle’s inertia and the forces acting on it, such as drag, gravity, Saffman lift, and pressure gradient forces, are considered, and previous research [11] provides a specific expression (Equation (6)):
d u p d t = u u p τ r + g ρ p ρ ρ p + 5.188 v 1 / 2 ρ d i j ρ p d p d k l d l k 1 / 4 u u p ρ ρ p u u
where, D r a g   f o r c e = u u p τ r g r a v i t a t i o n a l   f o r c e = g ρ p ρ ρ p , l i f t   f o r c e = 5.188 v 1 2 ρ d i j ρ p d p d k l d l k 1 4 u u p , pressure   gradient   forces = ρ u ρ p , where, u p particles’ velocity vector, u fluid velocity vector, g acceleration due to gravity, τ r particle relaxation time, ρ p particles density, ρ , fluid density, v fluid kinematic viscosity, d p particle diameter, d i j strain rate tensor component, u Fluid velocity gradient

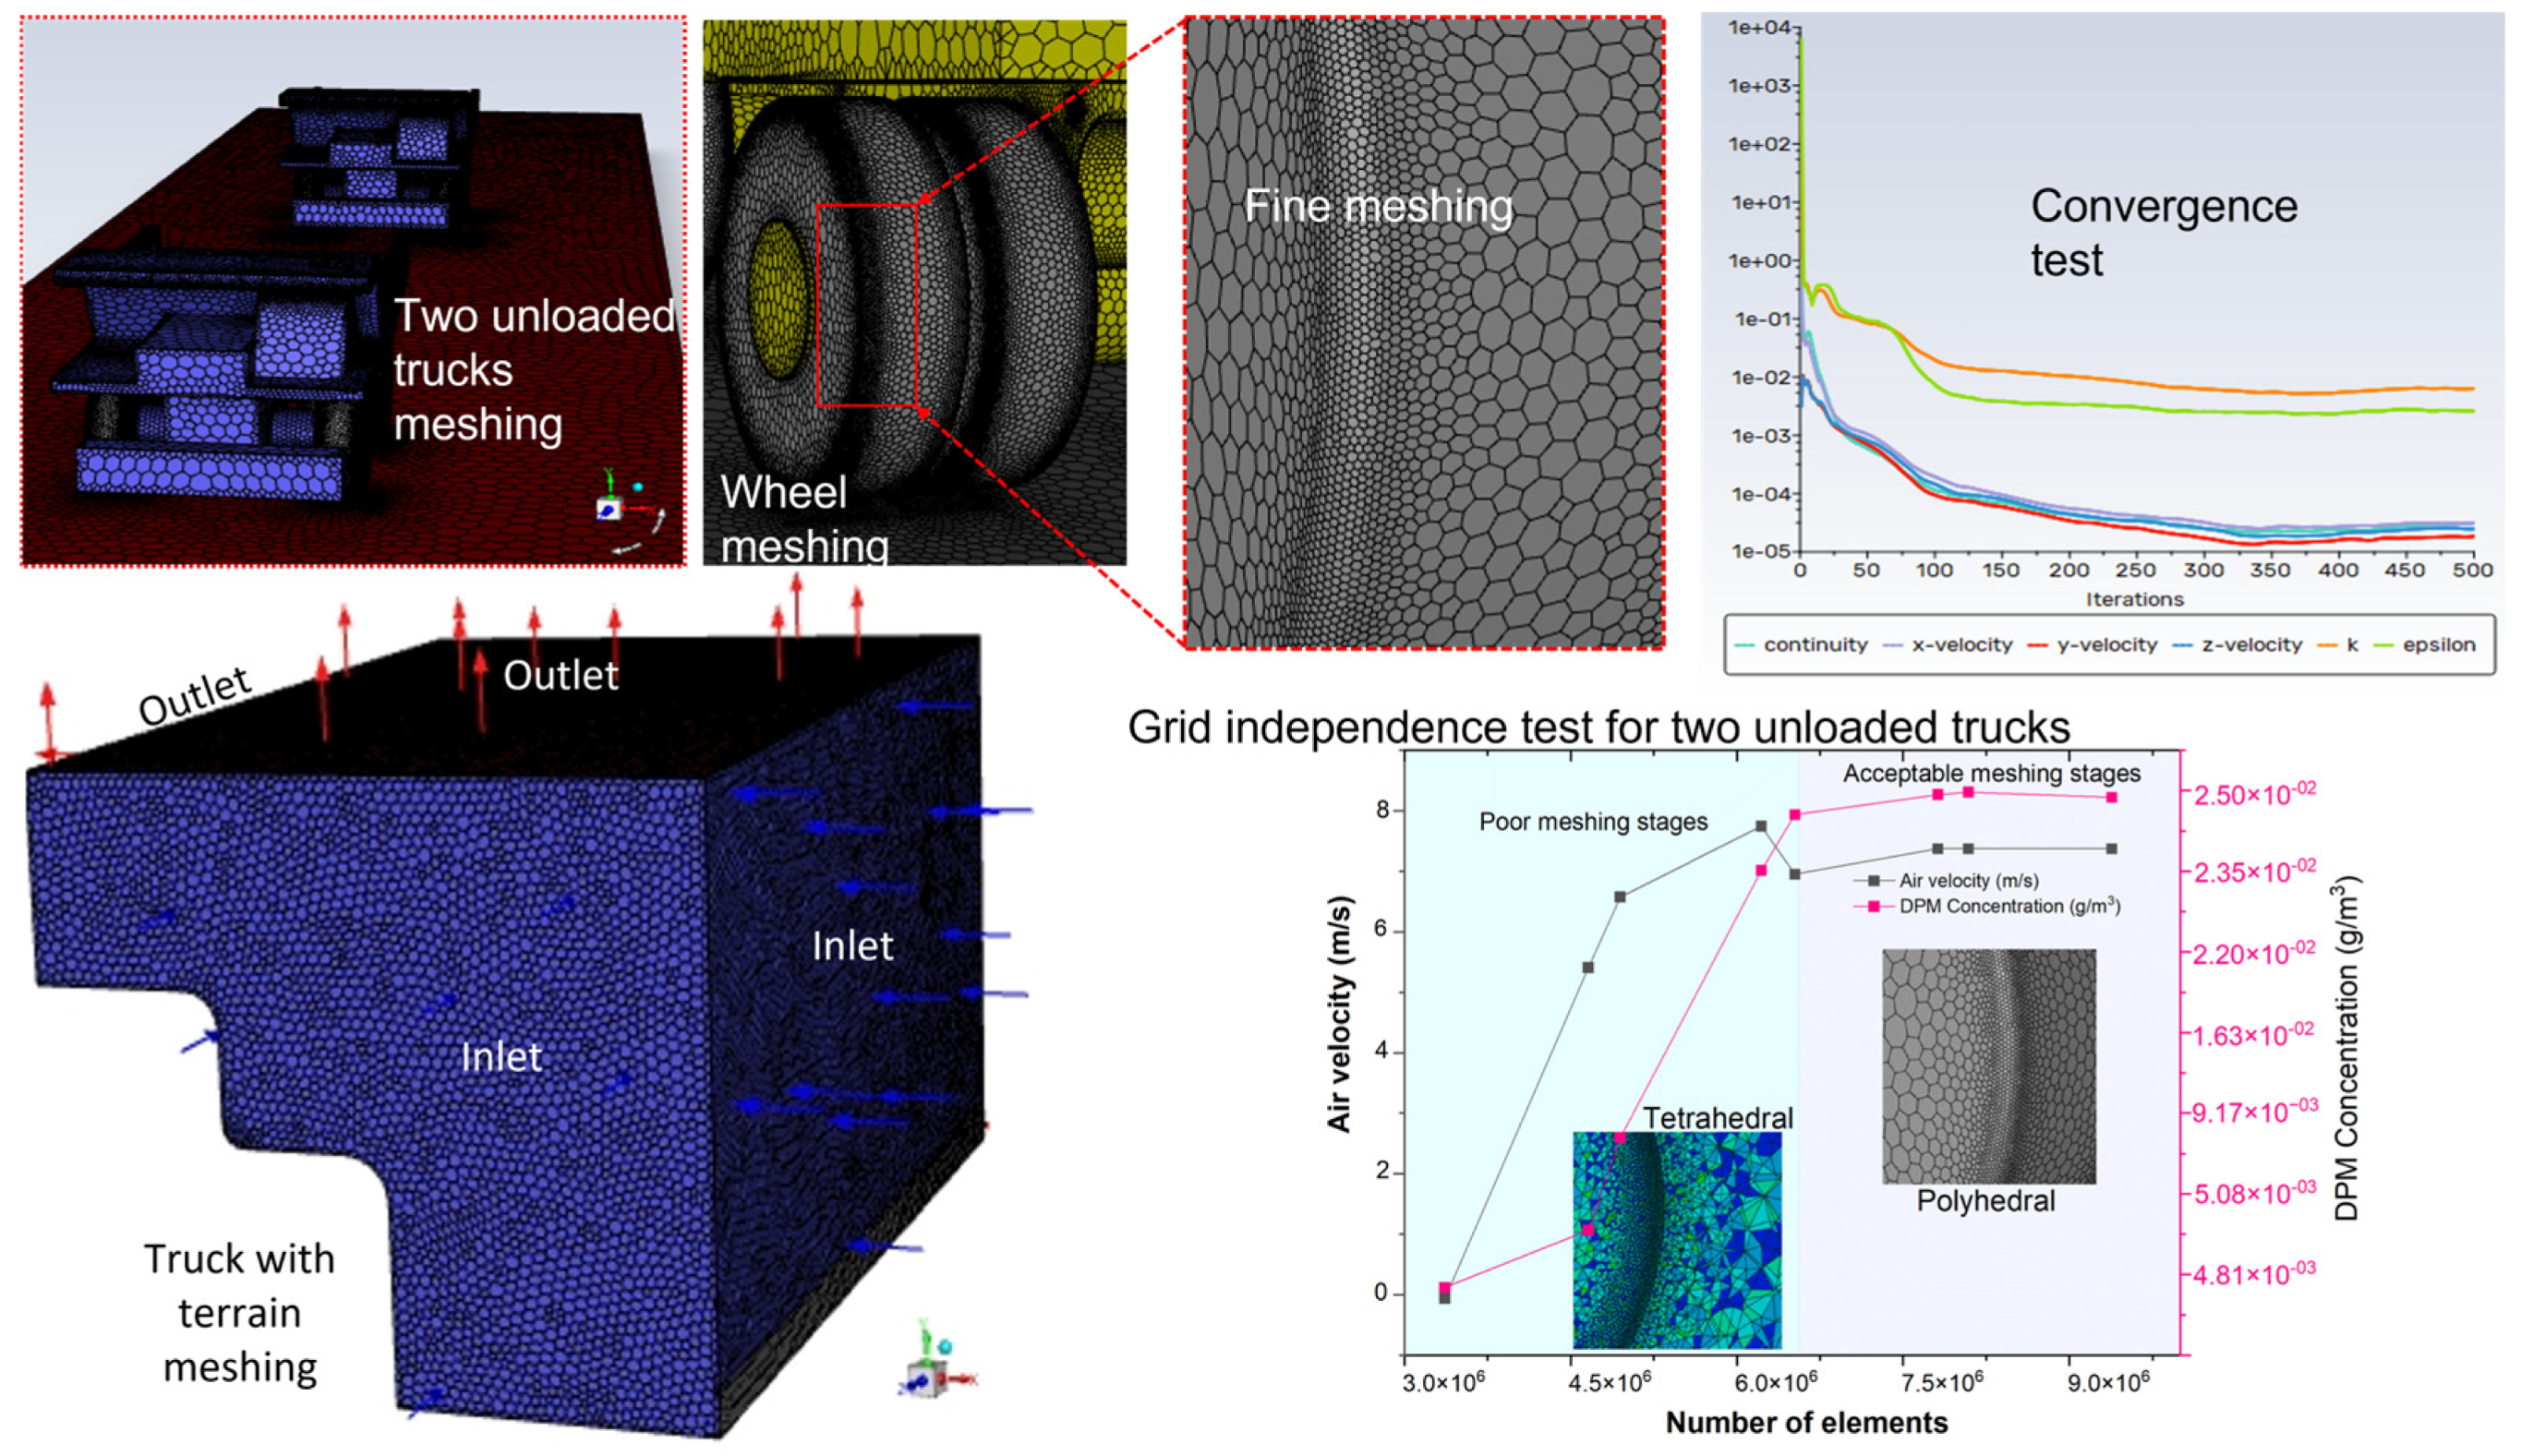
4.3. Development of Physical Grid Model and Mesh Generation

Developing physical models and meshing is crucial in Computational Fluid Dynamics (CFD) for accurate fluid flow Simulations. Our models rely on fluid mechanics and particle motion principles, often based on the Navier-Stokes equations. We used CAD- 2021 and ANSYS SpaceClaim 2023 R1 software to design the geometry, which was imported into ANSYS Fluent for simulation. Accurately representing features such as sharp edges, curves, fluid domains, and internal structures is essential for capturing the flow dynamics. Our physical model divides the geometry into three parts to reflect the transportation scenarios in Ha’erwusu open-pit mines. This scenario involves various transport vehicles moving materials in and out, including simulations of single and double trucks traveling in the same direction and loaded and unloaded trucks moving in opposite directions across single and multiple bench-face terrains on the designated road surface. The CAT777D off-road dump truck, built on a 1:1 scale (Figure 2), has a capacity of 100 t. The simulation examined a car traveling at 10 m/s and a maximum speed of 40 km/h under four wind speeds: 3, 5, 8, and 10 m/s, in both downwind and crosswind scenarios. A grid independence test was conducted by exploring the airflow and concentration of dust in the results of the simulation calculations, by varying the number of elements from 3 million to 9 million. Under the condition that the wind direction is downwind, the speed is 8 m/s, and other conditions are constant. A double-truck scenario was considered, and dust-airflow interaction was evaluated after the trucks had advanced 1 m forward from their initial position, capturing early-stage wake development and turbulent dispersion. Air velocity (m/s) and DPM concentration (kg/m3) were monitored at a fixed point located 2 m directly behind the first truck’s tail, representing the near-wake zone with high turbulent intensity and dust recirculation. As shown in Figure 3, both parameters increased significantly as the mesh was refined from 3 M to 6 M elements. Beyond 6M cells, the change in air velocity and DPM values became minimal (<2%), indicating that mesh convergence was achieved. As shown in Figure 3, the simulation domain was discretized using a structured mesh to ensure accurate and efficient computations. Three Mesh A configurations were selected: Mesh A (2,401,891 nodes) for single-vehicle simulations, Mesh B (6,254,032 nodes) for two unloaded vehicles, and Mesh C (4,807,659 nodes) for loaded vehicles on multiple bench terrains. The mesh quality was optimized using the “Make Polyhedral” command, which improved the orthogonality and smoothness of the mesh. The orthogonal mesh qualities were above 0.32, with an average quality above 0.84, ensuring that mesh distortion did not adversely affect the simulation results.

5. Study on the Parameters of Meteorological Factors on Dust Concentration and Dispersion

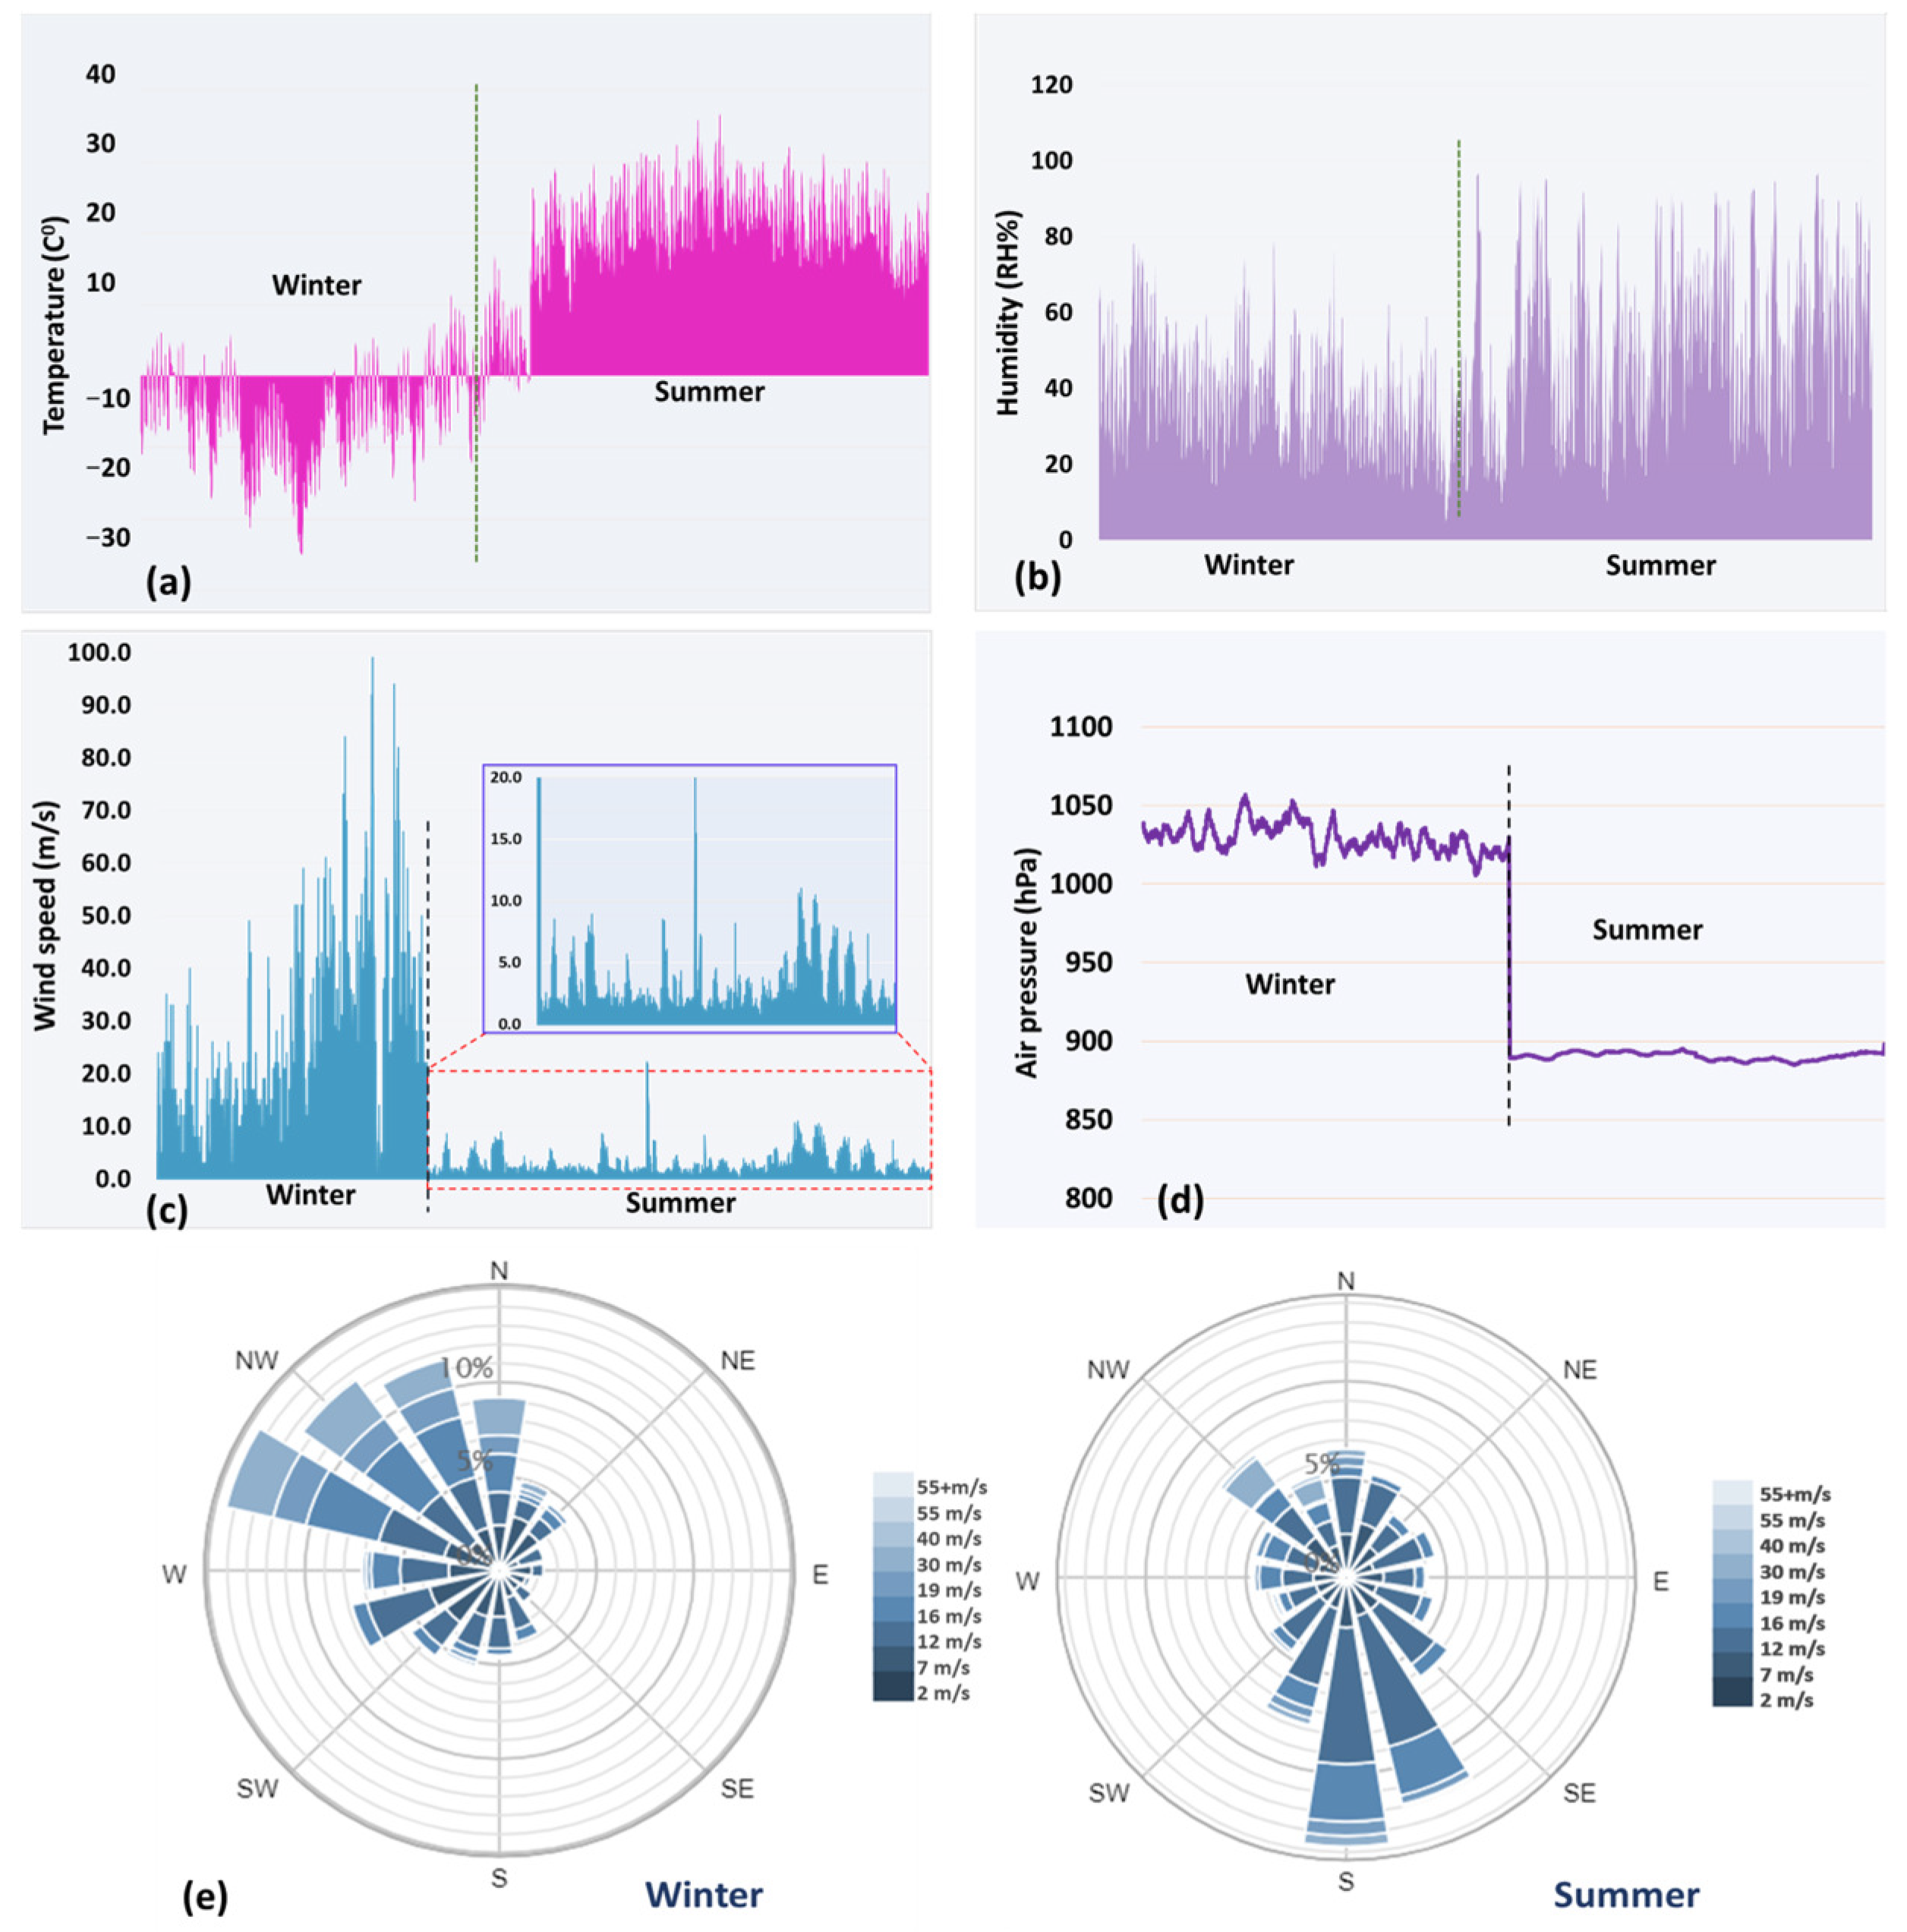
5.1. Wind Speed and Wind Direction Impacts

Field observations and statistical analyses of meteorological factors on PM concentration and diffusion mechanisms (as shown in Figure 4 and Figure 5) confirm that wind speed and direction are critical factors of dust dispersion in open-pit mining roads. Among all meteorological parameters evaluated, wind emerged as the most influential factor in dust migration, transport, and distribution, particularly for particles such as TSP > PM2.5 > PM10. During the summer season, wind speeds peaked at <20 m/s, particularly from June to August. The high wind conditions coincided with substantial increases in TSP and PM2.5 levels, with TSP values surpassing 5878 µg/m3 and PM2.5 exceeding 3000 µg/m3 at near-road sampling point 2. These concentrations directly correlate with mechanical concentration of dust under high wind stress and traffic-induced disturbance, consistent with wind-driven mobilization models described in [11,44]. In the winter season, wind influence became even more pronounced, with recorded speeds occasionally exceeding 50 m/s (Figure 4c), particularly towards the northwest (NW). These extreme wind events coincided with high dust peaks despite minimal temperature, demonstrating the dominance of wind force over temperature effects during winter. During winter, high wind speeds influence the long-range transport of coarse dust. This was especially evident when haul roads were dry, highlighting the strong resuspension potential of lateral flows. Based on statistical analysis using Pearson’s correlation coefficient during winter, a notably strong positive correlation was observed between wind speed and PM2.5 (r = 0.62) and TSP (r = 0.72) (Figure 5), confirming the wind’s critical role in particle resuspension and migration. The correlation with PM10 was (r = 0.33), likely due to their particle size and wind speed being more influential variables for the finer particles’ tendency to remain airborne longer and disperse beyond the immediate monitoring radius. Moreover, PM2.5 is more influenced by local turbulence intensity, air pressure, and wind speed, a behavior consistent with findings by [45] on particle-fluid interactions under turbulent conditions. In both seasons, the multivariate linear regression analysis between wind speed and all PM variables produced an R2 = 0.71, p < 0.001 **, suggesting that wind speed independently accounts for approximately 71% of the variability in all measured dust levels. This supports the physical interpretation that wind is a dominant driver of dust dispersion, particularly for TSP and PM2.5, in winter conditions where wind speeds regularly exceeded 40 m/s. While additional meteorological variables influence PM behavior, wind remains the most significant dispersive factor for dust particulate transport in the mining environment.
Wind direction was another pivotal factor influencing spatial dust patterns. As shown in the wind rose diagram (Figure 4e), northwest winds (NW) were dominant during winter, transporting dust plumes toward the northwest, elevating PM levels at crosswind stations, including Points 2, 4, and 5. This directional transport pattern is also studied by [10], who emphasized the critical role of directional wind in dust plume migration.

5.2. Temperature, Humidity, and Air Pressure Impact on PM Concentration and Dispersion

Based on the data presented in Figure 5 and Table 4 the influence of temperature, humidity, and air pressure on particulate matter (PM) concentrations and dispersion in open-pit coal mining roads varied significantly across different meteorological conditions. Their combined and seasonally varying effects were analyzed using Pearson correlation based on seasonal variations, and multivariate linear regression models by considering PM concentration as the independent variable and meteorological data as dependent variables. The results reflect a dynamic interplay between emission potential and atmospheric retention, with temperature dominating in summer and air pressure and wind-driven effects prevailing in winter.

5.3. Temperature Effects

Temperature is a critical factor influencing dust generation and dispersion, especially in summer. During the summer, when road surface and air temperatures often exceed 30 °C, enhancing evaporation of the haul road’s moisture increases the release of fine dust particles, particularly PM2.5. This is evident from the positive correlation between temperature and PM2.5 concentrations, where r = 0.626. Further statistical analysis using simple linear regression in summer confirms that temperature contributed significantly to PM2.5 variability, with a positive coefficient and an overall coefficient of determination value R2 = 0.391 when temperature and PM2.5 were used as predictors. Specifically, the higher temperatures lead to rapid surface drying, which usually contributes to increased dust resuspension from the road surface. The p-value of <0.01 and the VIF values of 1.7 (Table 5) indicate that temperature is statistically significant and not affected by multicollinearity with other meteorological variables. Conversely, in winter, the negative correlation between temperature and dust levels (e.g., r = −0.45 for TSP) suggests that lower temperatures do not affect dust particles. However, this effect is counterbalanced by the higher air pressure and wind speed, which drive horizontal dust migration despite lower temperatures. This finding highlights the complex interaction of meteorological factors during colder months, where temperature decreases do not necessarily result in lower dust concentrations. These findings are consistent with those of [46], who reported that lower winter temperatures correlate with higher dust levels due to increased air pressure and decreased humidity, particularly in industrial and semi-arid environments.

5.4. Humidity Effects

Humidity demonstrated less to moderate positive correlations with PM2.5 and PM10 in both seasons (e.g., PM2.5: r = 0.011 in summer, r = 0.28 in winter), suggesting that humidity contributes to short-term particle agglomeration and surface retention, especially for finer particles. However, during summer, the regression analysis shows that humidity alone explains only a small portion of the variability in PM concentrations, with an R2 of 0.09 for PM2.5, TSP, and PM10. In winter, humidity has a moderate impact on PM concentrations (r = 0.317 for TSP), which can be attributed to the lower moisture levels in the environment and the higher air pressure. Despite this, the positive correlation suggests that humid conditions can slightly reduce the resuspension potential by promoting particle aggregation, thereby lowering airborne dust concentrations. These low correlations indicate that humidity has a minimal influence on dust concentrations during summer, highlighting the minor role of other factors such as temperature and wind speed, which are more dominant in determining dust concentrations.

5.5. Air Pressure Effects

Air pressure was identified as a major factor influencing dust dispersion, particularly in winter when it exhibited a strong positive correlation with PM2.5 and PM10 (r = 0.51 and r = 0.26, respectively, Figure 5). In winter, the regression analysis for air pressure reveals that air pressure alone explains approximately 47% of the variability in dust concentrations, as indicated by the high R2 = 0.47 value for overall PM variables. This strong explanatory power is consistent with field observations of dust entrapment during high-pressure episodes, especially under inversion conditions. This finding is further supported by [47], who highlighted that increased air pressure contributes to atmospheric instability while potentially enhancing near-surface turbulence, which can facilitate dust movement and suspensions. In the context of open-pit mining roads, particularly during cold and dry winter observations, our data suggest that high-pressure systems suppress vertical dispersion and promote horizontal dust migration along terrain-following wind flows. The high VIF values of 1.8 for PM2.5 and p < 0.01 ** suggest that air pressure’s effects are significant and independent of other meteorological variables.
Together, these findings suggest that temperature is the key driver of dust generation in summer, especially for PM2.5; air pressure and wind speed govern dust retention and migration in winter; and humidity acts as a modifying factor, enhancing particle retention for finer PM. This finding aligns with studies conducted in arid-region environments [48]. These results inform seasonally adaptive control strategies. In summer, the focus should be on heat-resistant chemical suppressants and water spraying synchronized with low-humidity periods. In winter, wind shielding and real-time air pressure monitoring can help mitigate dust accumulation during harsh atmospheric conditions.

5.6. Spatial Distribution of Dust Concentrations

Diurnally, TSP and PM2.5 surged during the first shift, coinciding with the peak truck activity and high wind speeds. The field data collected across five strategically placed sampling points (Figure 6) within the mine roads reveals a complex spatial distribution of particulate matter (PM), heavily influenced by elevation, vehicle movement, road dust load, and meteorological conditions. Each sampling point captured distinct dust profiles with and without transportation activity (Table 5), and due to its topographical location and exposure to prevailing winds. Sampling point 1 was positioned to capture direct vehicular dust emissions, with a laser particle monitor mounted at the rear of an operating truck, and recording continuously over 25 days in the summer season. The setup is for real-time monitoring of PM2.5, PM10, and TSP in the truck’s wake, the most concentrated dust plume zone. The recorded data showed TSP peaks exceeding 19,000 µg/m3, with repeated sharp spikes in PM10 and PM2.5 concentrations. The intensity and consistency of these peaks reflect instantaneous particle generation during tire-road interaction and turbulent wake formation, especially under dry and high-temperature conditions common to the summer months. The strength of this configuration lies in its ability to isolate purely truck-induced emissions, without confounding influences from wind transport or lateral diffusion seen in fixed monitoring points. The high value of R2 = 0.92 between PM2.5 and PM10 further validates the concurrent emission of fine and coarse particles and supports the simulation results showing plume formation directly behind the vehicle.
Downwind diffusion at sampling Points 2 and 3, located 4 m left and right of the truck path, PM concentrations were markedly lower but still exhibited strong peak responses during active mining shifts. These points are key for understanding the lateral diffusion of dust plumes. During winter and summer, as shown in Figure 6, PM2.5 and TSP concentrations peaked consistently during working hours. A statistical correlation analysis further confirmed this relationship, with a correlation of 0.99 between PM2.5 and TSP, and 0.98 between PM10 and TSP across all seasonal data. These strong correlations indicate that fine particulate matter (PM2.5 and PM10) can reliably reflect total dust behavior (TSP), supporting their use as indicators of dust dispersion trends under varying meteorological conditions. Notably, at sampling point 2, during winter, the TSP reached 5878 µg/m3, even though generation conditions had less impact. This suggests resuspension under high wind conditions (up to 50 m/s) as the dominant influence of the dust plume in the open-pit mining environment. Similarly, in summer, the highest levels at these points were generally under 4000 µg/m3, supporting the idea that while generation was higher, vertical uplift and downwind dispersion limited ground-level accumulation. The differences also reflect the impact of air pressure and wind: in winter, high pressure (1040+ hPa) and high wind (20–50 m/s) created a stagnant layer, trapping particles and enhancing accumulation at roadside monitors. Conversely, summer atmospheric conditions promoted vertical convective mixing, leading to less concentrated lateral spread.
Sampling Points 4 and 5, located 25 and 45 m above the source zone, help quantify the vertical transport of dust. This confirms that fine particles are consistently uplifted to elevated zones, even in the absence of direct sources, confirming that fine particles are consistently uplifted by wind influence from the active road layer. Wind direction and speed are critical here: dominant northwest winds diffuse particles northwestward, lifting them onto adjacent benches and contributing to atmospheric pollution at elevated positions.

5.7. Terrain-Influenced Dust Sedimentation and Mitigation Measures

Topographical influences significantly shaped the spatial distribution of particulate matter (PM) across the mine. Elevated sampling locations, particularly on study locations 1, 4, and 5, recorded higher background concentrations in the absence of active transportation (e.g., PM2.5 ≈ 9.0 µg/m3; TSP ≈ 26.0 µg/m3), primarily due to increased wind exposure on upper benches. In contrast, pit-bottom monitoring stations such as locations 2 and 3 consistently retained settled coarse particles, registering lower average values (e.g., PM2.5 ≈ 4.0 µg/m3; TSP ≈ 12.0 µg/m3). These results align with the stratification dynamics observed by [49], which noted terrain-driven dust stratification, wherein low-elevation areas act as passive dust sinks while upper benches experience ongoing entrainment and resuspension from wind and turbulence effects. Critical gaps were observed in the mine dust control measures, particularly on unsprayed haul roads during high wind periods. During transportation activities, the monitoring stations at lower elevations recorded comparatively low PM values. In areas where topography influences wind flow, such as the bench near sampling locations 2 and 3, wind speeds decrease, and dust tends to settle.
Based on our field observations and statistical analysis, it was evident that high summer temperatures, ranging from 36 °C to 41 °C on the road surface and 18 °C to 36 °C in the air, accelerated the evaporation of water-based dust suppression, limiting its effectiveness to approximately 30 min. In contrast, chemical dust suppressants remained effective for nearly two hours, highlighting their superior longevity under extreme heat conditions. During winter, the predominant wind directions (NW) and maximum wind speeds significantly contributed to horizontal and vertical dust dispersion, particularly under dry and loose surface conditions. Wind turbulence and truck movements were identified as key drivers of localized dust plumes, with higher vehicle speeds (40 km/h for unloaded and 33 km/h for loaded trucks) increasing airborne dust concentrations. The combination of strong winds, high air pressure, and vehicle-induced turbulence exacerbated dust dispersion, reducing the efficiency of conventional water spray methods. These findings support the integration of meteorological forecasts into dust control frameworks, such as deploying chemical suppressants during high-temperature periods to curb particle generation and dispersion, and timing water spraying to coincide with low-humidity intervals for optimal agglomeration. Real-time monitoring of wind speed, pressure, and temperature gradients can further refine suppression tactics. These findings reinforce the importance of real-time meteorological monitoring and dynamic response strategies, such as deploying temperature-resistant chemical suppressants during hot, dry conditions and scheduling water applications.
To strengthen the field monitoring results and deepen the understanding of dust dispersion mechanisms beyond the limitations of in situ observations, a numerical simulation study was conducted using Computational Fluid Dynamics (CFD) coupled with the Discrete Phase Model (DPM). The statistical analysis, wind speed, wind direction, and air pressure are the dominant meteorological factors influencing dust concentration and migration. According to the parameters of wind influence and terrain features along the active haul roads, the sampling location 1 measured during the summer was incorporated into the simulation as boundary and initial conditions. Furthermore, field-measured dust concentration distributions and migration trends were used to calibrate the simulation setup and validate the numerical predictions, ensuring that the simulated dust dispersion behavior closely mirrors real-world dynamics in the Ha’erwusu open-pit coal mine environment.

6. Analysis of External Airflow Simulation

6.1. Airflow Simulation of Vehicle Motion Without Bench-Face Influence

This study utilizes the DPM-Fluent 2023 R1 software to model dust dispersion caused by mining trucks in open-pit mines, incorporating wind anchoring forces and particle drag dynamics. Simulations were conducted at four wind speeds (10, 8, 5, and 3 m/s) along a 90 m road to analyze airflow patterns and dust transport. Higher wind speeds (10 m/s and 8 m/s) generate turbulent wakes behind trucks, enhancing dust dispersion, whereas lower speeds (5 m/s and 3 m/s) produce localized airflow, trapping dust near the surface and creating larger low-velocity zones. Contour plots (side view) and vector plots (top view), as shown in Figure 7, reveal three distinct airflow sectors: semi-stable, vortex, and high fluctuation zones, aligning with prior research [9]. Reduced vortex intensity at higher speeds results in symmetrical vortices extending up to 70 m behind trucks. As shown in Figure 8, multiple-truck scenarios introduced additional airflow disturbances. Between Z = 0–40 m, wind velocity exhibited significant fluctuation (1.45–7.83 m/s), with compression and deceleration zones forming between vehicles due to aerodynamic interference. These interactions suggest the significance of vehicle spacing in downstream flow behavior. From a practical perspective, the findings underscore the need for tailored dust control strategies during high wind speeds. Reducing truck speeds and making spacing adjustments can effectively mitigate dust generation and dust accumulation in wake zones.
As the lateral coordinate Z transitions from 40 m to −15 m, velocity fluctuations diminish, with the maximum wind speed decreasing from 7.45 m/s to 4.33 m/s at a height of 12 m, closely aligning with the inlet wind speed of 8 m/s. Within the vortex zone, wind velocity increases from 1.45 m/s at Y = 2 m to 4.33 m/s at Y = 12 m, highlighting the influence of closely spaced mining trucks on airflow behavior over lateral distances. The minimum wind velocity, recorded at 3.57 m/s around Z = −35 m at Y = 12 m, marks the semi-stable zone, suggesting a transitional area where dust resuspension may persist unless mitigated. As illustrated in Figure 9, a single mining truck significantly alters airflow direction and wind velocity distribution, as researched by [20]. Two prominent trailing vortices, S1 and S2, formed behind the truck, with the vortex zone peaking between Z = −1 m and −15 m before diminishing laterally along the central axis. These vortices can trap dust particles and prolong local exposure durations, especially in low wind conditions. The truck speed significantly influences the vortex zone, inducing turbulent airflow and irregular vortex formation. However, the effect gradually weakened between Z = −15 m and Z = −35 m. The vortex morphology and wind distribution patterns around the mining truck, as shown in Figure 10 (back view), are analyzed at a truck speed of 10 m/s and an ambient wind speed of 5 m/s. A significant vortex zone was observed at Z = −1 m behind the truck, with wind speed fluctuations reaching peaks and troughs of approximately 3.05 m/s and 1.21 m/s, respectively. These fluctuations imply that dust particles can experience alternating upward and downward lift forces, complicating containment strategies. Compared with multiple trucks, the vortex zone for a single truck is more localized, implying that traffic density is a critical factor in dust exposure control. Wind speed gradually recovers from 1.21 m/s to 3.81 m/s as the distance from the truck’s tail extends to Z = −35 m, demonstrating airflow stabilization further downstream. This recovery region helps inform the recommended downwind safety buffer for workers or equipment. Figure 10 (back and side views) illustrates contour vortex morphology distribution; airflow rates range from 3.42 m3/s near the truck to 20.34 m3/s at Z = −33 m. This highlights the impact of the vortex zone, where turbulence results in a reduced wind speed. The recovery rate progressively approaches undisturbed conditions: at Z = −3 m, wind velocity is 0.57 m/s, reflecting an 11.40% recovery; this increases to 31.80% at Z = −11 m, 48.60% at Z = −20 m, and 67.80% at Z = −33 m with a wind speed of 3.39 m/s. This analysis emphasizes the spatial extent of truck-induced vortex zones and the downstream distance required for airflow to return to a stable, undisturbed state.

6.2. External Airflow Analysis with Terrain Influence

This study predicts that wind speed and wind direction are crucial for dust migration patterns, particularly considering bench faces and vehicle movement. Higher crosswind speeds (10 m/s) led to significantly increased dust concentrations, particularly when two trucks operated on single and multiple bench terrains, 15 m–25 m bench height, respectively. In open-pit mining, bench faces along haul roads alter the wind flow, impacting dust dispersion. This implies that bench design influences worker exposure and environmental dust loading. Figure 11 illustrates velocity streamlines for various wind speeds (10 m/s, 8 m/s, 5 m/s, and 3 m/s), showing that higher speeds generate stronger upward airflow deflections. At 10 m/s, the airflow experienced significant recirculation, particularly within the truck’s wake, until the upper benches. These recirculation zones trap dust within lower elevations, increasing the duration of exposure in operational areas. When the wind travels at an average speed of 8 m/s, it interacts with the first bench face, causing an upward deflection and reaching a peak velocity of 7.46 m/s due to vehicle-induced turbulence, which enhances air circulation near the bench crest. The presence of multiple benches influenced airflow and dust distribution. These benches act as barriers, increasing turbulence and concentrating dust in specific areas, while limiting their dispersion into the atmosphere. The alignment of the dust plume follows bench geometry, with updrafts near the bench edges lifting dust and forming distinct layers. Vehicle movement further amplifies wind turbulence, causing wind velocity to decrease to 3.49 m/s behind the trucks. At Y = 4 m, wind speed sharply increases to 7.46 m/s near the bench crest, where turbulence kinetic energy (TKE) peaks at 5.02 m2/s2 and potentially resuspends settled dust particles. This TKE-driven resuspension explains how dust spikes after primary emissions subside. When the wind speed is reduced to 3 m/s, turbulence decreases but remains a contributing factor to dust dispersion near their sources.
The relationship between wind speed and turbulence kinetic energy (TKE), as illustrated in Figure 12, provides critical insights into airflow dynamics in open-pit mining roads. The results indicate that the wind speed and TKE increase as the airflow moves downstream, demonstrating a gradual recovery and transition toward greater stability under laminar conditions. This trend suggests that, while the initial turbulence is induced by vehicle motion and terrain features, the airflow eventually stabilizes as it moves away from the source of the disturbance. At Y = 15 m, a distinct pattern of localized acceleration and turbulence was observed, which was attributed to the secondary flow interactions. These interactions arise from variations in terrain elevation and vehicle-induced airflow disturbances, leading to a complex airflow behavior that influences dust dispersion. The high TKE values in these regions highlight areas of intensified mixing, which can contribute to prolonged dust suspension and transport over extended distances. These findings underscore the model’s effectiveness in simulating real-world mining conditions and provide a foundation for optimizing dust-mitigation strategies. By understanding the interplay between wind speed, turbulence, and airflow recovery, mining operations can implement targeted control measures such as strategically placed wind barriers, optimized haul road alignments, and adaptive dust suppression techniques.

6.3. Study of Dust Particle Concentration and Migration Mechanism

Numerical simulation of dust migration in open-pit mine haul roads provides critical insights into particle dispersion under varying meteorological and operational conditions. The particle trajectory and concentration distribution charts illustrate how dust, influenced by gravity, friction, drag forces, and wind, moves along the negative z-axis during vehicle transport. Initially, dust particles rise owing to vehicle-induced turbulence before stabilizing at peak heights and settling back to the ground. In our simulation, using a mass flow rate of 0.1 kg/s, the highest recorded dust particle matter (DPM) concentration was 4.34 × 10⁻² g/m3 near the truck wheel within the first second at a wheel rotation speed of 7.12 rad/s on an un-watered haul road. Downstream, the concentrations decreased to 2.33 × 10⁻⁶ g/m3 at 35 m during single truck and 3.45 × 10⁻⁶ g/m3 at 45 m when multiple trucks operate on a single-bench face in a crosswind scenario. As shown in all simulation results, the dust particles’ migration and dispersion are mainly affected by wind speed and wind direction, and it is significantly aligned with previous research, indicating that vehicular turbulence and wind shear forces significantly affect dust entrainment and dispersion [50]. Understanding these migration patterns is essential for developing efficient dust suppression techniques for open-pit mining operations.

6.4. Examining Dust Profiles from Single and Multiple-Truck Traffic Without Terrain Influence

The particle trajectory analysis revealed that higher wind speeds contributed to higher dust dispersion, increased transport velocities, and shorter residence times within the computational domain. Dust movement was relatively slow under a wind speed of 3 m/s, whereas at 10 m/s, particles were rapidly transported away from the source. Figure 13 illustrates dust migration at a wind speed of 5 m/s, showing a gradual dispersion pattern with time from t = 1 s to t = 15 s, covering distances from Z = −1 m to Z = −37 m behind the vehicle. The dust migration rate increases sharply from 1 s to 6 s, peaking at 3.33 m/s due to vehicle-induced turbulence before decreasing to 1.4 m/s between 6 s and 10 s as dust moves further away. By 15 s, particles settle at an average velocity of 0.035 m/s (Table 6). This pattern suggests that dust disperses rapidly near the vehicle but slows as it encounters higher resistance over distance, consistent with findings from [51]. The settling velocity of a 10 µm lignite particle in the air is approximately 0.218 m/s up to Z = −15 m, while finer PM2.5 particles settle more slowly at 0.035 m/s. As dust migrates, its concentration decreases because of gravitational settling and turbulent dissipation. The average migration rate between Z = −2 m and Z = −15 m is relatively high at 3.08 × 10⁻³ g/m3, primarily influenced by vehicular turbulence. The settling velocity of dust particles in air is determined using a modified form of Stokes’ law (Equation (7)), which applies to smaller particles in a viscous medium [37].
v s = 4 g d p ρ p ρ a 3 C d ρ a
where: v s = settling velocity (m/s), d p particle diameter (1–100 μm), ρ p particle density (lignite coal dust, around 1250 kg/m3), ρ a air density, approximately (1.225 kg/m3), g gravitational acceleration (9.81 m/s2), ρ a dynamic viscosity of air (1.8 × 10⁻⁵ Pa), and C d = 0.5 drag coefficient (for turbulent flow near the truck).
From Z = −10 m to Z = −35 m, the dust concentration decreased to 1.26 × 10⁻⁴ g/m3, which was primarily influenced by wind speed and turbulence. As the distance from the truck increases, particle sedimentation accelerates, whereas dispersion broadens, reducing the particle density within the dust cloud. This pattern aligns with findings from Tang and Cai (2018) [50], which highlight the role of wind turbulence in dust dispersion dynamics. Additionally, the field observations by Chen Xi [38] demonstrate that vehicle speed, aerodynamic shape, and wind flow significantly elevate dust concentration along the longitudinal axis at various heights (Y) and time intervals (s). The turbulence generated by the truck wheels lifts dust into the air, causing a small concentration at approximately 10.5 m in height at around 37 m behind the truck. As shown in Figure 13, the back view of dust dispersion patterns captured at different downwind distances reveals a clear two-symmetrical vortex structure forming immediately behind the moving truck. This turbulent structure is typical of bluff body aerodynamics and airflow around the vehicle, creating two counter-rotating vortices that entrain dust particles into spiral-like paths. Initially, at Z = −2 m and Z = −3 m, the dust cloud is strongly pulled into these twin vortices, resulting in a pronounced lateral expansion. As the distance increases to Z = −5 m and Z = −15 m, the vortex weakens due to turbulence dissipation, wind influence, and gravitational settling, causing the dust to spread more broadly. However, at distances of Z = −25 m and Z = −37 m, the dust cloud caused by the vortex is considerably reduced. The dust flow transitions into a more chaotic, diffuse plume pattern dominated by ambient wind direction rather than vehicle-induced turbulence. This shift indicates that vehicle-induced wake turbulence governs dust behavior up to approximately 25 m, after which background wind and buoyancy effects primarily control dispersion. Supporting this observation, Figure 14 illustrates the longitudinal DPM concentration variations across different heights (Y-axis) and times (s).
At Y = 1–4 m, the dust concentration profiles show the highest alignment with the vortex center, corresponding to the highest turbulence zones directly behind the truck. As height increases (Y = 7–10.5 m), the concentration decreases and broadens, suggesting that finer PM fractions are lifted vertically by turbulent eddies and transported over longer distances.
The simulation indicates that dust can migrate up to 37 m downwind before settling, with particle movement influenced by the road dust load, the truck’s wake turbulence, and aerodynamic flow patterns. The interaction between dust particles and turbulent structures is evident, particularly in the rear vortices that generate low-pressure zones, which trap and redistribute suspended dust. As shown in Figure 15a, at multiple sampling distances behind the vehicle, creating recirculating regions where dust particles remain suspended before being gradually transported downstream, and the dust concentration decreases slowly to 2.33 × 10⁻⁶ g/m3. A crucial aspect illustrated in Figure 15c is the role of particle diameter in determining dust residence time within the turbulent wake. The color gradient in the simulation represents variations in particle size, with finer particles exhibiting prolonged suspension owing to their lower settling velocity; in comparison, larger particles tend to settle more quickly due to gravitational forces. This differentiation is critical for understanding the overall dispersion pattern, as finer particles remain airborne longer and travel greater distances, contributing more significantly to prolonged air pollution exposure. The high particle concentrations near the truck, especially in the vortex regions, emphasize that airflow disturbances caused by vehicle motion significantly influence dust accumulation and transport. The comparison between the simulated (Figure 15a,c) and real-world (Figure 15b) results reinforces the reliability of the numerical model in capturing the primary dust transport mechanisms. These insights have direct implications for dust control strategies in open-pit mining. Because smaller particles remain airborne for longer durations, targeted interventions such as misting systems, surfactant applications, and lowering vehicle speed should focus on limiting the suspension and transport of fine particulates.

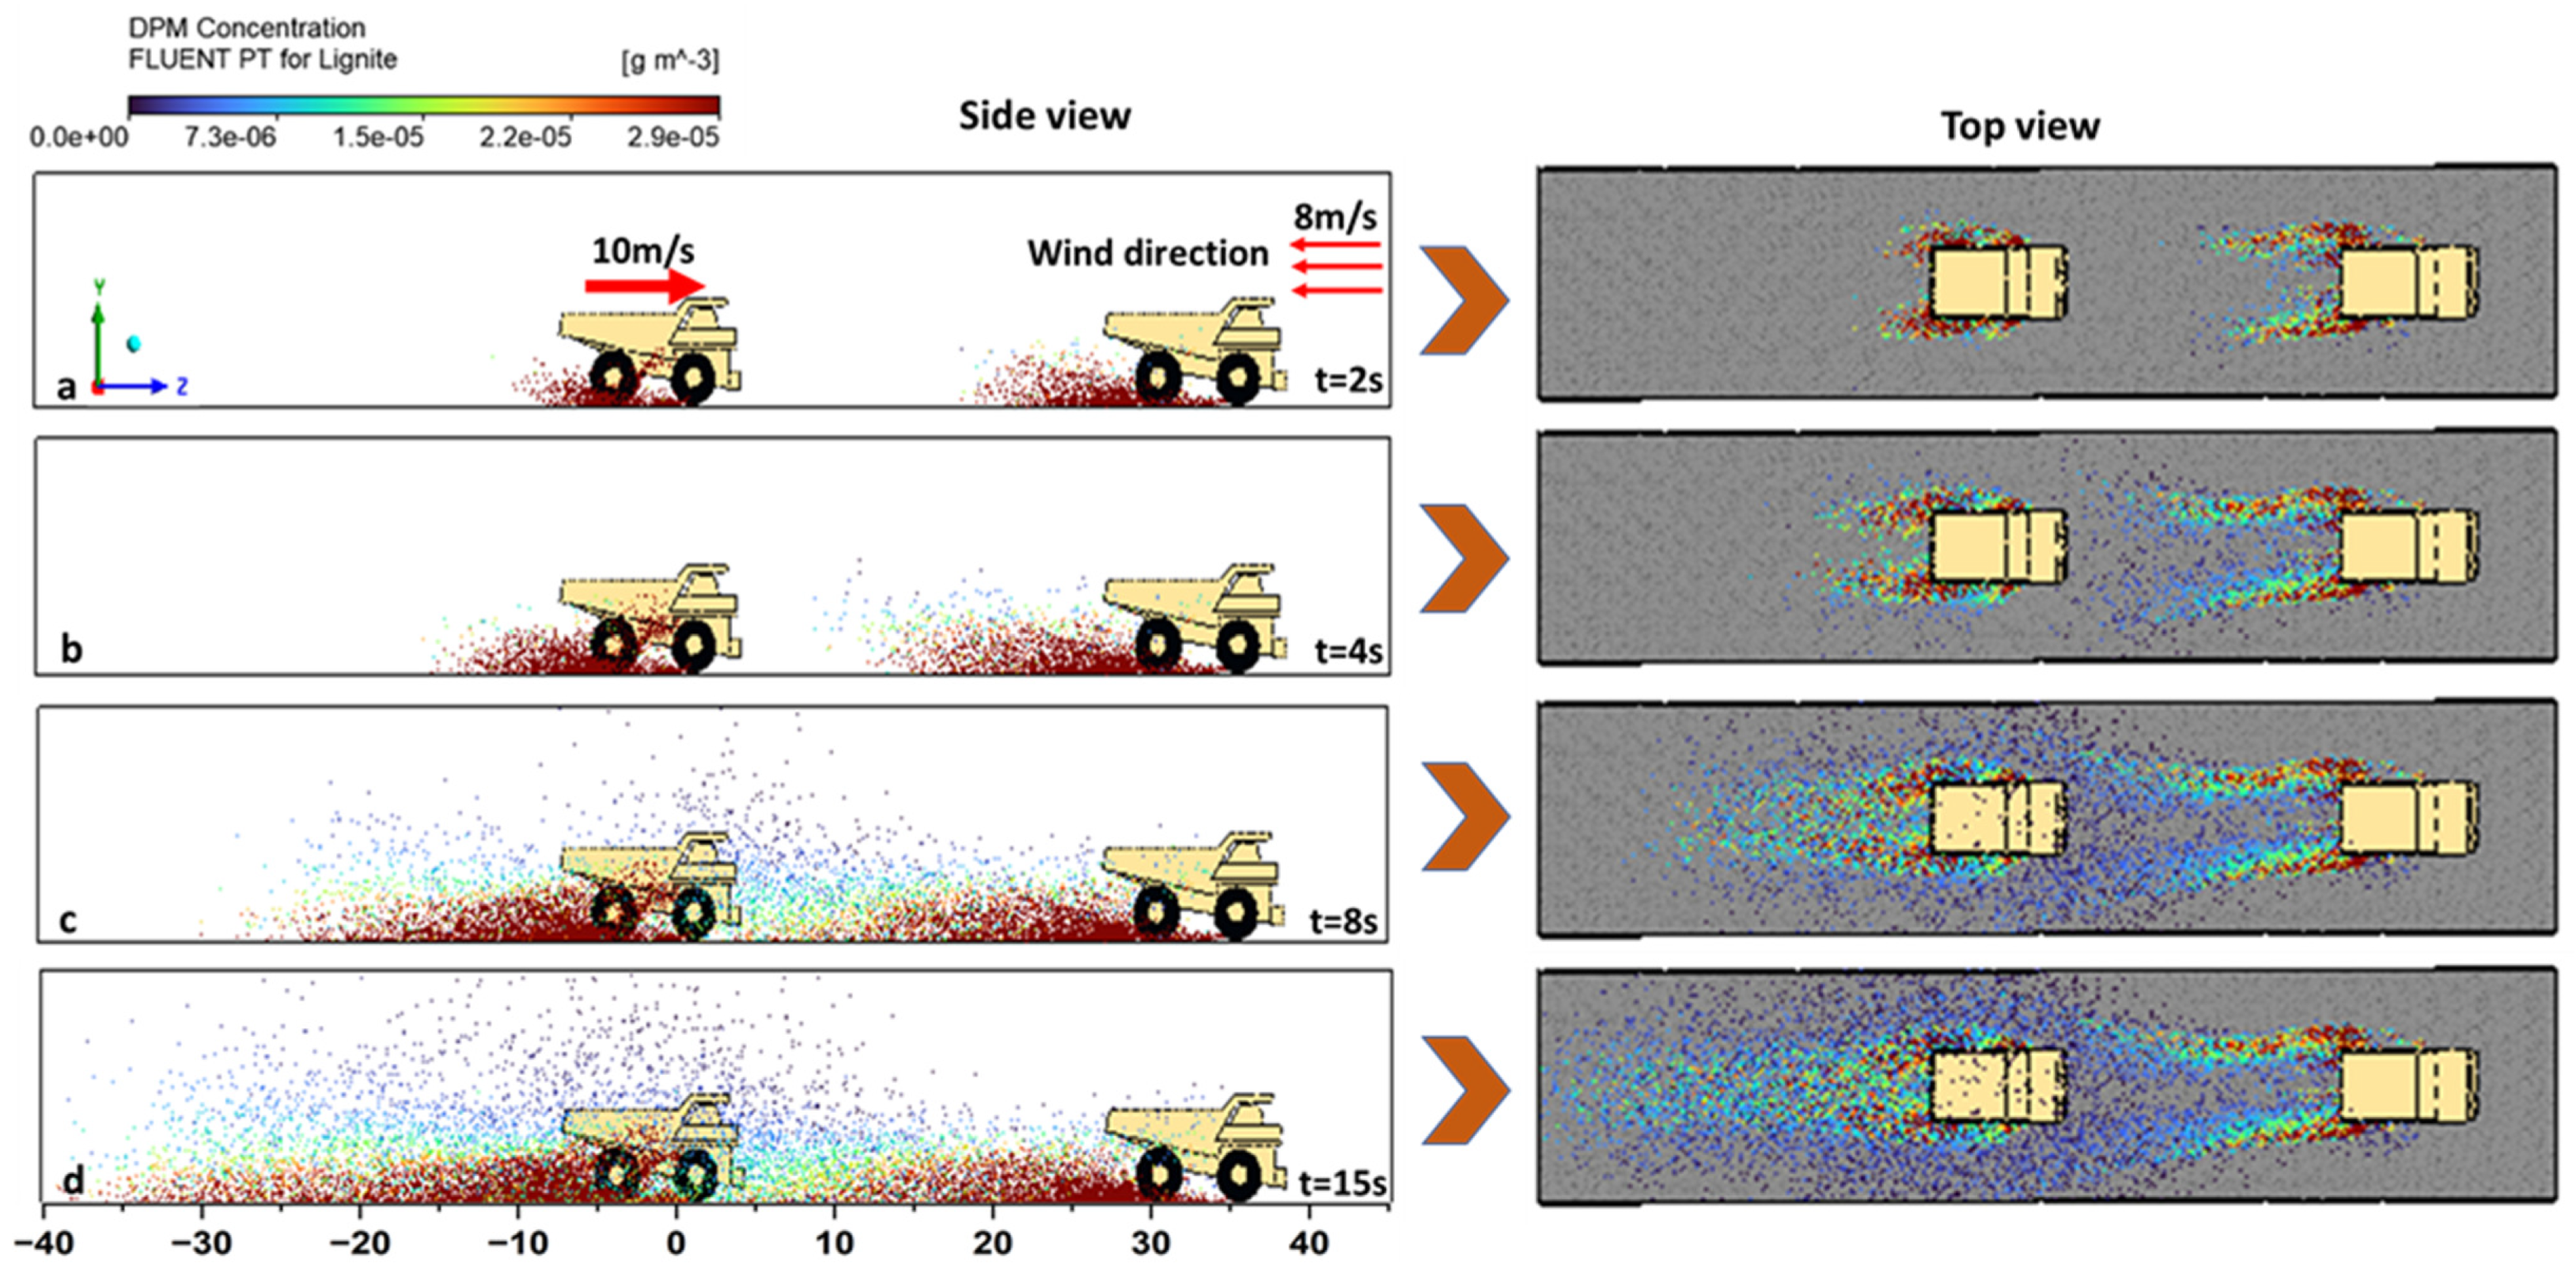
6.5. Impact of Multiple Trucks on Airborne Dust Concentration and Dispersion Without Terrain Influence

The movement of multiple trucks along the same route significantly increased airborne dust concentrations and dispersion. Each truck disturbs the settled dust and generates new plumes, prolonging the time particles remain airborne. The accumulation of overlapping dust clouds negatively affects air quality over a larger area, posing environmental management challenges and increasing health risks to onsite workers. The simulation results in Figure 16 reveal distinct peaks in dust concentration along the Z-axis at various heights along the Y-axis, representing different vertical distances from the ground. The analysis, conducted with multiple trucks moving at 10 m/s under a wind speed of 8 m/s and a mass flow rate of 0.01 kg/s, shows how the dust plume expands and shifts over time (t = 2 s, 4 s, 8 s, 15 s) due to wind and truck movement. At t = 2 s, dust particles remained concentrated near the rear part of the truck as they began to move. At t = 15 s, the dust cloud expanded and covered a wider area with reduced concentrations.
As shown in Figure 17, the migration rate of airborne dust can be assessed by tracking the displacement of a dust plume over time. Peak concentrations occur at approximately 1.3 × 10⁻² g/m3 at Y = 2 m, Z = 25 m, near the tail of the first truck, before decreasing to 2.85 × 10⁻³ g/m3 at Z = 0 m. The concentrations rose again to 1.17 × 10⁻² g/m3 before eventually dropping to 3.5 × 10⁻⁵ g/m3 at Z = −40 m, indicating particle settling due to gravitational forces and reduced turbulence. At Y = 17 m, the dust concentration decreased from 2.37 × 10⁻⁴ to 2.39 × 10⁻⁵ g/m3, suggesting minimal accumulation at higher altitudes. This pattern resembles real-world mining conditions, where fine dust particles disperse over long distances, significantly affecting air quality.
When multiple trucks travel along the same route, dust dispersion dynamics change considerably. Each truck adds new layers of airborne dust, increasing the total emitted dust mass and the affected area. The limited time required for dust to settle between truck passes maintains elevated concentrations, forming a persistent dust cloud that reduces visibility and exacerbates air quality deterioration. The frequency of truck movements plays a key role in dust generation, particularly in high-altitude areas where natural barriers are absent. Close truck spacing continuously agitates dust particles, keeping them airborne for extended periods and allowing the wind to transport them over greater distances. Compared to a single-truck scenario, this results in broader dust dispersion and a more pronounced impact on the surrounding environment, particularly in the downwind direction.
Figure 18a,b, illustrate this effect, where both field observations and simulation results indicate increased dust migration rates and an expanded affected area. Data from random sampling points (Figure 18c) at various heights and distances showed a peak concentration shift from Z = 25 m to Z = −40 m within 15 s. Near the source, dust particles migrate at approximately 2.5 m/s due to intense turbulence in high-vortex zones, but slow to 1.13 m/s beyond Z = −30 m, where turbulence dissipates. The settling velocity (Vs) is crucial for determining the particle deposition rates. On average, Vs ≈ 0.00363 m/s, indicating that finer particles remained suspended for longer periods before settling. Higher dust concentrations, averaging 2.90 × 10⁻² g/m3, were recorded near the first truck, gradually decreasing to 7.84 × 10⁻⁵ g/m3 as particles dispersed at increasing horizontal and vertical distances, particularly around Y = 4 m, Z = −40 m. These results suggest the compounded effects of multiple trucks on dust transport and highlight the necessity for improved dust control measures. Optimizing truck spacing is essential for mitigating dust accumulation and improving air quality. The study suggests that maintaining a minimum spacing of up to 50 m between trucks moving at 10 m/s under a wind speed of 5 m/s allows sufficient time for dust particles to settle before being disturbed again. During stronger wind conditions (>5 m/s), a gap between trucks of more than 50 m is recommended to prevent excessive downwind dispersion. Road surface conditions play a crucial role in dust suppression. When the haul road is not watered, dust resuspension is significantly higher, requiring truck spacing above 80 m to prevent excessive dust accumulation. In contrast, when the road is watered, moisture helps bind particles, thereby reducing airborne dust. In such cases, if the wind direction is not parallel to the truck route, a shorter spacing may be feasible without significantly increasing dust dispersion. Additionally, traffic scheduling strategies, such as staggered truck movements or designated waiting intervals, could reduce dust buildup along haul roads, thereby minimizing their impact on surrounding areas.

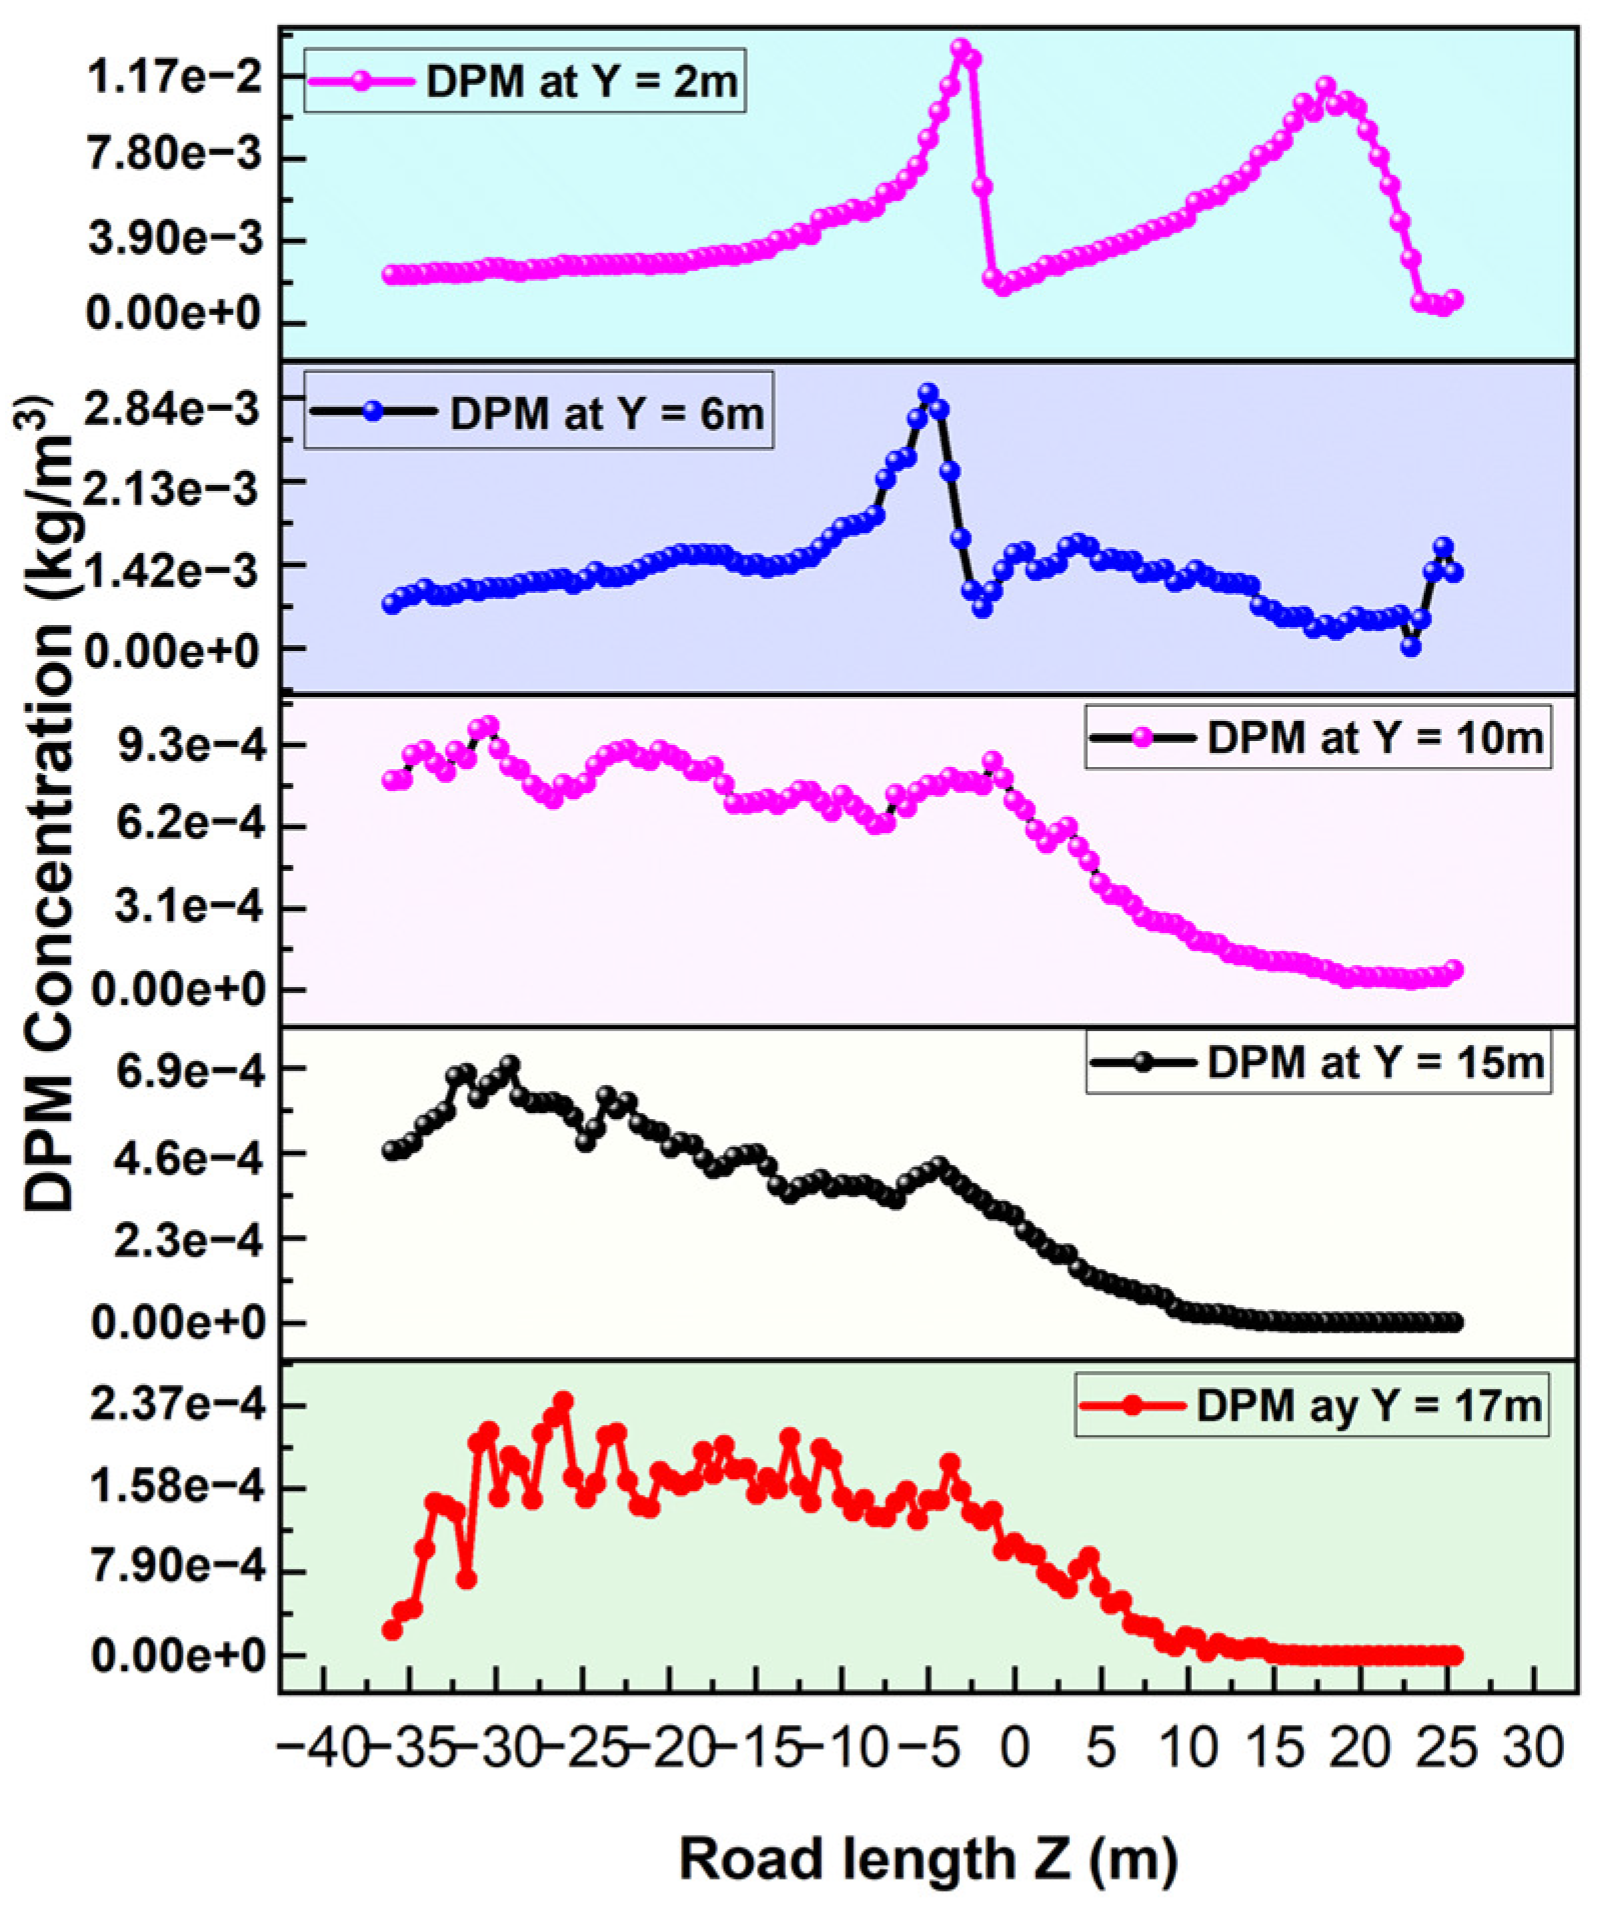
6.6. Analysis of Temporal and Spatial Dust Distribution Considering Terrain and Crosswind Influence

The temporal and spatial distribution based on terrain and crosswind influences reveals significant insights into dust dispersion dynamics in mining environments. Our simulations, considering scenarios with single and dual trucks on haul roads adjacent to 25- and 40-m-high benches under 8 m/s and 10 m/s crosswinds, demonstrate that dust particle movement is predominantly governed by wind flow, determining their migration paths and diffusion ranges. The results shown in Figure 19a,b, the velocity streamlines (top-left and top-right), depict how airflow interacts with the mine benches and illustrate how wind speed and wind direction significantly influence dust distribution and migration in an open-pit mine road, in addition to the terrain effects. At 2 s into the simulation, dust was initiated around the trucks, with particles ascending and dispersing due to wind action. As time progressed to 8 and 15 s, the dust cloud expanded and elevated, with the crosswind directing particles toward the negative Z- and X-axes, leading to accumulation on the opposite side of the road. This observation aligns with findings that natural wind significantly influences dust dispersion patterns in open-pit mines [23]. The simulation further confirmed that terrain features act as barriers to dust migration. Higher dust concentrations were observed along the haul road, while dispersion was reduced toward the upper bench due to the wind direction and terrain-blocking effects.
Sampling at various distances (Figure 19c) from the truck after 15 s of dust initiation indicates distinct levels of dust concentration. At 45 m from the source, the concentrations were 3.45 × 10⁻⁶ g/m3, with lower values on the upper bench due to wind-induced small-particle dispersion. Notably, higher concentrations of 2.51 × 10⁻¹ g/m3 and 5.30 × 10⁻⁴ g/m3 were detected near the truck and coal loads, respectively. The bench faces act as barriers, limiting lateral dust spread and resulting in higher concentrations along the haul road, which reduces dispersion to surrounding areas. This phenomenon aligns with studies indicating that terrain features can influence dust dispersion and accumulation in mining operations [51]. The 3D plot of the dust concentration data (Figure 19e) illustrates the spatial distribution and migration of dust particles at different heights, highlighting the impact of wind and terrain interaction. The simulation results show that dust is carried higher when wind speed increases, leading to greater dispersion across benches. However, when the terrain blocks the direct path of the wind, dust accumulates in specific regions before diffusing. Crosswinds significantly contribute to particle migration away from roads, allowing dust to spread over large areas. Understanding these dynamics is crucial for developing effective dust management strategies in mining environments under various thermal stability and mine depth scenarios.
As illustrated in Figure 19b,d,f, multiple bench-faces above the haul road significantly minimize dust dispersion across the mining site and its surrounding environment. These terrain features act as natural barriers, trapping dust and reducing its environmental impact. The dust distribution patterns observed in the simulation strongly correlate with wind direction, demonstrating how airflow interacts with various terrains within the mining area. In this scenario, the total dust mass concentration used for the simulation was 0.01 kg/s, differing from the case where two trucks operated on a single bench. Analysis of specific sampling points reveals that the highest dust concentration, measured at 1.14 × 10⁻² g/m3, occurs directly on the actively used haul road. As the distance from this point increases, a progressive decline in dust concentration is evident, with values decreasing to 1.83 × 10⁻⁴ g/m3 and further to 1.23 × 10⁻⁶ g/m3. This trend clearly illustrates dust particles’ temporal and spatial dispersion, as wind-induced transport gradually dilutes airborne particulates over time. Fine dust particles exhibit greater mobility, with a fraction migrating toward the second upper bench area by t = 20 s. Given the wind velocity and overall mass concentration, the results highlight how the terrain and airflow dynamics influence dust retention and dispersion. The observed differences compared to the transportation in flat areas, single-bench with single- and two-truck scenarios, suggest that dust migration varies significantly depending on terrain configuration and truck movement positioning with wind directions.

6.7. Evaluation of DPM-Fluent Coupling Effectiveness and Practical Implications

6.7.1. Validation Based on the Spatial Distribution and Concentration of Dust Particles

This study validates the reliability of the DPM-Fluent model by comparing its simulation outputs with real-time field data, focusing specifically on the spatial distribution and downwind concentration of truck-induced dust emissions in an open-pit mining road. As illustrated in Figure 20, five random monitoring points were positioned along the primary dust dispersion path behind and crosswind of moving trucks to assess dust behavior under real-world conditions.
The results show a clear and consistent decline in particulate matter concentration with increasing distance from the emission source. The model achieved an R2 value of 0.89, which corresponds to approximately 89% agreement between simulated and measured PM concentration values. The simulation data reveal that peak concentrations occurred near the truck at Sampling Point 1, with values reaching 2.62 × 10⁻² g/m3 in the simulation and a corresponding 19,026 µg/m3 in the field data. This intense initial plume is primarily attributed to direct road-wheel interaction and vehicle-induced turbulence. At distances of 45 m or more, corresponding to upper bench sampling points, simulated concentrations decreased to 1.09 × 10⁻⁵ g/m3; similarly, field measurements dropped to 81 µg/m3, confirming a similar attenuation trend despite scale differences.
Due to higher settling velocities, larger dust particles are deposited more rapidly and remain close to the road surface. In contrast, finer particles (PM2.5) remain suspended longer and are carried further by wind, resulting in wider horizontal and vertical dispersion, especially under high wind conditions. These dynamics were validated by observed plume spreading to lateral distances of 45 m and vertical uplift toward upper bench levels, in line with terrain-induced air deflection.
Moreover, the simulation’s residence time tracking showed that particles in high-turbulence zones near the truck dispersed quickly, while those in low-turbulence, high-elevation zones experienced slower settling and longer airborne durations. This behavior is consistent with physical dust dispersion theory and reinforces the credibility of the DPM-Fluent model in simulating real-world mining emissions. Based on the observed downwind migration of the particles, longitudinal safety of a minimum distance of 55 m from active haul roads should be considered, and lateral spread suggests that approximately 45 m during crosswind from the haul roads.

6.7.2. Practical Implications and Proposed Dust Reduction Measures

The findings of this study provide actionable insights for dust management in open-pit mining, supported by a validated CFD-DPM model that accurately predicts dust dispersion patterns. The practical implementation of permanent buffer zones may not always be feasible in operational quarry environments due to spatial limitations, pit slope geometry, and traffic logistics. Key proposed measures include installing windbreak panels on safety berms to reduce wind velocity and due to rapid moisture loss at high road surface temperatures (36–41 °C), scheduling water spraying as water spraying can decrease dust emissions by 50–70% [52] or chemical reapplication at optimized intervals (≤30 min for water, ≤2 h for chemical binders) is necessary to maintain suppression effectiveness. Traffic scheduling strategies, such as staggered truck dispatching and minimizing convoy formations during high wind periods, are recommended to reduce cumulative dust emissions, as Gillies et al. [39] found that scheduling vehicle movements during high wind conditions significantly reduce dust dispersion. Pavement stabilization reduces the availability of loose material. These strategies, guided by simulation results, significantly improve air quality, protect workers’ health, and ensure regulatory compliance. For instance, windbreaks can reduce wind speeds by 50–80% [26,27]. Establishing dynamic safety buffer zones (minimum 55 m downwind and 45 m crosswind from haul routes) based on real-time wind conditions is critical for minimizing occupational exposure, especially during intense traffic activity. Integrating real-time PM and meteorological monitoring systems enables adaptive dust control, allowing water spraying, traffic management, and protective measures to be strategically adjusted based on fluctuating conditions. By integrating these measures, mining operations can achieve sustainable dust control, enhancing environmental protection and operational efficiency. While the model demonstrated high-predictive performance (R2 = 0.89) for the Ha’erwusu open-pit coal mining road under the prevailing conditions, its application to other sites should account for variations in terrain geometry (e.g., pit depth, slope orientation), climatic influences (e.g., seasonal wind patterns, temperature, humidity levels, etc.), and transportation dynamics (e.g., vehicle types, frequency, and road layout). For quarries with significantly different characteristics, especially those located in low-elevation regions or with complex mountainous terrain, recalibration of the model parameters, such as pit and road geometry, surface roughness, emission factors, and wind boundary conditions, is necessary to maintain accuracy. Nonetheless, the modeling framework itself remains applicable, as it is built on fundamental fluid dynamics and particle dispersion principles. Future research should optimize these strategies under varying conditions to improve their effectiveness.

7. Conclusions

This study offers a comprehensive and seasonally comparative analysis of dust generation, dispersion, and migration in the Ha’erwusu open-pit coal mine, utilizing an integrated approach combining high-resolution field monitoring with advanced gas–solid two-phase flow simulations using DPM-FLUENT. The findings underscore the critical interplay between meteorological factors, terrain conditions, and vehicular dynamics in shaping particulate matter (PM) behavior within complex mining topographies. Key conclusions include:
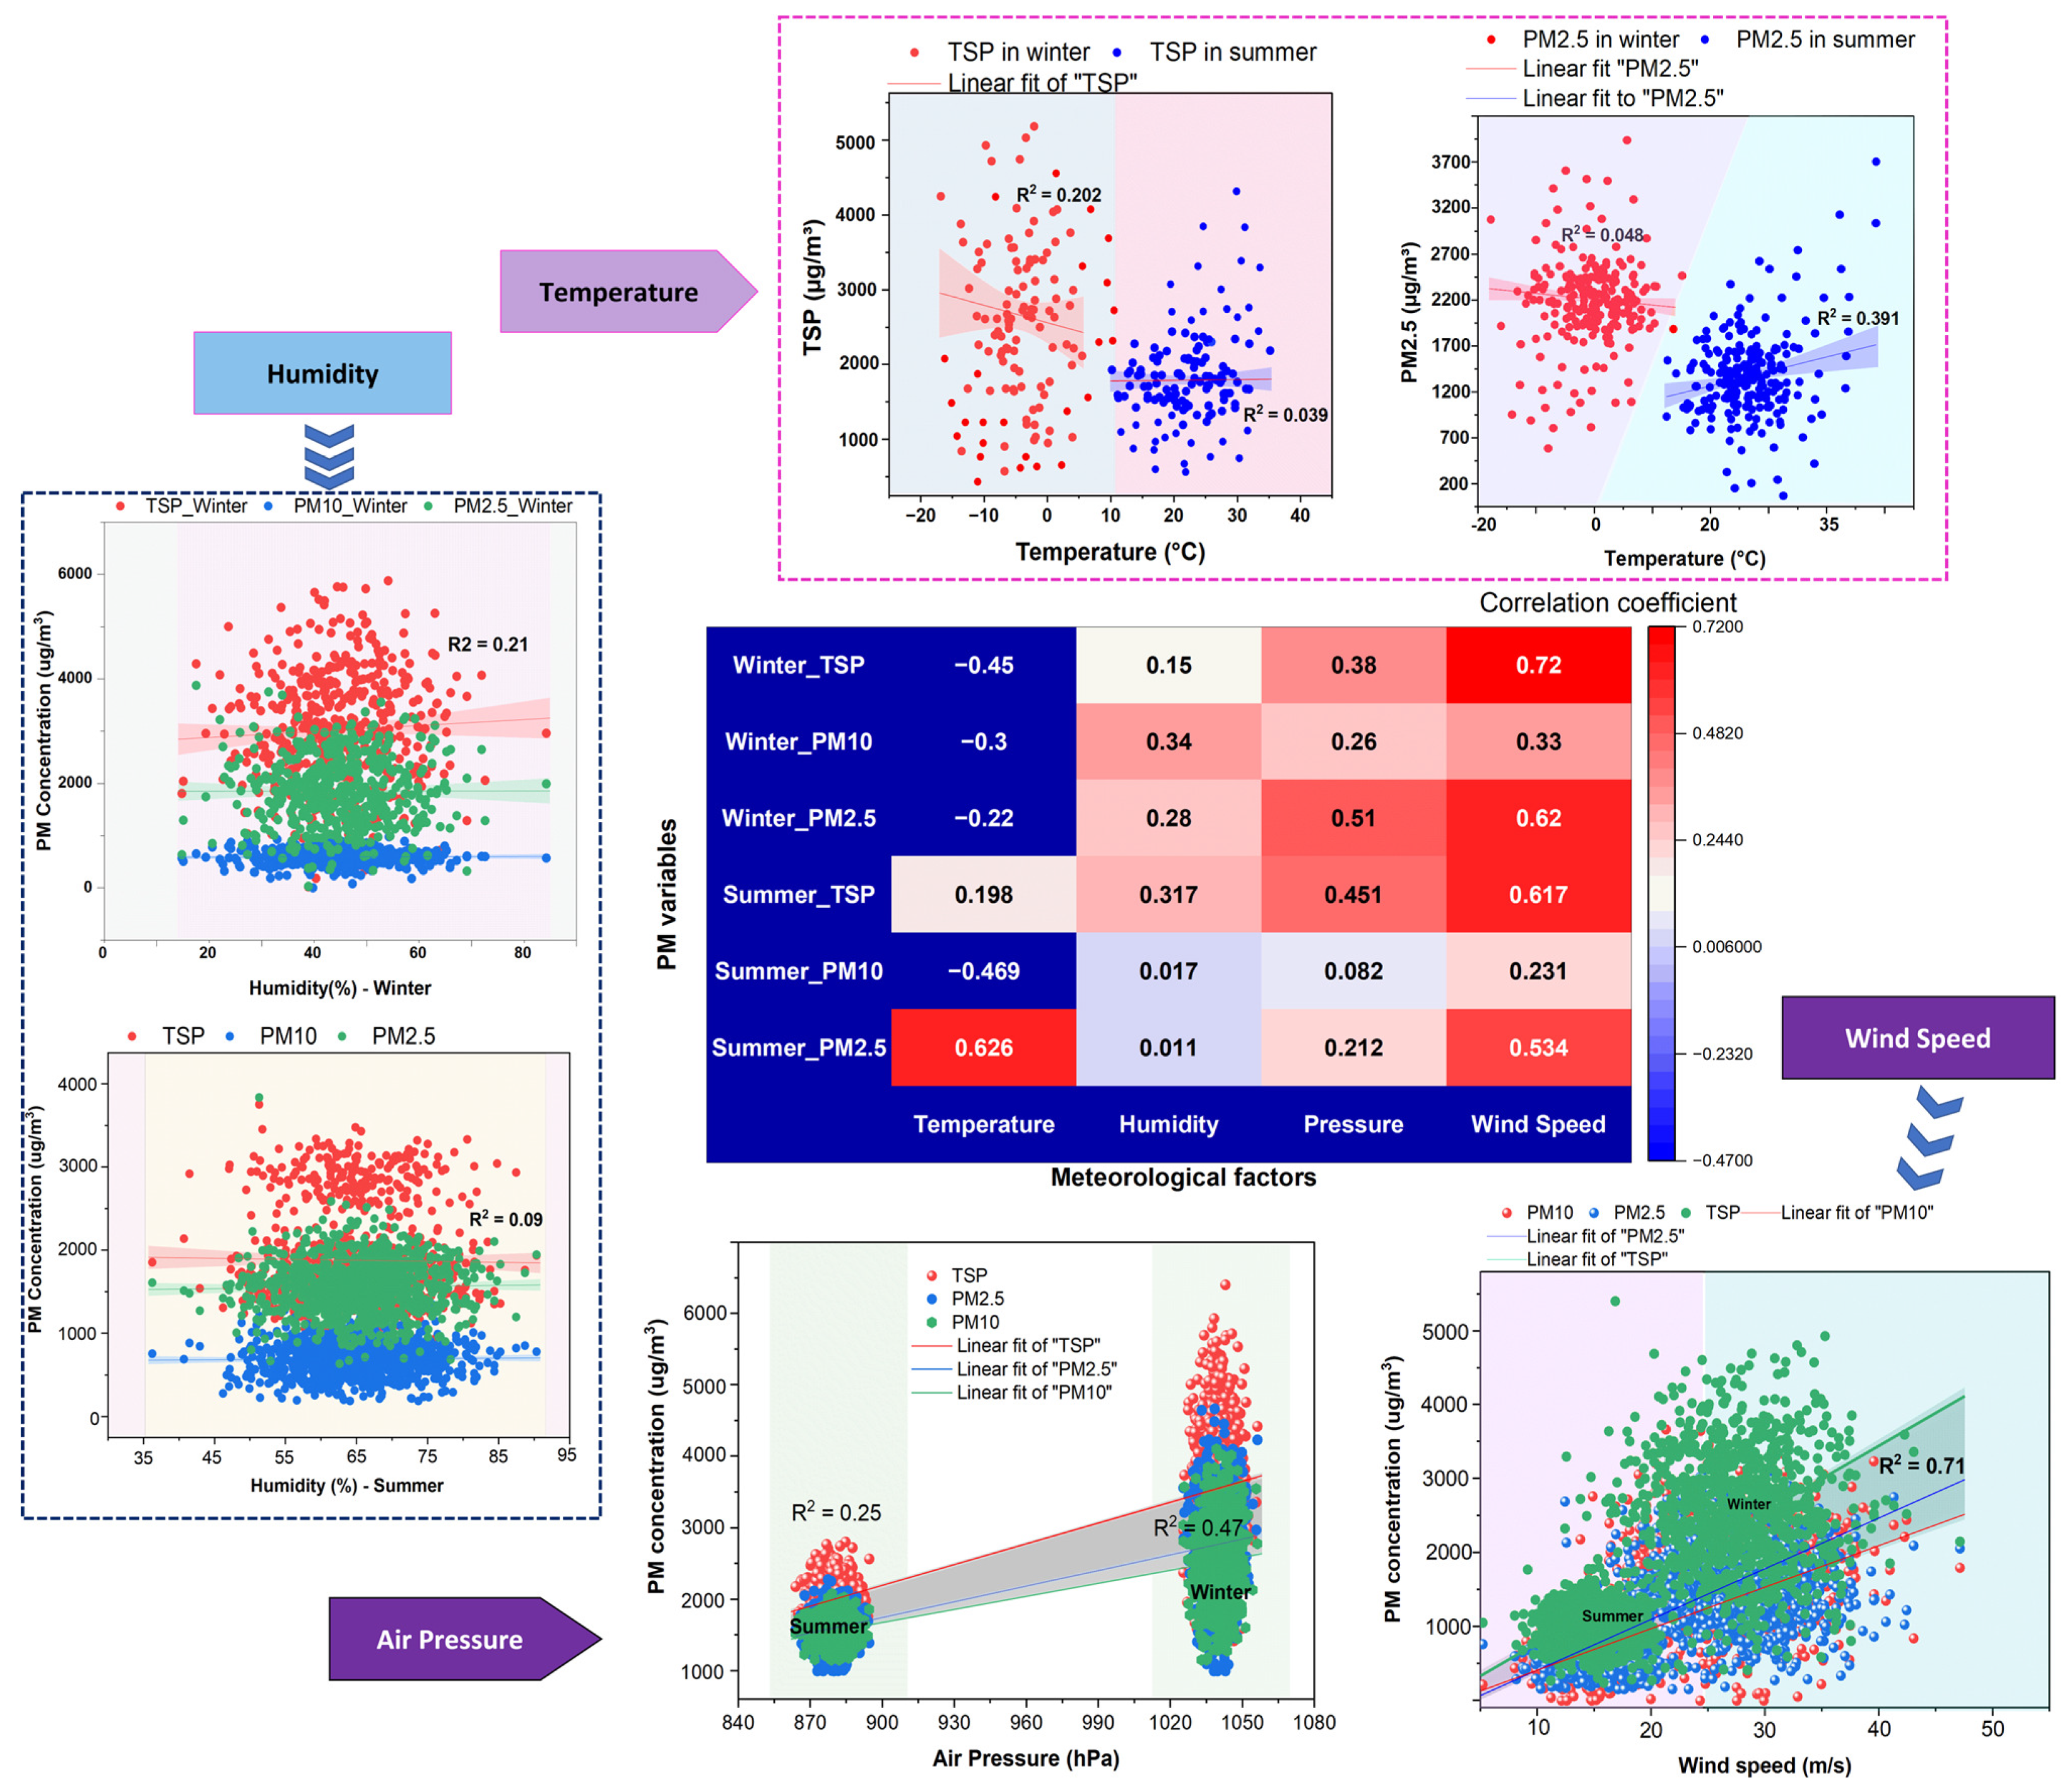
  • Seasonal meteorological influence on PM dispersion: Field data confirmed that meteorological conditions exert season-specific control over dust behavior. In winter, high wind speeds (up to 50 m/s) and elevated air pressure significantly increased PM2.5 and TSP concentrations via mechanical resuspension and surface-layer entrapment. In contrast, summer conditions marked by elevated temperatures (up to 36 °C) and humidity intensified primary dust generation (especially PM2.5) through rapid road surface drying. These findings validate the strong predictive relationships observed in multivariate analysis (R2 = 0.47 for air pressure during winter and R2 = 0.71 for wind speed during both seasons), confirming these parameters as dominant factors of dust concentration and migrations.
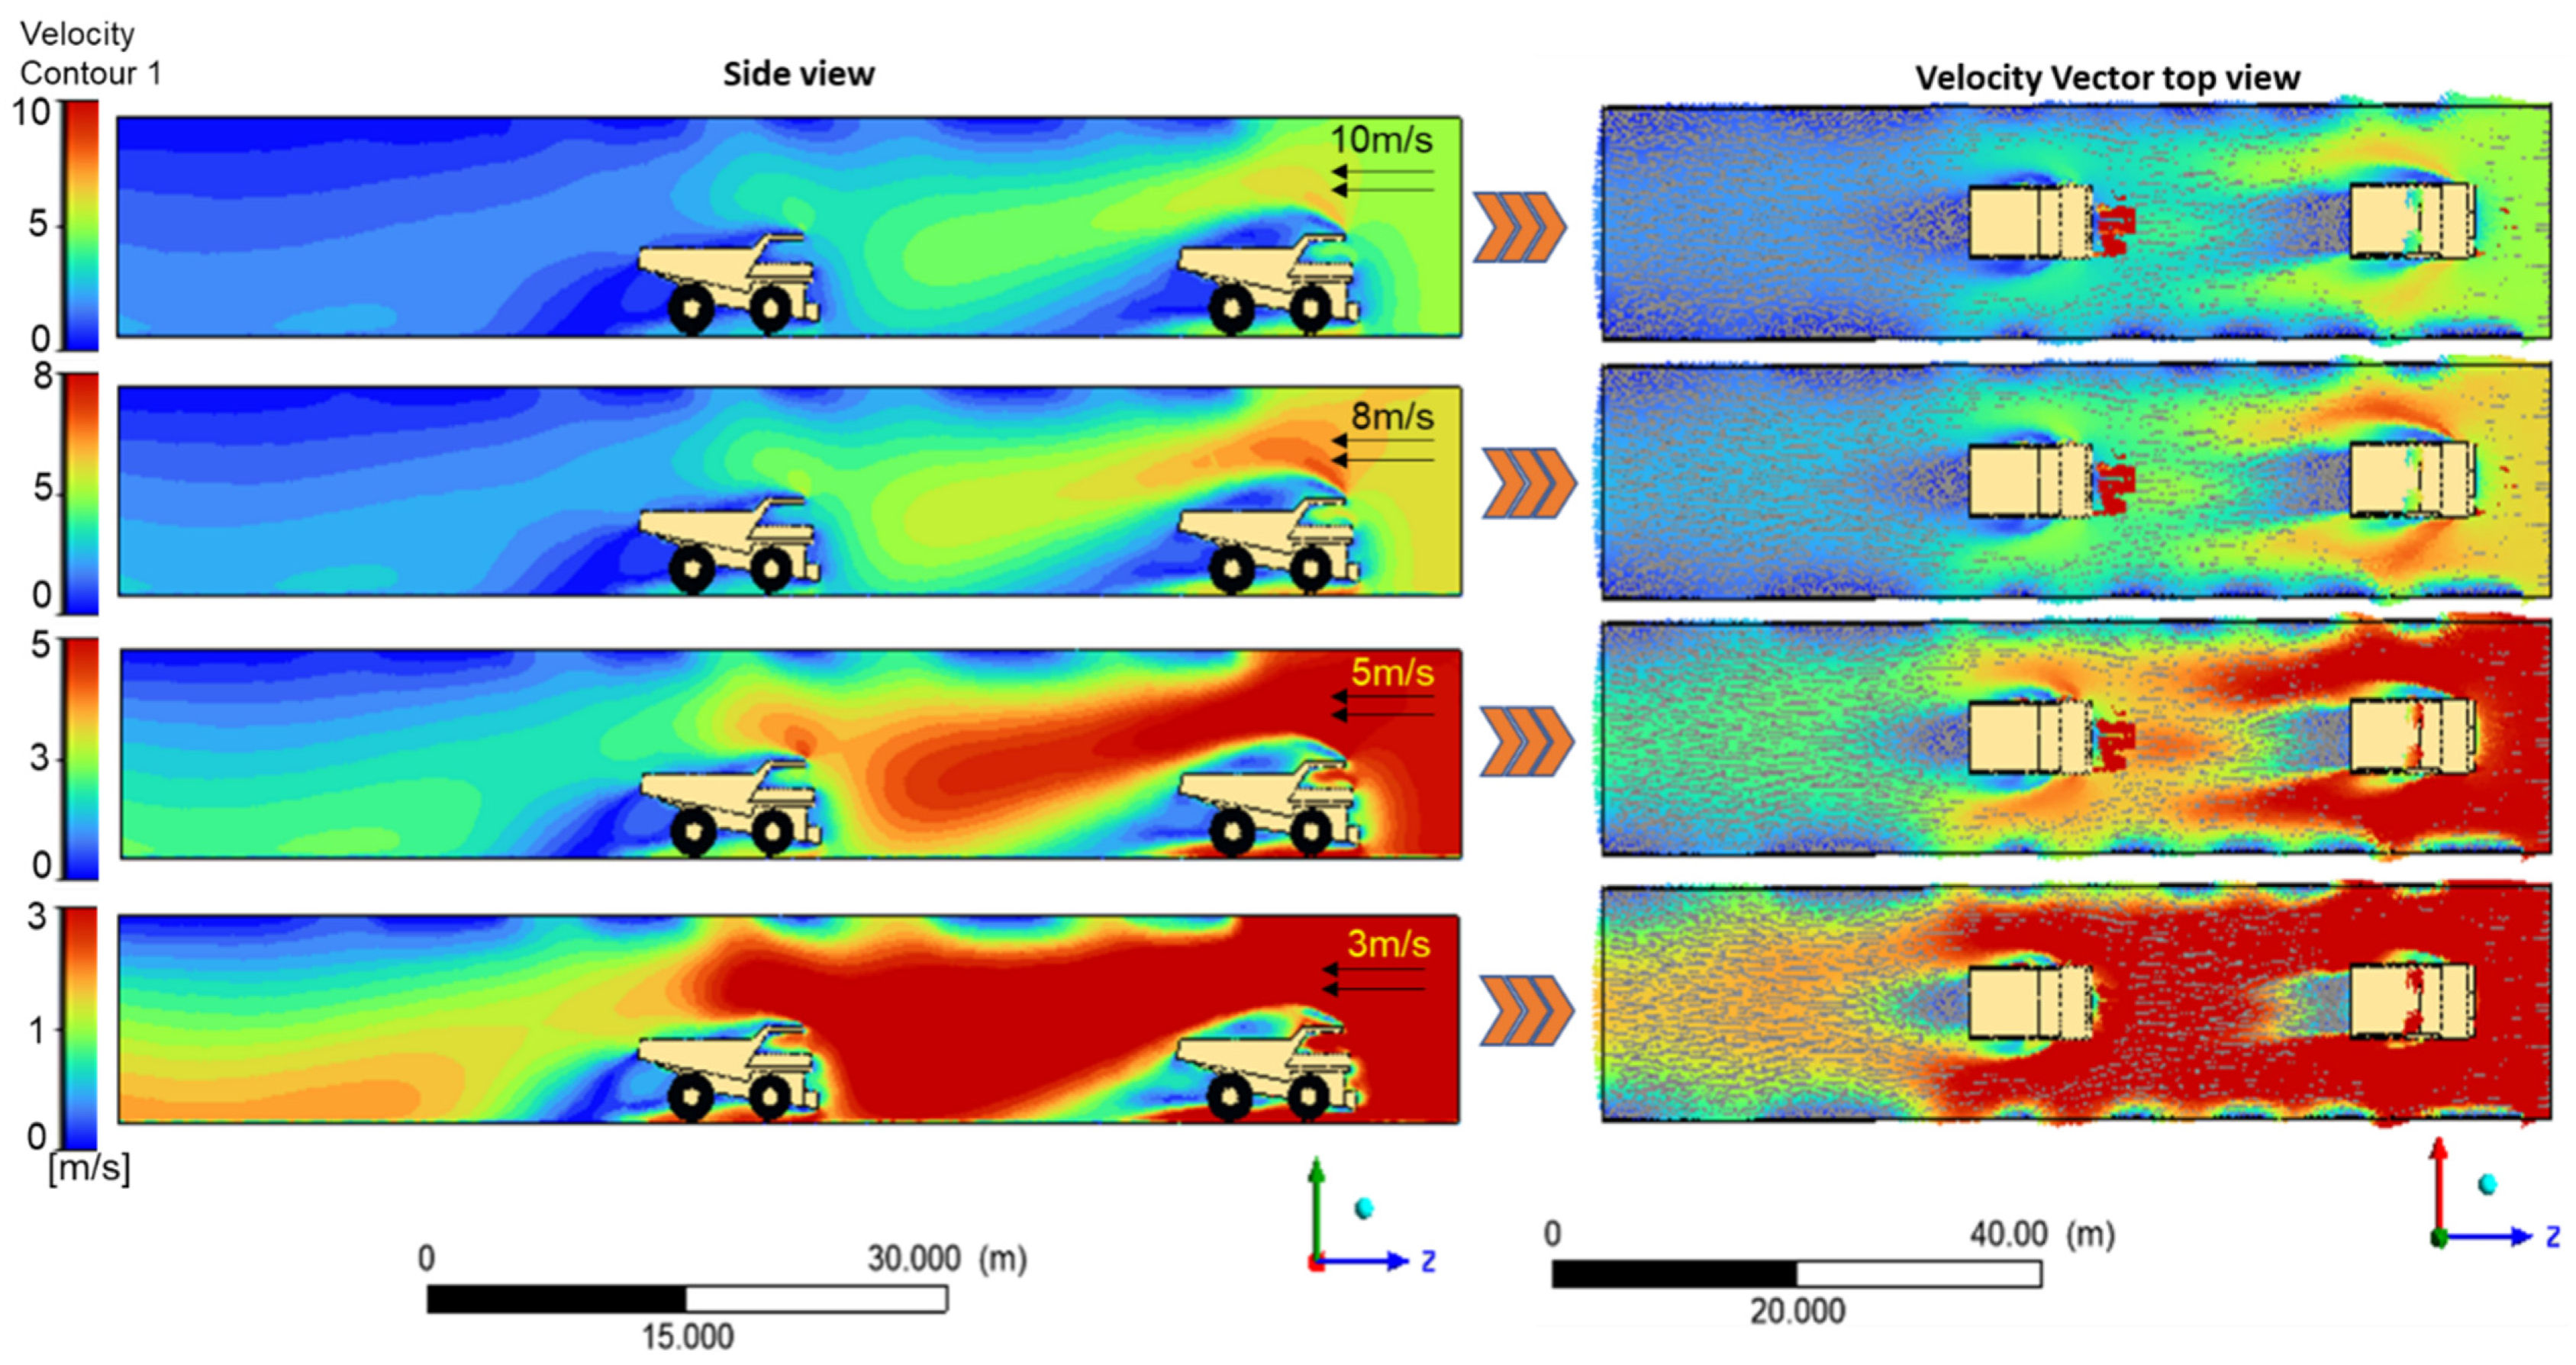
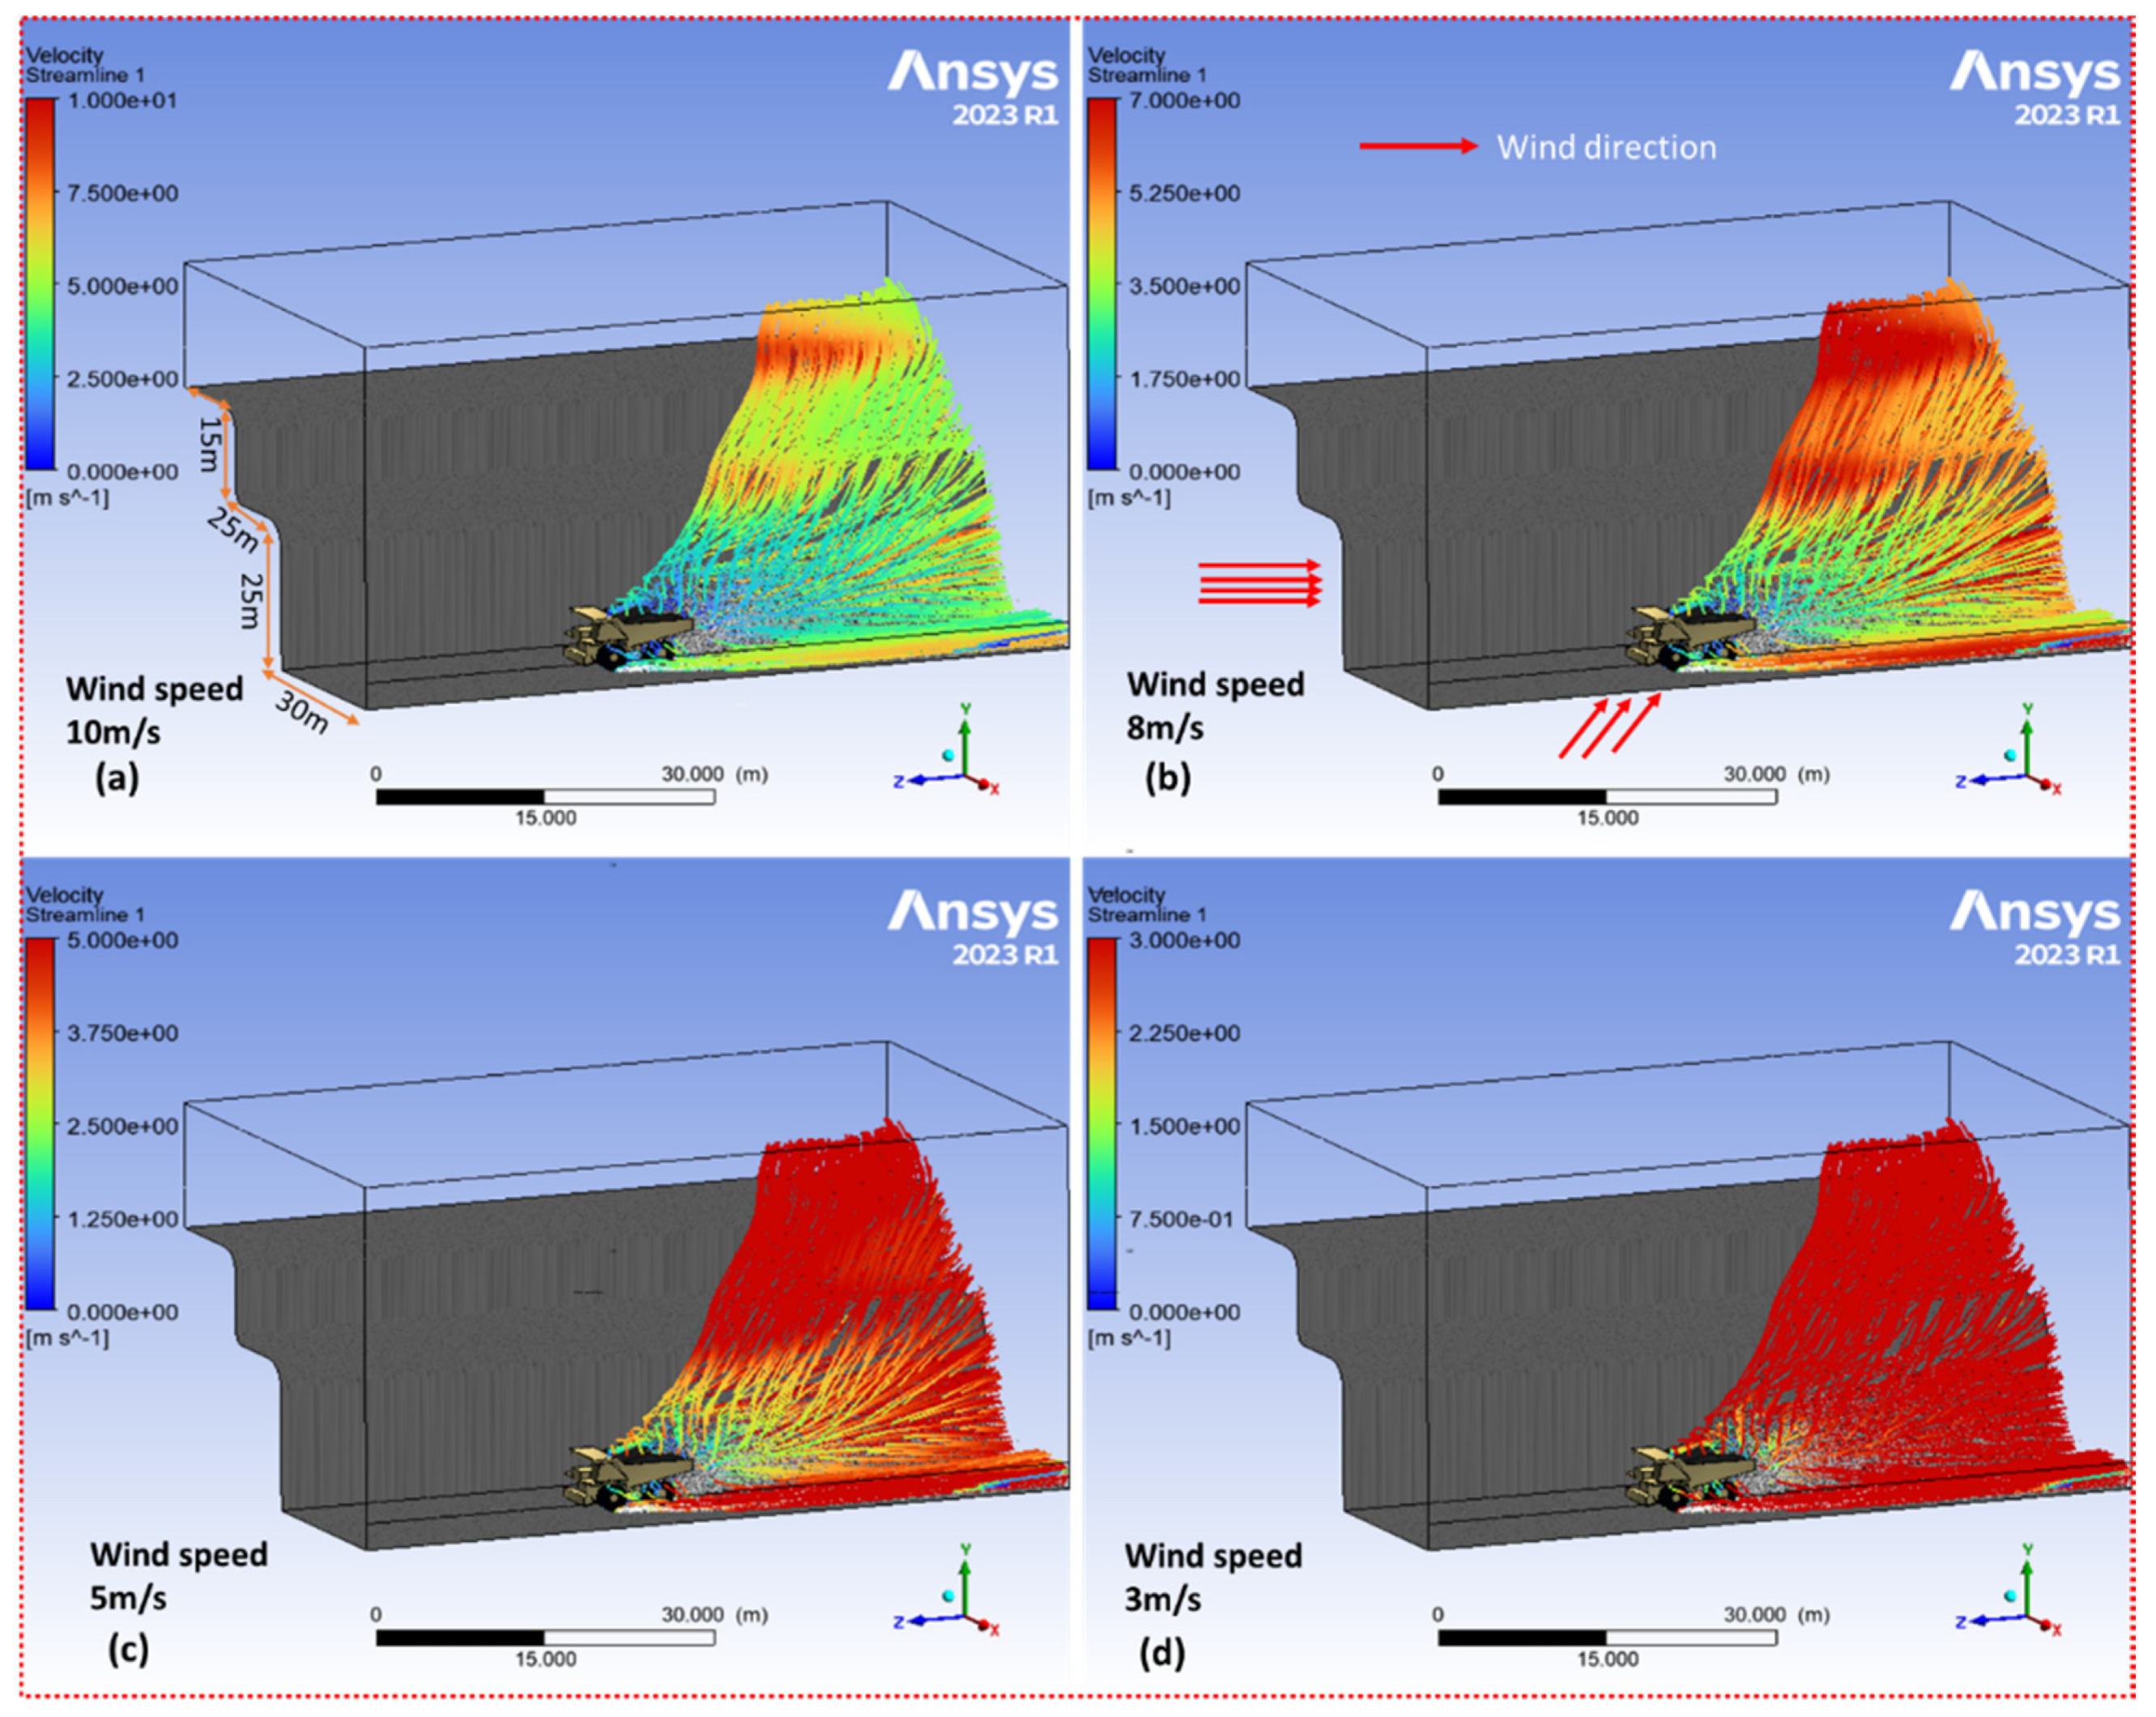
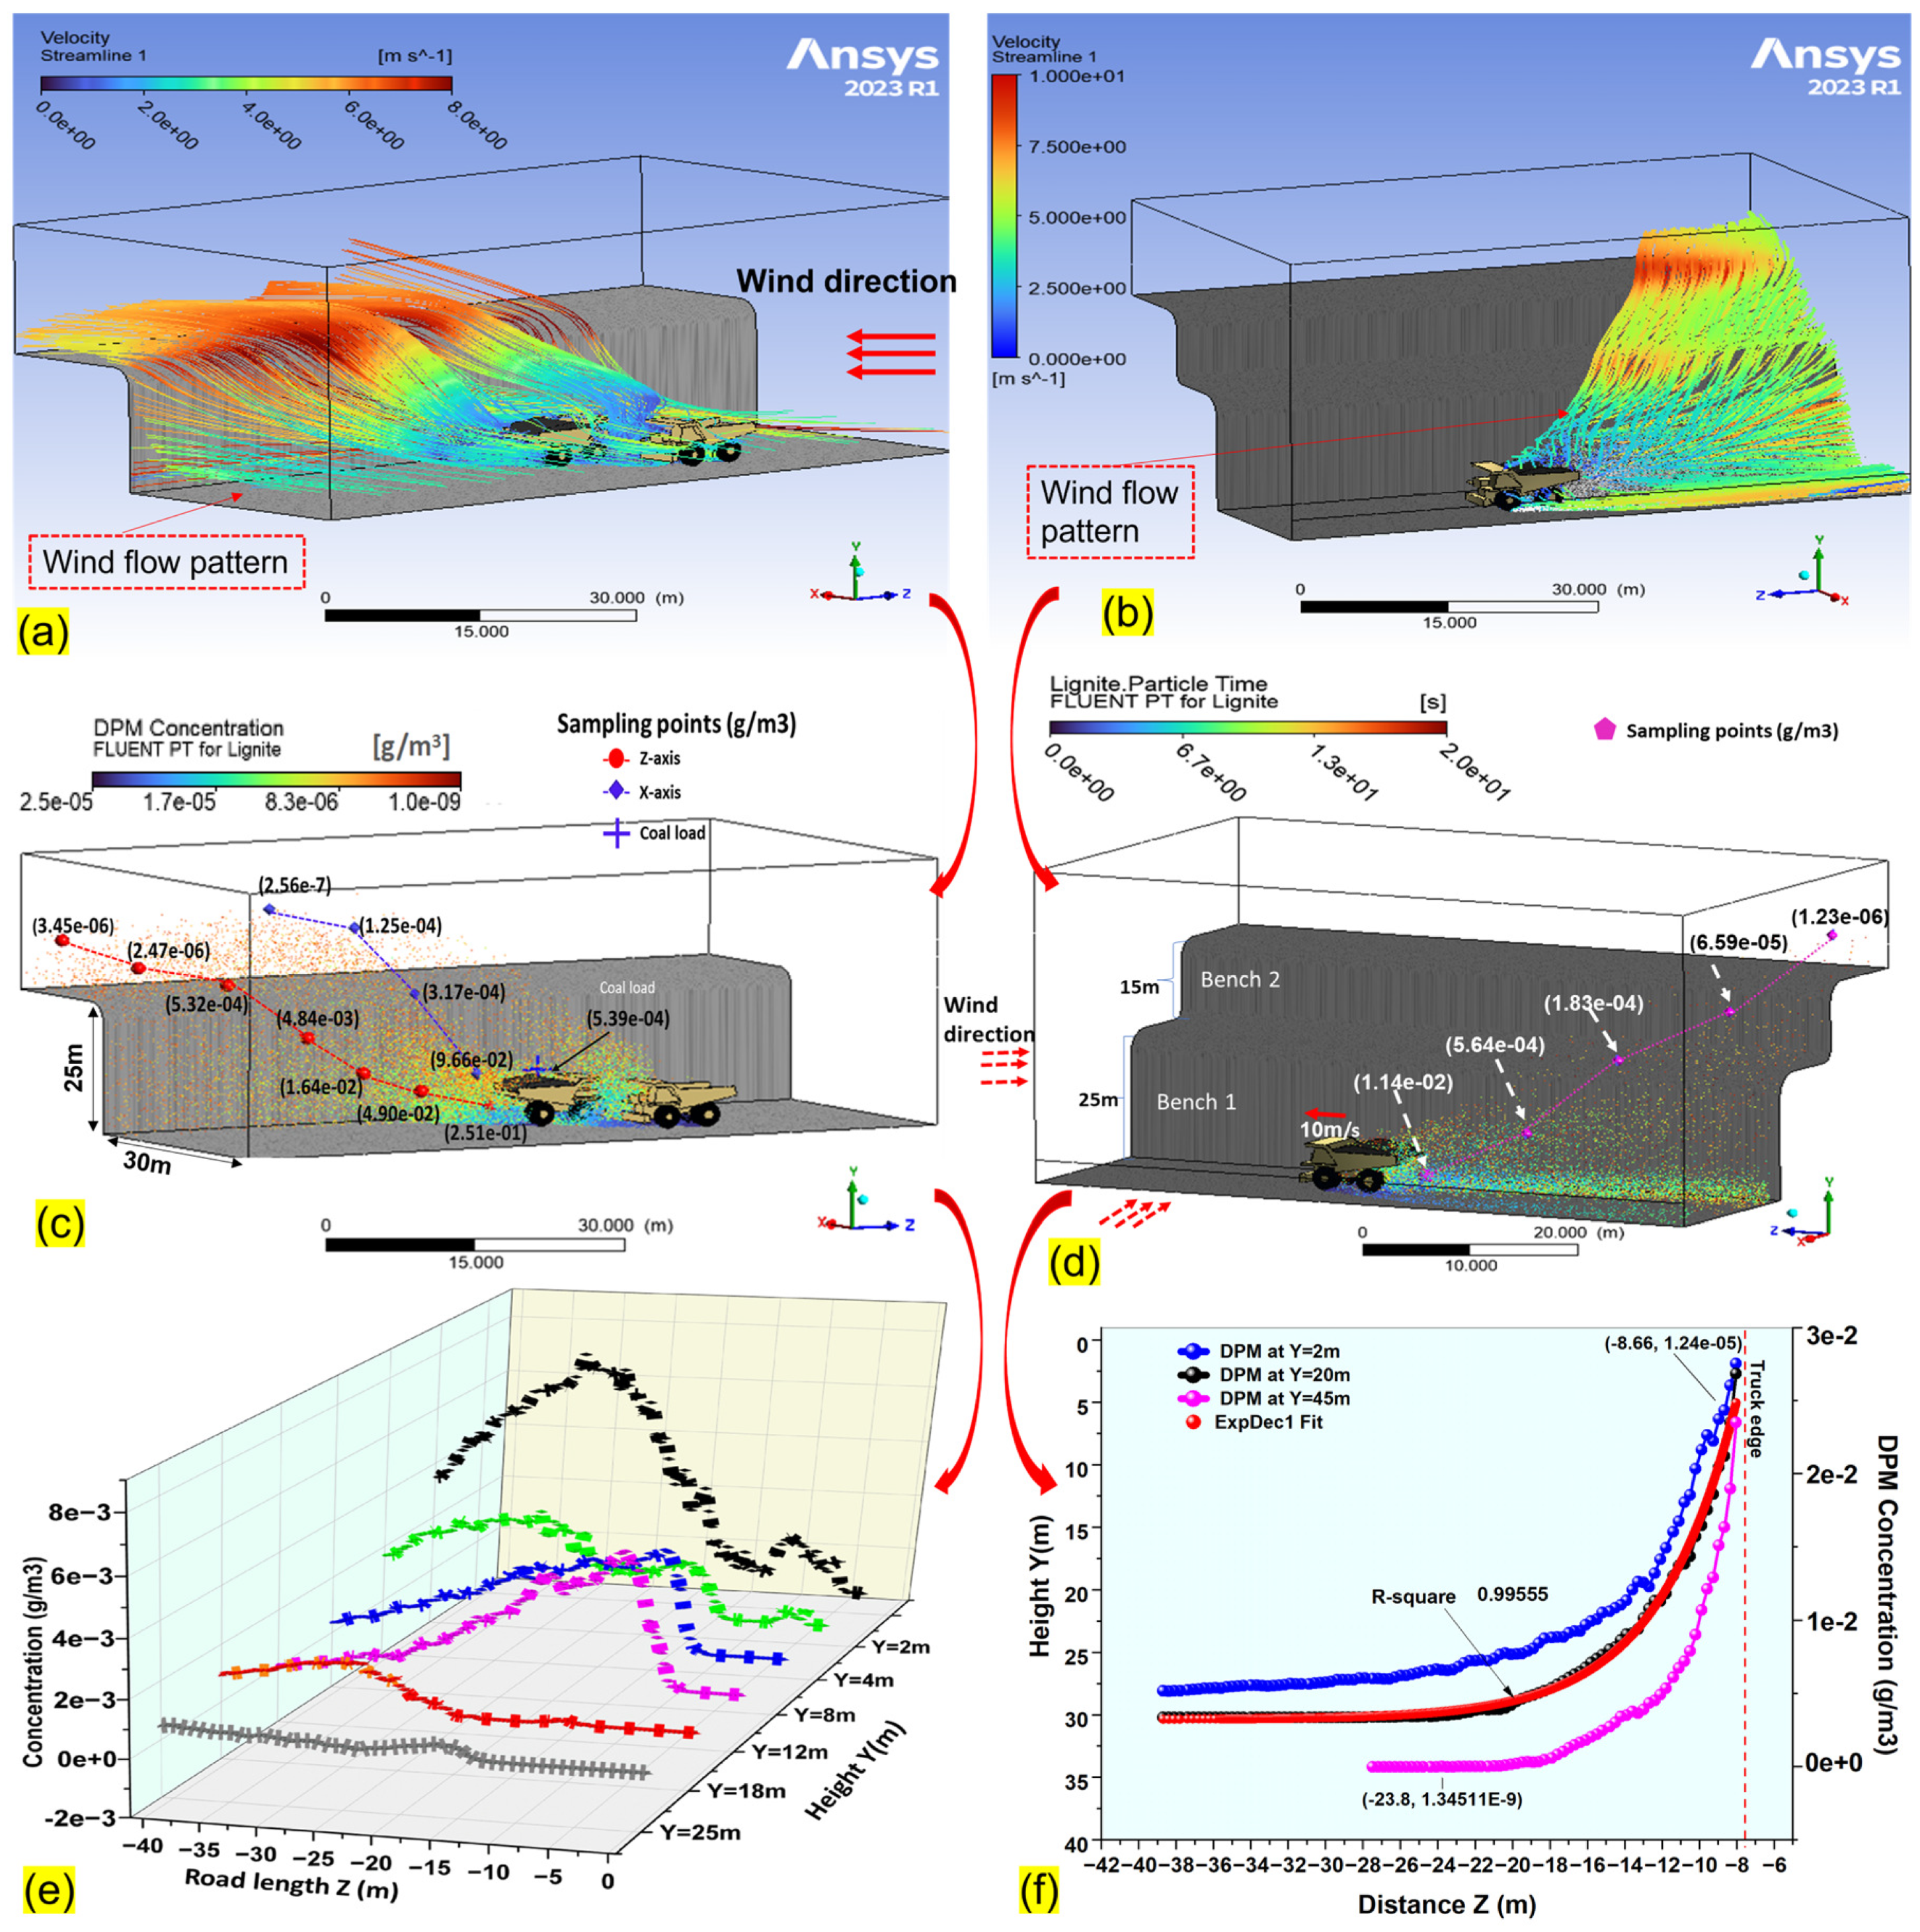
  • External airflow, turbulence, and terrain Interaction effects: Simulation results revealed that dust plumes form two turbulent wake vortices extending over 70 m downwind of a truck, with turbulent kinetic energy peaking at 5.02 m2/s2. Crosswinds and multi-truck operations amplified these effects, especially on non-watered roads. Terrain features such as benches created flow stagnation zones, resulting in particle stratification, where coarse particles remained near haul roads while fine particles dispersed to upper bench levels. Lateral diffusion reached 45 m, while longitudinal transport extended 55 m from the source within 20 s after initiation.
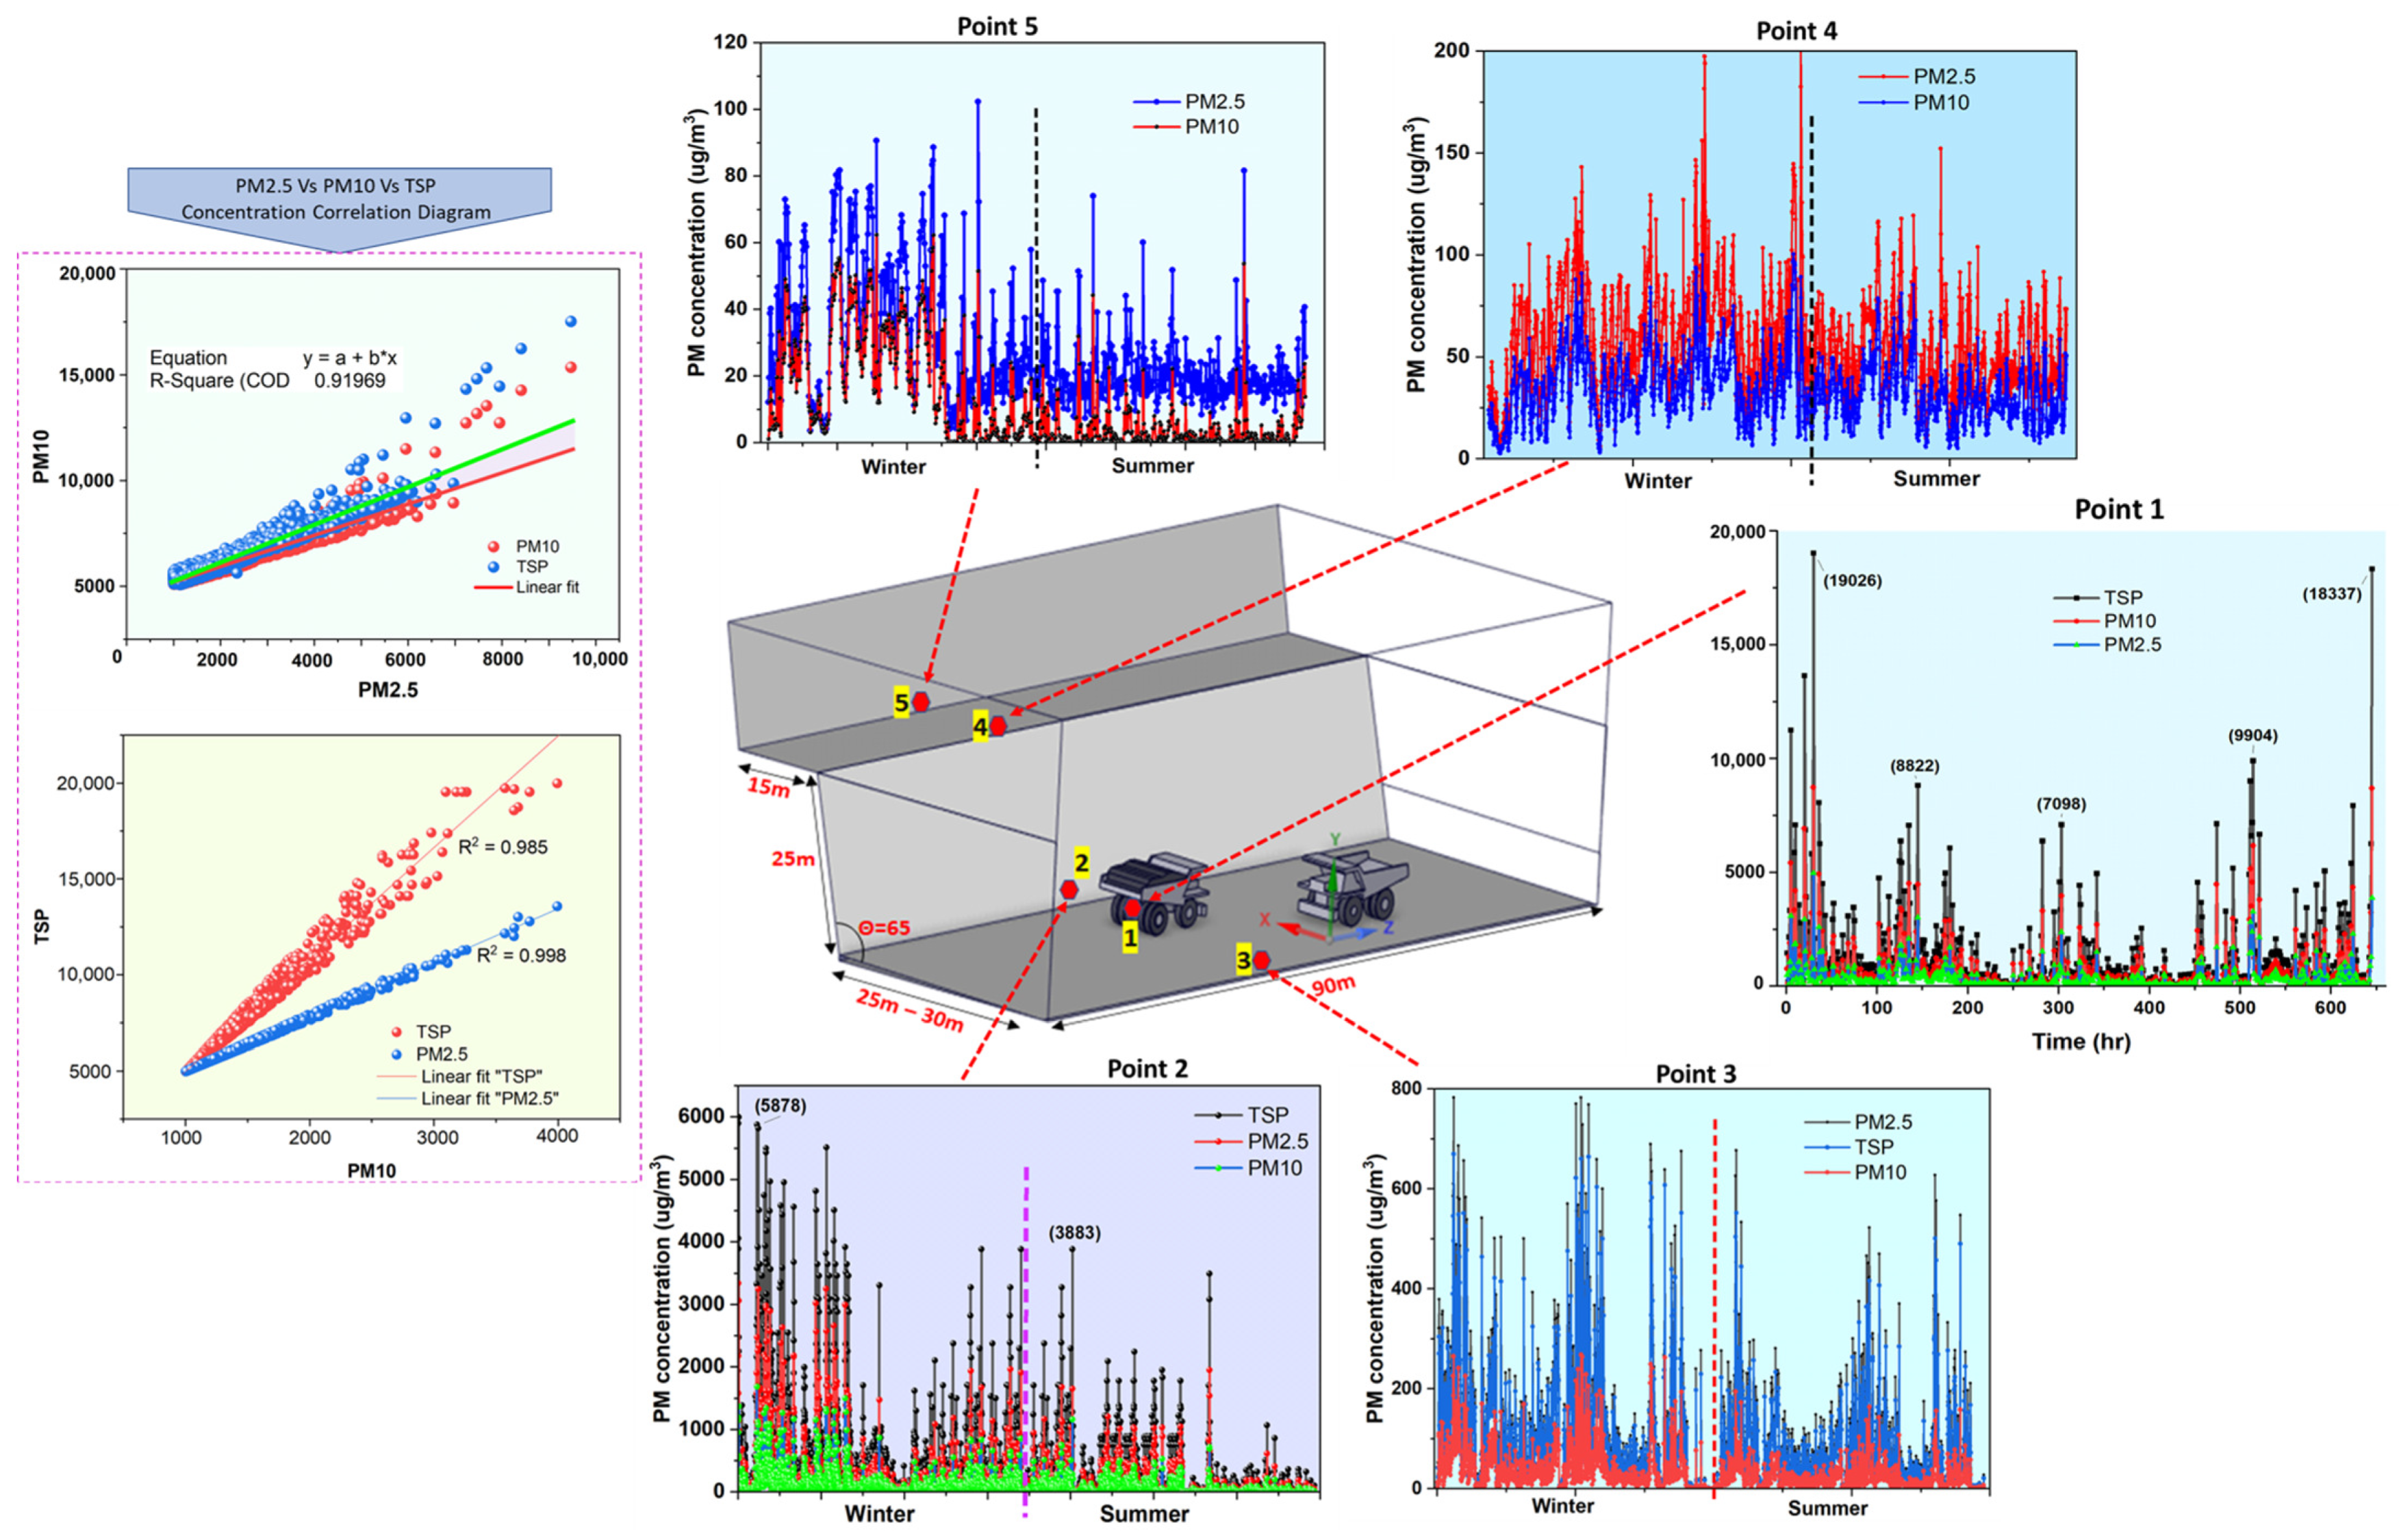
  • Dust generation and concentration mechanism: This study reveals that dust generation in open-pit mining roads is strongly concentrated near haul trucks, with the highest particulate levels observed directly behind moving vehicles on dry, unsprayed roads. Field measurements showed peak total suspended particulate (TSP) concentrations reaching 19,026 µg/m3, while simulation results confirmed similarly intense emission zones with maximum DPM values of 2.62 × 10⁻² g/m3. The dust plume rapidly dissipates as particles settle under gravity and disperse with airflow, decreasing sharply within the first 45 m crosswind. These findings emphasized that vehicular motion is the dominant trigger for dust release, and that particle size and atmospheric conditions govern their settling and diffusion mechanisms.
  • Dust migration mechanism: based on the simulation approach, the DPM concentrations peaked at 4.34 × 10⁻² g/m3 immediately behind a single truck on dry roads and gradually declined to 2.33 × 10⁻⁶ g/m3 at 37 m downwind. Under multi-truck scenarios, emissions increased significantly, reaching up to 2.51 × 10⁻¹ g/m3 in the vehicle wake zone and 5.30 × 10⁻⁴ g/m3 in adjacent coal loading areas. The spatial profiles revealed that dust migrated downwind longitudinally up to 55 m and crosswind laterally to 45 m from the source within just 20 s, defining the short-term dust migration rate under turbulent conditions. Simulations showed that average settling velocities of particles ranging less than 10 µm and above 10 µm exhibited velocities between 0.035 m/s and 0.218 m/s, respectively, with coarser particles depositing closer to the road surface and finer particles remaining suspended and carried to elevated benches.
  • While the CFD-DPM model demonstrated strong agreement with field data, there was a slight underestimation of dust concentrations in the limited number of monitoring stations used for field measurements. Furthermore, the exclusion of spring and autumn monitoring data limits our ability to fully understand seasonal transition mechanisms in dust concentrations. Future studies could address this limitation by incorporating a more extensive network of monitoring points across the downwind direction, validating the model under a wider range of environmental and operational conditions, and collecting four-season data to improve spatial resolution and capture seasonal variability more comprehensively. To minimize computational complexity, the numerical simulations used simplified assumptions, modeling dust particles as uniform-density spheres with a constant mass flow rate, and also did not account for particle-particle interactions. The assumption of steady inlet wind was applied in the CFD simulations. However, in the field, wind speed and direction fluctuate continuously. These temporal variations could lead to different dispersion patterns than those simulated under steady-state assumptions.

Author Contributions

F.G.A.: Writing an original draft, Methodology, Software, Visualization, and Data curation. L.X.: Supervision, Project administration, Review, and editing. Z.Y.: Writing review, Validation, Investigation. A.G.: Writing review, Validation, Investigation. A.W.: Writing review, Validation, Investigation. M.S.: Writing review, Validation, Investigation. N.R.C.: Writing review, Validation, Investigation. Y.F.: Writing review, Validation, Investigation. All authors have read and agreed to the published version of the manuscript.

Funding

This research received no external funding, and the article processing charge was not covered by any funding source and was paid by the authors.

Data Availability Statement

The data is available based on the author’s permission.

Acknowledgments

This research was supported by the National Key Research and Development Program of China (No. 2023YFF1306001), the National Natural Science Foundation of China (No. 52394193).

Conflicts of Interest

The authors declare that there are no financial conflicts of interest or personal associations that could be perceived as influencing the research presented in this manuscript.

References

  1. Wang, M.; Yang, Z.; Tai, C.; Zhang, F.; Zhang, Q.; Shen, K.; Guo, C. Prediction of road dust concentration in open-pit coal mines based on multivariate mixed model. PLoS ONE 2023, 18, e0284815. [Google Scholar] [CrossRef]
  2. Sinha, S.; Banerjee, S.P. Characterization of haul road dust in an Indian opencast iron ore mine. Atmos. Environ. 1997, 31, 2809–2814. [Google Scholar] [CrossRef]
  3. Visser, A.T.; Thompson, R. Mine haul road fugitive dust emission and exposure characterisation. Trans. Biomed. Health 2003, 7, 1743–3525. [Google Scholar]
  4. Piras, L.; Dentoni, V.; Massacci, G.; Lowndes, I.S. Dust dispersion from haul roads in complex terrain: The case of a mineral reclamation site located in Sardinia (Italy). Int. J. Min. Reclam. Environ. 2014, 28, 323–341. [Google Scholar] [CrossRef]
  5. Silvester, S.; Lowndes, I.; Hargreaves, D. A computational study of particulate emissions from an open pit quarry under neutral atmospheric conditions. Atmos. Environ. 2009, 43, 6415–6424. [Google Scholar] [CrossRef]
  6. Patra, A.K.; Gautam, S.; Kumar, P. Emissions and human health impact of particulate matter from surface mining operation—A review. Environ. Technol. Innov. 2016, 5, 233–249. [Google Scholar] [CrossRef]
  7. Ma, J.; Zhang, R.; Li, L.; Liu, Z.; Sun, J.; Kong, L.; Liu, X. Analysis of the Dust-Concentration Distribution Law in an Open-Pit Mine and Its Influencing Factors. ACS Omega 2022, 7, 43609–43620. [Google Scholar] [CrossRef]
  8. Hui, L. Prediction of Respirable Dust Concentration in Coal Mine Based on Neural Network. In Proceedings of the 2020 IEEE Conference on Telecommunications, Optics and Computer Science (TOCS), Shenyang, China, 11–13 December 2020; pp. 402–406. [Google Scholar]
  9. Zhang, W.; Xue, S.; Tu, Q.; Shi, G.; Zhu, Y. Study on the distribution characteristics of dust with different particle sizes under forced ventilation in a heading face. Powder Technol. 2022, 406, 117504. [Google Scholar] [CrossRef]
  10. Dumka, U.C.; Kaskaoutis, D.G.; Francis, D.; Chaboureau, J.; Rashki, A.; Tiwari, S.; Singh, S.; Liakakou, E.; Mihalopoulos, N. The Role of the Intertropical Discontinuity Region and the Heat Low in Dust Emission and Transport Over the Thar Desert, India: A Premonsoon Case Study. J. Geophys. Res. Atmos. 2019, 124, 13197–13219. [Google Scholar] [CrossRef]
  11. Csavina, J.; Field, J.; Taylor, M.P.; Gao, S.; Landázuri, A.; Betterton, E.A.; Sáez, A.E. A review on the importance of metals and metalloids in atmospheric dust and aerosol from mining operations. Sci. Total Environ. 2012, 433, 58–73. [Google Scholar] [CrossRef]
  12. Cheng, Y.; Yu, H.; Xie, S.; Zhao, J.; Ye, Y. Study on the coal dust deposition fraction and site in the upper respiratory tract under different particle sizes and labor intensities. Sci. Total Environ. 2023, 868, 161617. [Google Scholar] [CrossRef]
  13. Shen, Z.; Ao, Z.; Wang, Z.; Yang, Y. Study on Crust-Shaped Dust Suppressant in Non-Disturbance Area of Open-Pit Coal Mine-A Case Study. Int. J. Environ. Res. Public Health 2023, 20, 934. [Google Scholar] [CrossRef]
  14. Zhao, X.; Han, F.; Song, Z.; Wang, D.; Fan, J.; Jia, Z.; Jiang, G. A research on dust suppression mechanism and application technology in mining and loading process of burnt rock open pit coal mines. J. Air Waste Manag. Assoc. 2021, 71, 1568–1584. [Google Scholar] [CrossRef]
  15. Yang, Y.; Zhou, W.; Wang, Z.; Jiskani, I.M.; Yang, Y. Accurate long-term dust concentration prediction in open-pit mines: A novel machine learning approach integrating meteorological conditions and mine production intensity. J. Clean. Prod. 2023, 436, 140411. [Google Scholar] [CrossRef]
  16. Wang, L.; Li, F.; Guo, Y.; Li, Q.; Chen, T.; Wu, J. Numerical Simulation Study of Dust Transport of Comprehensive Mining Working Surface. In Proceedings of the Modern Management Based on Big Data III, Seoul, Republic of Korea, 15–18 August 2022; pp. 440–446. [Google Scholar]
  17. Gautam, S.; Patra, A.K. Dispersion of particulate matter generated at higher depths in opencast mines. Environ. Technol. Innov. 2015, 3, 11–27. [Google Scholar] [CrossRef]
  18. Luo, H.; Zhou, W.; Jiskani, I.M.; Wang, Z. Analyzing Characteristics of Particulate Matter Pollution in Open-Pit Coal Mines: Implications for Green Mining. Energies 2021, 14, 2680. [Google Scholar] [CrossRef]
  19. Wang, Z.; Zhou, W.; Jiskani, I.M.; Luo, H.; Ao, Z.; Mvula, E.M. Annual dust pollution characteristics and its prevention and control for environmental protection in surface mines. Sci. Total Environ. 2022, 825, 153949. [Google Scholar] [CrossRef]
  20. Huang, J.; Chan, T. Vehicle queue effect on the characteristics of air flow, and exhaust scalar dispersion and distribution fields in the vehicle wake. Int. J. Heat Mass Transf. 2012, 55, 7981–7990. [Google Scholar] [CrossRef]
  21. Wang, Y.; Du, C.; Xu, H. Key Factor Analysis and Model Establishment of Blasting Dust Diffusion in a Deep, Sunken Open-Pit Mine. ACS Omega 2021, 6, 448–455. [Google Scholar] [CrossRef]
  22. Huang, Z. Numerical Simulation of Blasting Dust Pollution in Open-Pit Mines. Appl. Ecol. Environ. Res. 2019, 17, 10313–10333. [Google Scholar] [CrossRef]
  23. Chen, Z.; Du, C.; Wang, J.; Wang, Y. Influence of Recirculation Flow on the Dispersion Pattern of Blasting Dust in Deep Open-Pit Mines. ACS Omega 2023, 8, 31353–31364. [Google Scholar] [CrossRef]
  24. Liao, X.; Jiang, Z.; Niu, W.; Yuan, Q. Numerical Simulations of Blasting Dust Migration with the Use of Fluent in Stope. J. Saf. Environ. 2012, 6, 43–46. [Google Scholar]
  25. Li, L.; Zhang, R.; Sun, J.; He, Q.; Kong, L.; Liu, X. Monitoring and prediction of dust concentration in an open-pit mine using a deep-learning algorithm. J. Environ. Health Sci. Eng. 2021, 19, 401–414. [Google Scholar] [CrossRef]
  26. Heisler, G.M.; Dewalle, D.R. Effects of windbreak structure on wind flow. Agric. Ecosyst. Environ. 1988, 22–23, 41–69. [Google Scholar] [CrossRef]
  27. Isley, C.; Kellaghan, R. Tarrawonga Coal Mine -Particulate Matter Control Best Practice Pollution Reduction Program; Whitehaven Coal Limited: Sydney, Australia, 2012; Volume 6680B, pp. 1–45. [Google Scholar]
  28. Liu, Z.; Ao, Z.; Zhou, W.; Zhang, B.; Niu, J.; Wang, Z.; Liu, L.; Yang, Z.; Xu, K.; Lu, W. Research on the Physical and Chemical Characteristics of Dust in Open Pit Coal Mine Crushing Stations and Closed Dust Reduction Methods. Sustainability 2023, 15, 12202. [Google Scholar] [CrossRef]
  29. Lu, X.; Tian, Y.; Jiskani, I.M.; Zhou, W.; Zhao, B.; Ding, X.; Ao, Z. Innovate geopolymer synthesis for green mine road construction: Analysis of efflorescence behavior and strength analysis. Constr. Build. Mater. 2023, 401, 132963. [Google Scholar] [CrossRef]
  30. Kashi, V.K.; Karmakar, N.C.; Krishnamoorthi, S. Study on Opencast Coal Mine Haul Road Dust Suppression using Guargum Grafted Polyacrylamide. J. Mines Met. Fuels 2022, 70, 242–250. [Google Scholar] [CrossRef]
  31. Ardon-Dryer, K.; Kelley, M.C. Particle size distribution and particulate matter concentrations during synoptic and convective dust events in West Texas. Atmos. Chem. Phys. 2022, 22, 9161–9173. [Google Scholar] [CrossRef]
  32. Wei, D.; Du, C.; Lin, Y.; Chang, B.; Wang, Y. Temporal-Spatial Distribution of Vehicle Transportation Pavement Dust Migration in an Open-Pit Mine. ACS Omega 2020, 5, 16030–16036. [Google Scholar] [CrossRef]
  33. Pochwala, S.; Gardecki, A.; Lewandowski, P.; Somogyi, V.; Anweiler, S. Developing of Low-Cost Air Pollution Sensor-Measurements with the Unmanned Aerial Vehicles in Poland. Sensors 2020, 20, 3582. [Google Scholar] [CrossRef]
  34. Xia, N.; Hai, W.; Song, G.; Tang, M. Identification and monitoring of coal dust pollution in Wucaiwan mining area, Xinjiang (China) using Landsat derived enhanced coal dust index. PLoS ONE 2022, 17, e0266517. [Google Scholar] [CrossRef]
  35. Patra, A.; Gautam, S.; Majumdar, S.; Kumar, P. Prediction of particulate matter concentration profile in an opencast copper mine in India using an artificial neural network model. Air Qual. Atmos. Health 2015, 9, 697–711. [Google Scholar] [CrossRef]
  36. Versteeg, H.K.; Malalasekera, W. An Introduction to Computational Fluid Dynamics: The Finite Volume Method, 2nd ed.; Pearson Education Limited: Harlow, UK, 2007; p. 517. [Google Scholar]
  37. Wang, J.; Levy, E.K. Particle motions and distributions in turbulent boundary layer of air–particle flow past a vertical flat plate. Exp. Therm. Fluid Sci. 2003, 27, 845–853. [Google Scholar] [CrossRef]
  38. Lu, X.; Zhang, H.; Xiao, J.; Wang, S. Research analysis on the airflow-particle migration and dust disaster impact scope by the moving mining truck in the open-pit mine. Process Saf. Environ. Prot. 2024, 184, 1442–1458. [Google Scholar] [CrossRef]
  39. Gillies, J.A.; Etyemezian, V.; Kuhns, H.; Nikolic, D.; Gillette, D.A. Effect of vehicle characteristics on unpaved road dust emissions. Atmos. Environ. 2005, 39, 2341–2347. [Google Scholar] [CrossRef]
  40. Abdullah, S.; Ismail, M.; Fong, S.Y. Multiple Linear Regression (MLR) models for long term Pm10 concentration forecasting during different monsoon seasons. J. Sustain. Sci. Manag. 2017, 12, 60–69. [Google Scholar]
  41. Ul-Saufie, A.; Yahaya, A.; Nor, Y.; Hazrul, A.; Abdul Hamid, H. Comparison Between Multiple Linear Regression And Feed forward Back propagation Neural Network Models For Predicting PM 10 Concentration Level Based On Gaseous And Meteorological Parameters. Int. J. Appl. Sci. Technol. 2011, 1, 42–49. [Google Scholar]
  42. Etyemezian, V.; Kuhns, H.; Gillies, J.; Chow, J.; Hendrickson, K.; McGown, M.; Pitchford, M. Vehicle-based road dust emission measurement: I—Methods and calibration. Atmos. Environ. 2003, 37, 4559–4571. [Google Scholar] [CrossRef]
  43. Jhon, D.; Anderson, J. Computational-Fluid-Dynamics-the-Basics-With-Applications; McGraw-Hill: New York, NY, USA, 1995; 563p. [Google Scholar]
  44. Li, L.; Zhang, R.; Li, Q.; Zhang, K.; Liu, Z.; Ren, Z. Multidimensional spatial monitoring of open pit mine dust dispersion by unmanned aerial vehicle. Sci. Rep. 2023, 13, 6815. [Google Scholar] [CrossRef]
  45. Asif, Z.; Chen, Z.; Guo, J. A study of meteorological effects on PM2.5 concentration in mining area. Atmos. Pollut. Res. 2018, 9, 688–696. [Google Scholar] [CrossRef]
  46. Wang, Z.; Zhou, W.; Jiskani, I.; Yan, J.; Luo, H. Optimizing open-pit coal mining operations: Leveraging meteorological conditions for dust removal and diffusion. Int. J. Coal Sci. Technol. 2024, 11, 54. [Google Scholar] [CrossRef]
  47. Pirsaheb, M.; Bakhshi, S.; Almasi, A.; Mousavi, S.; Rezaei, M.; Sharafi, H.; Saleh, E. Evaluating the effect of meteorological parameters (humidity, temperature, wind speed, and pressure) on the dust phenomenon—Case study: Kermanshah, Iran (2008–2012). Int. J. Pharm. Technol. 2016, 8, 17847–17855. [Google Scholar]
  48. Laurent, B.; Marticorena, B.; Bergametti, G.; Léon, J.; Mahowald, N. Modeling mineral dust emission from the Sahara desert using new surface properties and soil database. J. Geophys. Res. 2008, 113, D14218. [Google Scholar] [CrossRef]
  49. Wang, H.; Wang, Z.; Wang, R. Characteristics of dust pollution and its influencing factors during cold period of open-pit coal mines in northern China. Front. Earth Sci. 2025, 13, 1458847. [Google Scholar] [CrossRef]
  50. Wanjun, T.; Qingxiang, C. Dust distribution in open-pit mines based on monitoring data and fluent simulation. Environ. Monit. Assess. 2018, 190, 632. [Google Scholar] [CrossRef]
  51. Hu, S.; Gao, Y.; Feng, G.; Huang, Y.; Shao, H.; Liao, Q.; Hu, F. Characteristics of dust distributions and dust control measures around road-header drivers in mining excavation roadways. Particuology 2021, 58, 268–275. [Google Scholar] [CrossRef]
  52. Ham, Y.; Cheriyan, D.; Kim, H.; Han, J.; Kim, Y.; Janani, P.; Choi, J. Particulate matter reduction efficiency analysis of sprinkler system as targeted control measures for construction activity. Heliyon 2024, 10, e27765. [Google Scholar] [CrossRef]
Figure 1. Study area and field test instruments and monitoring setup.
Mining 05 00043 g001
Figure 2. Actual dimensions and designed model geometry of a transportation truck.
Mining 05 00043 g002
Figure 3. Meshing, convergence test, and grid independence tests using tetrahedral and polyhedral types of meshing at different number of elements.
Mining 05 00043 g003
Figure 4. Average seasonal variation of meteorological factors for winter and summer: (a) Temperature, (b) Humidity, (c) Wind speed, (d) Air pressure, and (e) wind direction.
Mining 05 00043 g004
Figure 5. Pearson correlation and Multivariate linear regression analysis of meteorological factors with PM concentration during winter and summer.
Mining 05 00043 g005
Figure 6. Spatial distribution of dust concentrations at different sampling points from sampling location 1 during winter and summer seasons with the PM2.5 vs. PM10 vs. TSP correlation diagram.
Mining 05 00043 g006
Figure 7. Velocity Contour and velocity vector at downwind direction at 10 m/s, 8 m/s, 5 m/s, 3 m/s.
Mining 05 00043 g007
Figure 8. Wind velocity fluctuation diagram at different height variations at a wind speed of 8 m/s.
Mining 05 00043 g008
Figure 9. Wind speed fluctuation streamlines around the rear part of the truck along the longitudinal Z-axis with horizontal distances from the center toward left and right sides of the road width. Note: Scientific values (e.g., 1.0e−03) follow software generated format and are equivalent to 1 × 10⁻³.
Mining 05 00043 g009
Figure 10. Contour vortex morphology distribution at the back side of a single truck over the horizontal X-axis and side view along the Z-axis.
Mining 05 00043 g010
Figure 11. Velocity streamlines on multiple bench faces: (a) v = 10 m/s, (b) v = 8 m/s, (c) v = 5 m/s, and (d) v = 3 m/s with crosswind direction.
Mining 05 00043 g011
Figure 12. Wind velocity streamline variations and Turbulence kinetic energy starting from the truck edge aligned to wind direction for 10 m/s inlet velocity.
Mining 05 00043 g012
Figure 13. Temporal and spatial distribution of dust particles at time t = 1 s − 15 s in the 5 m/s wind speed at 37 m length of transportation road.
Mining 05 00043 g013
Figure 14. DPM Concentration longitudinal variations at different heights (Y) and times (s).
Mining 05 00043 g014
Figure 15. Spatial and temporal dust distribution on downwind variation during single-vehicle transportation at a total mass flow rate of 0.1 kg/s road dust load: (a) simulation, (b) Actual, and (c) coarse and fine particle distribution and settling distance depending on their diameter.
Mining 05 00043 g015
Figure 16. Side view and top view of dust concentration at time variation (a) t = 2 s, (b) t = 4 s, (c) t = 8 s, and (d) t = 15 s during multiple trucks’ movement.
Mining 05 00043 g016
Figure 17. DPM distribution diagram along the longitudinal (Z-axis) and height variations (Y-axis).
Mining 05 00043 g017
Figure 18. Dust pollution observation from (a) Actual scenario, (b) Simulation study, and (c) Random sampling points.
Mining 05 00043 g018
Figure 19. Influence of wind flow, terrain configuration, and truck operation on dust dispersion and DPM concentration trends along the z-axis. (a) Wind streamlines over a single-bench terrain. (b) Wind flow over multi-bench terrain. (c) Simulated DPM concentration pattern and sampling points along x- and z-axes. (d) Particle residence time across multiple benches (e) DPM concentration profiles at varying horizontal and vertical dispersion. (f) DPM concentration decreasing with distance increase from its source.
Mining 05 00043 g019
Figure 20. (a) Comparison between simulated and field-measured dust concentrations over distance at specific monitoring points, and (b) random sampling of the spatial distribution and concentration of lignite dust particles.
Mining 05 00043 g020
Table 1. Technical parameters of the dust monitoring instrument.
ParametersInstruments
CategoryNameFY-AQM3000Laser Particle CounterHT-9600 Handheld Particle Counter
Environmental Quality MonitoringPM2.50–5000 μg/m30–9999.9 μg/m30–1000 μg/m3
PM100–5000 μg/m30–9999.9 μg/m30–1000 μg/m3
TSP0–20,000 μg/m30–20,000 μg/m3-
Meteorological parametersWind speed0–70 m/s--
Wind direction0–360°--
Temperature
Humidity
Air pressure
−50–80 °C
0–100% RH
500–1100 hpa
5–45 °C
0–100% RH
70–106 kPa
−20–50 °C
0–100% RH
Table 2. CFD-Fluent simulation initial operating conditions and setting parameters.
CFD-Fluent SolverOperating ConditionsSetting Parameters
Solver Pressure-based
Time Steady
Gravity −9.81 m/s2
Viscous model k-epsilon-RNG-Enhanced wall
Pressure-velocity CouplingSimple, Coupled
Turbulent kinetic energySecond-order upwind
Solution initialization Standard
Density of lignite coal dust (kg/m3)1250 kg/m3
Air density (kg/m3)1.225 kg/m3
Boundary ConditionsOperating ConditionsSetting Parameters
Inlet Velocity inlet (3, 5, 8, 10 m/s)
Outlet Pressure outlet
Wall Haul road (stationary)
Bench face (stationary)
Trucks (Translational motion, 10 m/s, Z = 1 m)
Wheel (rotational, 10 m/s = 7.12 rad/s)
Coal load (stationary)
Wall roughness Standard—0 m height
Table 3. Discrete phase model (DPM) operation conditions and setting parameters.
Discrete Phase Model (DPM) SolverOperating ConditionsSetting Parameters
Interaction with the continuous phaseOn
Saffman lift forceOn
Virtual mass flowOn
Pressure gradient forceOn
Accuracy control tolerance 1 × 10⁻⁵
Injection type Surface (haul road, Coal load)
Material Lignite coal
Diameter distributionRosin-Rammler
Total flow rate0.1 kg/s, 0.01 kg/s, 0.001 kg/s
Min. Diameter (μm)1
Max. Diameter (μm)100
Mean Diameter (μm)1 × 10⁻⁵
Spread Diameter 3.5
Drag lawSpherical
Stochastic trackingDiscrete random walk model
Table 4. p-value and variance inflation factor (VIF) values comparison of the selected independent variables.
Meteorological VariablesPM Variablesp-ValueVariance Inflation Factor (VIF)
SummerTemperaturePM2.5<0.01 **1.7
PM10N/A-
TSP0.004 **2.0
Wind speedPM2.5<0.01 **1.8
PM100.002 **1.7
TSP<0.01 **1.7
Air pressurePM2.50.023 *2.6
PM100.017 *2.1
TSP<0.01 **1.5
HumidityPM2.5<0.01 **1.7
PM100.005 **1.9
TSP0.002 **1.8
WinterTemperaturePM2.50.023 *2.7
PM10N/A-
TSP0.010 *2.3
Wind speedPM2.5<0.01 **1.5
PM10<0.001 ** (Ws > 20 m/s)1.6
TSP<0.01 **1.5
Air pressurePM2.5<0.01 **1.8
PM100.010 *2.0
TSP<0.01 **1.7
HumidityPM2.50.038 *1.4
PM100.012 *2.1
TSP0.027 *2.3
* Indicates p < 0.05 (statistically significant at the 5% level). ** Indicates p < 0.01 (statistically significant at the 1% level). Ws > 20 m/s indicates that the maximum wind speed values are statistically significant at a 1% level. N/A means the variable is excluded because of some inaccurate data. VIF < 3 indicates a low multicollinearity assumption.
Table 5. Maximum baseline of dust concentration measured in the sampling sections with and without transportation activities.
PointsPM Concentration and Distribution
Maximum Baseline PM Concentration Without Transportation (μg/m3) in Both SeasonsMaximum PM Concentration During Active Transportation
Winter Summer Simulation Results
PM2.5PM10TSPPM2.5PM10TSPPM2.5PM10TSPDPM Concentration (g/m3)
1******5130708619,0262.62 × 10−2
22810433253168658781952115838834.33 × 10−3
3351452783265670677194552*
432123820098*15274*1.71 × 10−4
530112710262*8153*1.09 × 10−5
* Indicates data that were not available and not considered in the analysis due to incomplete field observations or limitations during sampling. Field measurements and simulation results unit conversion: 1 g/m3 = 1 × 10⁻⁶ ug/m3 = 1e−06 ug/m3.
Table 6. PM settling velocity along the longitudinal direction.
Particle SizePM10
(Z = −2 m–(−15 m))
PM2.5
(Z = −15 m–(−35 m))
Time interval0 s–6 s7 s–15 s
Settling velocity0.2180.035
Disclaimer/Publisher’s Note: The statements, opinions and data contained in all publications are solely those of the individual author(s) and contributor(s) and not of MDPI and/or the editor(s). MDPI and/or the editor(s) disclaim responsibility for any injury to people or property resulting from any ideas, methods, instructions or products referred to in the content.

