1. Introduction
A comprehensive understanding of the geometallurgical variables within a mineral deposit is essential for optimizing mine planning and maximizing economic outcomes [
1,
2,
3]. Integrating geometallurgical data into the early stages of business planning enables the identification of opportunities for improvement and the optimization of operational procedures. This approach not only mitigates technical and operational risks but also enhances the Net Present Value (NPV), increases production efficiency, and improves the utilization of mineral resources [
4,
5,
6,
7].
Geometallurgy is a powerful tool that integrates all elements within a given mineral value chain by incorporating geological and mineral processing data into a predictive model. This integration is crucial for effective short- and medium-term mine planning [
1,
2,
3,
5,
7,
8]. This model is essential for predicting, managing, and enhancing product quality and metallurgical performance (recovery and throughput), while also minimizing environmental impacts. Its application becomes particularly critical in ore bodies with high variability, low-grade minerals, complex mineralogy, and multiple processing routes. In such cases, integrating geometallurgical variables into mine planning is indispensable for achieving optimal outcomes [
1,
2,
3,
9,
10].
To develop an accurate geometallurgical model, it is crucial to obtain a representative set of samples that includes all lithologies present within the deposit. These samples must undergo geometallurgical testing, which should be both efficient and cost-effective, requiring minimal material while providing reliable processability insights. The selection of testing methods and parameters is crucial, as they must align with the chosen processing technologies and remain comparable to traditional metallurgical tests [
11,
12]. This approach enables the model to capture the variability inherent in ore bodies, thus improving the accuracy and reliability of production forecasts [
1,
2,
12].
This study offers a detailed case analysis of a zinc and lead mining operation in Brazil that seeks to develop a geometallurgical program. The primary aim is to characterize and assess the performance of ores from various geologically distinct mining areas through geometallurgical flotation tests on galena and sphalerite. As a brownfield geometallurgical characterization, this research presents the findings from comminution and flotation tests conducted across four key mining fronts.
In recent years, the operation under investigation has experienced a decline in production specification values, despite the implementation of more selective reagents. To address this issue, a comprehensive study was conducted utilizing mineralogical characterization techniques, including Scanning Electron Microscopy (SEM) and Mineral Liberation Analysis (MLA). This analysis focused on mining fronts in two distinct regions: ore in remnant regions (old) and in development regions (new stopes). The findings revealed significant differences in the particle liberation size of galena between these two regions, which directly impacts the concentration processes of lead and zinc sulfide metals. The importance of this study lies in its capacity to provide predictive insights into the processing performance of key ore minerals within the deposit, such as sphalerite ((Zn, Fe)S) and galena (PbS), alongside subordinate occurrences of pyrite (FeS2) and gangue minerals, including barite (BaSO4), dolomite (Ca, Mg(CO3)2), calcite (CaCO3), and quartz (SiO2).
This article is structured into several sections.
Section 1 provides an overview of the general considerations and objectives.
Section 2 outlines the characteristics of the mine under study.
Section 3 offers a detailed description of the analyses conducted and the procedures adopted.
Section 4 presents the findings objectively, along with an analysis of their implications. Finally,
Section 5 summarizes the key findings derived from the analysis of the results and their subsequent discussion.
3. Methodology
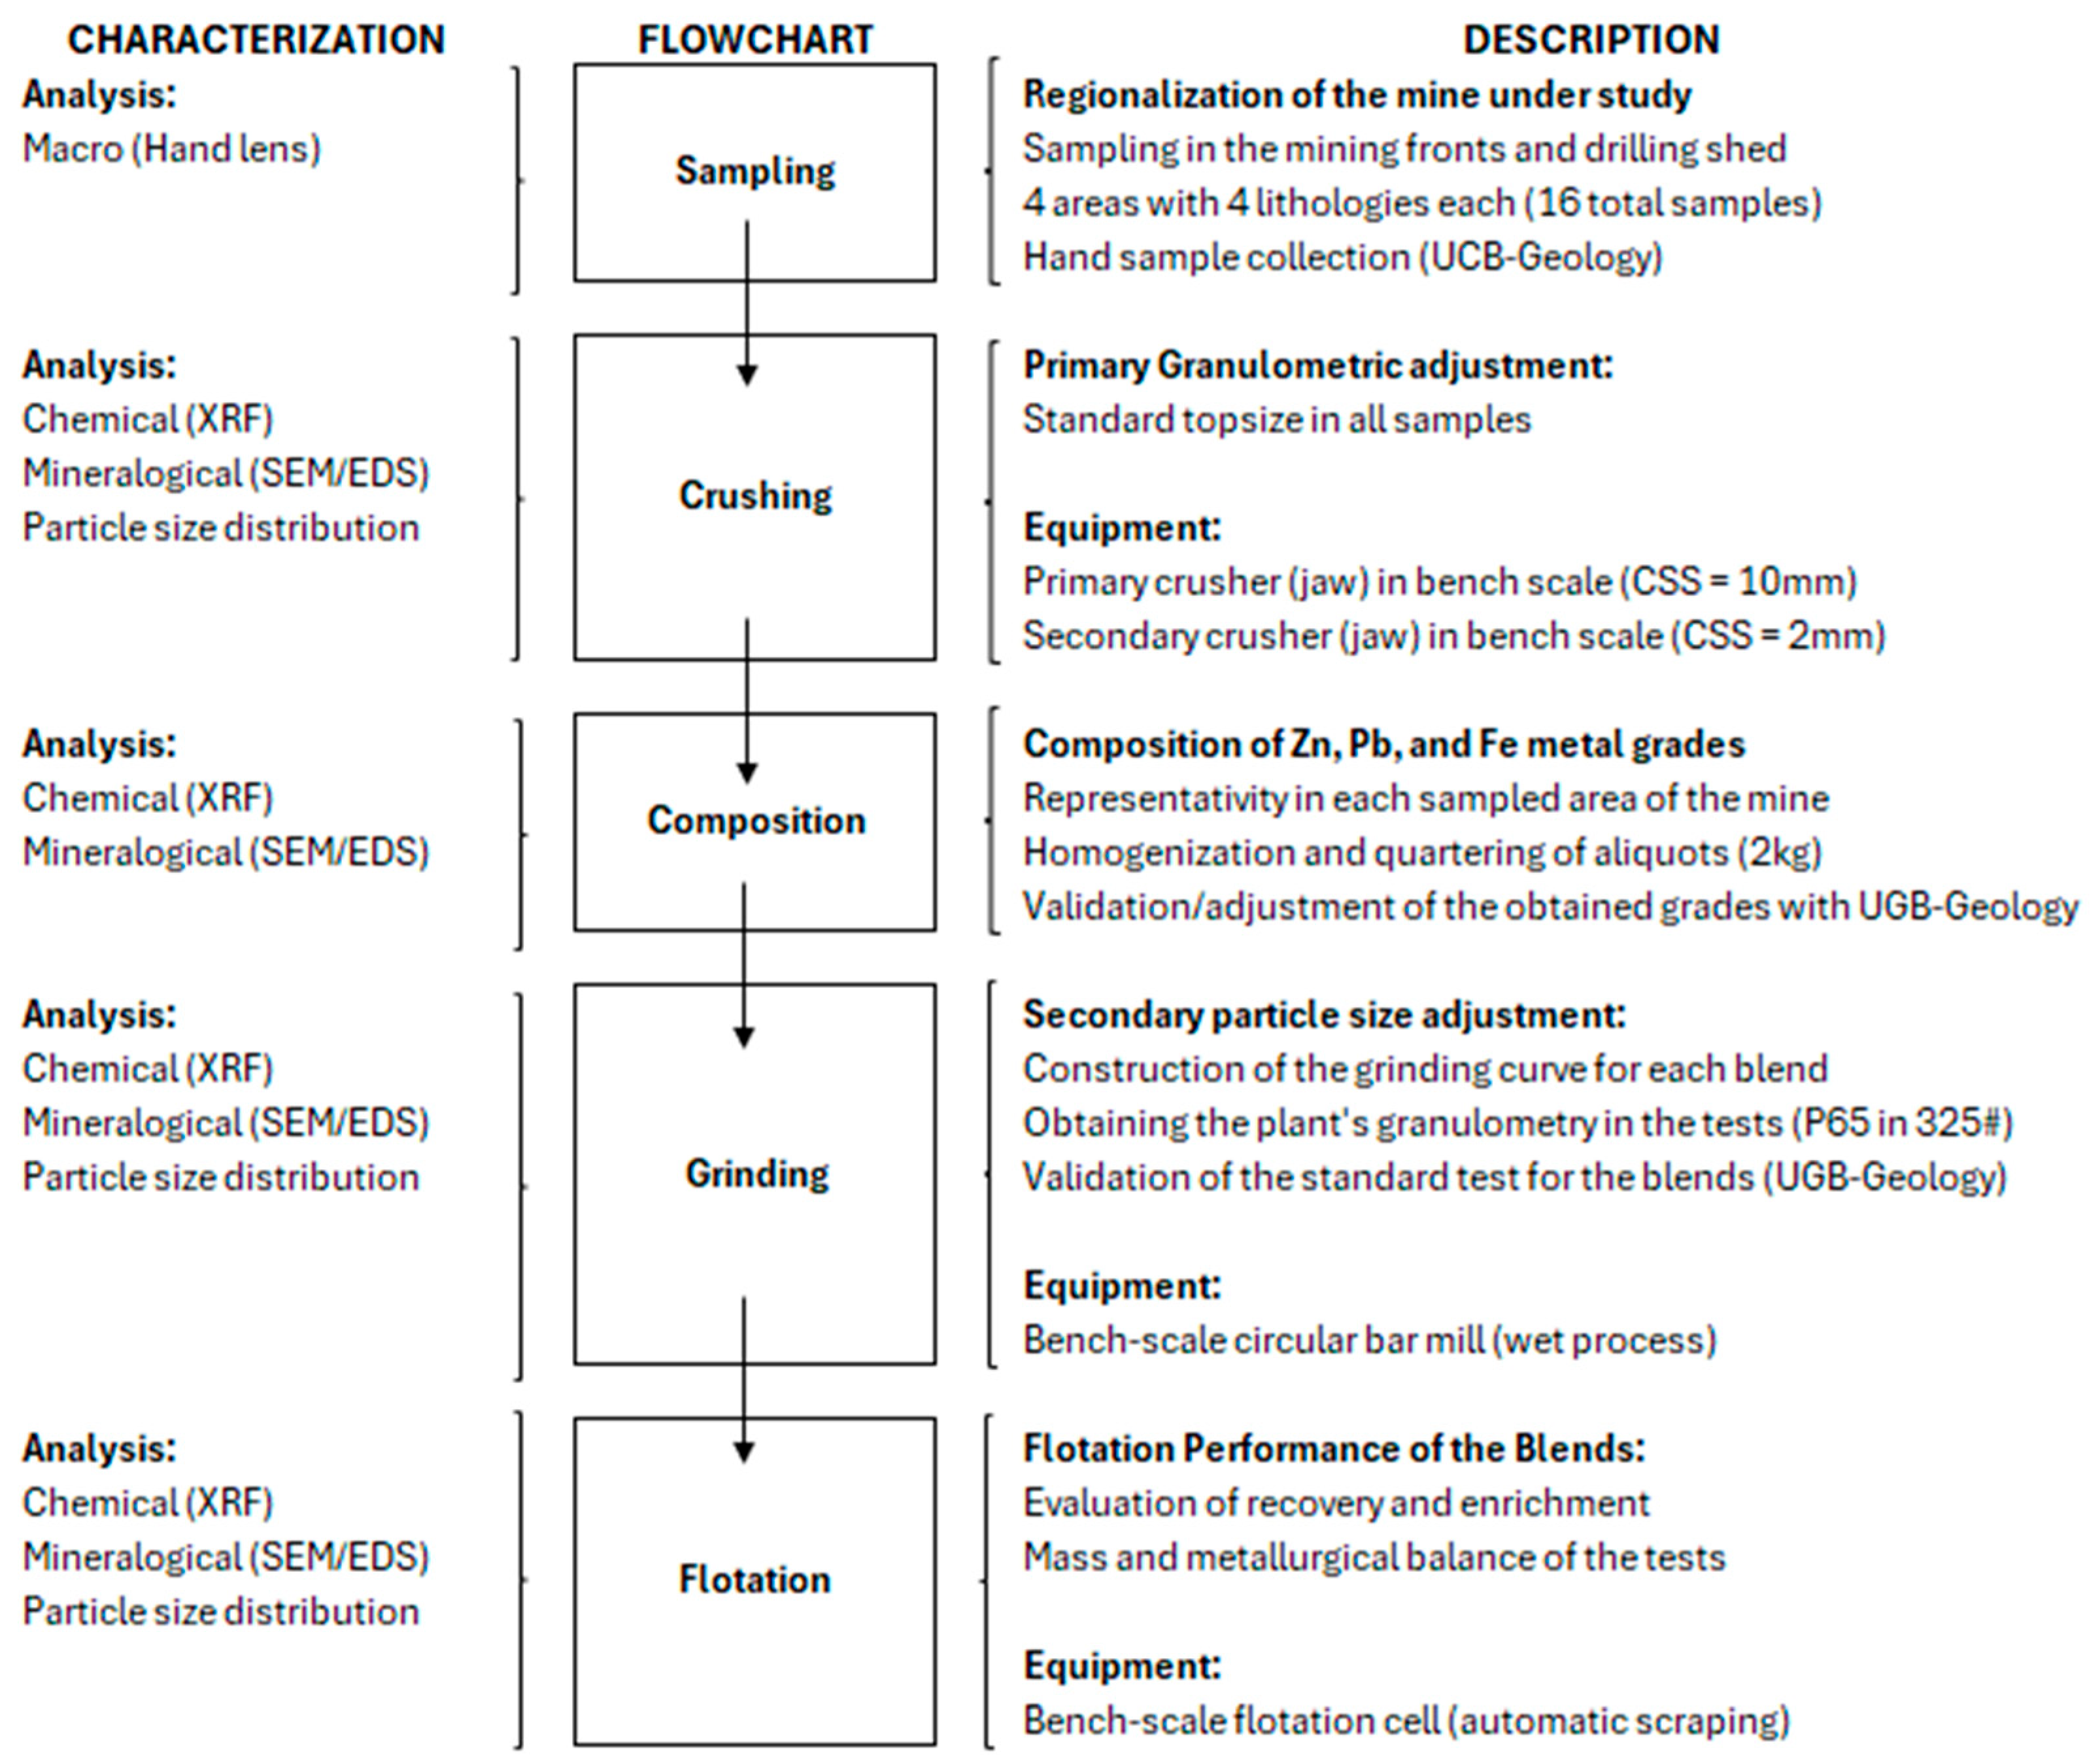
This section outlines the methodologies, procedures, and tests used to achieve the objectives of this study.
Figure 1 illustrates the geometallurgical characterization flowchart associated with this research.
3.1. Sampling and Primary Particle Size Reduction
Samples were collected from the active mining fronts to ensure a comprehensive representation of the four primary lithologies present within the mineralized bodies: galena, sphalerite, pyrite, and dolomite. Each sample weighed approximately 4 kg, resulting in about 16 kg of sample per mining front. At a later stage, an additional 4 kg sample was collected from each mining of dolomite lithology to ensure that there was sufficient mass to meet the established composition targets.
The primary particle size reduction was performed using two laboratory-scale jaw crushers. To avoid the generation of fine material at this stage, the crushing was carried out in two closed side settings (CSSs), with the first at 10 mm and the second at 2 mm in each crusher, respectively. All samples were crushed individually and then homogenized using a Jones riffler until a representative aliquot of approximately 150 g was obtained. The aliquot was then analyzed using Atomic Absorption Spectroscopy (AAS) and X-ray Fluorescence (XRF) for cross-data analysis. Chemical tests were performed in triplicate to ensure accuracy and reliability.
3.2. Composition of the Samples
Predictive calculations using the Solver
® add-in in Microsoft Excel
® enabled the precise estimation of the required quantities from each sampled lithology across the four mining fronts, targeting the average grades of the ROM (Run-of-Mine) that feed the processing plant (
Table 4). The target values are KPIs of the processing plant and correspond to an approximate grade of 2.70% Zn, 0.56% Pb, and 4.00% Fe. Due to the mineralogical associations between the sulfides of each mining front, the compositions did not achieve the target values with such precision, as there were no “pure” samples of these minerals (the variations ranged from 0.5% to 30% of the target values).
Each composite sample was homogenized and quartered using a carousel-type riffler, obtaining five aliquots of approximately 2 kg each for the geometallurgical tests. Additionally, a 50 g aliquot was collected from each composite sample for mineralogical characterization using MLA and chemical analysis via XRF.
3.3. Grinding Curve
A 2 kg aliquot from each composite sample was selected to study the grinding time required to achieve the target P
80 value, which is a KPI for the processing plant, set at 45 microns. An 8″ × 12″ rod mill equipped with 20 kg of a grinding medium (16 rods) and a slurry solid percentage of 60% was used for the tests. The open-circuit rod mill was chosen because the particle size distribution of the product is comparable to an industrial closed-circuit ball mill.
Table 5 shows the mass percentage passing the reference screen, along with the ideal grinding time for each composite sample.
3.4. Grinding
After determining the ideal grinding time for each sample, the P80 check was performed under the same conditions as the grinding curve, thereby validating the particle size reduction for the flotation stage. To accurately reflect the materials’ performance, the discharge from the laboratory mill was immediately transferred to the flotation cell at the end of each grinding period. This minimized the potential oxidation of sulfide particle surfaces and ensured that the grinding and flotation stages represented the plant conditions. This approach prevented the oxidation of galena particles, ensuring their effective collection by the PAX reagent. Additionally, all water used to wash the mill rods was incorporated into the slurry to correct the solid percentage for the subsequent flotation stage.
3.5. Laboratory Flotation
The flotation tests were performed using a laboratory flotation cell equipped with automatic scraping (model CFB-1000, CDC
®). A 4.0 L cell was used for the Rougher Pb, Scavenger Pb, Rougher Zn, and Scavenger Zn stages, while a 1.5 L cell was used for the Cleaner Zn stage. To closely replicate the plant’s actual conditions, an optimal solids concentration of 35% was established in the cell prior to the initiation of the flotation process.
Figure 2 presents the flowchart, and
Table 6 details the operational conditions for all the flotation tests performed in this study.
The galena flotation test occurs at the natural pH of the slurry, with a dosage of 40 g/t of the collector PAX and 20 g/t of the frother MIBC, conditioned for 120 s to perform the Rougher Pb stage. The concentrate collection time for this stage is 240 s. The tailings from this stage are conditioned with 10 g/t of PAX and 10 g/t of MIBC, followed immediately by the initiation of the Scavenger Pb flotation for 240 s. The final tailings serve as the feed for the sphalerite circuit.
The flotation test for sphalerite was conducted with an activator dosage of 200 g/t copper sulfate conditioned for 5 min. Subsequently, 90 g/t of the collector PAX and 20 g/t of the frother MIBC were added, and the mixture was conditioned for 2 min. The target pH for flotation was set at 9.5 (adjusted with lime), after which the Rougher Zn flotation stage began. All material floated during the Rougher stage was transferred to a 1.5 L cell for the Cleaner Zn flotation test, which was carried out for 60 s without additional reagents. The concentrates from the Rougher Zn stage were collected over 120 s. At the end of the flotation cycle, an additional 70 g/t of PAX and 20 g/t of MIBC were added to the cell and conditioned for 120 s for the Scavenger Zn flotation.
A chemical analysis of the concentrates enabled the calculation of the mass and metallurgical balance for the tests. Upon completion of the test, all remaining material in the cell was filtered, and this sample was considered the final tailing.
3.6. Mineralogical Characterization
The flotation feed, Rougher Pb concentrate, Cleaner Zn concentrate, and final tailings from all flotation tests were characterized from the bulk samples using SEM. The samples were quartered until representative aliquots of approximately 50 g were obtained. These aliquots were embedded in epoxy resin and analyzed using SEM with MLA software version 3.1.4.686.
4. Results
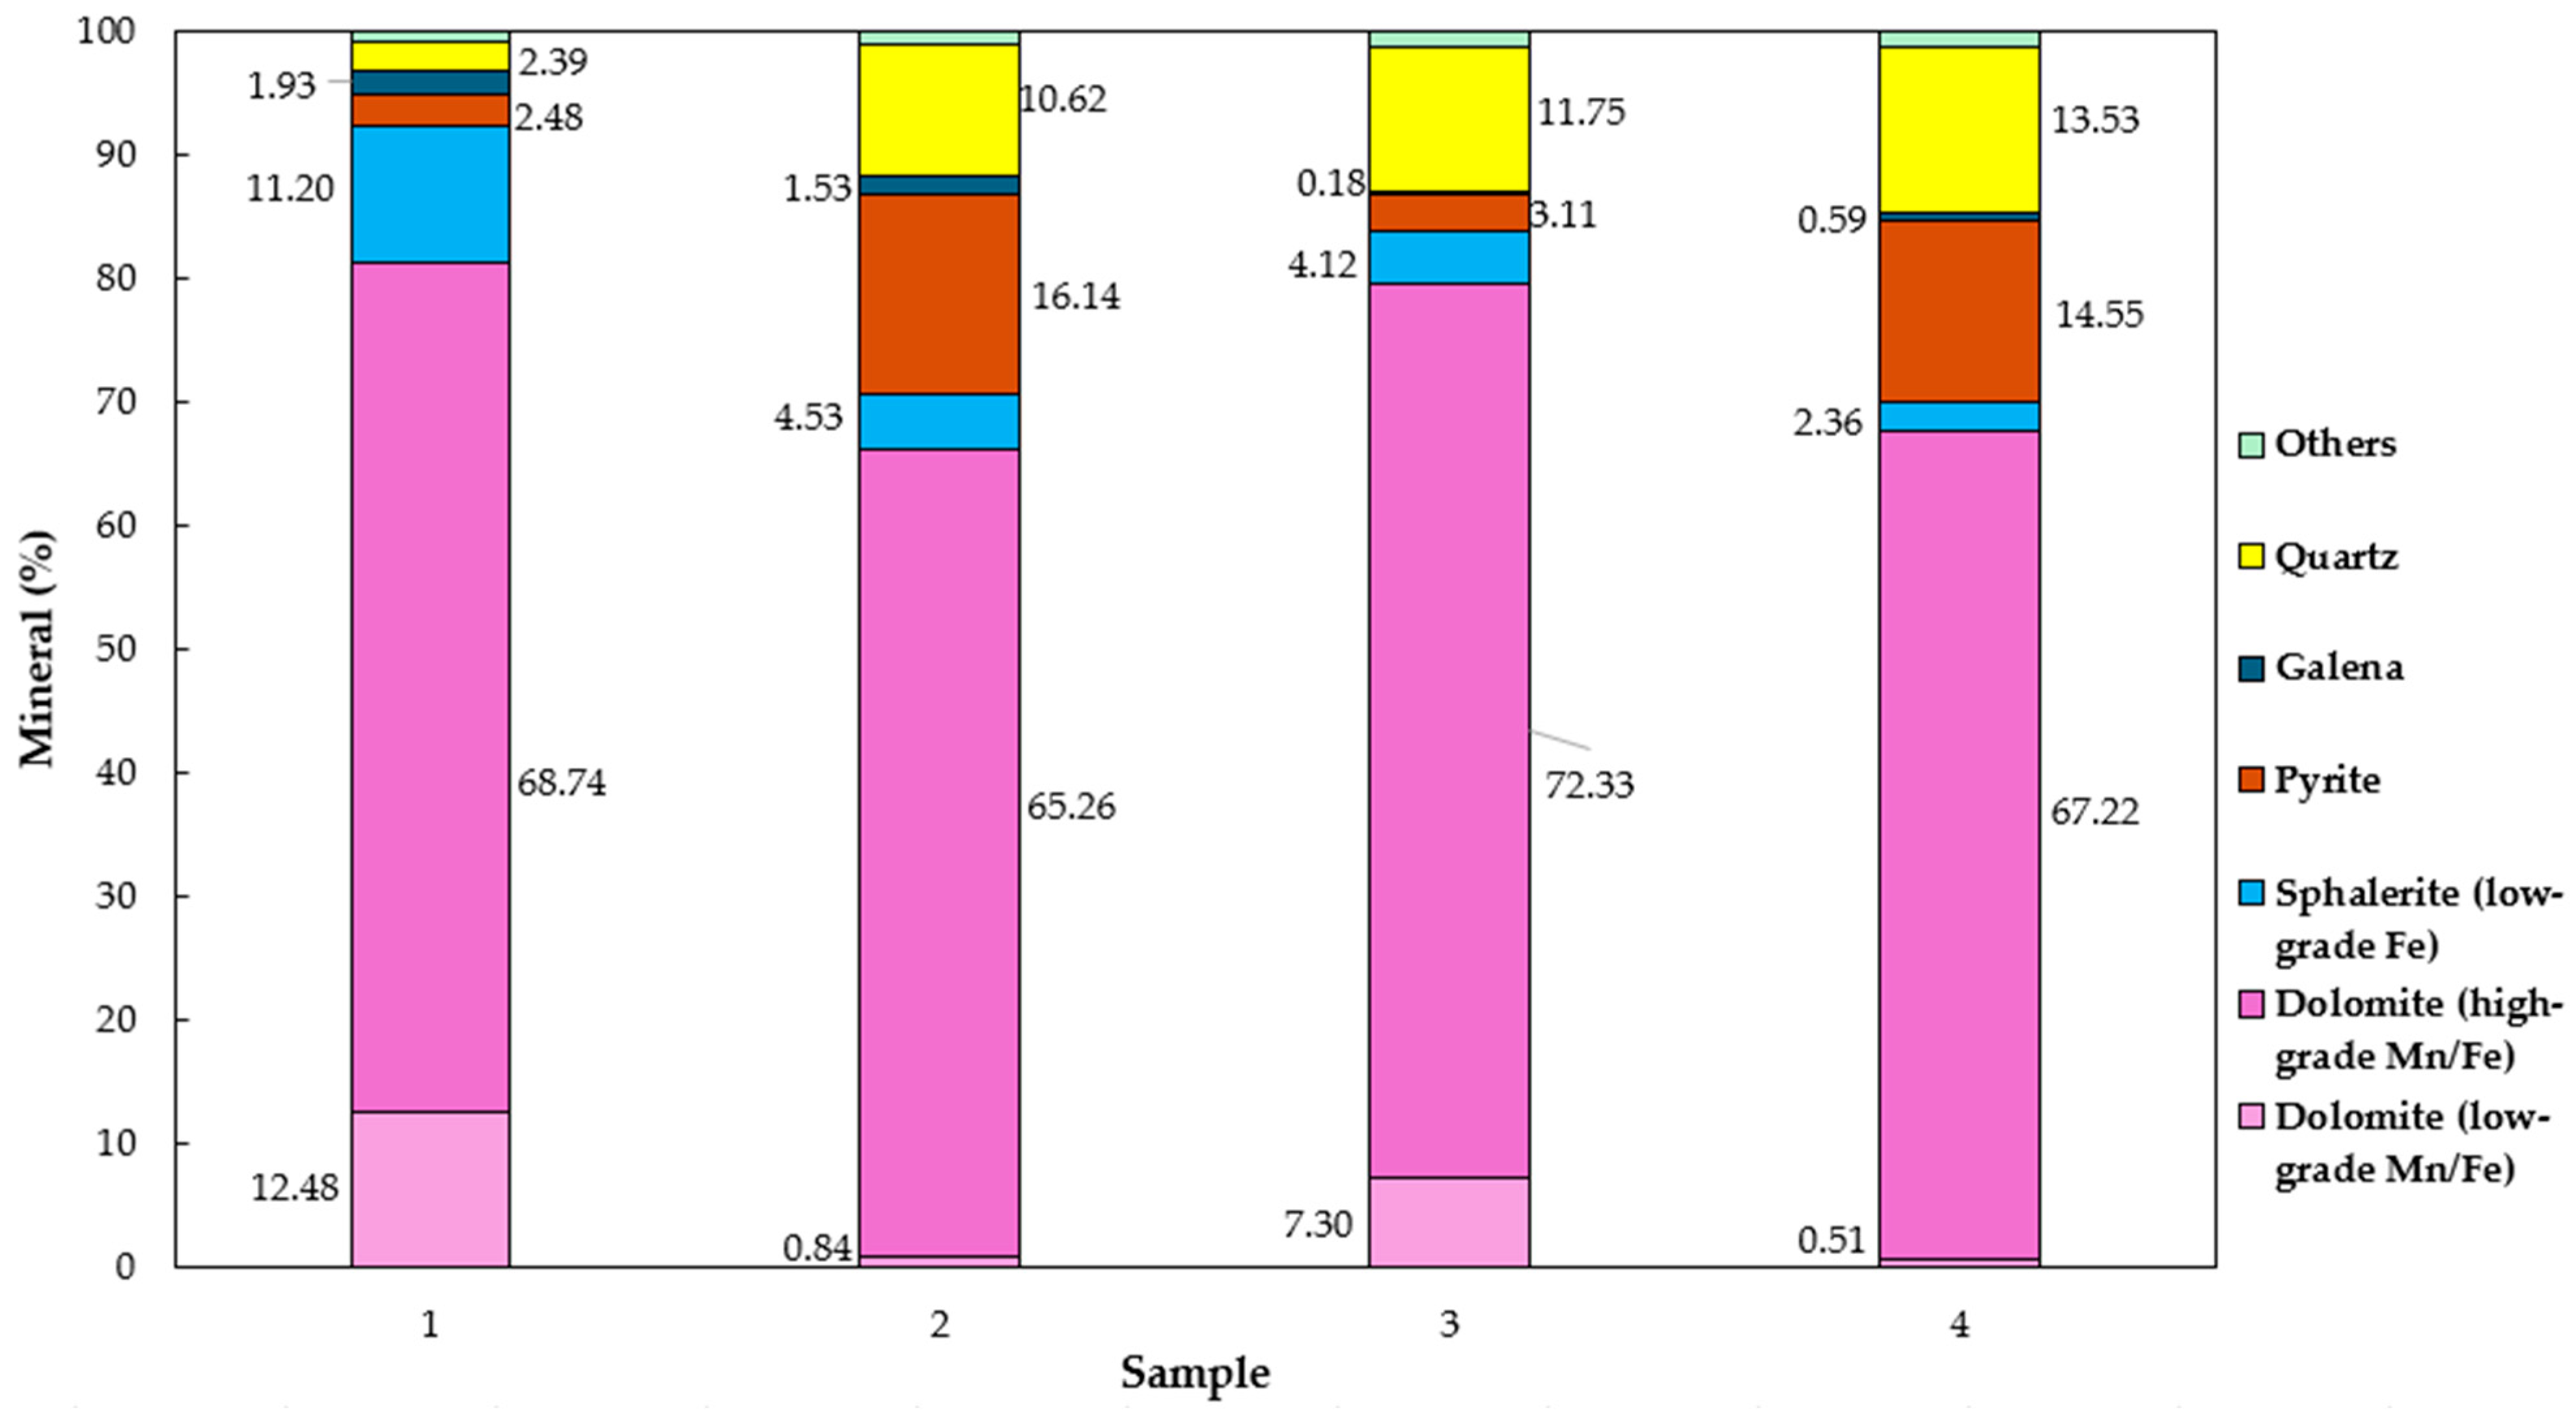
The proposed geometallurgical characterization includes a mineralogical analysis of the composite samples using MLA.
Figure 3 illustrates the modal distribution of the main minerals present in the four mining fronts. Quartz is observed in the samples from mineralized bodies B and C, with average contents of approximately 11% and 12% for ore body B and 14% for ore body C. For ore body A, quartz was also identified, with an average content of approximately 2%.
To quantify the mineralogical association of the composites, this study categorized them into four subgroups that assess the surface exposure of the sulfide particles in the mineralized bodies.
Table 7 presents the classification ranges of exposure used in this study.
Based on these classifications,
Figure 4 quantifies the composites according to the subgroups of particle surface exposure. The data presented shows that sulfide minerals are predominantly in liberated form, with the exception of mining front 2, which has a large number of encapsulated particles—49% of sphalerite, 84% of galena, and 58% of pyrite. This suggests that the surfaces of these particles are partially or fully exposed to the sizes that feed the flotation process.
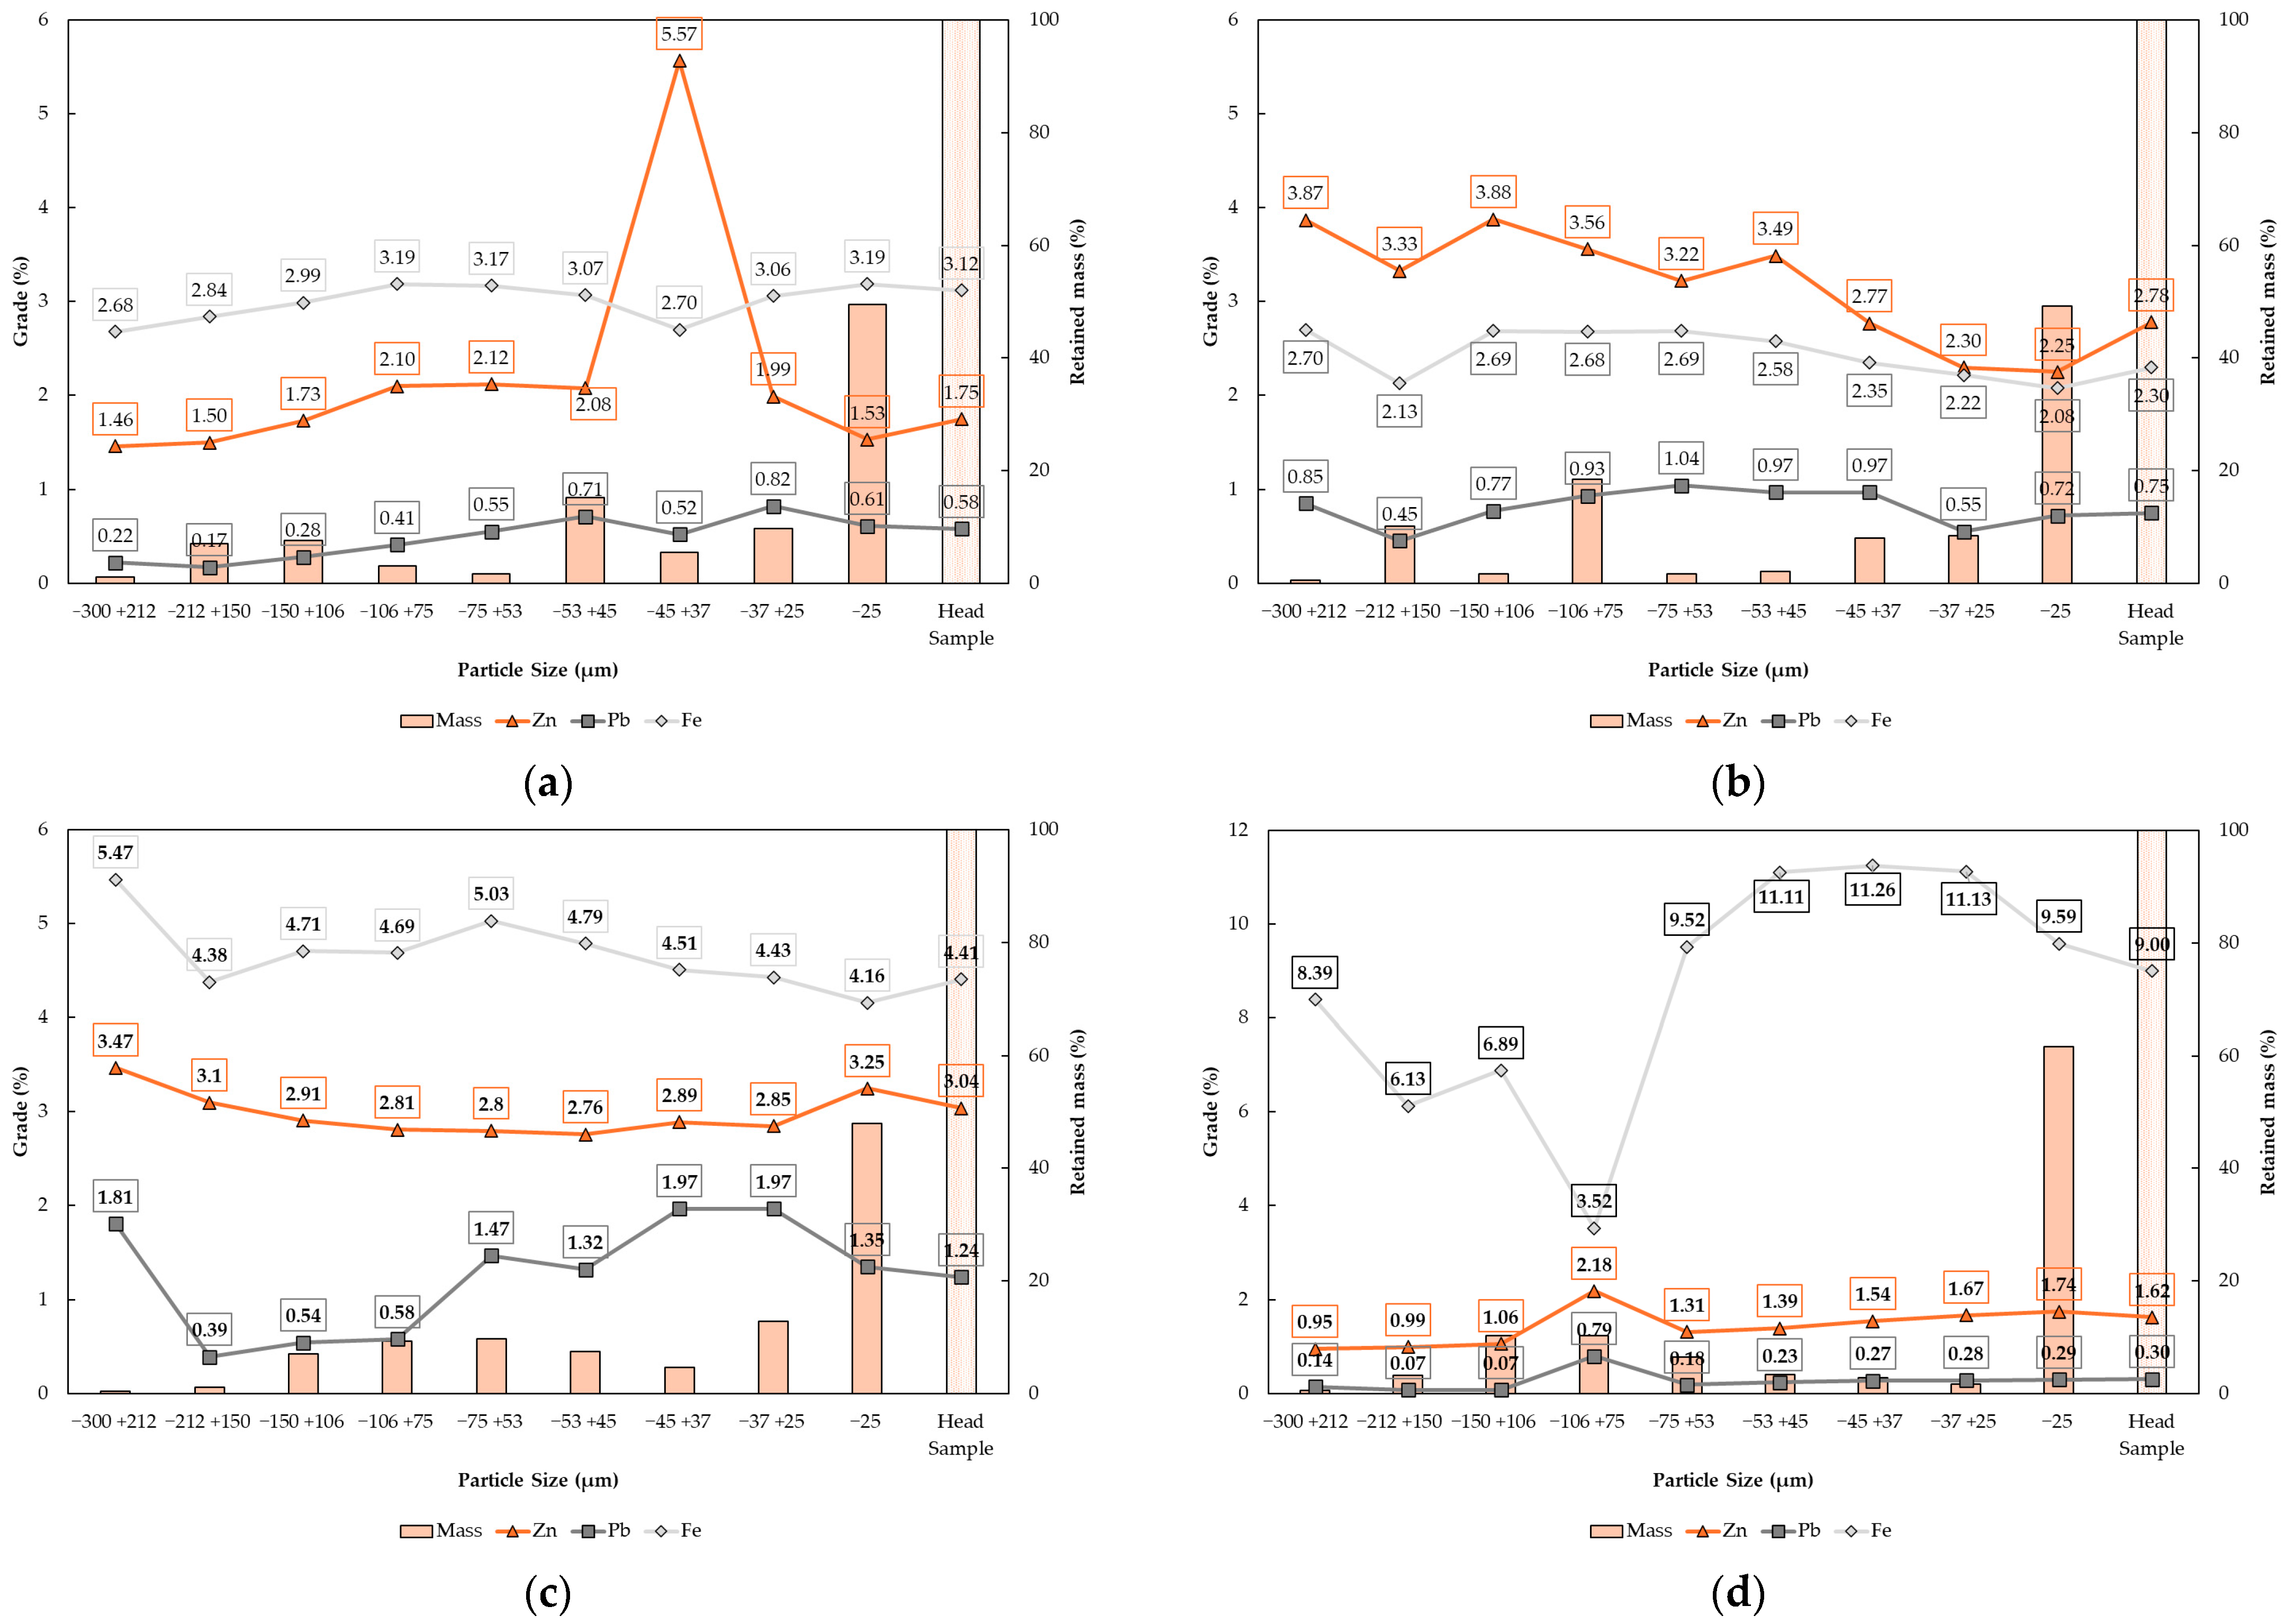
Figure 5 presents the size and chemical results of the grinding products per mining front. The results showed that, for all mining fronts, the highest mass percentage in the grinding products is found in the particle size range below 25 µm, representing approximately 50% of the total flotation feed. Distinct preferential distribution ranges for Pb, Zn, and Fe sulfide minerals were observed in each composite sample, even though all samples were subjected to the same grinding conditions targeting a P
80 of 45 µm. This highlights the necessity of the proposed study for the geometallurgical characterization of these mining regions under investigation. It is worth noting that samples from mining fronts 1 and 4 presented outlier results, suggesting potential errors in the assay determinations for the −45 + 37 µm Zn fraction in mining front 1 and the −106 + 75 µm Fe fraction in mining front 4. However, these anomalous data points did not affect the overall interpretation of the geochemical distribution by size fractions and were not used to support any specific conclusions in this study.
Figure 6 presents the results of the bench-scale flotation tests per mining front. The mass balance of the tests, the overall metallurgical recovery of the Pb and Zn circuit, and the metallurgical recovery per flotation stage were the parameters selected for the comparison and evaluation of the flotation performance of each composite sample.
The MLA characterization generated electron microscope images of the particles from the samples in this study at a millimeter scale, allowing for the identification of the main mineral associations in the mineralized bodies.
Figure 7,
Figure 9,
Figure 11 and
Figure 13 present a compilation of these images for mining fronts 1 to 4, respectively. The analyses were performed on the flotation feed, Rougher Pb concentrate, Cleaner Zn concentrate, and the final tailings.
Figure 8,
Figure 10,
Figure 12 and
Figure 14 present a modal mineralogy for these flows at mining fronts 1 to 4, respectively.
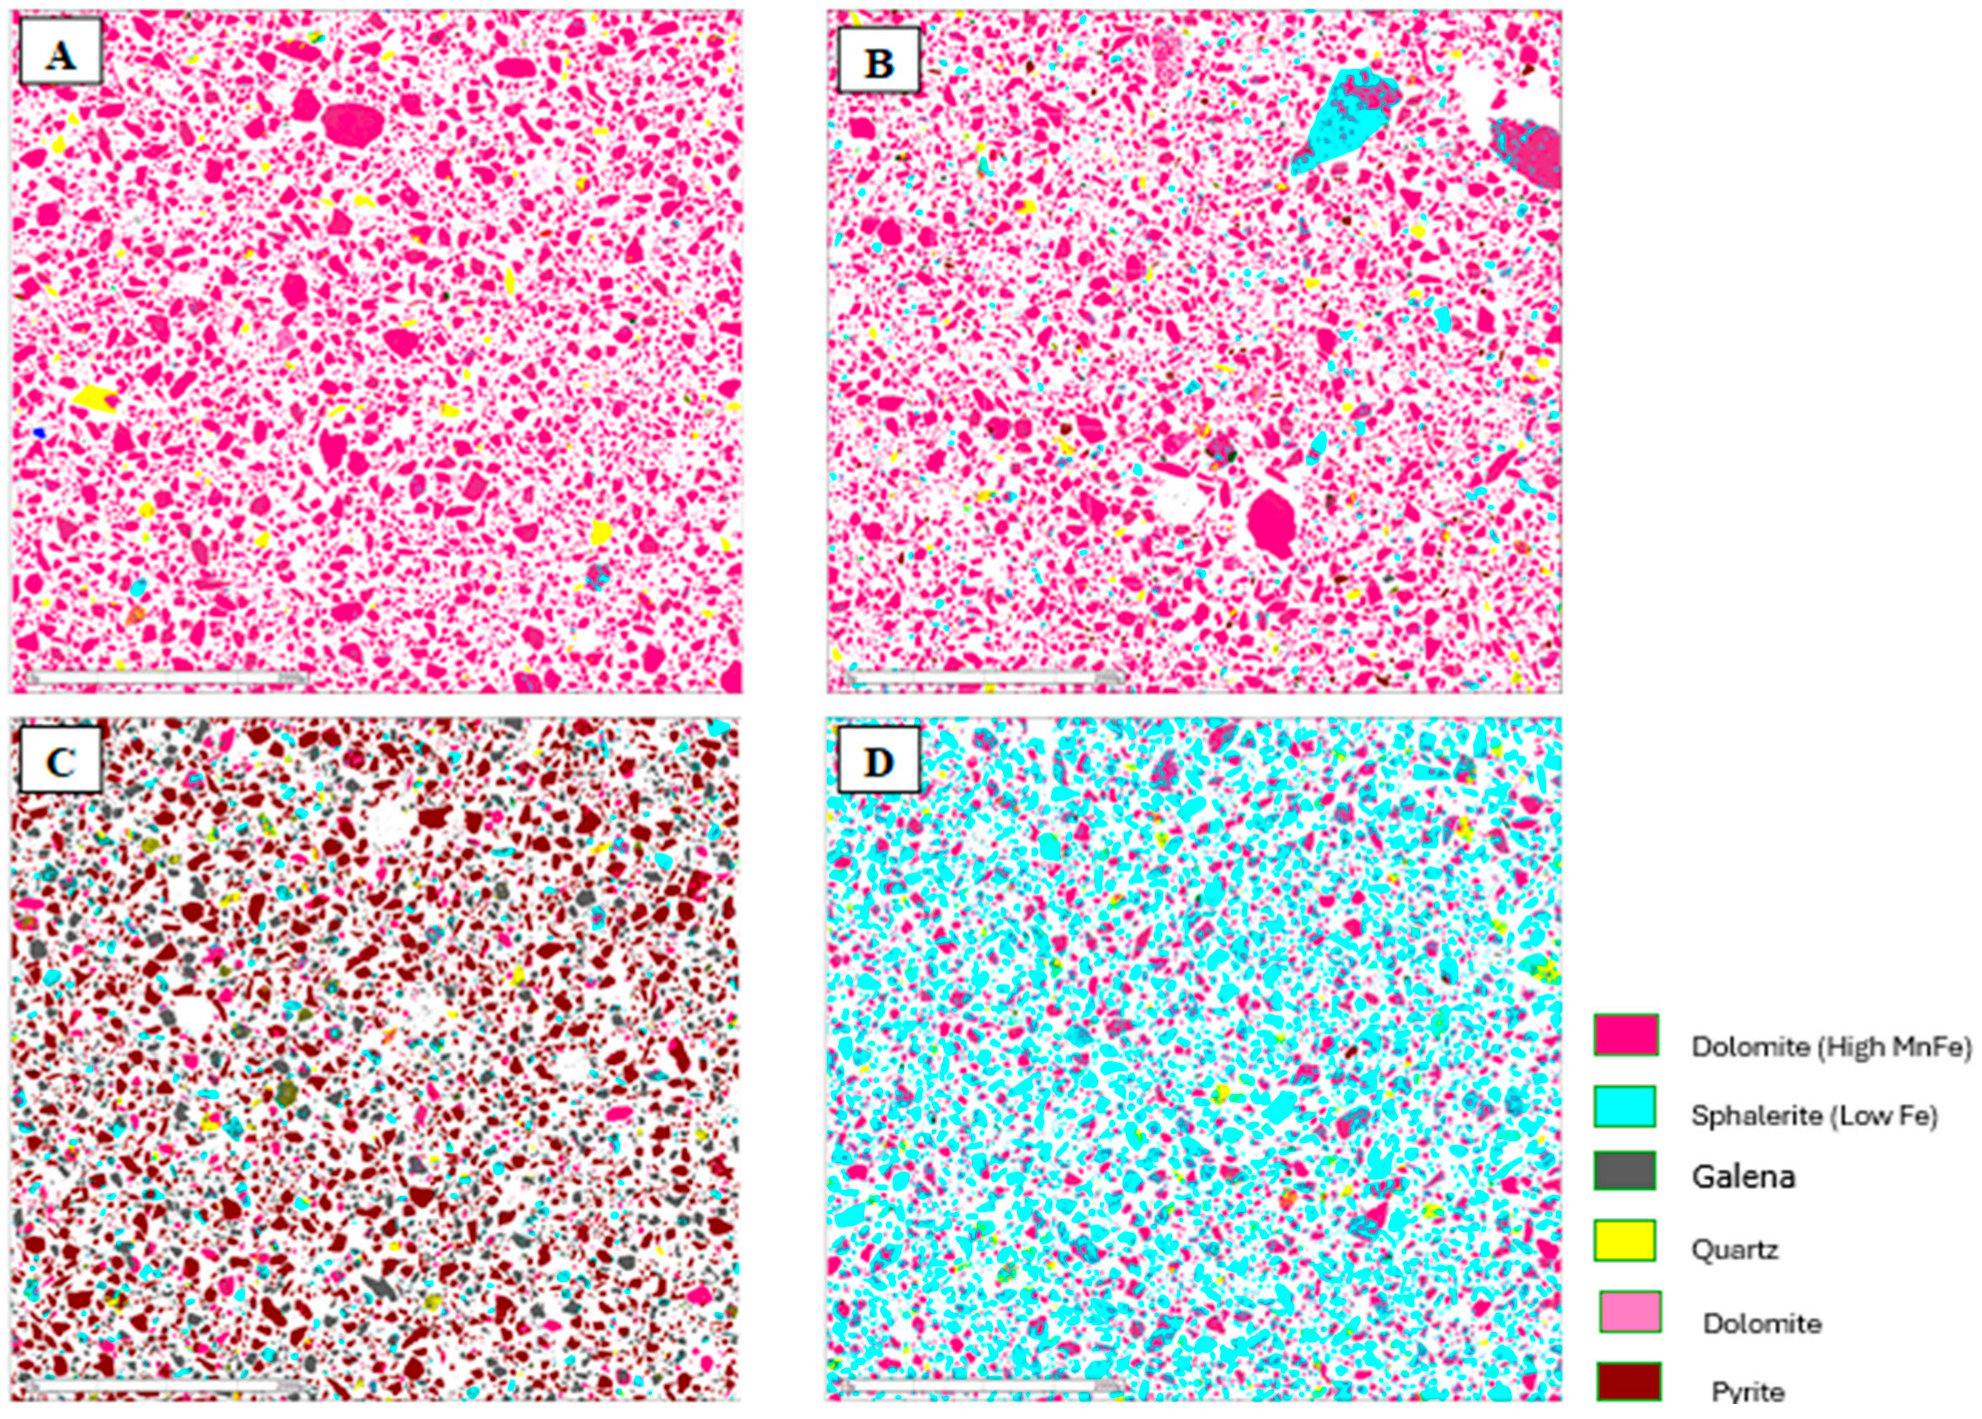
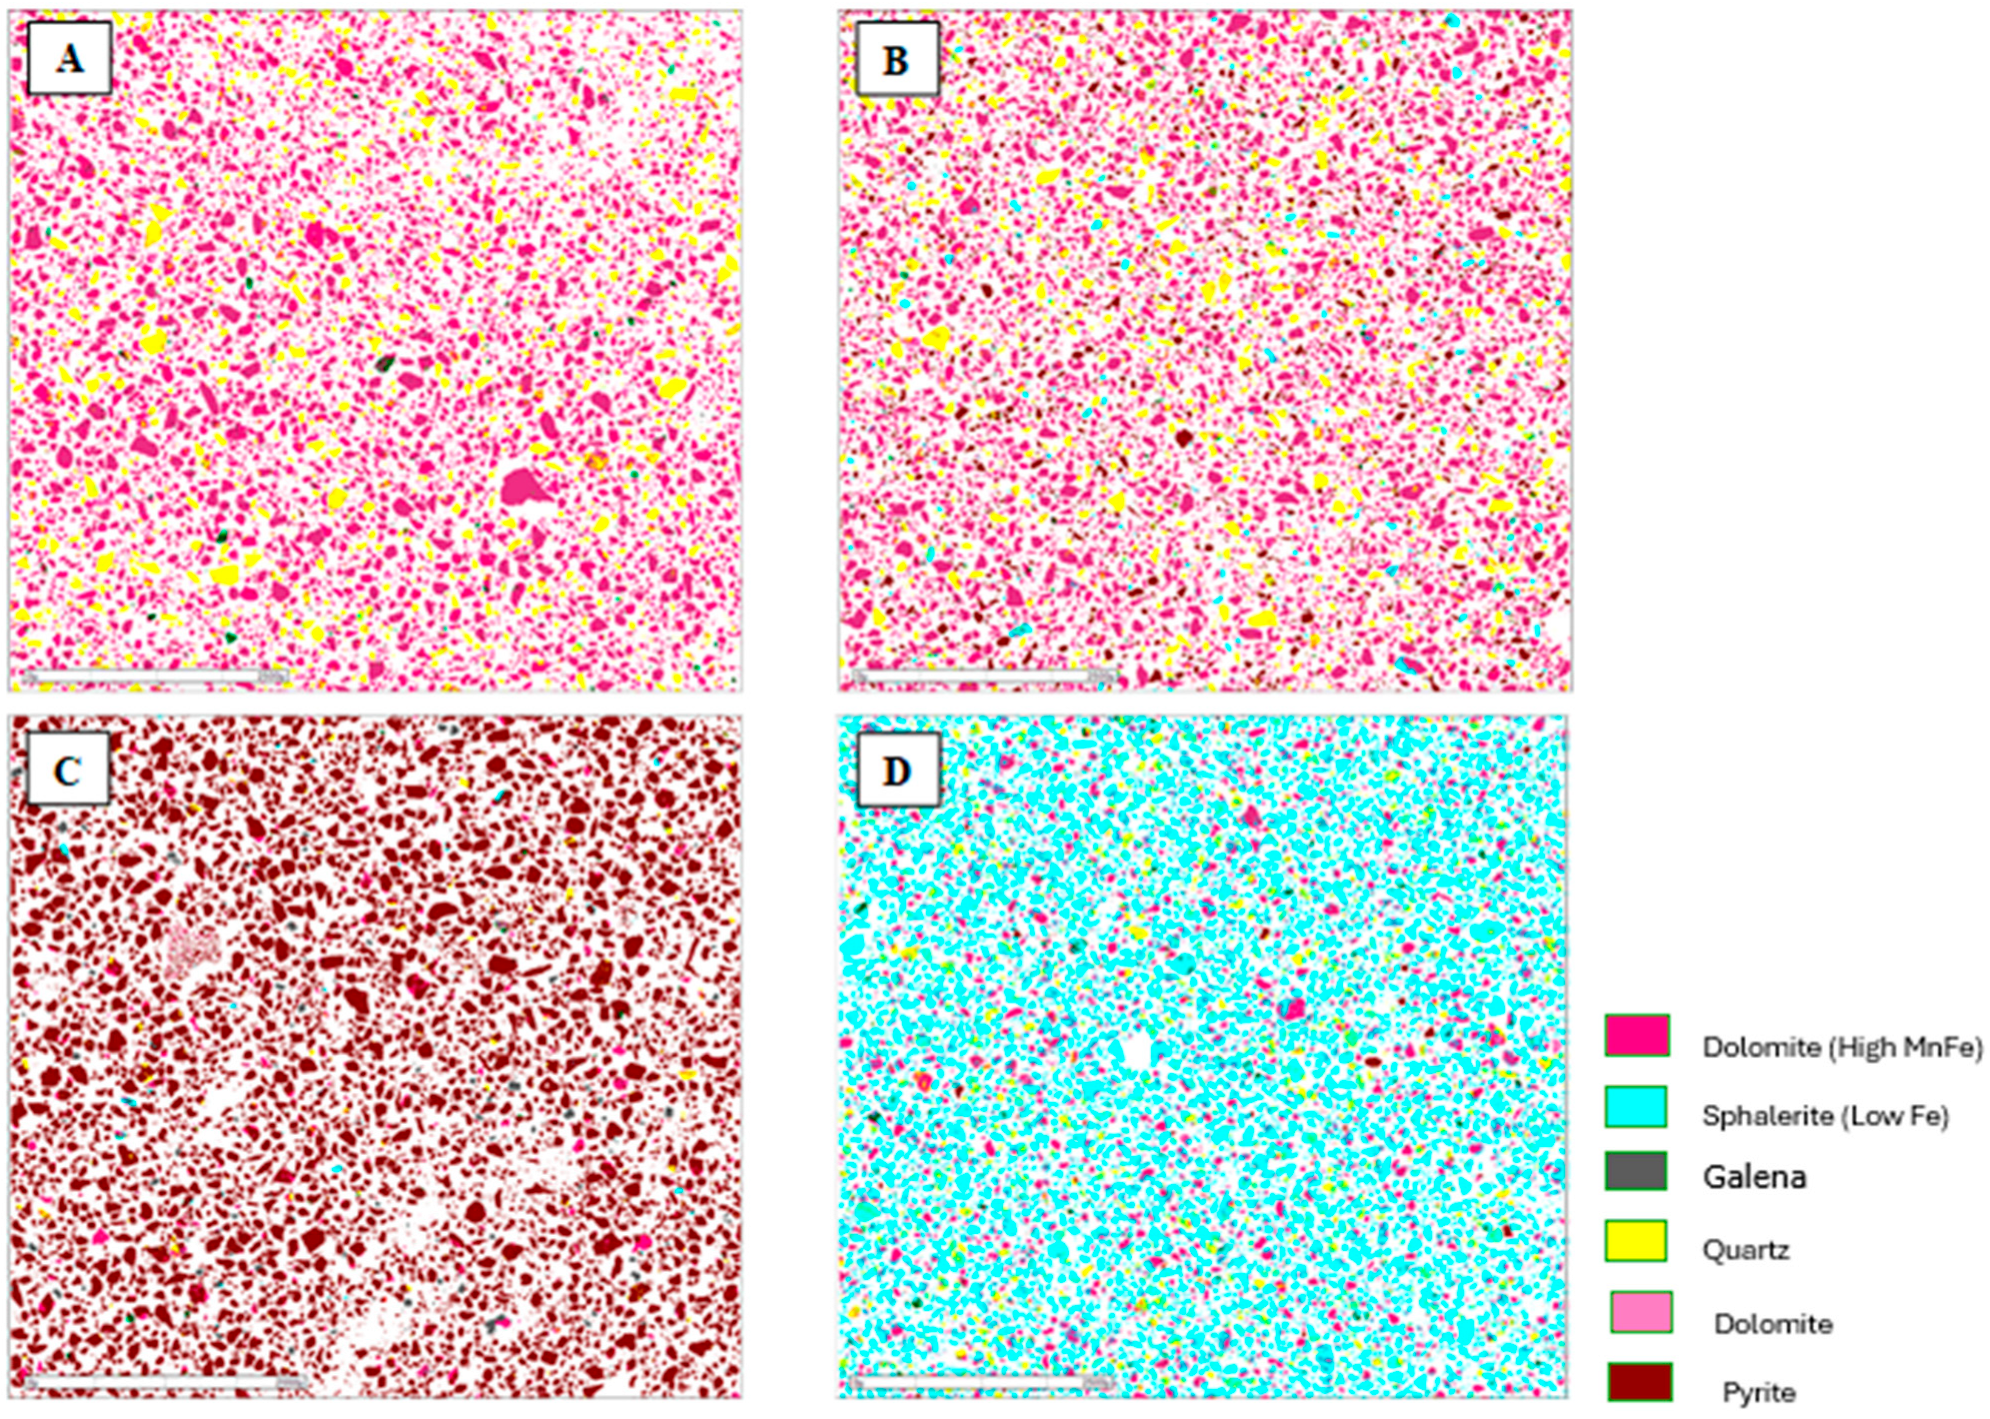
Figure 7.
Mineralogical characterization of the flotation products from the composite sample of mining front 1: (A) final tailings; (B) flotation feed; (C) Rougher Pb concentrate; and (D) Cleaner Zn concentrate.
Figure 7.
Mineralogical characterization of the flotation products from the composite sample of mining front 1: (A) final tailings; (B) flotation feed; (C) Rougher Pb concentrate; and (D) Cleaner Zn concentrate.
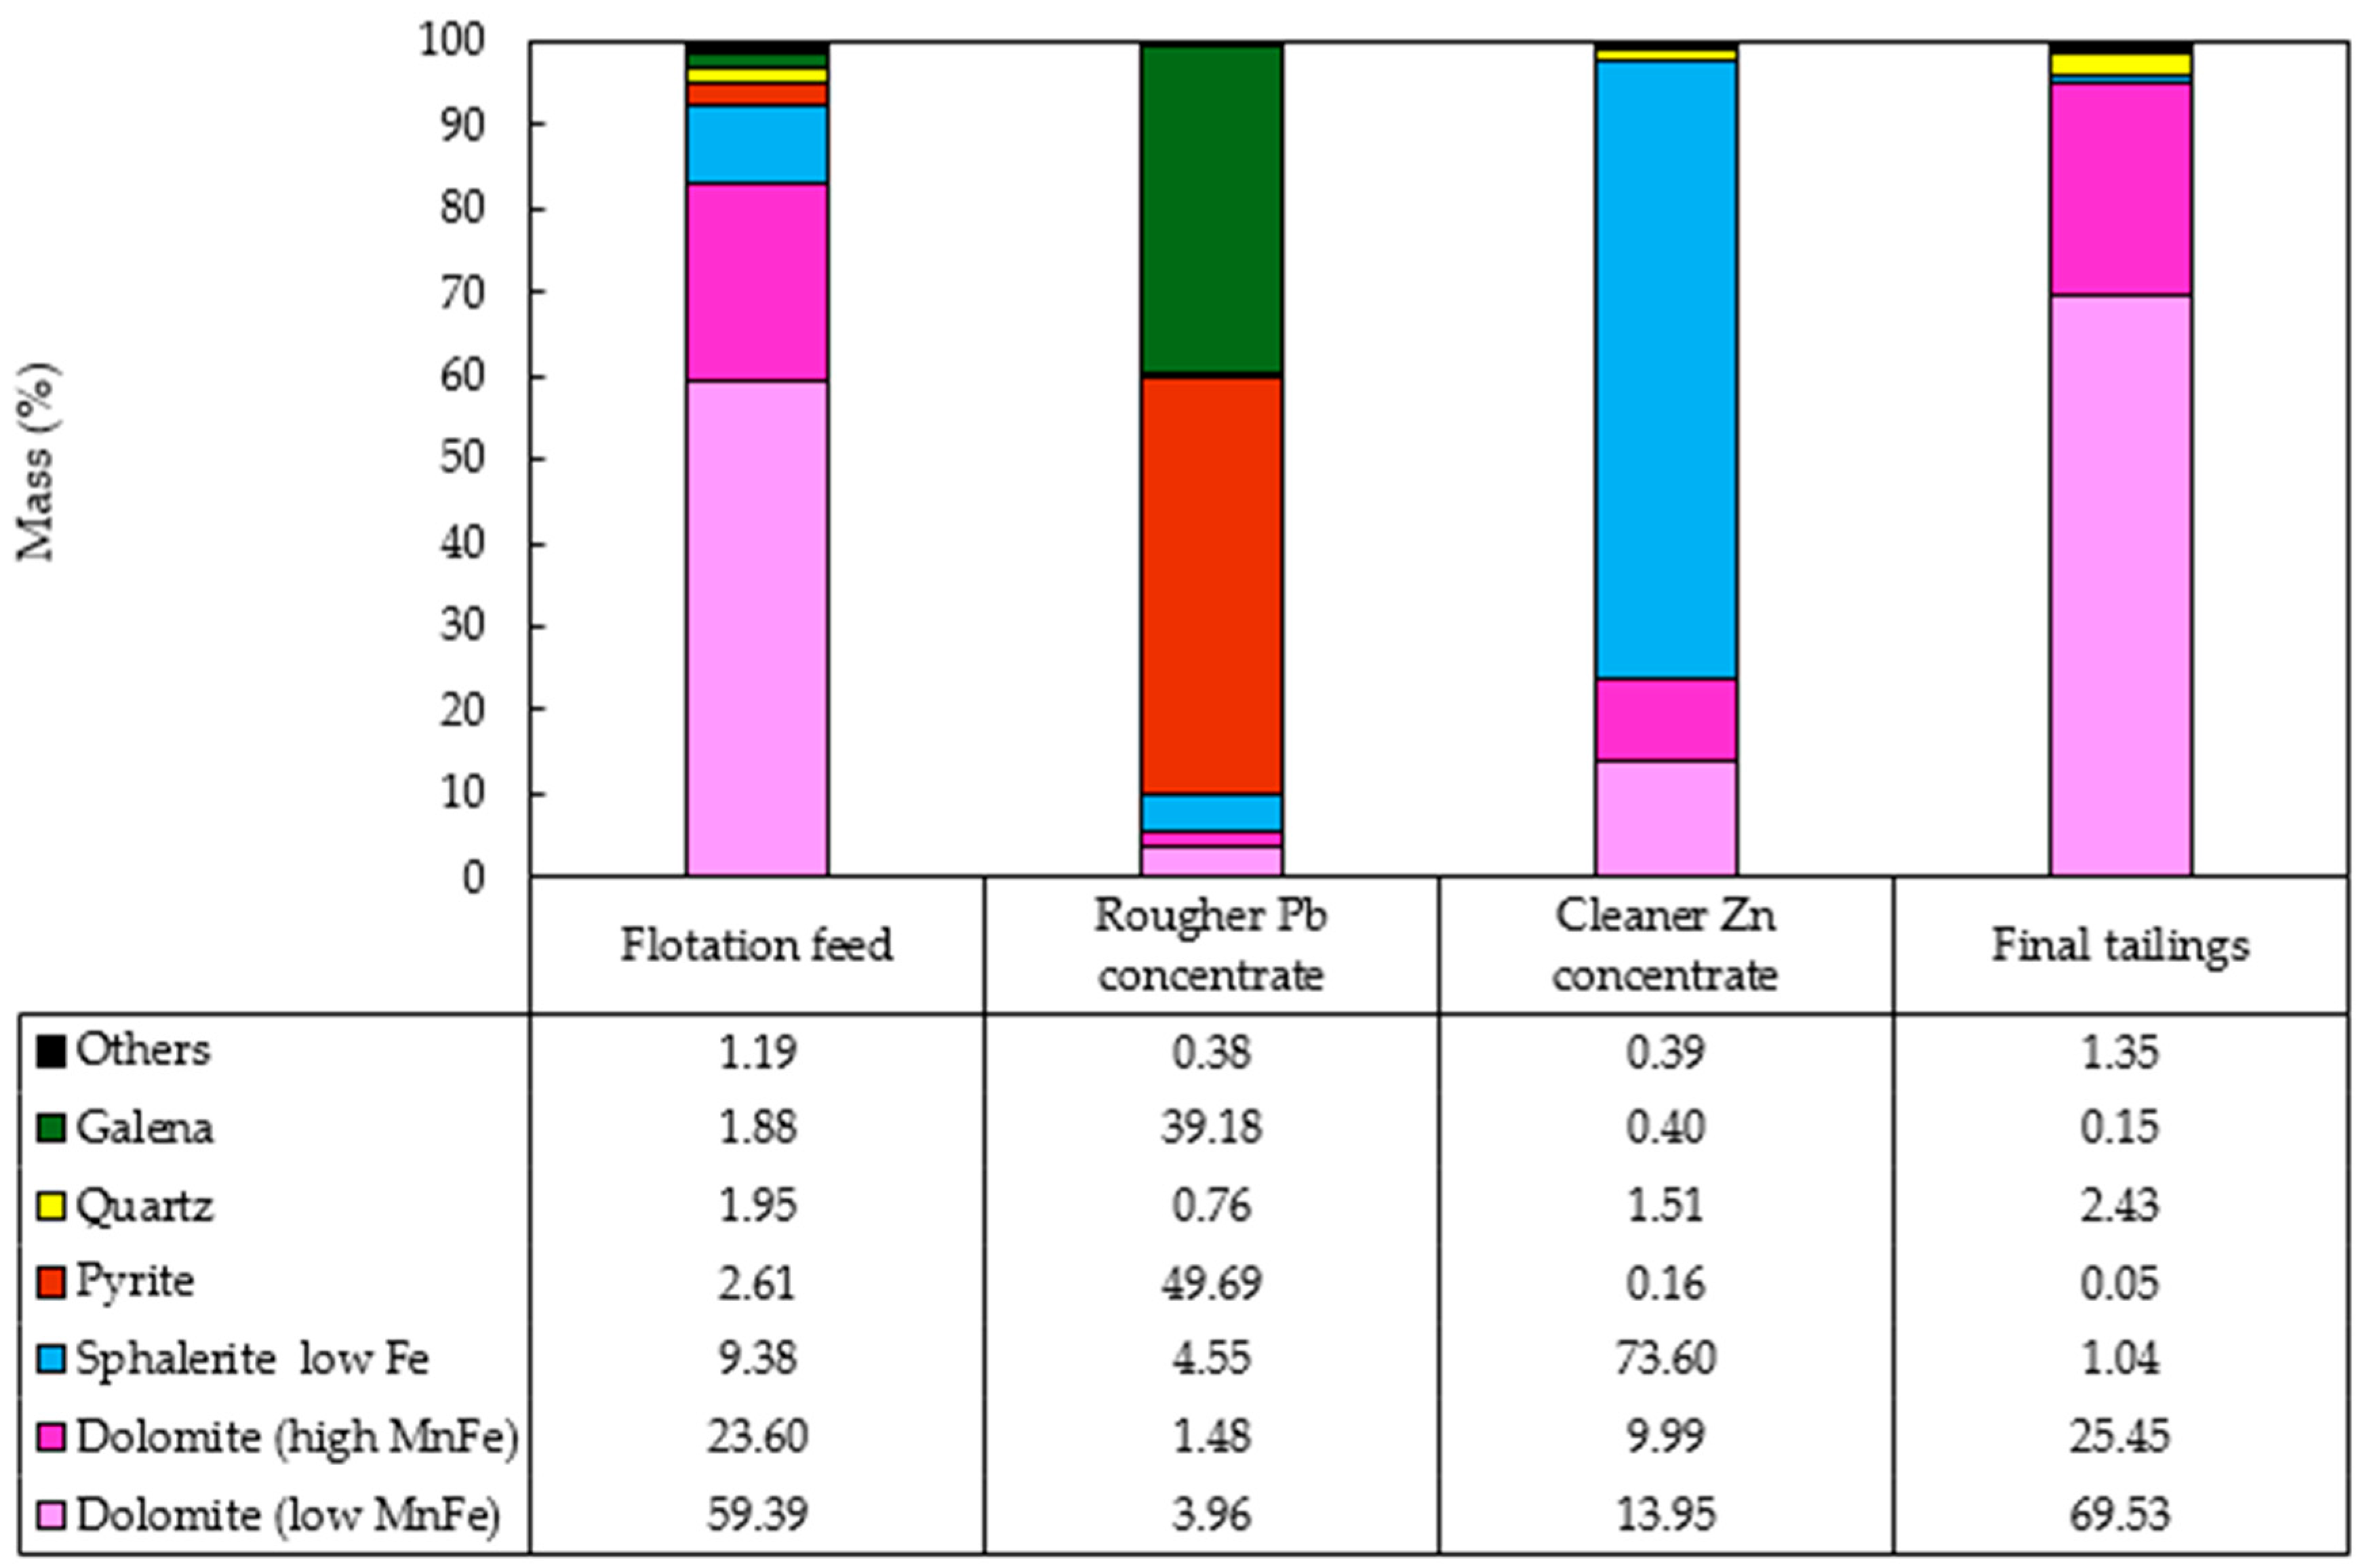
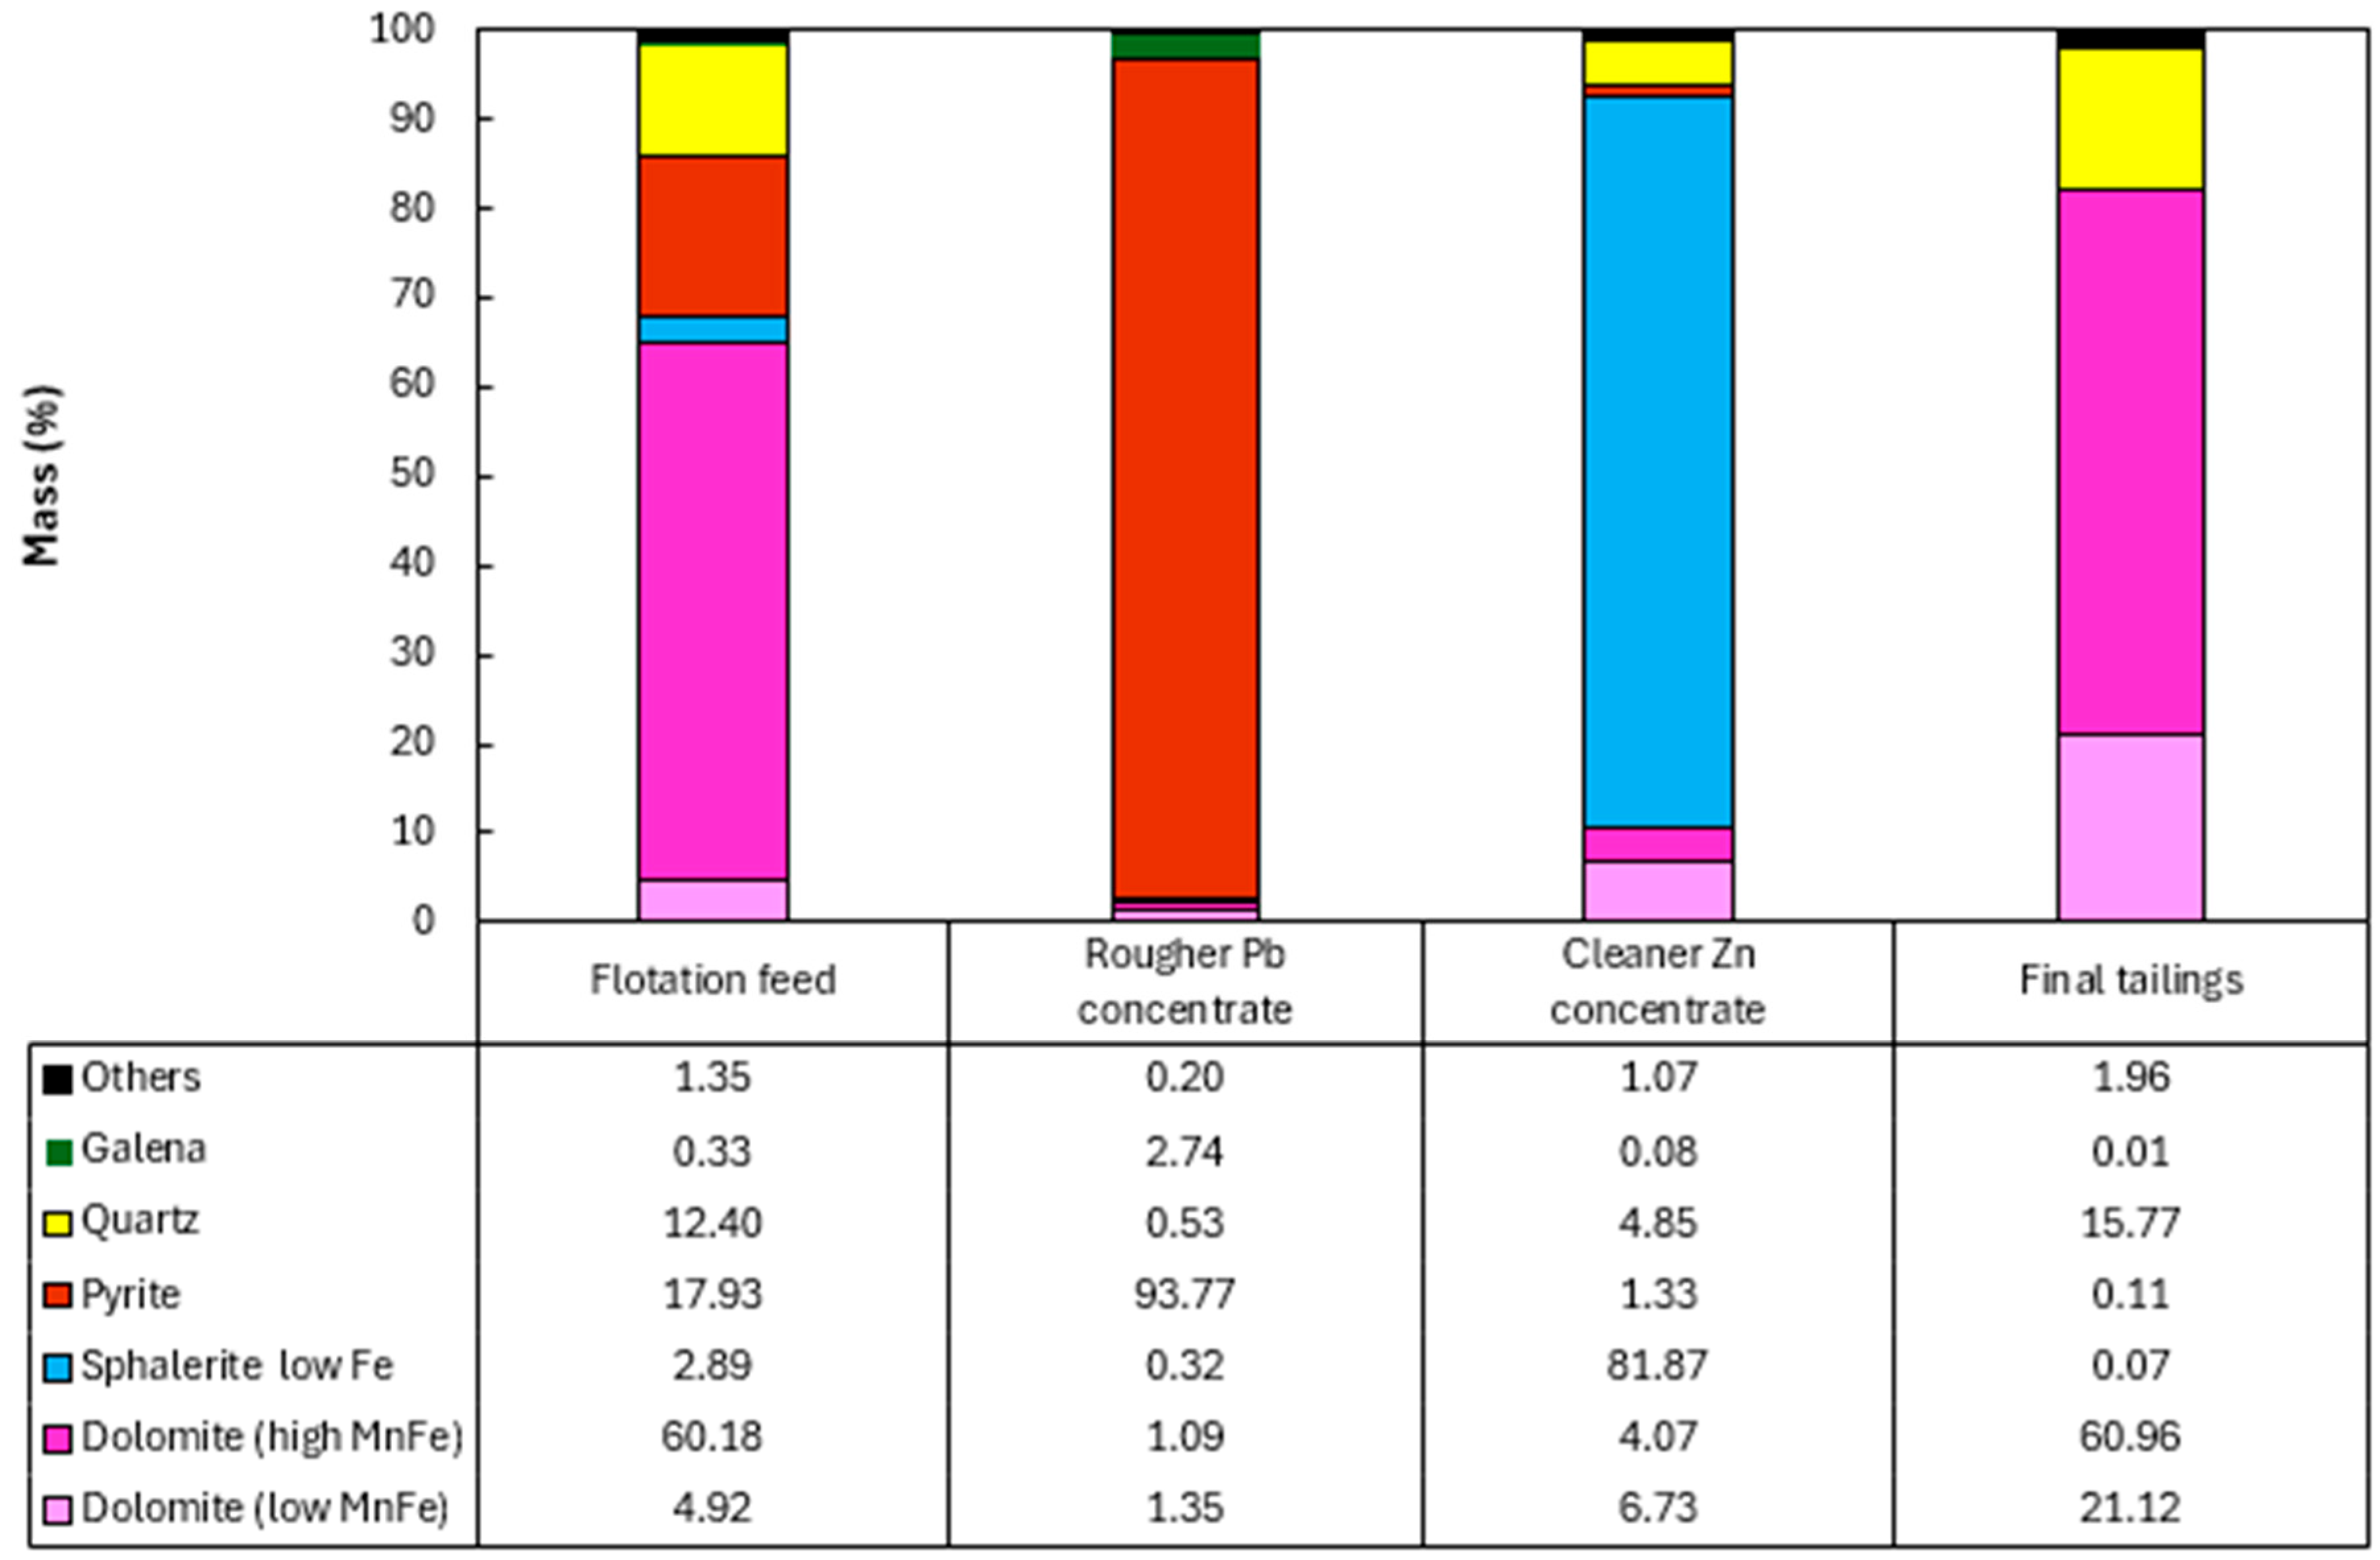
Figure 8.
Modal mineralogy of the flotation products from the composite sample of mining front 1.
Figure 8.
Modal mineralogy of the flotation products from the composite sample of mining front 1.
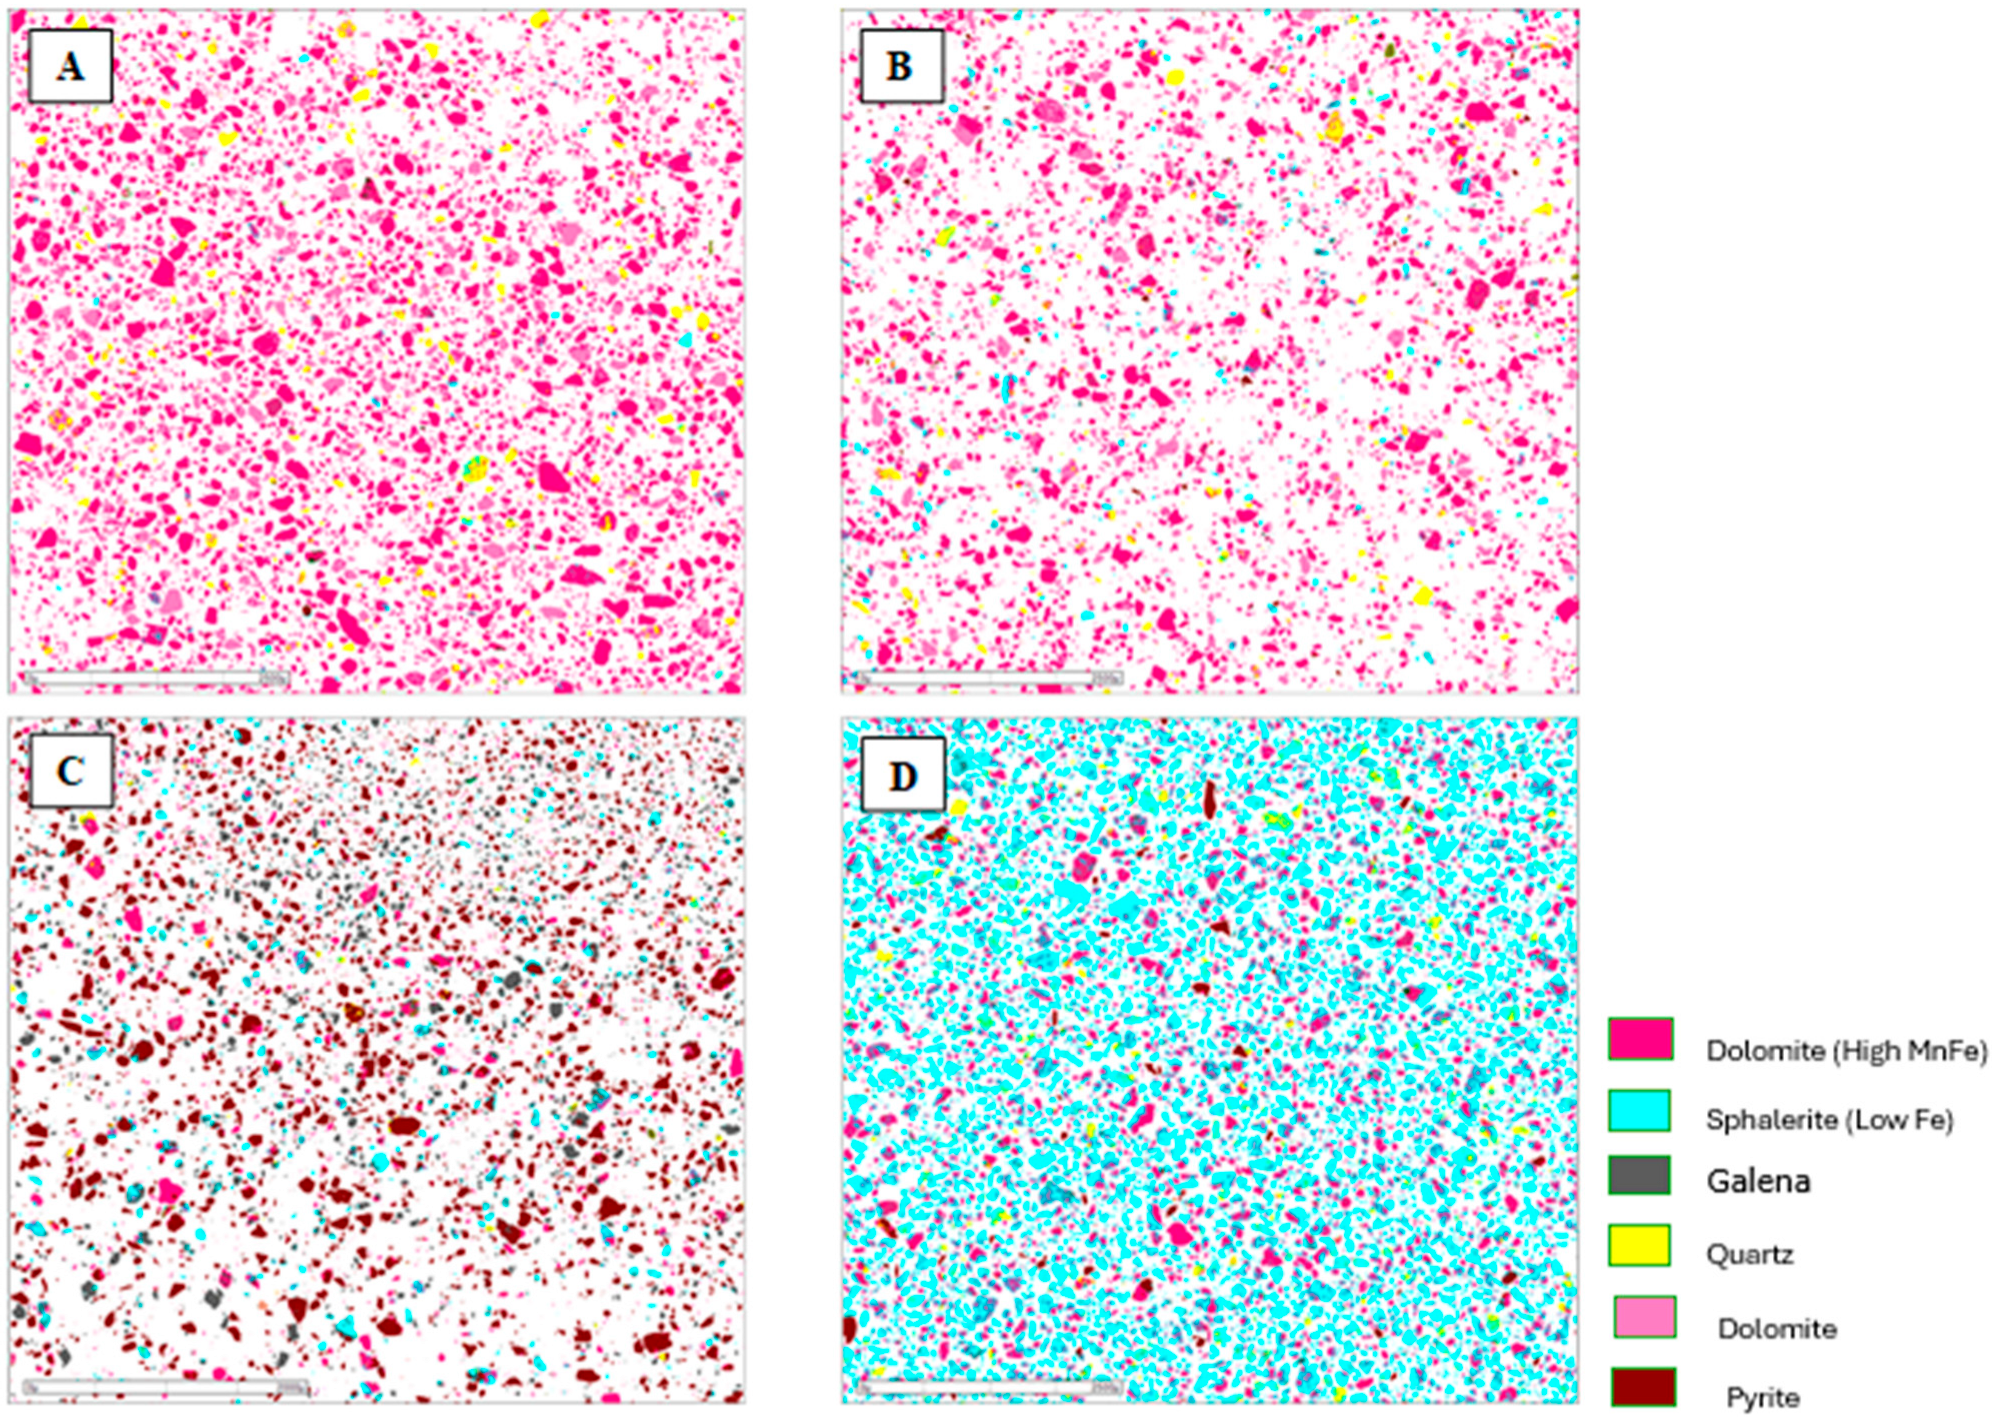
Figure 9.
Mineralogical characterization of the flotation products from the composite sample of mining front 2: (A) final tailings; (B) flotation feed; (C) Rougher Pb concentrate; and (D) Cleaner Zn concentrate.
Figure 9.
Mineralogical characterization of the flotation products from the composite sample of mining front 2: (A) final tailings; (B) flotation feed; (C) Rougher Pb concentrate; and (D) Cleaner Zn concentrate.
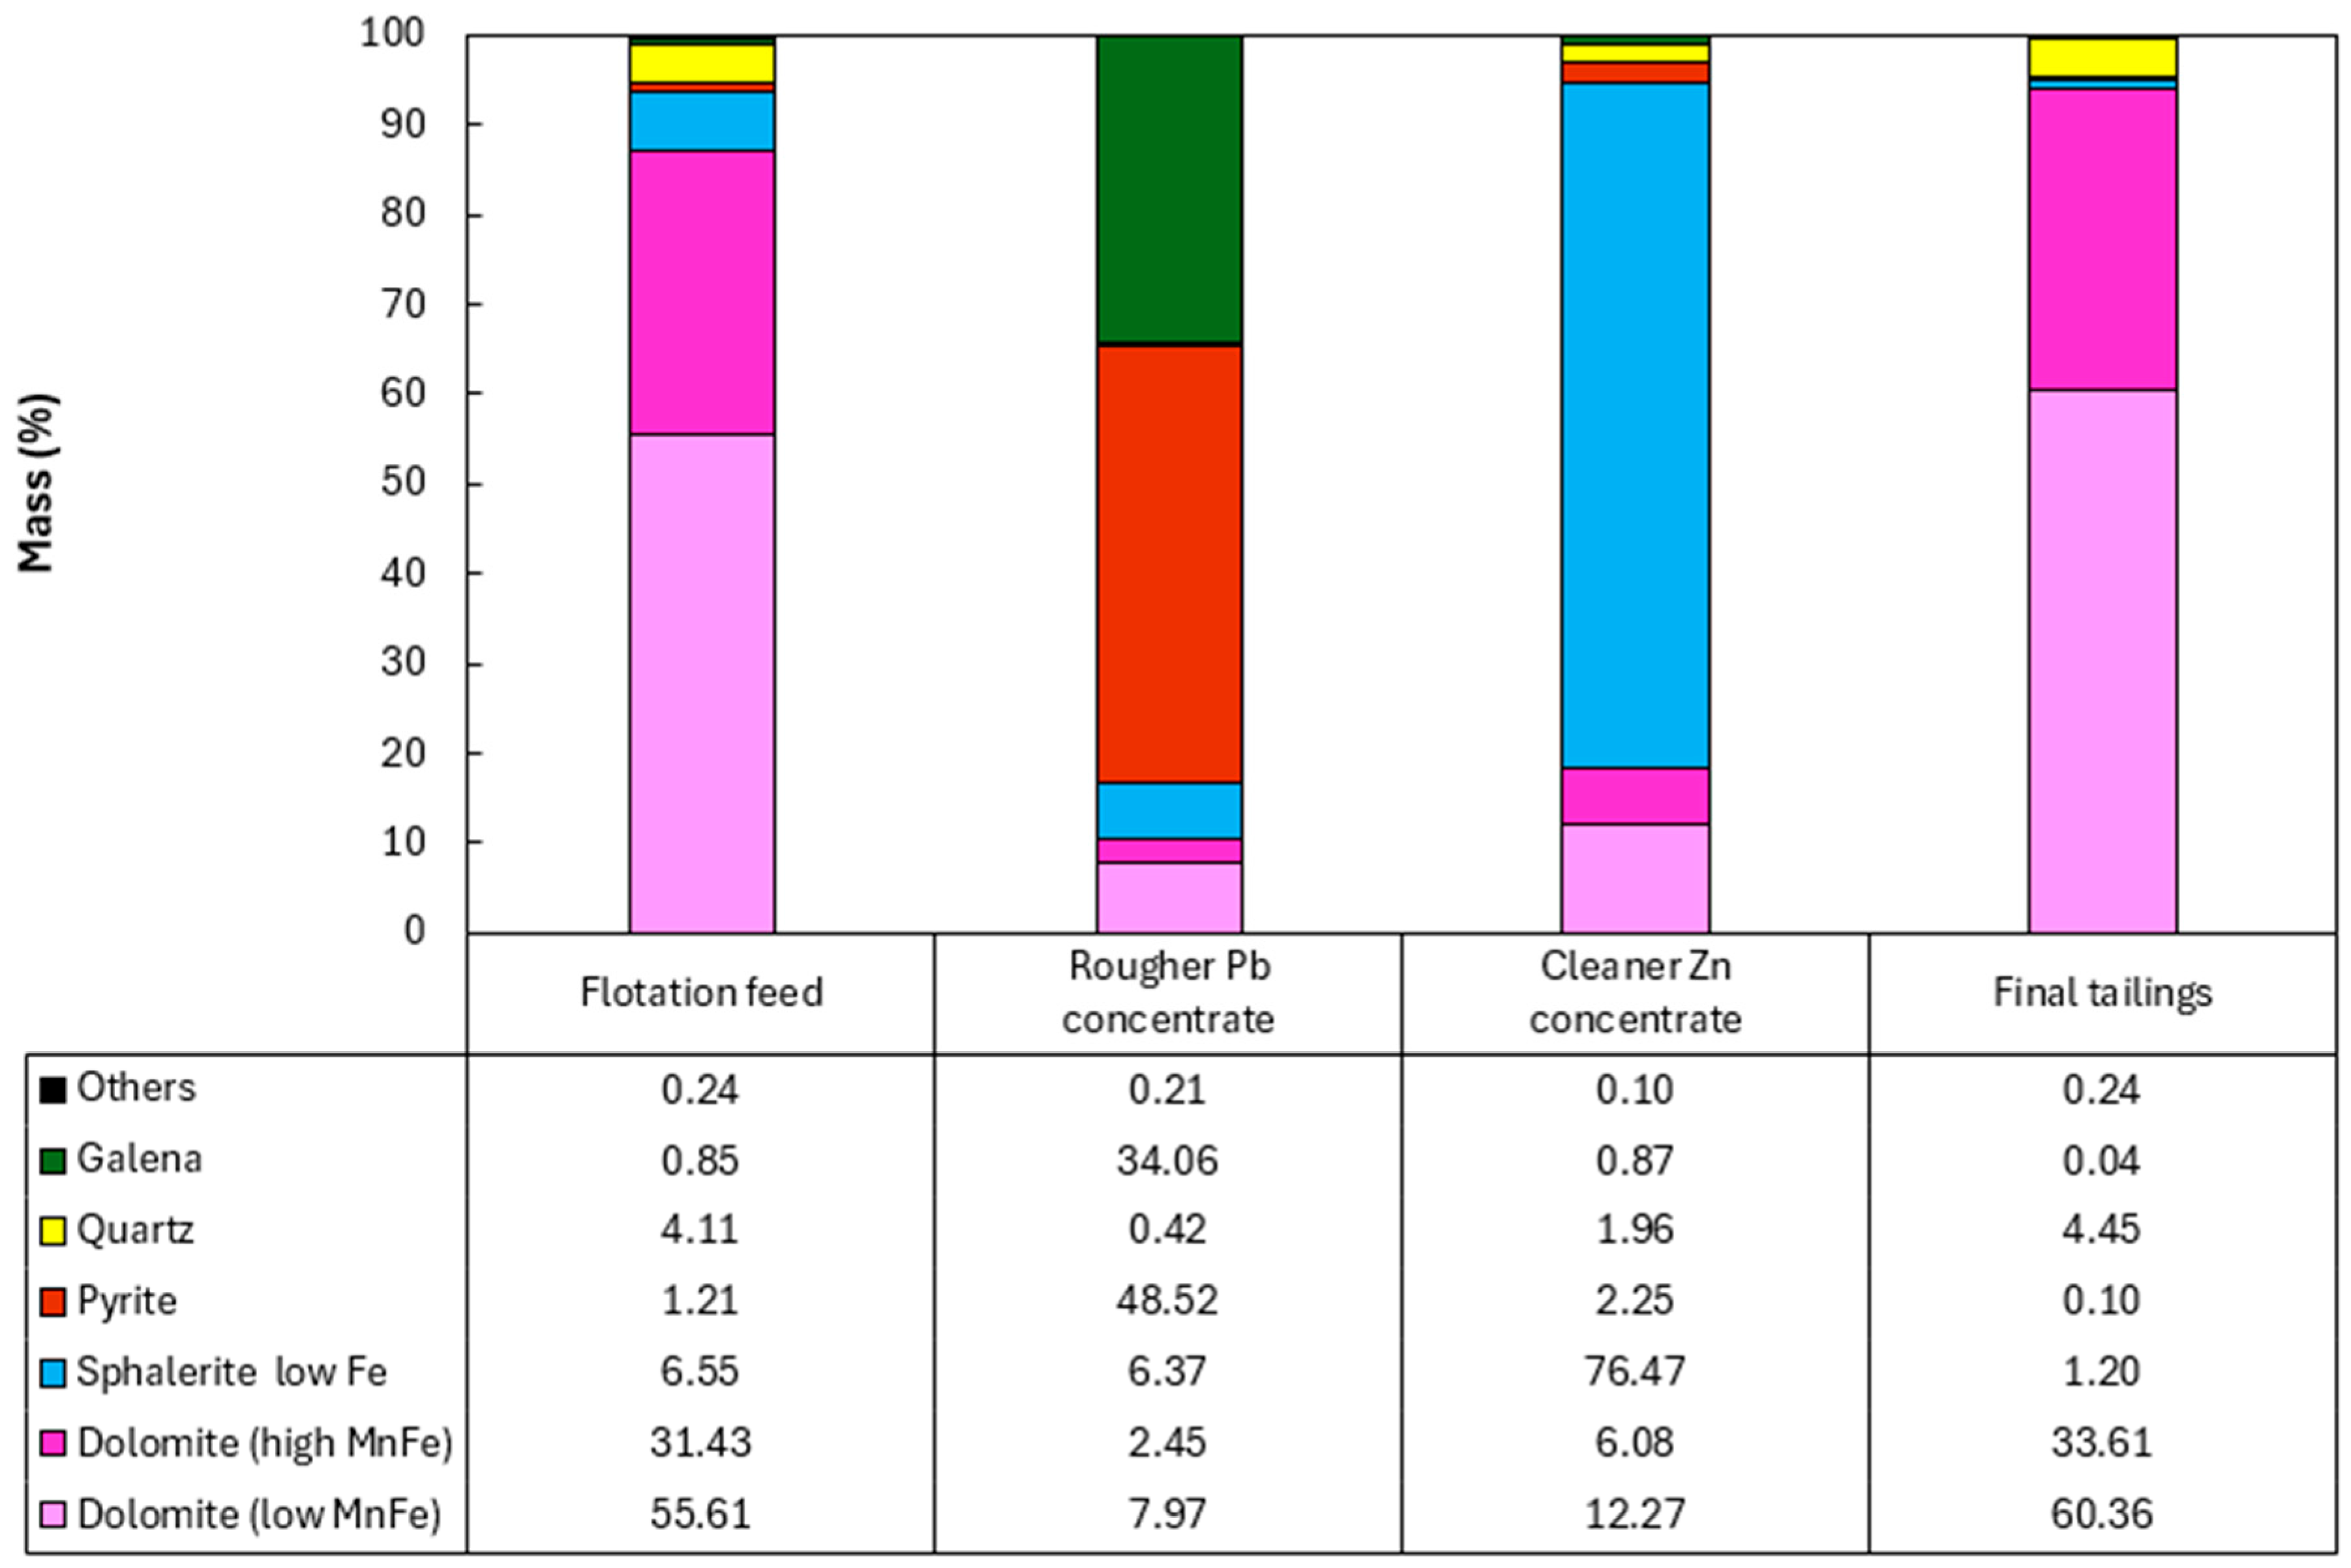
Figure 10.
Modal mineralogy of the flotation products from the composite sample of mining front 2.
Figure 10.
Modal mineralogy of the flotation products from the composite sample of mining front 2.
Figure 11.
Mineralogical characterization of the flotation products from the composite sample of mining front 3: (A) final tailings; (B) flotation feed; (C) Rougher Pb concentrate; and (D) Cleaner Zn concentrate.
Figure 11.
Mineralogical characterization of the flotation products from the composite sample of mining front 3: (A) final tailings; (B) flotation feed; (C) Rougher Pb concentrate; and (D) Cleaner Zn concentrate.
Figure 12.
Modal mineralogy of the flotation products from the composite sample of mining front 3.
Figure 12.
Modal mineralogy of the flotation products from the composite sample of mining front 3.
Figure 13.
Mineralogical characterization of the flotation products from the composite sample of mining front 4: (A) final tailings; (B) flotation feed; (C) Rougher Pb concentrate; and (D) Cleaner Zn concentrate.
Figure 13.
Mineralogical characterization of the flotation products from the composite sample of mining front 4: (A) final tailings; (B) flotation feed; (C) Rougher Pb concentrate; and (D) Cleaner Zn concentrate.
Figure 14.
Modal mineralogy of the flotation products from the composite sample of mining front 4.
Figure 14.
Modal mineralogy of the flotation products from the composite sample of mining front 4.
The results obtained showed the presence of pyrite in the Rougher Pb concentrate in all the tests, ranging from 48.52% (mining front 2) to 93.77% (mining front 4). This phenomenon occurs due to the flotation pH range in the Pb circuit, which, through electrochemical surface interactions, prevents the PAX collector from being sufficiently selective to adsorb only galena particles from the slurry, also capturing pyrite particles. The B mineralized body, representing the samples from mining fronts 2 and 3, showed mineralogical associations between galena and sphalerite at P80 = 45 µm. This highlights an opportunity to utilize a regrind circuit to achieve the ideal liberation grade of these minerals in the B mineralized body.
The C mineralized body, representing the samples from mining front 3, had a high percentage of liberated pyrite in the Rougher Pb concentrate. This same sample showed the highest overall Pb and Zn recoveries in the flotation test. This highlights an opportunity to use a pyrite depressant in this ore body to improve both the grade and selectivity of the flotation stage. The Cleaner Zn concentrate is predominantly composed of sphalerite particles, however, there is also the presence of quartz and non-liberated dolomite associated with this sulfide. The B mineralized body showed the greatest contrasts in the association between sphalerite and dolomite.
The final tailings from the tests consisted entirely of liberated dolomite and quartz particles in all the composite samples. There was no significant presence of liberated sulfide mineral particles, such as galena and sphalerite, in the tailings, which was corroborated by the modal mineralogy results.


 ,
, 


