Article

Exploring the Recovery Potential of Critical and Strategic Raw Materials from Traversella Mine (Piedmont, Italy) Waste: A Comparison of Laboratory-Scale Separation Techniques

by
Gabriele Baldassarre
*,
Camila Mori De Oliveira
,
Adriano Fiorucci
,
Rossana Bellopede
and
Paola Marini
DIATI—Department of Environment, Land and Infrastructure Engineering, Politecnico di Torino, 10129 Torino, Italy
*
Author to whom correspondence should be addressed.
Mining 2025, 5(2), 21; https://doi.org/10.3390/mining5020021
Submission received: 30 January 2025 / Revised: 7 March 2025 / Accepted: 18 March 2025 / Published: 21 March 2025

Abstract

:
The growing demand for green and, therefore, sustainable technologies present new challenges for our society. The European Union (EU) identified the critical raw materials (CRMs) and strategic raw materials (SRMs) necessary for these technologies and introduced policies to reduce reliance on external suppliers, which includes investigating the recovery of CRMs from extractive waste. This study assesses the recovery potential of mine waste collected in the Traversella mine district (Piedmont, Italy), known for its polymetallic Fe-Cu-W deposit. The characterization of waste rock samples involved chemical and mineralogical analyses, revealing metallic-bearing minerals such as magnetite and scheelite. Laboratory-scale magnetic and gravity separation tests were carried out and compared. Magnetic separation resulted in a recovery of 75.4% of Fe, 72.3% of Cu, and 83.7% of W, with a weak concentration. Instead, gravity separation produced high-grade Fe (67.6%) and W (1289 ppm) concentrate with lower recovery rates.

1. Introduction

Mining sites represent a unique combination of industrial, historical, and natural heritage. These sites have been fundamental to the formation of social groups and communities, creating the conditions for economic and social development [1]. In recent years, the extractive industry has faced significant challenges and difficulties in Italy. The depletion of mining resources, together with higher production costs compared with other countries, has caused the decline of the mining industry, especially for base metal production, which has had an economic and social impact on the country [2]. The European Union has defined 34 critical raw materials, 16 of which are also considered strategic due to their relevance in ecological and digital transition [3,4,5], intended for aerospace and defense, for the production of electric batteries, solar panels, and wind turbines [6,7,8]. Italy has 15 of these 34 critical raw materials, specifically lithium, cobalt, barite, beryllium, nickel, tungsten, copper, and zinc. In Italy, metallic critical raw materials (CRMs), which represent the majority of critical materials, are not currently extracted, and for their supply, the country is dependent on foreign markets [9,10].
The CRM Act, approved by the European Council on March 2024, requires that by 2030, the annual consumption of the EU must be composed of at least 10% locally extracted minerals; at least 40% of the EU’s annual consumption should be from EU-processed minerals; and at least 25% of the supply should be obtained from recycled minerals [11,12]. The implementation of policies to secure a stable supply of CRMs and SRMs to minimize the volume of waste sent to disposal sites and landfills encourages the recovery and recycling of resources from waste within the extractive industry, such as in abandoned mining sites, referred to as mining waste or tailings [13].
Mine waste and tailings represent a significant environmental concern for present and past mining activities and a potential opportunity for reprocessing and obtaining valuable minerals and CRMs [14,15,16,17,18]. Various technologies and methodologies are being applied and developed for the reprocessing of mine waste and tailings, including mineral processing and hydrometallurgical and bio-hydrometallurgical techniques [19,20,21]. However, many challenges remain in terms of technical difficulties, economic viability, and regulatory frameworks due to the complex conditions of these liabilities [22]. The success of mine waste reprocessing projects depends on factors like detailed preliminary mineralogical and chemical characterization and the development of tailored recovery solutions [19,23].
In the literature, numerous applied examples of the laboratory-scale reprocessing of mine waste can be found. For instance, Abaka-Wood et al. [24,25] described a methodology for characterizing and recovering valuable iron oxides and rare earth element (REE) minerals from iron ore tailings in South Australia. Their approach utilized preliminary detailed mineralogical analyses, while wet high-intensity magnetic separation and flotation were tested for separation and concentration. Iron-bearing minerals were successfully recovered, but REE minerals faced problems with their concentration due to their varying magnetic properties. Similarly, Mulenshi et al. [26] investigated beneficiation options for tungsten recovery from mine waste in Sweden. This study involved a preliminary sampling campaign, chemical and mineralogical characterization, and magnetic separation tests employing both low- and high-intensity magnetic separation for iron-bearing minerals and gravity separation for the recovery of tungsten minerals. However, there are still few published works on mine waste recovery from former base metal mines in Italy. Among these, Mehta et al. [27] described sampling methodologies and laboratory-scale reprocessing trials using froth flotation and a shaking table to recover cadmium, gallium, and zinc compounds from mine waste collected in a mining district in Northern Italy. Their work also explored the potential reuse of processed tailings as soil additives to reduce the environmental impact of polluting minerals.
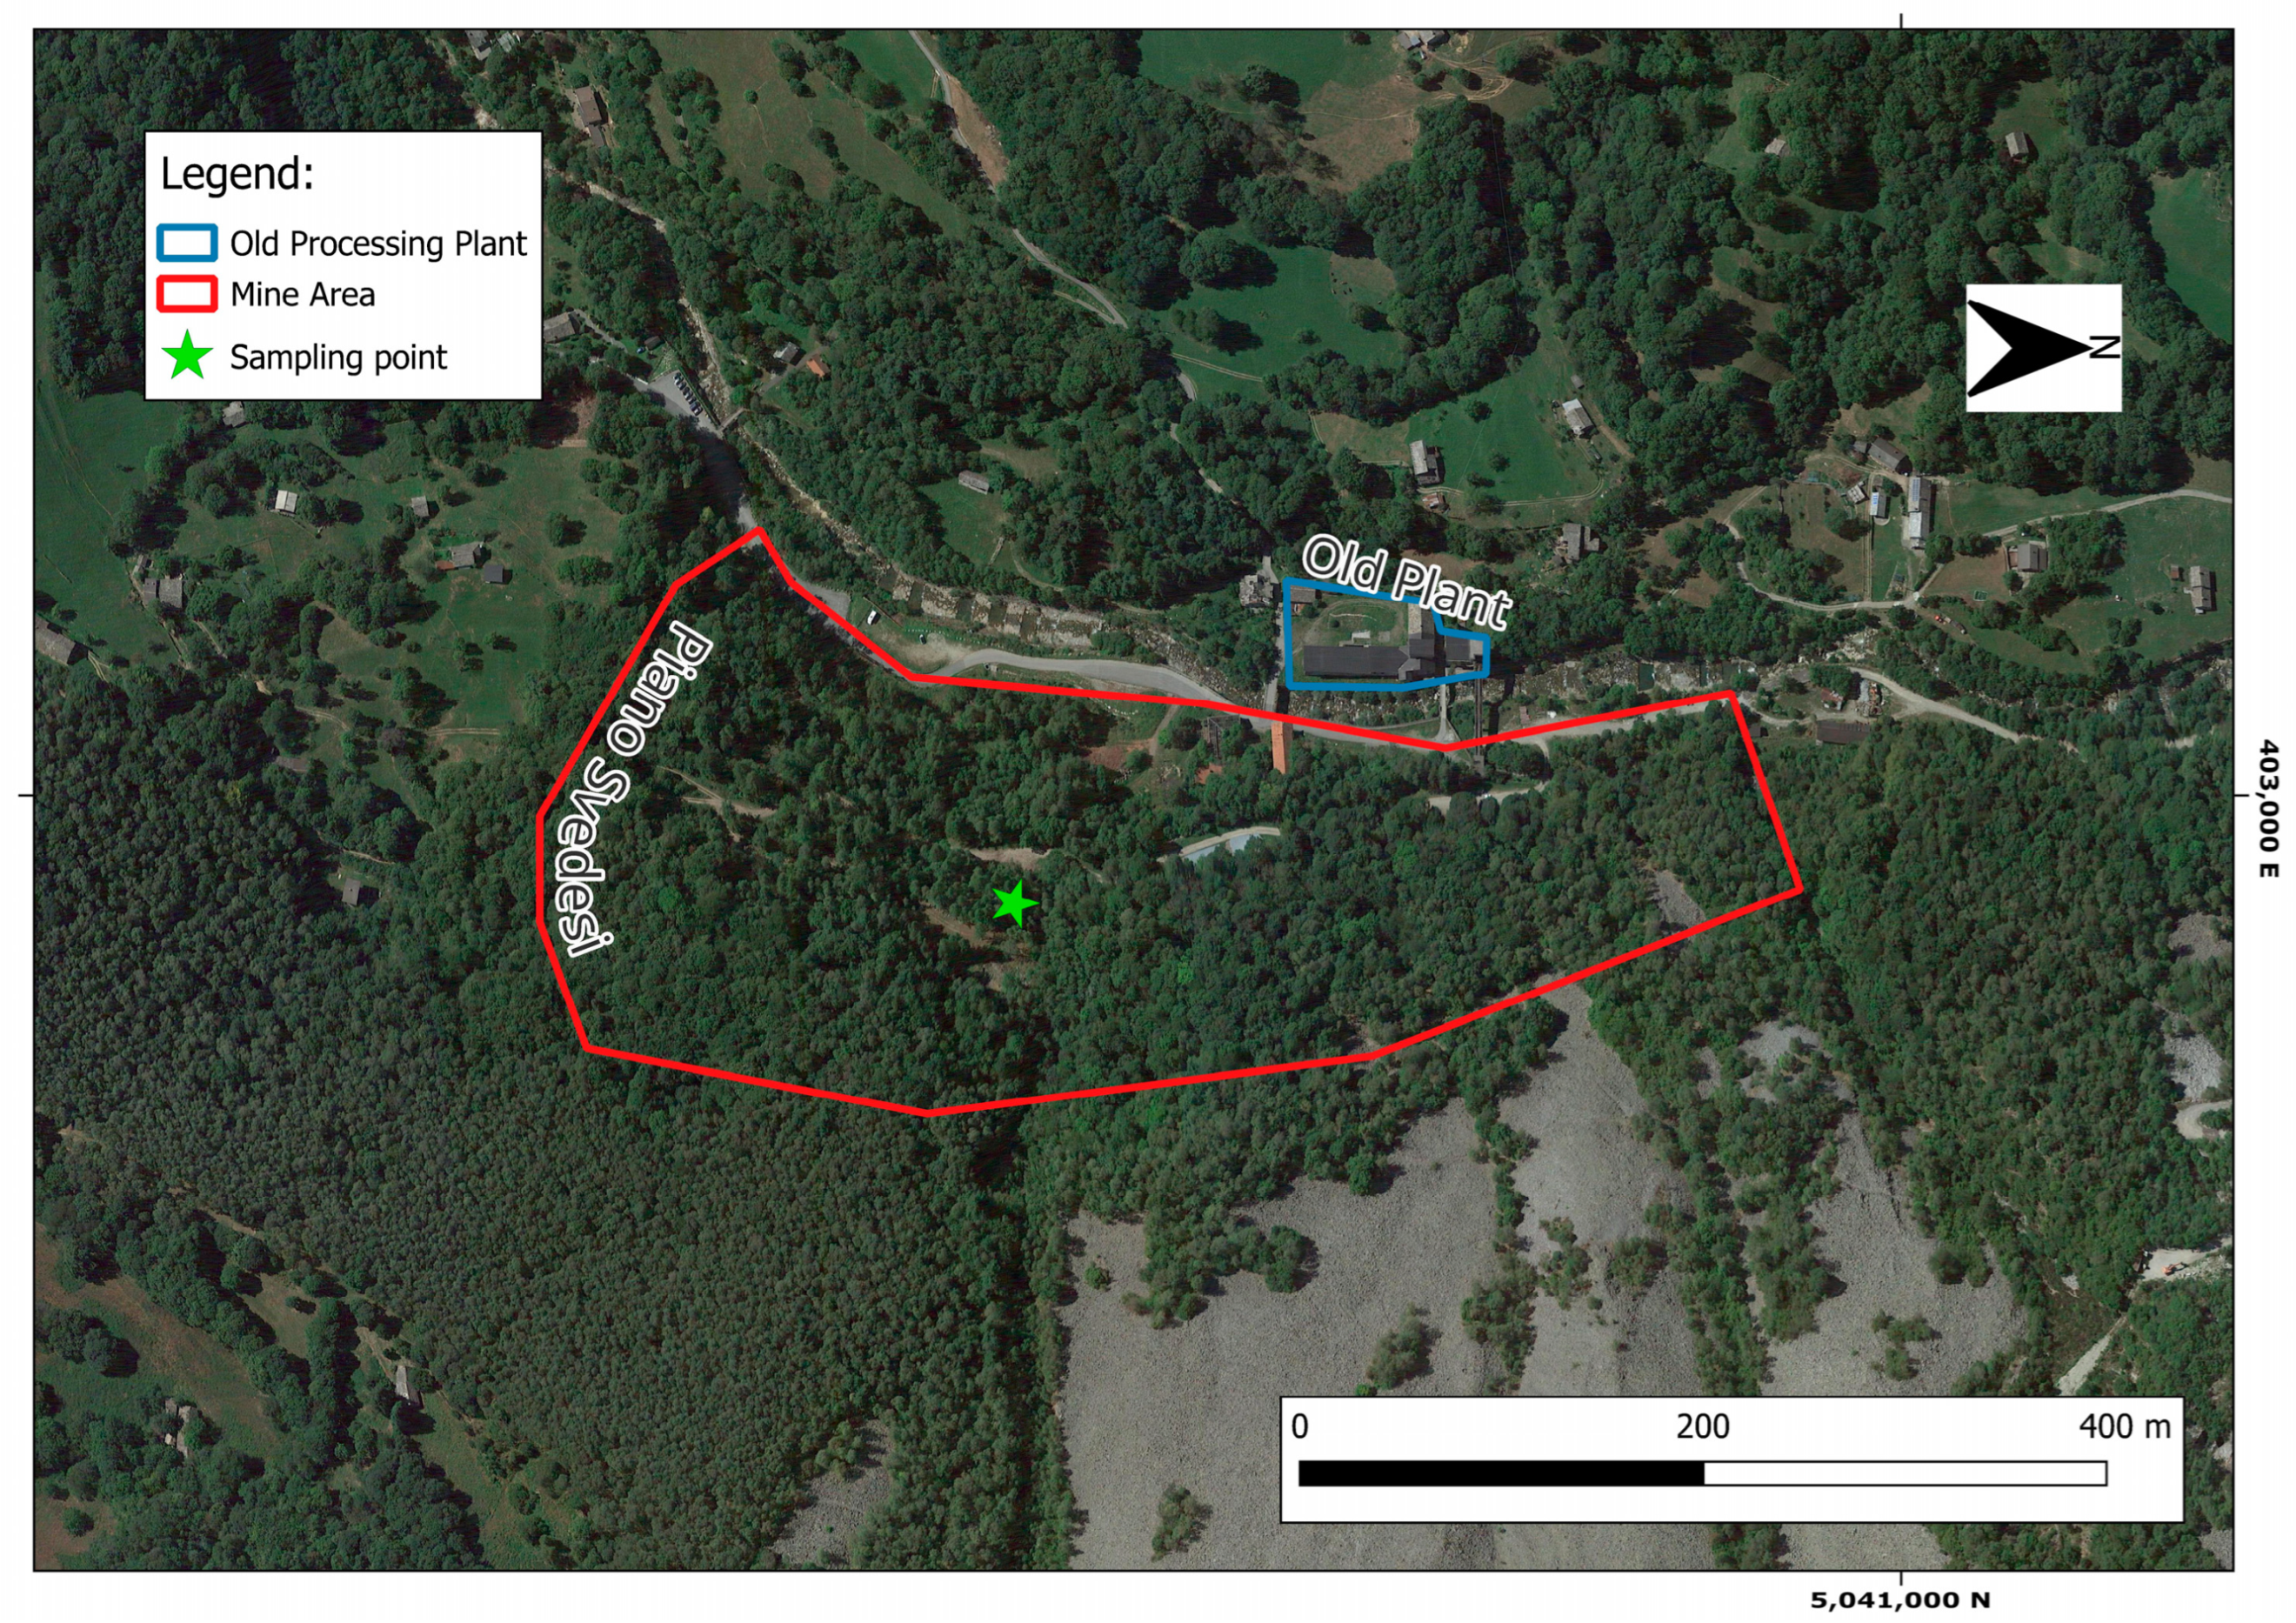
This study aims to explore, for the first time, the potential recovery of CRM and SRM-bearing minerals from a selected mine waste dump area in the historical Traversella mine district (Piedmont, Italy). This site, listed in the National Registry of Extractive Waste Facilities, was identified as containing significant mining waste [28,29]. Additionally, this work supports the preliminary study of alternative raw material supplies from relevant Italian mine waste areas, which have not been investigated in recent times for waste valorization.
Mine waste samples were collected from a selected waste rock dump in the Traversella mine area and subjected to mineralogical and chemical characterization using optical microscopy (OM), X-Ray powder diffraction (XRPD), scanning electron microscopy (SEM-EDS) and portable X-Ray fluorescence (p-XRF). Laboratory-scale reprocessing tests were performed in order to assess the possibility of recovering CRMs and SRMs by magnetic and gravimetric separation methods. Finally, the separation performance of the obtained concentrates containing iron (Fe) and minor critical and strategic elements such as copper (Cu) and tungsten (W) was assessed and compared.

2. Materials and Methods

2.1. Site Description

The Traversella mine district is situated about 55 km north of Turin, Piedmont, on the left bank of the Bersella River, within the Chiusella Valley. The deposit is defined as a polymetallic Fe-Cu-W—with accessory Mo, As, Sb, Bi, Au, and U—pyro-metasomatic deposit occurring in the metamorphic aureole and generated at the contact between an intrusive body and the metamorphic rocks of the Sesia-Lanzo geological unit [30]. The ore body is considered a “skarn” deposit in which the mineralized veins are hosted in the mica-schist, gneiss, and lenses of carbonate rocks [31,32].
The Traversella deposit was exploited starting from the Roman period and Middle Ages, initially targeting visible surficial mineralized outcrops in the area with small-scale open-pit operations or exploration tunnels. During the 1500s, exploitation developed with chaotic and artisanal underground methods, including tunnels and small shafts, causing several stability problems to the rock mass. These pre-industrial mining activities were mainly used to deliver raw materials for the essential economy of local communities. During the XVIII century, the Traversella–Brosso district started to be exploited with industrial and planned underground operations. It brought a thriving production of the magnetite resource, accounting for about 340,000 metric tons of ore extracted between 1723 and 1824. Furthermore, from the 1930s, other types of ore minerals were exploited, such as scheelite, chalcopyrite, and uraninite, thanks to the implementation of innovative technologies in mineral processing plants [32,33]. In the final years of production, the mines produced 100 tons of iron ore per day in 1965, yielding 6 tons per hour of iron concentrate from the processing plant, with a maximum Fe3O4 grade of 68%. Additionally, the mineral dressing plant produced 750 kg per year of scheelite concentrate, with a maximum WO3 grade of 60%, and 250 kg per year of radioactive mixed minerals and uraninite concentrate [34]. The amount of Light Rare Earth Elements (LREEs, including Y, La, Ce, Pr, Nd and Sm) and Heavy Rare Earths Elements (HREEs, including Eu, Gd, Tb, Dy, Ho, Er, Tm, Yb and Lu), measured in the scheelite exploited in Traversella, was 1036 ppm (min 101 ppm, max 2125 ppm) and 144 ppm (min 30 ppm, max 208 ppm), respectively, as reported by [35]. The mining activity ceased in 1971 due to economic difficulties in the exploitation of orebodies [32,33].
In this area, ISPRA underlined the presence of waste rock piles potentially containing As, Cd, Co, Mn, Ni, Pb, Cu, V, Fe, and W in the areas near the former mine adits and processing plants. Furthermore, ISPRA classified this mining waste as having a medium–high ecological and sanitary risk [28,29]. Some references to dumping areas are also reported in the minor works published in journals of mineral collectors [36]. Moreover, no published data are available regarding the volumes or quantities of material present in these mining dump areas.

2.2. Sampling

Hand sampling of the waste material was carried out in the Piano degli Svedesi landfill area, located close to the old mineral processing plant in Val Bersella, within the municipality of Traversella (Figure 1). This sampling aimed to evaluate the mineralogical composition of the material, quantify the metallic mineral content, and define a treatment process at the laboratory scale. The area was chosen for its potential to yield economically valuable raw materials from mining waste.
According to the site setting shown in Figure 2a, an imaginary grid of 9 rectangular elements, each one measuring approximately 9 m in width and 3 m in height, was used to collect a representative sample from the accessible and free-of-vegetation portion of the waste area. About 3 kg of material was hand-picked from each identified grid element, carefully selecting appropriate portions of materials according to field-observed characteristics (Figure 2b). A reconstituted sample of approximately 30 kg of material was obtained.
Before characterization and laboratory testing, the material was split using the coning and quartering technique to obtain representative subsamples. About 6 kg of the initial sampled material was divided into subsamples of about 1.5 kg each and subjected to preliminary size reduction operations using a hammer.
The collected sample showed oxidative mineralization visible on the surface, while the internal sections exhibited a gray matrix interspersed with black veins, as presented in Figure 3.

2.3. Chemical and Mineralogical Characterization

Chemical and mineralogical characterizations were performed to understand the primary properties and composition of the sampled material and separation products. Various analytical methods and equipment were employed to assess the mine waste matrix’s elemental composition, mineral phases, and textural features. This multiple approach provided detailed insights into the chemical and structural attributes essential for evaluating the material’s potential for further processing and the recovery of valuable minerals and the effectiveness of the proposed re-processing approach.

2.3.1. Optical Microscopy

Optical microscopy (OM) was performed on uncovered, polished 30 μm thick sections prepared from rock sample slices. A Leica Ortholux II POL-MK optical polarized-light microscope (Leica Camera AG, Wetzlar, Germany) equipped with a DeltaPix (Deltapix, Smoerum, Denmark) camera and DeltaPix (Deltapix, Smoerum, Denmark) InSight software ver. 6.2.11 for image processing was used. Both normal and polarized transmitted light modes were applied to identify the main mineralogical features of the collected samples.

2.3.2. Scanning Electron Microscopy

Scanning electron microscopy (SEM) analyses were conducted using an FEI QUANTA INSPECT 200LV microscope (FEI Company, Hillsboro, OR, USA) equipped with an Energy Dispersive Analysis X-Ray (EDAX) detector, controlled by xT Microscope Control software and interfaced with GENESIS Spectrum version 6.04 (Edax Inc., Mahwah, NJ, USA). Measurements were taken in high-vacuum mode at 5.00 kV using a backscattered electron detector (BSED). Analyses were performed on the selected size class (0.250–0.125 mm) epoxy-mounted granular samples obtained after preliminary crushing and grinding tests.

2.3.3. X-Ray Powder Diffraction Analysis

X-Ray powder diffraction (XRPD) analysis was performed using a Rigaku (Tokyo, Japan) model SmartLab SE diffractometer, with Copper K-Alpha Radiation (CuKα) at 40 kV and 30 mA in a 5–90° 2θ range, 0.02° step width, and 4°/min scan speed equipped with a D/teX Ultra 250 (H). The detector’s “X-Ray Fluorescence (XRF) Reduction” mode was enabled to mitigate the fluorescence effect of Fe-bearing minerals and enhance the acquisition data quality [37]. Rigaku (Tokyo, Japan) software SmartLab Studio II ver. 4.1.0.133 package, combined with the ICDD PDF-5+ 2024 (International Center for Diffraction Data, Powder Diffraction File™) database [38], was used for qualitative spectrum analyses and main mineral phases detection. For specimen preparation, a side-loading technique was used following the manual grinding of oven-dried samples using an agate pestle and mortar.

2.3.4. Portable X-Ray Fluorescence Spectroscopy

Portable X-Ray fluorescence spectroscopy (p-XRF) analyses were conducted using a SciAps X-555 handheld XRF (SciAps Inc., Andover, MA, USA) equipped with a 5 W, maximum 55 kV, 200 µA, Au anode X-Ray source, and a 140 eV resolution 20 mm2 silicon drift detector. The instrument was operated with the proprietary “Mining” program using the two-beam mode, set for a total acquisition time of 60 s. A portable docking station supported the instrument in the laboratory setting. Samples were manually milled using an agate pestle and mortar and then transferred to XRF cups.

2.4. Grain Liberation Determination

Grain morphology and free-grain size assessment have been evaluated with SEM-EDS images: for sample preparation, approximately 3 g of the ground material, taken from the particle size 0.250–0.125 mm, was embedded in epoxy resin using a trans-vertical, 3D-printed mold designed to minimize the effect of the gravitational settling of heavier grains, customizing and optimizing the sample molds designed by Grant et al. [39]. Following a 48 h curing period, the exposed surface was polished and subsequently gold-coated. SEM images were acquired in the BSE mode, covering different image fields. MATLAB (The MathWorks Inc., Natick, MA, USA) R2024b software [40] and Image Processing Toolbox ver. 24.2 [41] plug-ins were used for the processing and analysis of BSE images obtained. According to the preliminary investigation on single grains, two different binary masks were manually created using the Segment Anything Model function included in the Image Segmenter plug-in [41] and run as input data. This script was designed to automatically calculate the grain-by-grain liberation of magnetite grains according to overlapping ratios between valuable and associated gangue areas.

2.5. Crushing, Grinding, and Separation Equipment

As shown in Figure 4, crushing and grinding equipment was used to reduce sample dimensions, producing material suitable for subsequent separation trials. Separation processes were conducted using a low-intensity magnetic field separator to isolate magnetic phases. Additionally, gravitational concentration was performed with a shaking table to separate minerals based on density differences. This sequence of size reduction and separation aimed to efficiently classify the sample material into fractions based on mineralogical and physical properties relevant for recovery trials.

2.5.1. Crushing

Sample crushing was performed using a Magutt CR-25 (Loro & Parisini S.p.A., Milan, Italy) jaw crusher powered by a 4.5 kW electric motor operating at 440 rpm. The feed opening, with dimensions of 260 × 100 mm, limited the maximum input material size to 80 mm. The crusher was set to a closed-side setting (CSS) of 7.5 mm and an open-side setting (OSS) of 15 mm. The material exceeding the input size limit was pre-crushed manually using a hammer.

2.5.2. Grinding

The milling of the material was conducted using a lab-scale rod mill equipped with a drum measuring 193 mm in diameter and 267 mm in length, containing nine steel rods with a diameter of 8 mm. The mill was powered by a 0.45 kW electric motor. The drum was filled with 1 kg of material at a 30% volume/volume filling ratio, and grinding was performed for 7 min at a rotation speed of 50 rpm.

2.5.3. Low-Intensity Magnetic Separator (LIMS)

Dry magnetic separation tests were conducted using a laboratory-scale-induced disk low-intensity magnetic separator (LIMS) Davies Model 45 (Davies Magnet Works Ltd., Ware, Herts, UK). The magnetic field was adjusted using the instrument’s built-in fingertip control for magnet gap adjustment and the rheostat to control the electromagnet’s input current. Magnetic field intensity was measured with an MG-3002 (Lutron Electronic Enterprise Co., Taipei, Taiwan) portable AC/DC magnetic meter. The separation tests were conducted in two steps in series, using different magnetic field intensities of 0.20 T and 0.35 T at a mass rate of 1 kg/h.

2.5.4. Shaking Table (ST)

Gravity separation was performed using a Krupp (Humboldt Wedag GmbH, Cologne, Germany) lab-scale shaking table (ST) with a rubber-coated surface measuring 1000 × 500 mm. The oscillation was generated by an eccentric mass driven by a 0.25 kW electric motor. The feeding material was introduced at a rate of 50 g/min, with a water discharge of 2.5 L/min and an inclination angle of 7°.

2.6. Experimental Design and Testing Procedure

The mineralogical and chemical characterization of the material guided the selection of the re-processing test route, as well as the sequencing of operations and the application of the necessary technology to obtain the mineral concentrates, according to the physical characteristics of target minerals identified in the waste samples.
Physical treatment tests of samples were conducted using laboratory-scale equipment described in detail in the following sections. Preliminary tests on representative material were performed by sieving the crushing and milling products and obtaining three different particle size classes (>0.250 mm, 0.125–0.250 mm, and <0.125 mm) to determine the free grain size of valuable minerals using optical macroscope observations.
The particle size class 0.250–0.125 mm was selected based on the requirements of the available separation equipment. Separation tests were conducted in batch mode, and the testing procedure layout shown in Figure 4 provides an overview of the equipment used. Mass balances were evaluated only for the single separation tests.
The activities performed can be summarized as follows:
  • Jaw crushing and bar milling;
  • Sieving;
  • Dry magnetic separation using an LIMS;
  • Gravity separation using an ST.
Separation output materials were named and obtained as follows:
  • LIMS output:
    Non-Magnetic 1 (LIMS-NM1): non-magnetic material after separation at 0.2 T;
    Non-Magnetic 2 (LIMS-NM2): non-magnetic material resulting after repeated separation of 0.35 T on the intermediate magnetic concentrate;
    Magnetic (LIMS-M): final magnetic concentrate.
  • ST output:
    o
    Heavy concentrate (ST-H);
    o
    Middling product (ST-M);
    o
    Light product (ST-L).

2.7. Separation Evaluation

To evaluate and compare the separation techniques described, three key parameters were calculated for each test. The yield (Y), recovery (R), and enrichment ratio (ER), as defined by Wills et al. [42], were calculated according to the following formulas:
Y   ( % )   =   C F   ×   100 % ,
R   %   =   C c F f   ×   100 % ,
E R   =   c f
where C represents the mass of the concentrate, and c denotes the grade of the concentrate. F represents the mass of the feed, and f denotes the grade of the feed. The grades of the feed and concentrate were determined using chemical assays obtained from p-XRF analyses.

3. Results

3.1. Original Sample Characterization

3.1.1. Optical Microscopy

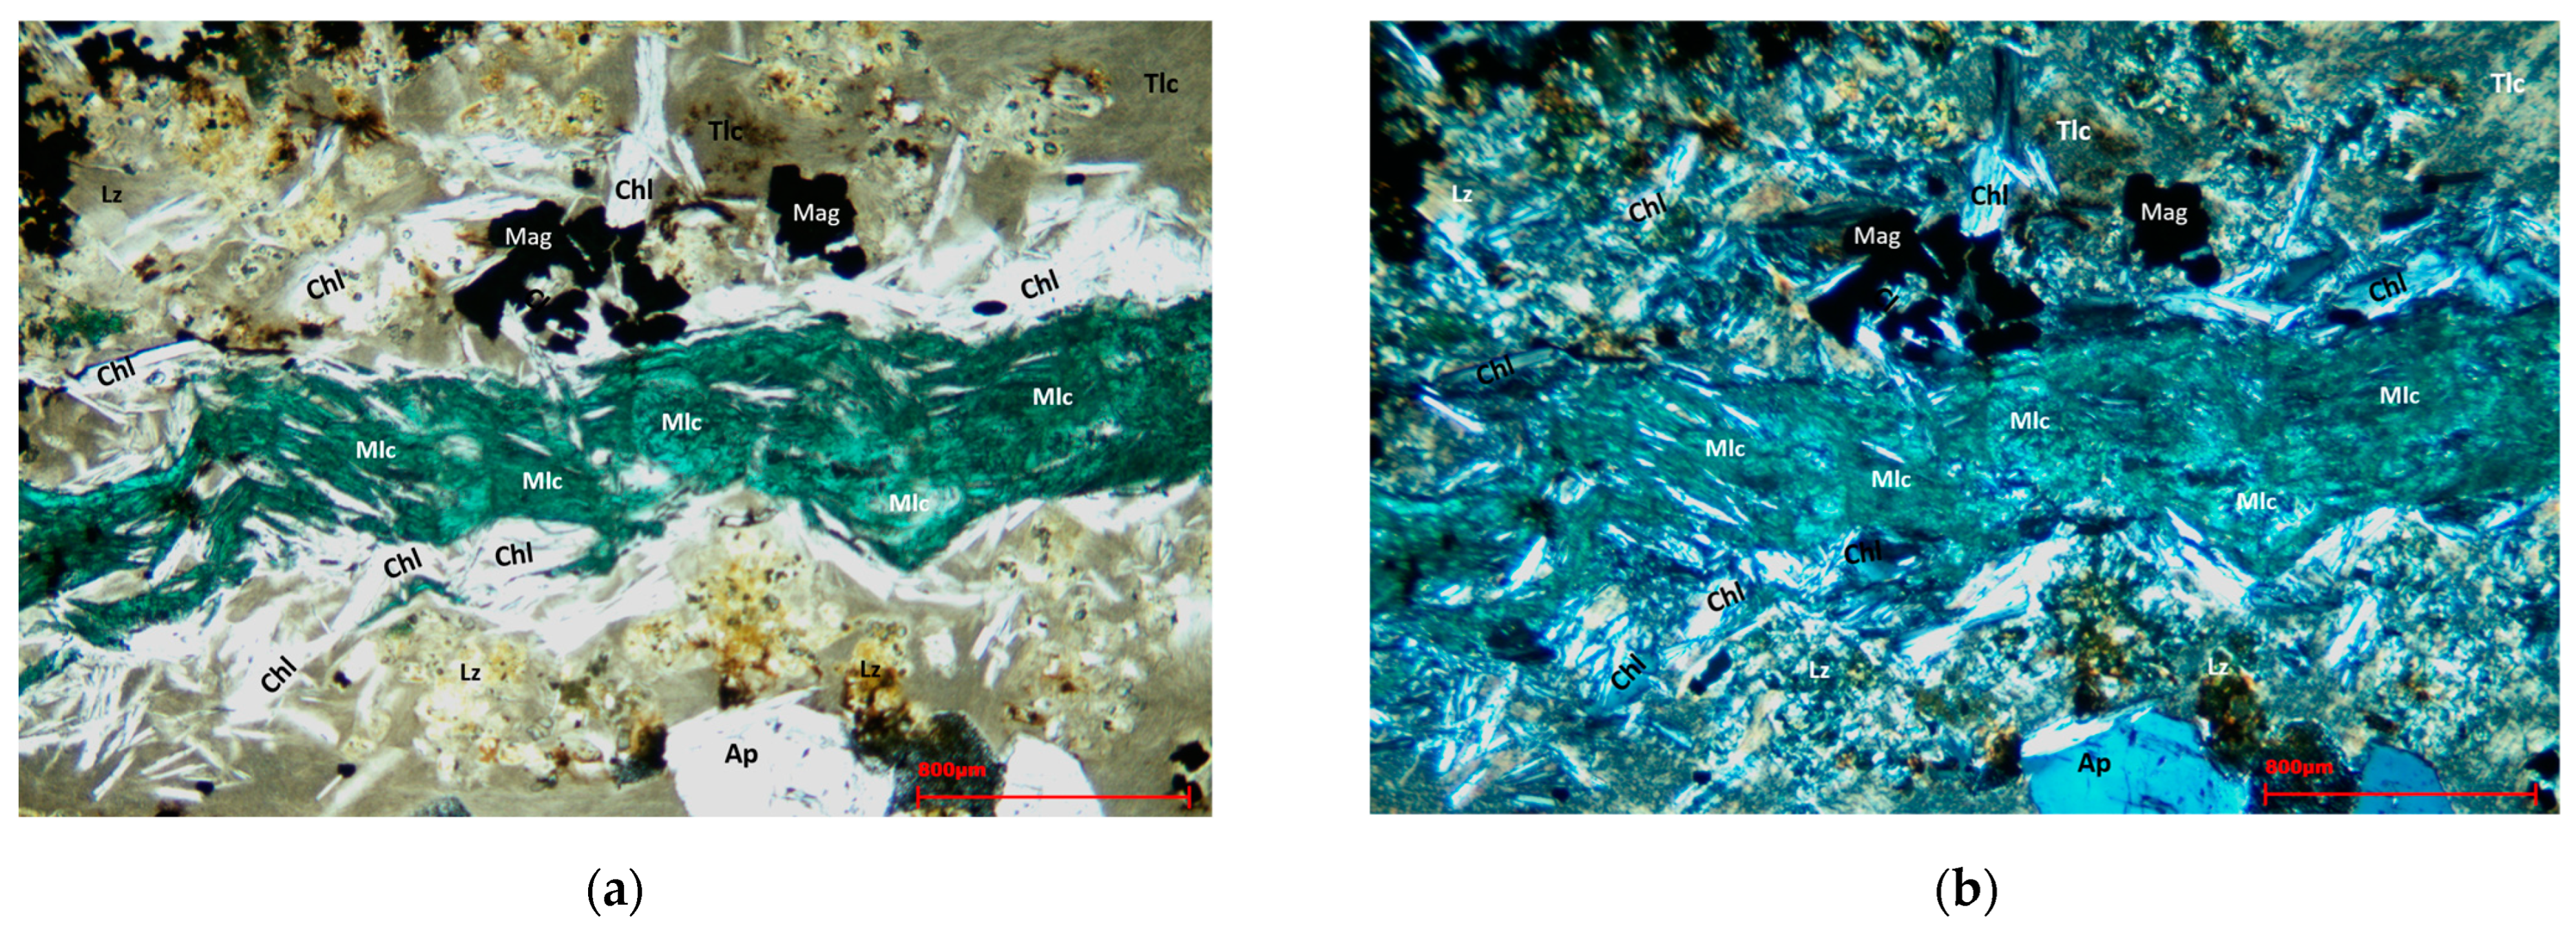
Normal and polarized transmitted light was used to identify the mineral structures and species associated with ferrous mineralization on the 30 µm thin sections realized. 
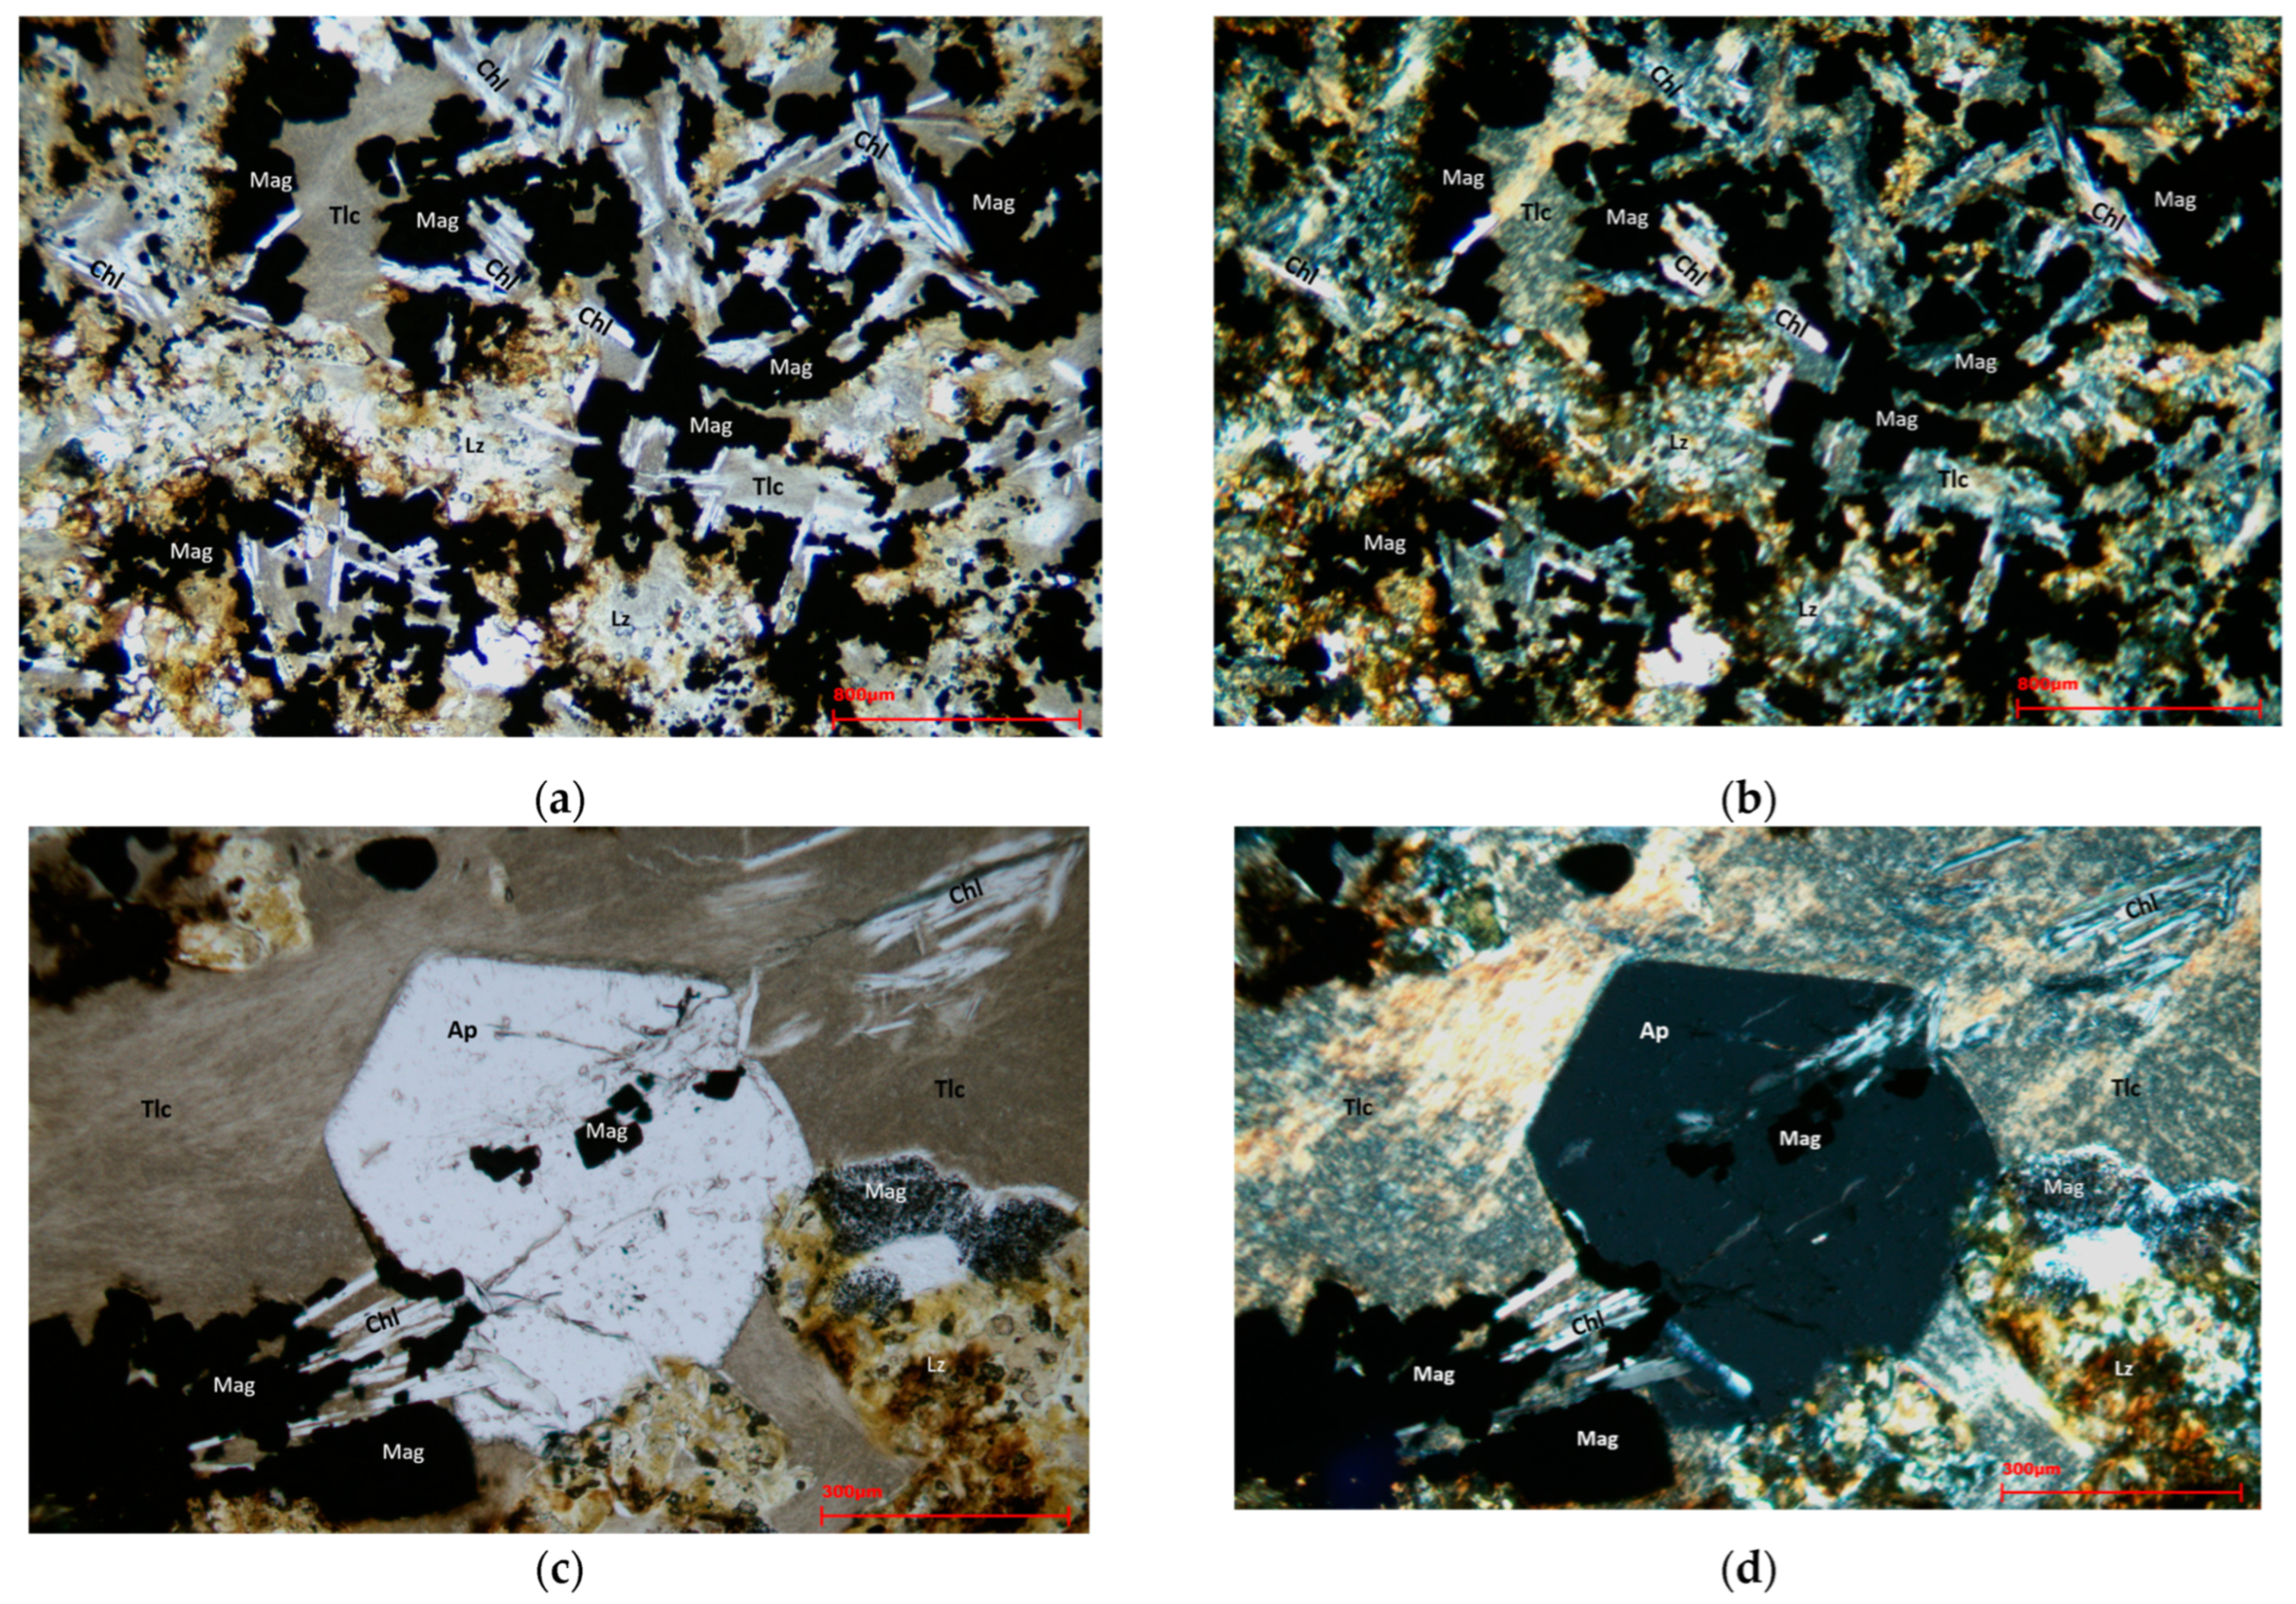
Figure 5a–d show the images obtained from the petrographic observation of the thin sections in transmitted light. The sample appeared highly heterogeneous, characterized by a matrix of silicate minerals such as talc and lizardite, interspersed with chlorite crystals. The mineralization was characterized by opaque magnetite crystals with a regular cubic shape. In some cases, magnetite grains were included in apatite grains.
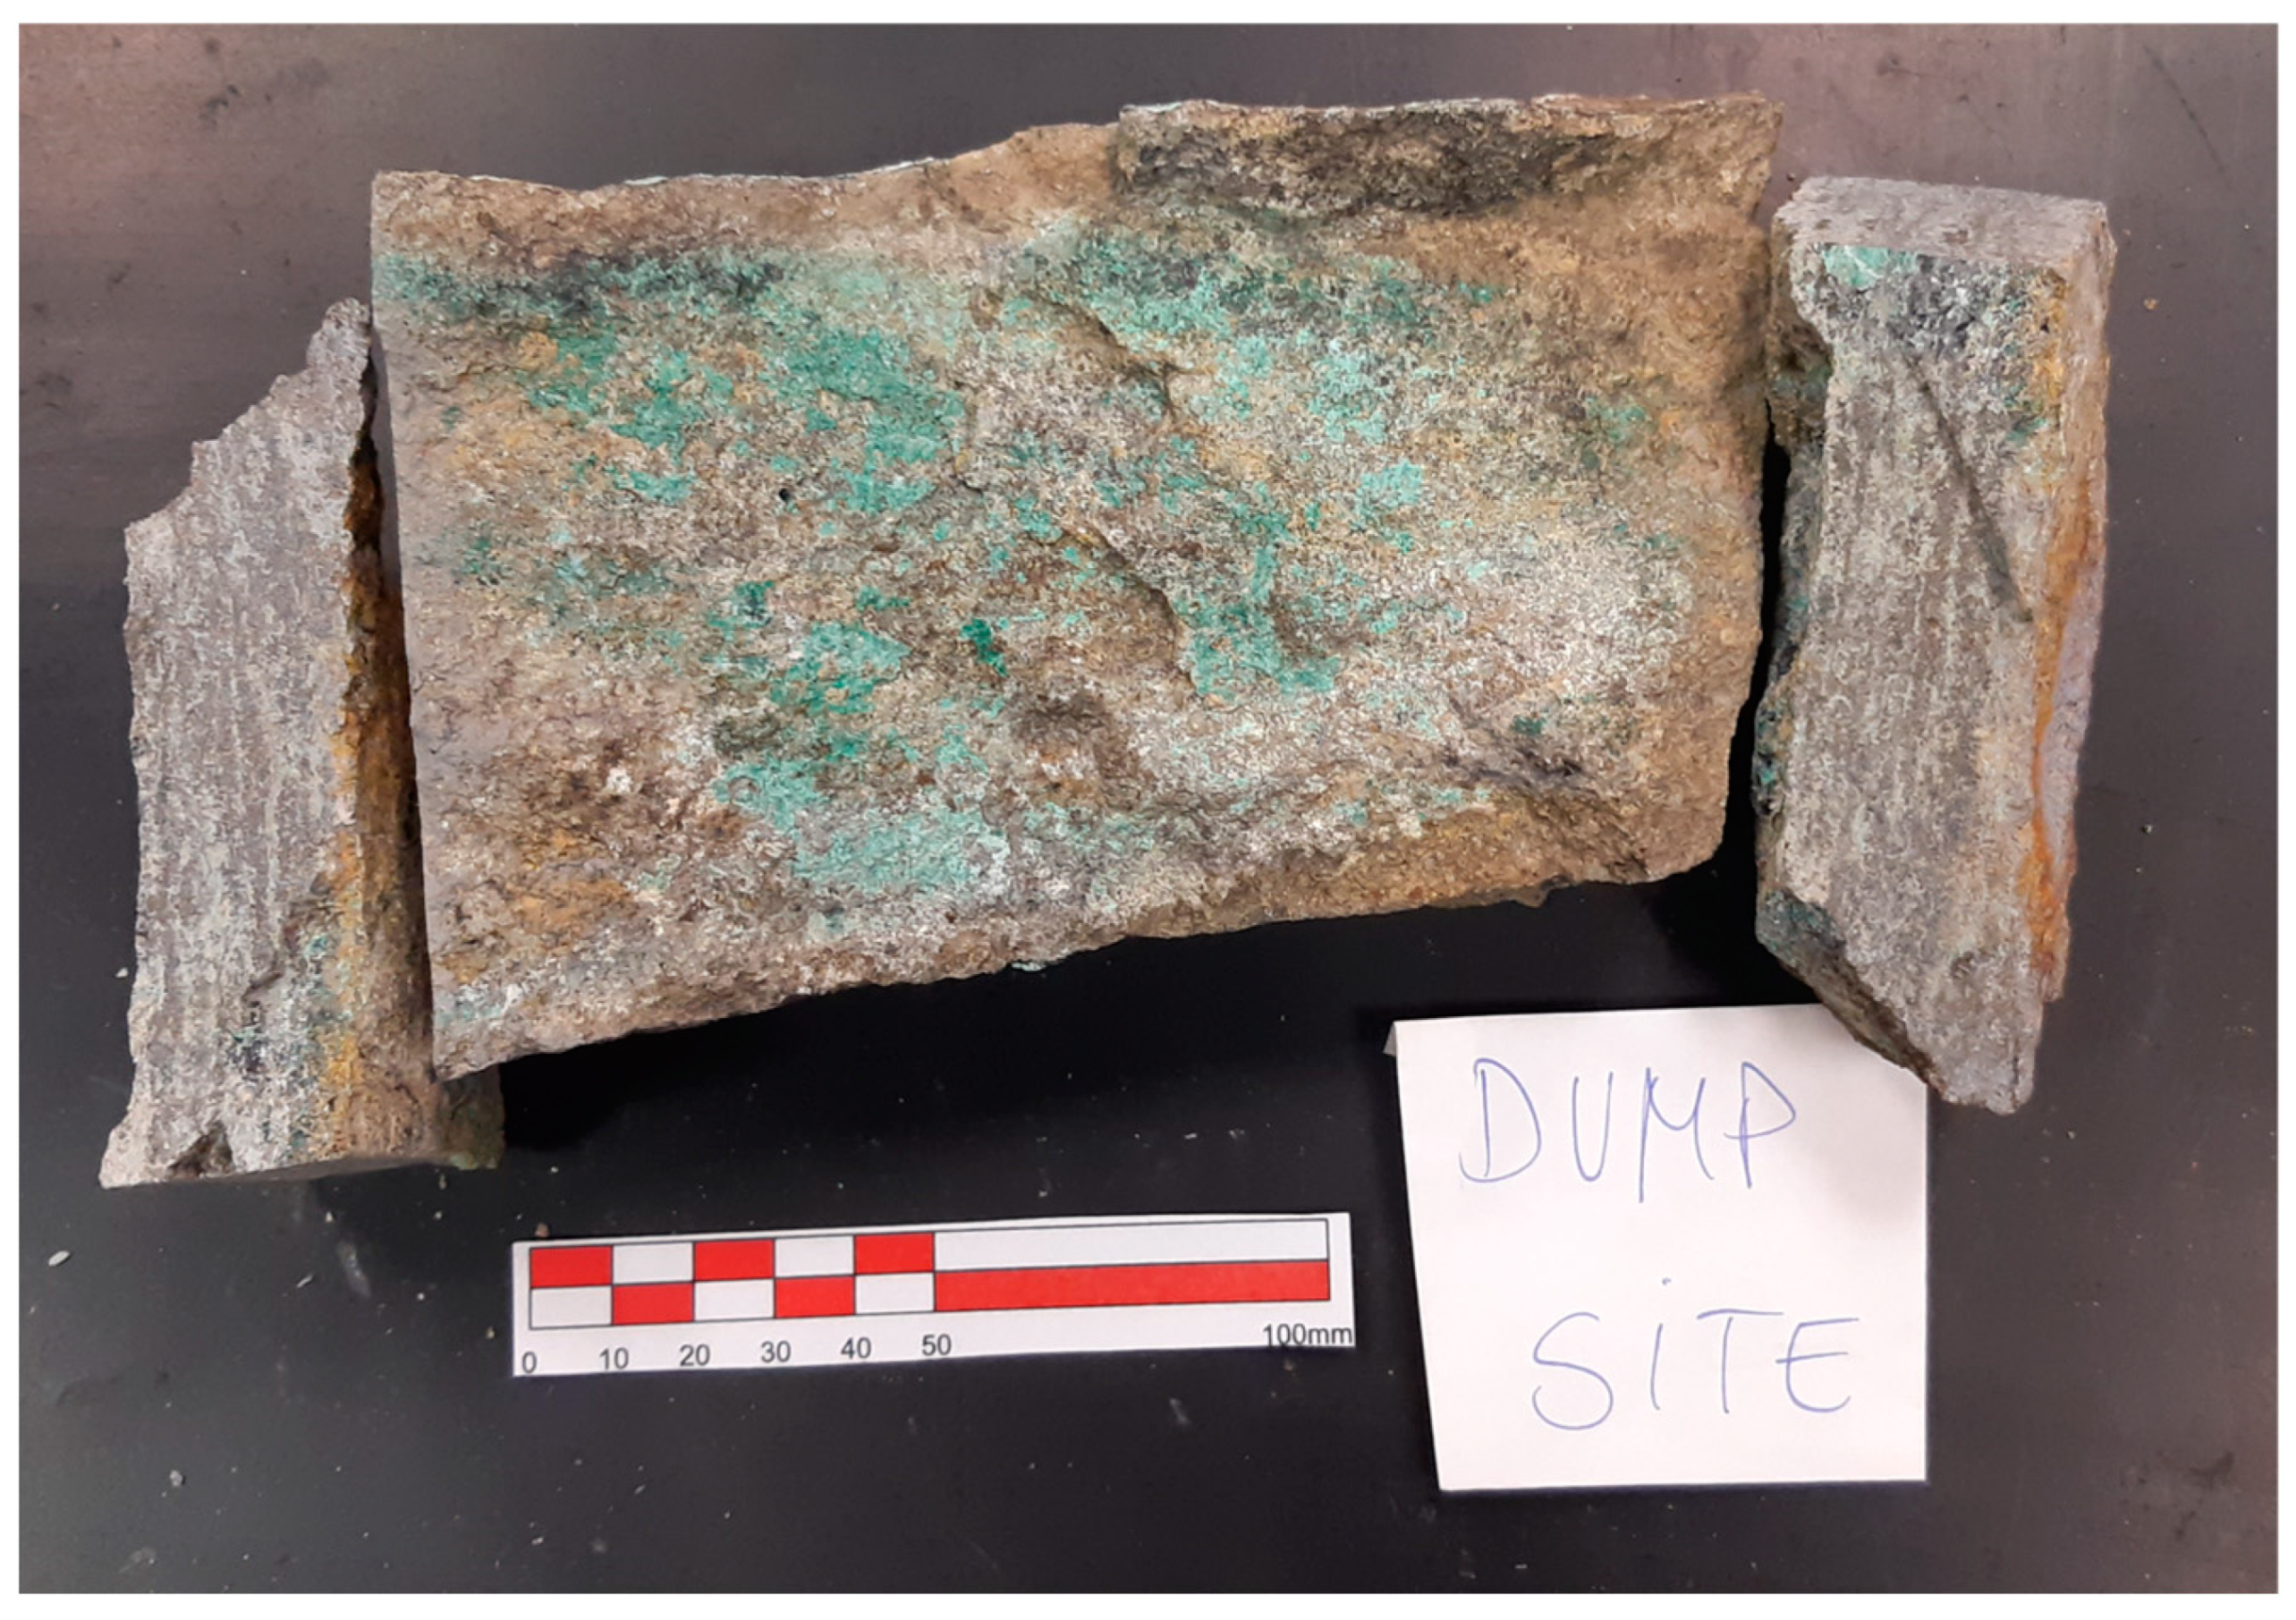
Figure 6a,b show a feature visible to the naked eye on the sample (see Figure 3), namely a banded inclusion of malachite. This inclusion was surrounded by chlorite minerals and embedded in a matrix composed of talc and lizardite.

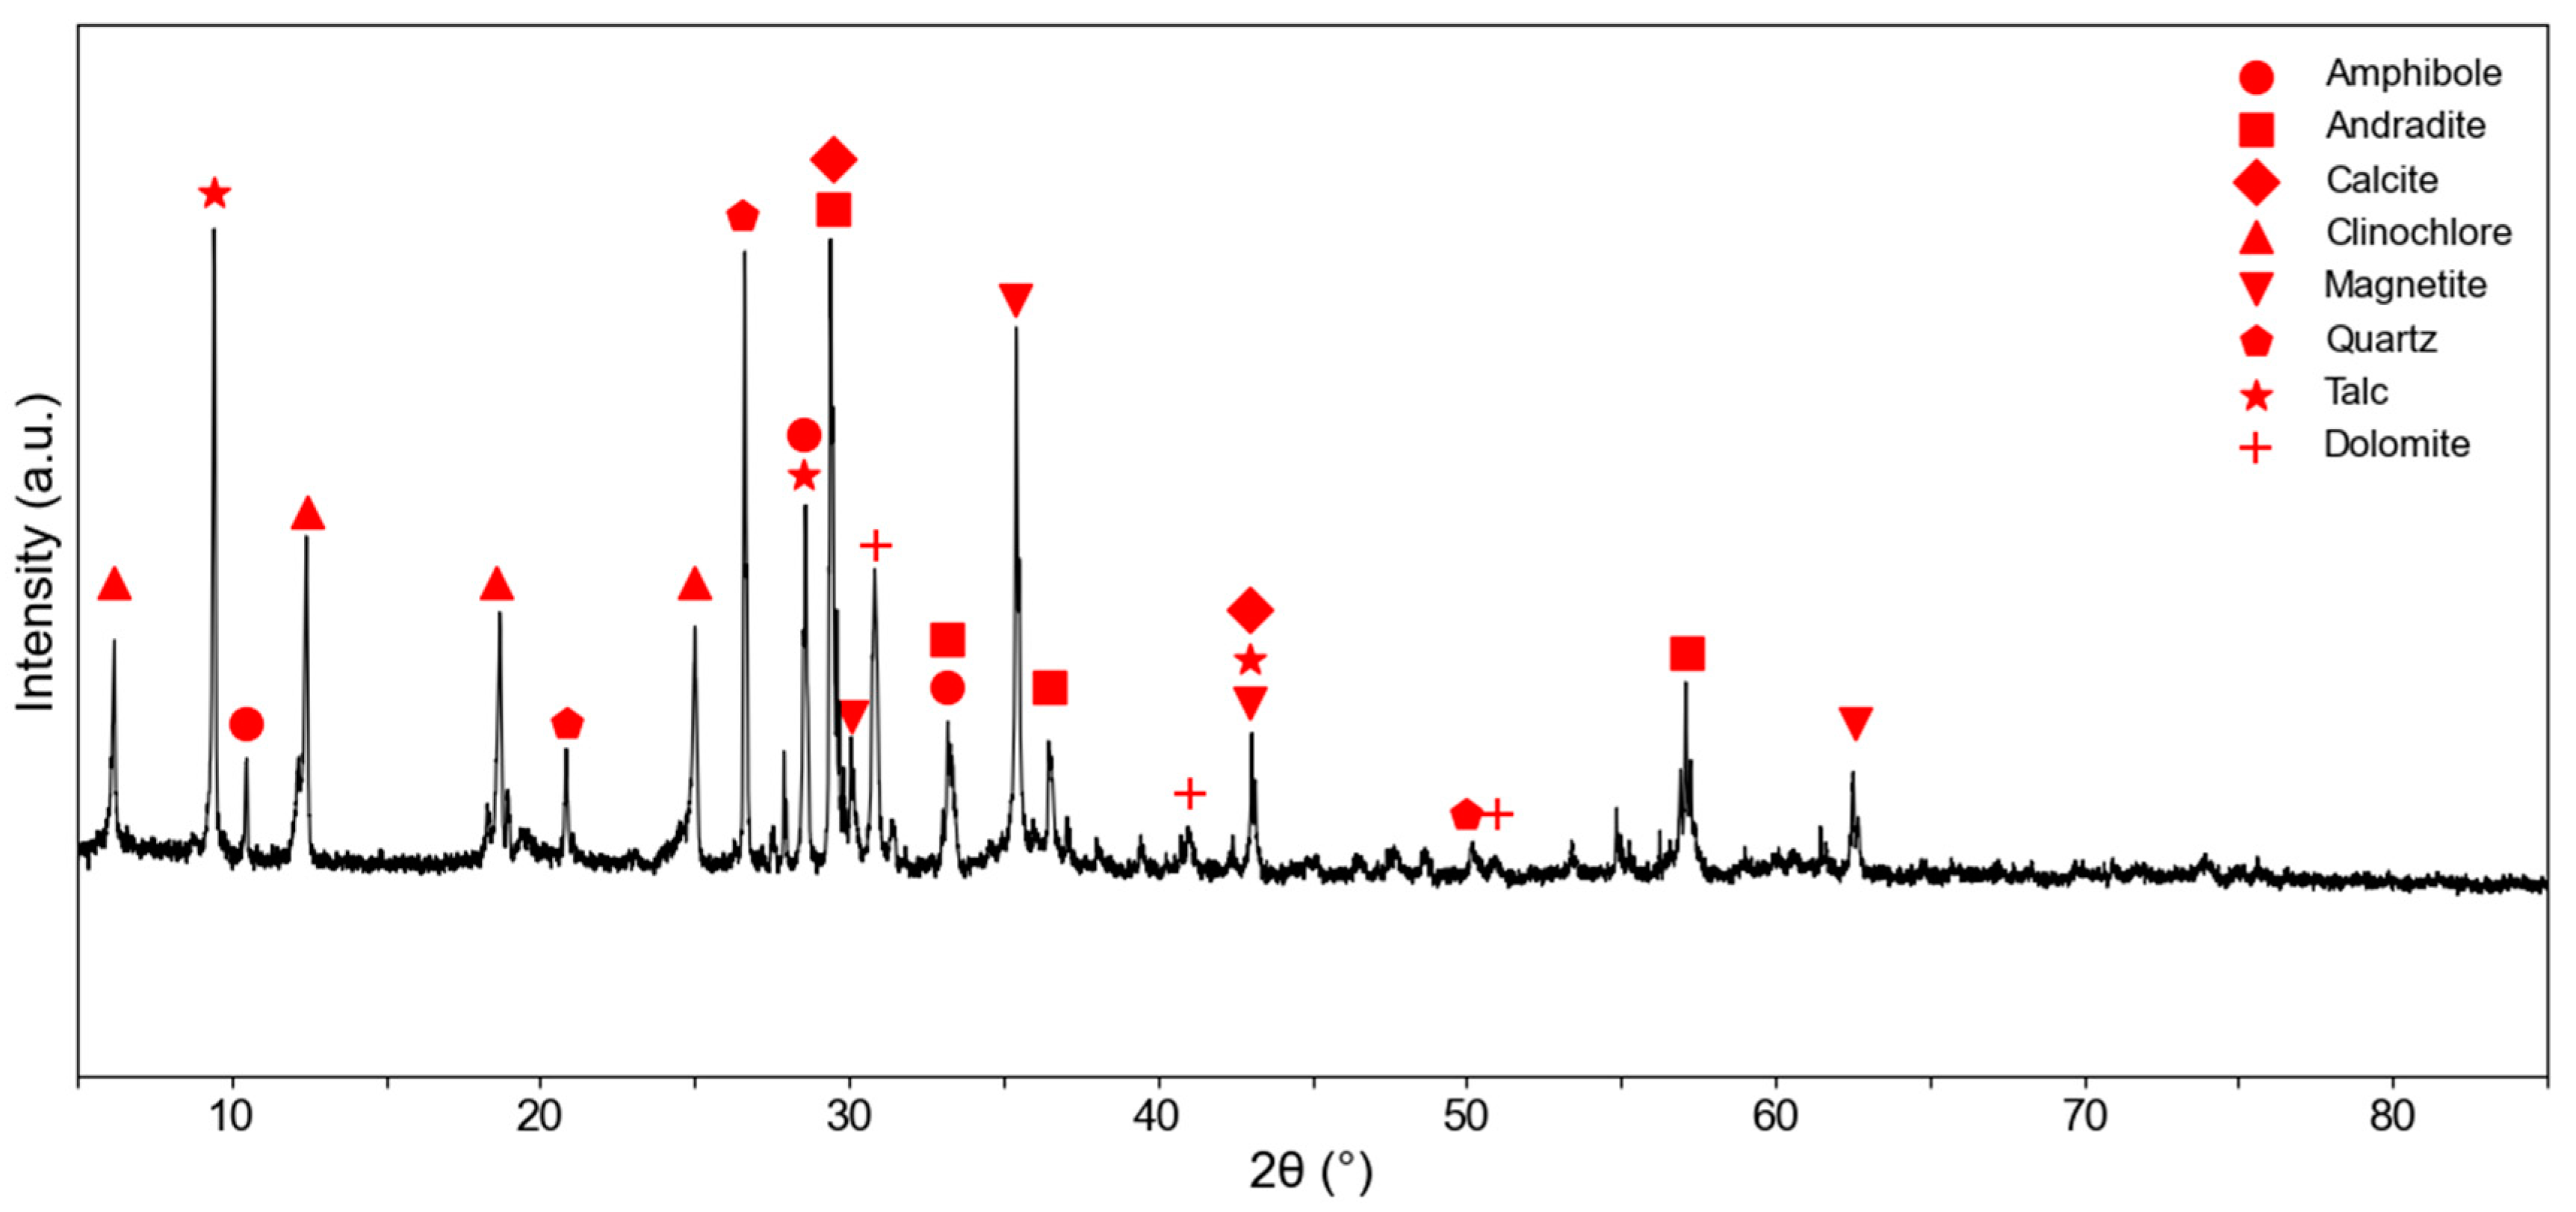
3.1.2. X-Ray Powder Diffraction (XRPD)

XRPD analyses performed on an untreated and representative portion of the initial sampled material detected the presence of seven mineral phases: amphibole, andradite, calcite, clinochlore, magnetite, quartz, and talc. The XRPD spectrum is reported in Figure 7.
Reference spectra selected from the consulted database [38] were compared to experimental ones. The detected peaks of the main mineral phases are reported in Table 1.
Detected minerals in the initial non-treated waste sample confirmed the presence of mineral phases identified by OM.

3.1.3. Portable X-Ray Fluorescence (p-XRF)

P-XRF analyses investigated the chemical grades of 21 elements in the sampled material, as reported in Table 2.
The elemental composition of the non-treated material showed that Si and Fe were the most abundant elements, respectively, with grades of 17.2% and 16.9%. Among other major elements, Mg was present in significant amounts (11.4%), while Ca, Al, and P showed lower concentrations of 4.0%, 1.8%, and 1.5%, respectively. S was assayed at 0.3%.
Regarding critical and strategic metals, Cu was the most abundant, with a grade of 1.3%. Mn, Ti, As, and W were present in traces, with concentrations of 0.1%, 544 ppm, 186 ppm, and 96 ppm, respectively. Additionally, Zn and Pb were quantified at 56 ppm and 54 ppm.

3.2. Crushing, Milling, and Sieving

After crushing and milling, sieving was performed to obtain three different granulometric classes. Table 3 shows the weight fraction of the obtained materials.
The size class 0.125–0.250 mm was selected as the feeding material for the separation tests as it was the most suitable size class for the selected equipment. This material was further investigated in order to better define the mineralogical and chemical features. In addition, the liberation of target minerals was also investigated to confirm the selection of the most suitable feeding material.

3.3. Feeding Material Characterization—0.250–0.125 mm

Following grinding, two size classes were produced and characterized as feeding material for separation tests. Mineralogical characterization was realized by performing XRPD qualitative analysis; the acquired spectra are reported in Figure 8.
Qualitative mineralogical analyses were performed on the acquired spectra, comparing the identified peaks with the reference database [38]. The mineral phases identified are reported in Table 4.
In the size class 0.250–0.125 mm, eight mineral phases were detected. These phases were comparable to the non-treated bulk material sampled in the field. P-XRF analyses were performed to obtain chemical data useful for assessing the grade of the feeding material before separation. Analytical results are reported in Table 5.
Based on the XRPD and p-XRF results, SEM Energy-Dispersive Spectroscopy (EDS) analyses were performed to better identify the valuable and accessory minerals that may contain valuable elements but which are challenging to detect using XRPD due to their low concentrations.
Figure 9a–d show a BSE image, EDS spectra, and chemical composition of epoxy-embedded size class 0.250–0.125 mm material.
BSE images and EDS spectra showed the widespread presence of grains containing heavy elements, as indicated by the increased brightness intensity, which correlates with a greater average of the atomic number contained in the sample [52]. Among these minerals, the majority were magnetite (Figure 9a,c), while pyrite (Figure 9a,b) grains were sparsely present in the material. Magnetite grains were predominantly observed as single grains, occasionally associated with gangue minerals. Gangue minerals were generally identified as silicates, possibly amphiboles, based on the EDS spectra reported in Figure 9d.
Similarly, Figure 10a–d show the BSE images recorded, identifying the main and accessory minerals contained in the samples.
CRM-bearing minerals were detected in the samples, including scheelite, observed as sparse single grains. These grains were characterized by a high brightness in the BSE images and as having relevant W content, as indicated in the EDS spectrum (Figure 10a,b). Malachite was also detected as the most abundant Cu-bearing mineral in the samples (Figure 10c,d).

Free-Grain Size Identification and Liberation Assessment

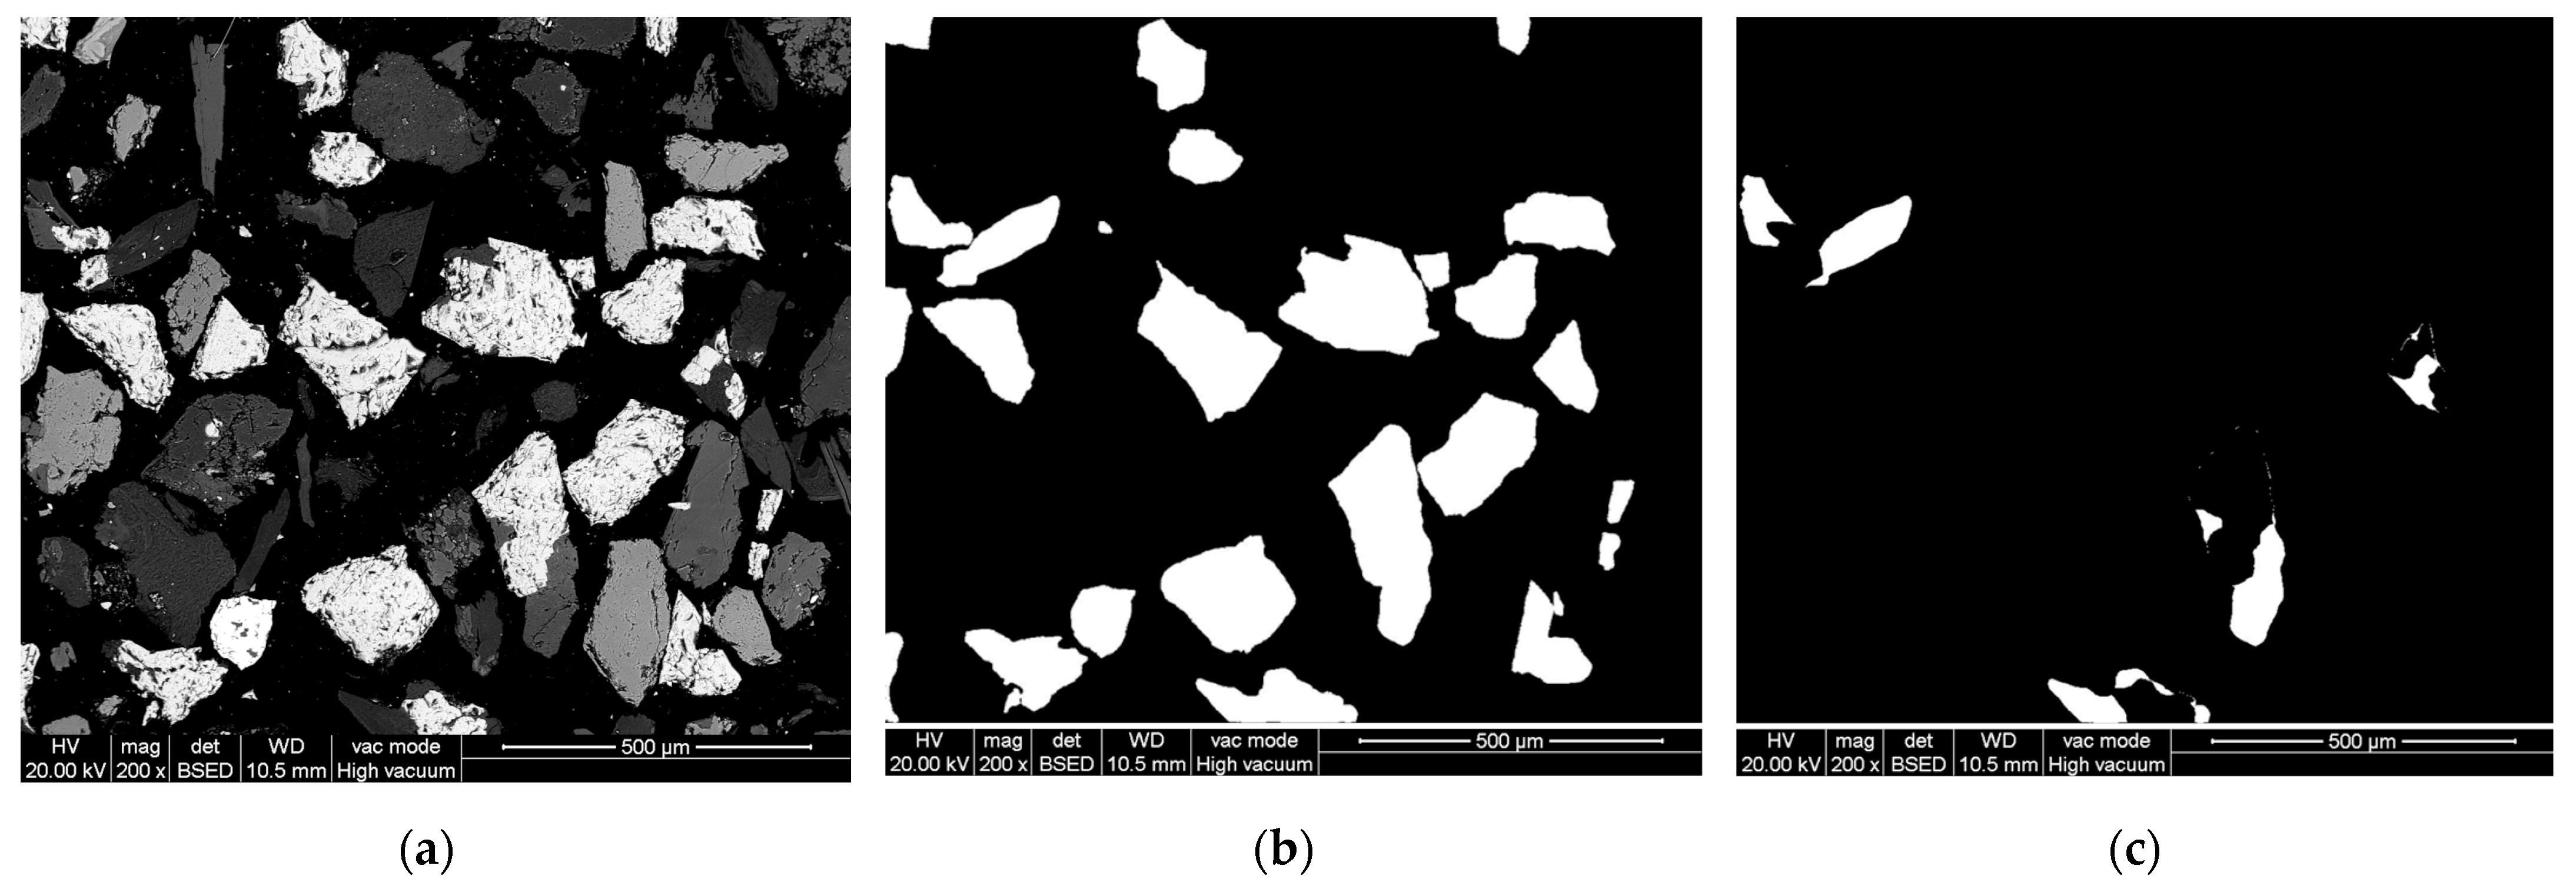
According to the BSE image quality and the extended presence of magnetite grains, BSE images acquired from size class 0.250–0.125 mm were selected as the input images for the semi-automated procedure for the estimation of liberation grade and liberated grain size distribution.
The manual selection of the areas associated with valuable grains on the images was performed by selecting magnetite-bearing grains on the original BSE image (Figure 11a), producing two different binary masks: the first represented the total magnetite-bearing minerals (Figure 11b), while the second represented the gangue inclusion of the first image (Figure 11c).
The output binary masks were processed using the script provided in the Supplementary Materials, which was designed to automatically calculate the grain-by-grain liberation of magnetite grains.
The script calculated the total area of each grain, determined the magnetite area by subtracting the area of gangue minerals from the magnetite-bearing grains mask, and quantified the proportion of magnetite in each grain to assess the overlap percentage of these areas. Single grains were categorized into three classes based on the following thresholds: liberated grains (≥80% magnetite area), middling grains (<80% and ≥30% magnetite area), and locked grains (<30% magnetite area). Additionally, the script calculated the granulometric distribution using the equivalent diameter derived from the grain-by-grain analysis. Overall, three different BSE images were considered for this evaluation, for a total number of 84 magnetite-bearing grains considered.
Figure 12 shows the results of the grain-by-grain evaluation, indicating the portions of the areas assigned to magnetite and gangue minerals.
In Figure 13, the liberation analysis outcomes for the 0.250–0.125 mm size class are reported. Magnetite grains were, on average, 85.8% liberated (range 80.5–92.3%), with middling grains accounting for 13.5% (range 7.4–18.7%). Locked magnetite was negligible, averaging 0.6% (range 0.3–0.8%).
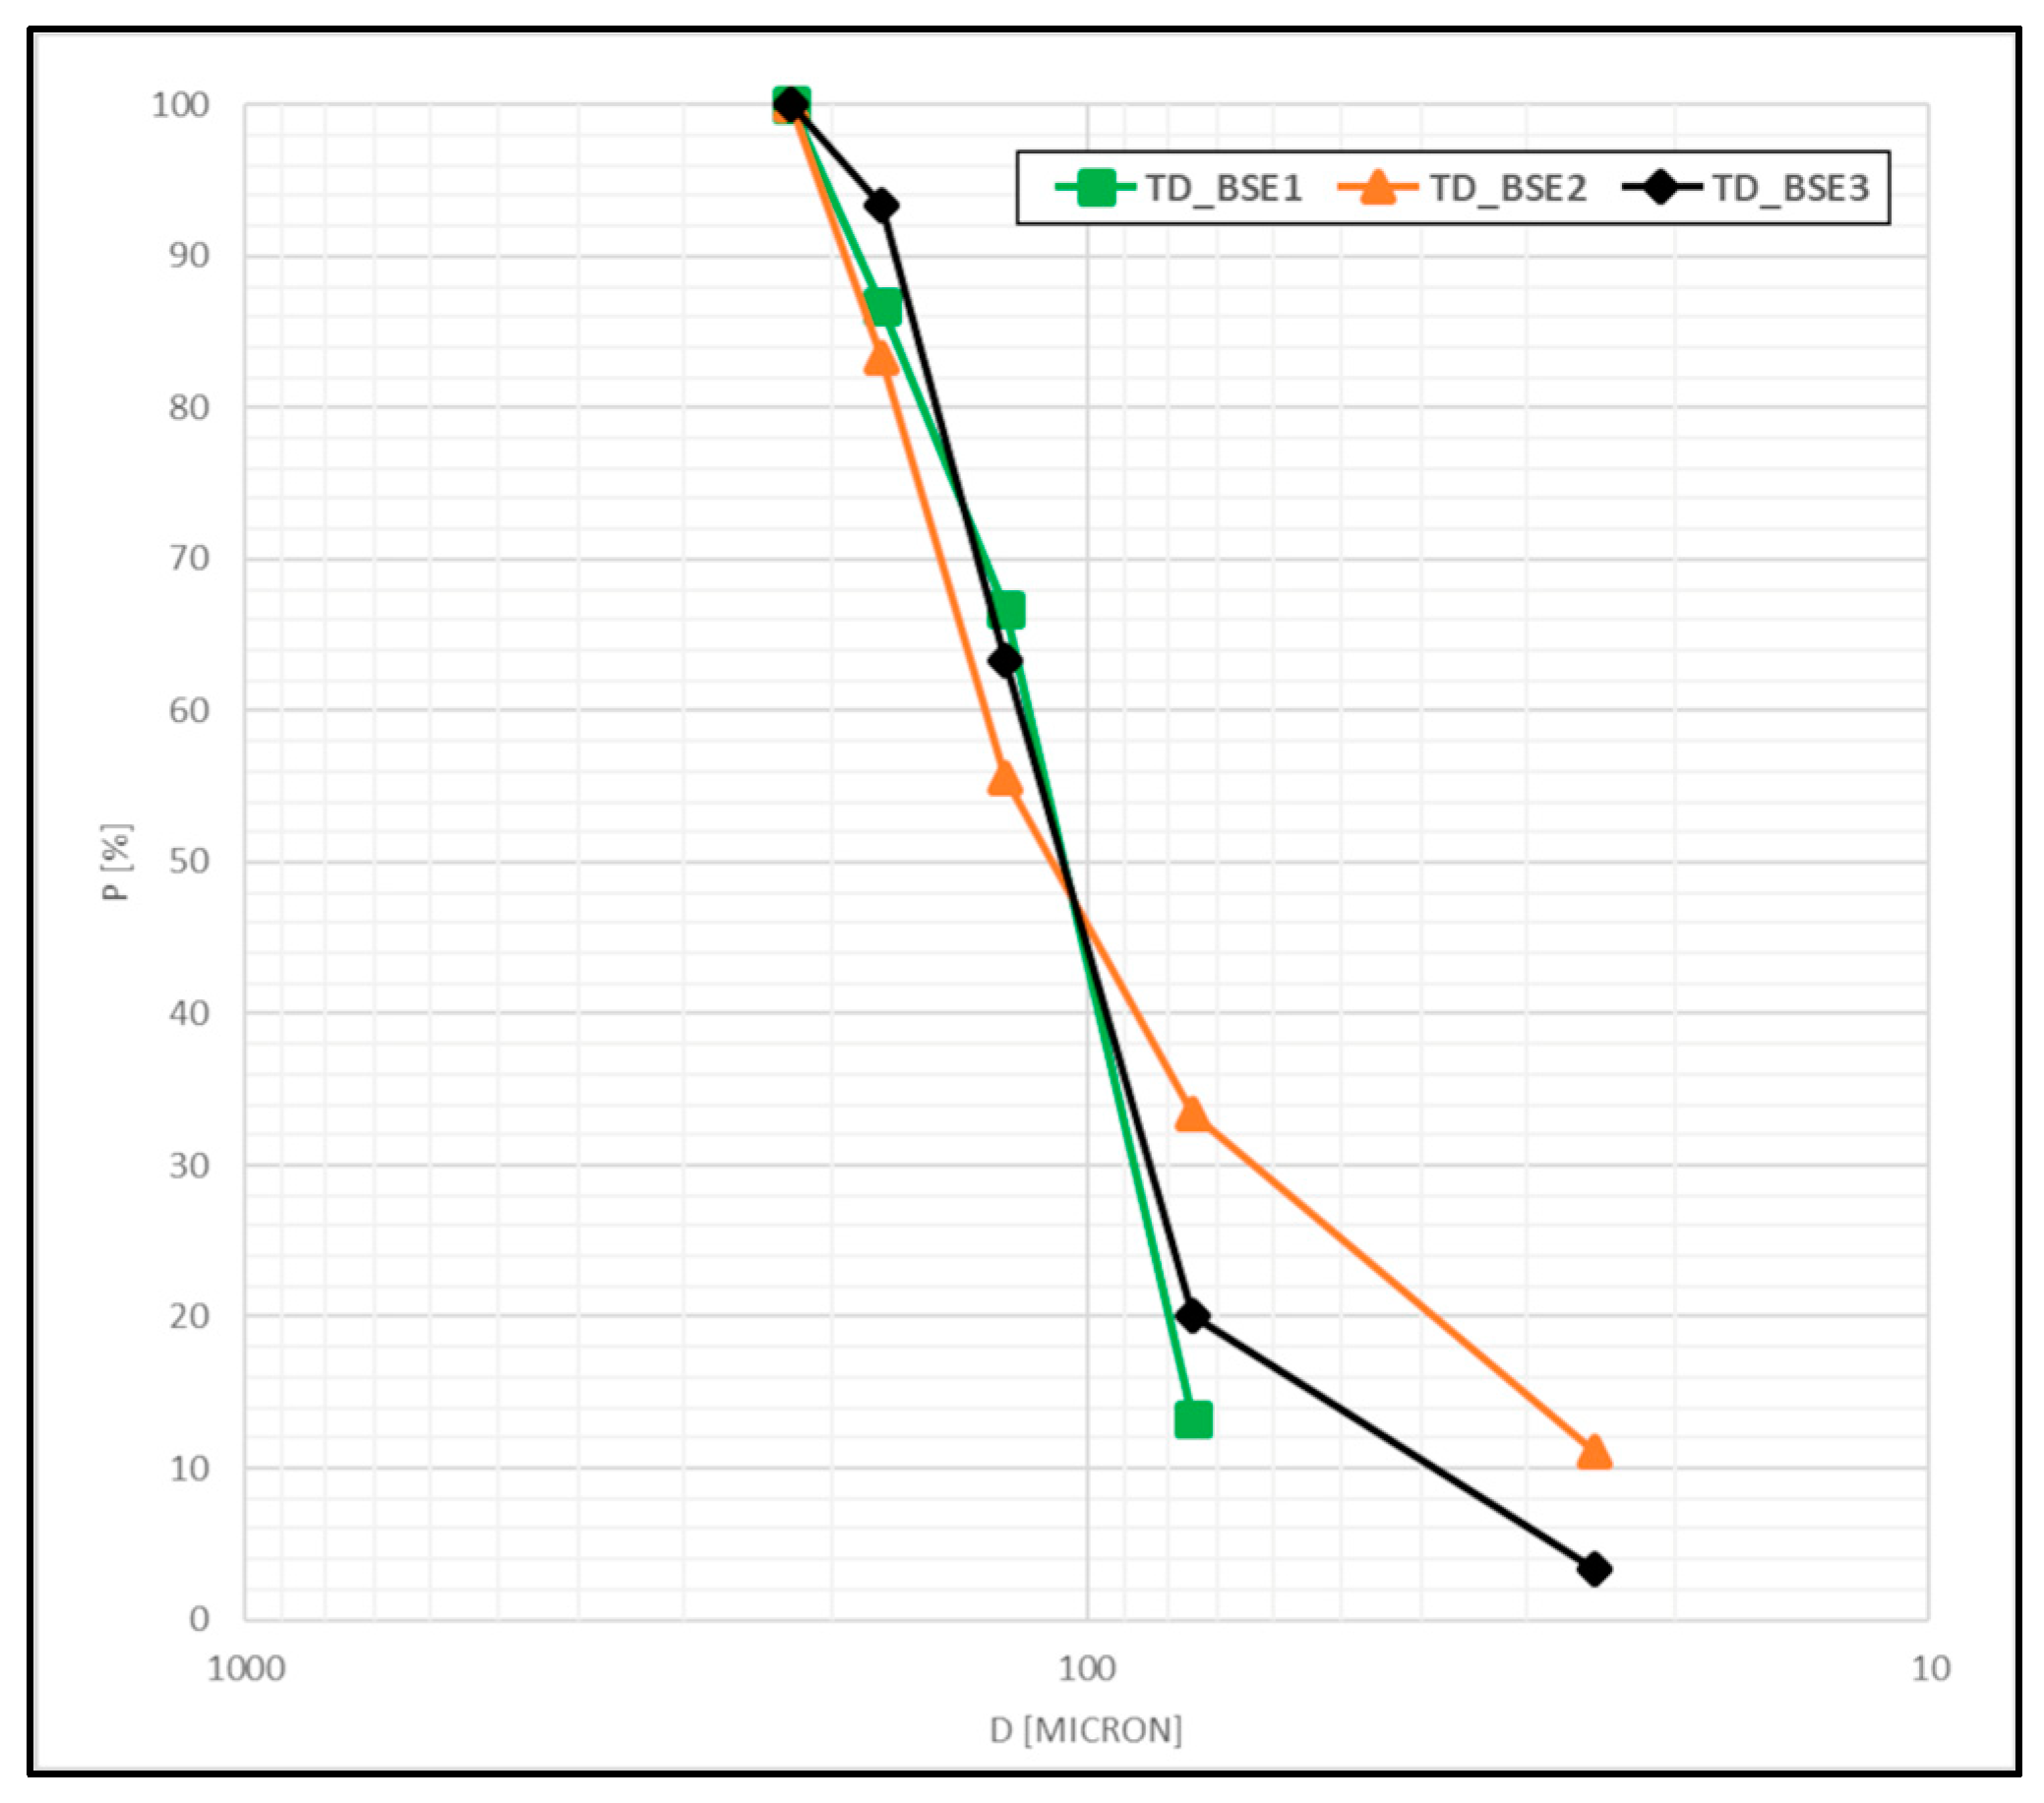
The liberated grain size was evaluated according to the equivalent diameter extrapolated from the identified areas of liberated magnetite grains, which are shown in Figure 14. According to this granulometric distribution, P80 and P50 were calculated for each sample, as reported in Table 6.
For P80, values ranged from 153 µm to 169 µm, with a mean value of 160 µm. For P50, values ranged from 109 µm to 113 µm, with a mean of 111 µm.

3.4. Separation Tests and Concentrate Characterization

The two size classes were subjected to separation tests based on their physical and chemical properties after the preliminary characterization.
The yield of each separation product was calculated according to the mass balance, considering a net calculation of losses. The Fe, Cu, and W grades were obtained using p-XRF analyses. XRPD analyses on concentrate were performed to qualitatively assess the mineralogy of the product. Table 7 summarizes the data collected for the separation tests performed.
The LIMS test performed on the 0.250–0.125 mm size class produced a magnetic concentrate (LIMS-M) with a yield of 26.8%, characterized by a high Fe grade of 66.2%, and a low W concentration of 47 ppm. XRPD analysis identified magnetite with the presence of gangue minerals such as talc and clinochlore. The non-magnetic products (LIMS-NM1 and LIMS-NM2) accounted for 73.2% of the LIMS output, with LIMS-NM1 being the most abundant, with a 67.5% yield. LIMS-NM1 and LIMS-NM2 products contained significantly lower grades of Fe (7.6 wt% and 12.3 wt%) but were characterized by a higher presence of W, respectively, at 218 ppm and 280 ppm. The mineralogy of these materials is characterized by andradite, amphibole, calcite, and dolomite. The Cu grade remained relatively constant across all LIMS outputs, ranging between 0.6% and 0.9%.
The gravity separation test performed by ST produced a heavy concentrate (ST-H) with a yield of 12.1%, characterized by high Fe and W grades of 67.6% and 1289 ppm, respectively. The mineralogical analysis of this concentrate highlighted the presence of magnetite and andradite, which is associated with the presence of gangue minerals such as clinochlore, talc, and quartz. Notably, scheelite was not identified by XRPD. The middling material (ST-M), which accounted for 55.3% of the output, had a moderate Fe grade of 22.2% and a W grade of 256 ppm, with a mineralogy that included silicates, carbonate, and magnetite. The light material (ST-L), accounting for 32.6% of the yield, was characterized by low Fe (12.3%) and W (119 ppm) contents but showed the highest Cu grade among the ST outputs at 1.1%. The mineralogy of the light concentrate included amphibole, talc, carbonates, and andradite.

3.5. Separation Outcomes Evaluation

Following the characterization of the output separation concentrates, ER was calculated for target metals (Fe, W, and Cu), as reported in Table 8.
The LIMS test produced a magnetic concentrate (LIMS-M) with an enrichment in the Fe grade of 2.8 times while showing very low ER values for W and Cu, 0.3 and 0.8, respectively. The non-magnetic products (LIMS-NM1 and LIMS-NM2) showed comparable results, with ER values for W ranging between 1.2 and 1.6, and for Cu, the values ranged between 1.1 and 1.3. Fe was poorly concentrated in LIMS-NM1 and LIMS-NM2 outputs with an ER of 0.3 and 0.5, respectively.
Gravimetric separation using ST produced a significant enrichment of Fe (2.8) and W (3.8) in the heavy concentrate (ST-H). The middling product (ST-M) showed no significant enrichment in any of the target elements analyzed. The light product (ST-L) showed a minimal concentration of Cu (1.3), while it was not enriched in Fe and W, with an ER of 0.5 and 0.4, respectively.
Table 9 shows the recovery rate (R) values calculated according to the mass balance and grades obtained (Table 7).
The LIMS test achieved a recovery rate of 75.4% for Fe in the magnetic LIMS-M product, with partial recovery of Cu (20.5%) and low recovery of W (7.2%). Most of the W and Cu recovered in the LIMS-NM1 concentrate, with recovery rates of 83.7% and 72.3%, respectively. The LIMS-M2 concentrate exhibited low recovery rates for all three target elements.
ST gravity separation recovered 46.3% of W and 33.4% of Fe in the ST-H product. The middling concentrate (ST-M) exhibited the highest recovery rates for Fe and Cu at 50.2% and 52.8%, respectively, while W recovery in this fraction was 42.1%. The light product (ST-L) accounted for 42.9% of Cu recovery, but Fe and W recovery rates were the lowest, at 16.4% and 11.6%, respectively.

4. Discussion and Conclusions

Mine waste and tailings could represent a potential opportunity to create alternative sources of CRMs and SRMs [14,15,16,17,18]. Due to the high mineralogical and chemical variability of these materials, detailed preliminary characterization and a tailored reprocessing solution could enhance the possibility of the successful recovery of raw materials [23,24,25].
This study investigated the possibility of recovering valuable CRM- and SRM-bearing minerals from waste dumps in the historical Traversella mine (Piedmont, Italy) district, considering the lack of studies in the literature on mine waste recovery potential in this region for officially reported dump areas [28,29].
Mineralogical and chemical characterizations of the collected samples from the Piano degli Svedesi area were performed and were in accordance with previous studies about characteristics of the Traversella’s ore bodies described by Costa et al. [32] and Nimis et al. [31].
The semi-automated liberation analysis using Matlab showed that in the 0.250–0.125 mm size class, about 86% of magnetite minerals were liberated. This method was proven to be a cost-effective alternative to commercial liberation analysis methods and appeared to be effective in accounting for the liberation grade of target minerals considered [53,54].
According to characterization, the primary target mineral was identified as magnetite, while scheelite, as a source of CRMs, was considered an accessory target mineral. Malachite was also considered a minor source of copper. The 0.250–0.125 mm size class was tested using LIMS to concentrate magnetic minerals and evaluate the potential enrichment of scheelite and malachite in the non-magnetic fraction. Additionally, gravimetric separation using ST was performed on this size class to explore concentration strategies for recovering magnetite and scheelite due to their high specific gravity.
In Figure 15, the grades of target elements and the recovery rates of different output products of LIMS and ST were compared. In addition, products showing an ER higher than one are highlighted.
Assessing the separation performances of the proposed methodologies, LIMS resulted in the production of a magnetic concentrate characterized by a high grade in Fe, recovering about 75% of the total available element in the feed and achieving a concentration 2.8 times that from the beginning. This was proved by mineralogy, in which magnetite was the predominant mineral in the output. Similarly, the non-magnetic product, especially Non-Magnetic 1, reached a recovery of about 85% of W, even if not enriched in this element, resulting in an overall grade (218 ppm) comparable to the original feed (204 ppm). Moreover, in the non-magnetic product, the Fe content decreased from 18.2% to 7.6%. For Cu, more than 75% of this metal was recovered in the LIMS_NM1 non-magnetic product, but no relevant enrichment was achieved (ER = 1.1).
These outcomes from LIMS separation tests highlight the good liberation achieved of magnetite from W-bearing and Cu-bearing minerals, remarking differences in the magnetic susceptibility between magnetite, scheelite and malachite, among other gangue minerals. These results seem to be consistent with the work of Nzeh et al. [55], which indicates that the effective separation between target minerals could be attributed to this physical characteristic.
ST produced a highly enriched heavy concentrate product, containing 67.6% of Fe and 1289 ppm of W, and showing an ER of 2.5 for Fe and 3.8 for W. Recovery rates remained limited only to 33.4% for Fe and 46.3% for W. The middling product did not succeed in enriching any of the target elements but recovered 50.2% of Fe, 42.1% of W, and 52.8% of Cu. In addition, a slight enrichment in W (1.3) and Cu (1.3) was obtained in the light fraction.
Gravity separation using ST showed typical behavior in enhancing the concentration of heavy minerals at the expense of yield and overall recovery, making it efficient in separating coarse light particles from small dense particles [42,56]. In addition, a small difference in density between magnetite (5.15 g/cm3) and scheelite (6.01 g/cm3) could result in the inefficient separation of these minerals, which is in agreement with the attempt to recover scheelite from iron-ore mine waste described by Mulenshi et al. [26].
The present study raises the possibility of recovering CRMs and SRMs from mine waste, promising domestic alternatives for their supply in the EU. However, this work comprised sample collection in a limited accessible sector of the Piano degli Svedesi dump site in the Traversella mine district. Indeed, scientific efforts should be addressed to a wider characterization of mine waste in this area.
Future work should be focused on the assessment of blended separation tests, combining LIMS to efficiently separate magnetite from scheelite and malachite. ST should be tested for the recovery of W-bearing minerals on the non-magnetic product of LIMS in order to enhance the recovery of heavier CRM-bearing minerals. In addition, alternative gravity separation methods, such as mineral jigs [57] or falcon concentrators [58] and froth flotation [59,60,61,62], should be considered for enhancing tungsten mineral recovery.

Supplementary Materials

The following supporting information can be downloaded at https://www.mdpi.com/article/10.3390/mining5020021/s1.

Author Contributions

Conceptualization, G.B. and P.M.; Data curation, G.B. and C.M.D.O.; Formal analysis, A.F. and P.M.; Funding acquisition, P.M.; Investigation, G.B. and C.M.D.O.; Methodology, G.B. and P.M.; Project administration, P.M.; Resources, P.M.; Software, G.B.; Supervision, A.F. and P.M.; Validation, A.F. and P.M.; Visualization, G.B., C.M.D.O. and P.M.; Writing—original draft, G.B. and C.M.D.O.; Writing—review and editing, A.F., R.B. and P.M. All authors have read and agreed to the published version of the manuscript.

Funding

This research was funded by the European Union Next-GenerationEU (PIANO NAZIONALE DI RIPRESA E RESILIENZA (PNRR)—MISSIONE 4 COMPONENTE 2, INVESTIMENTO 1.3—D.D. 1551.11-10-2022, PE00000004).

Data Availability Statement

The original contributions presented in this study are included in the article/Supplementary Material. Further inquiries can be directed to the corresponding author.

Acknowledgments

This study was carried out within the MICS (Made in Italy—Circular and Sustainable) Extended Partnership and received funding from the European Union Next-GenerationEU (PIANO NAZIONALE DI RIPRESA E RESILIENZA (PNRR)—MISSIONE 4 COMPONENTE 2, INVESTIMENTO 1.3–D.D. 1551.11-10-2022, PE00000004). This manuscript reflects only the authors’ views and opinions, neither the European Union nor the European Commission can be considered responsible for them.

Conflicts of Interest

The authors declare no conflicts of interest.

References

  1. Measham, T.; Walton, A.; Felton, S. Mining Heritage and Community Identity in the Social Licence of Proposed Renewed Mining. Extr. Ind. Soc. 2021, 8, 100891. [Google Scholar] [CrossRef]
  2. European Commission. Directorate General for Internal Market, Industry, Entrepreneurship and SMEs; MinPol. In Legal Framework for Mineral Extraction and Permitting Procedures for Exploration and Exploitation in the EU: Final Report; Publications Office: Luxembourg, 2016. [Google Scholar]
  3. European Commission. The European Green Deal; European Commission: Brussels, Belgium, 2019; Volume COM/2019/640 fina, p. 24. [Google Scholar]
  4. European Commission; Climate Action D.G. Going Climate-Neutral by 2050—A Strategic Long-Term Vision for a Prosperous, Modern, Competitive and Climate-Neutral EU Economy; Publications Office: Luxembourg, 2019; ISBN 978-92-76-02037-0. [Google Scholar]
  5. European Commission. A Green Deal Industrial Plan for the Net-Zero Age; European Commission: Brussels, Belgium, 2023; Volume COM/2023/62 final, p. 21. [Google Scholar]
  6. European Commission. Directorate General for Internal Market, Industry, Entrepreneurship and SMEs. In Study on the Critical Raw Materials for the EU 2023: Final Report; Publications Office: Luxembourg, 2023. [Google Scholar]
  7. European Commission. Directorate General for Internal Market, Industry, Entrepreneurship and SMEs. In Methodology for Establishing the EU List of Critical Raw Materials: Guidelines; Publications Office: Luxembourg, 2017. [Google Scholar]
  8. Hool, A.; Helbig, C.; Wierink, G. Challenges and Opportunities of the European Critical Raw Materials Act. Miner. Econ. 2024, 37, 661–668. [Google Scholar] [CrossRef]
  9. ISPRA-Istituto Superiore per la Protezione e la Ricerca Ambientale. Materie Prime Critiche: Ecco Quali e Dove si Trovano. Available online: https://www.isprambiente.gov.it/files2024/area-stampa/comunicati-stampa/comunicato-stampa-materie-prime.pdf (accessed on 5 March 2025).
  10. Disposizioni Urgenti Sulle Materie Prime Critiche di Interesse Strategico. Decreto-Legge No. 84. Gazzetta Ufficiale della Repubblica Italiana, 14 March 2024. Available online: https://www.gazzettaufficiale.it/eli/id/2024/06/25/24G00102/sg (accessed on 5 March 2025).
  11. European Commission. A Secure and Sustainable Supply of Critical Raw Materials in Support of the Twin Transition; European Commission: Brussels, Belgium, 2023; Volume COM/2023/165 final, p. 20. [Google Scholar]
  12. European Commission. Regulation (EU) 2024/1252 of the European Parliament and of the Council of 11 April 2024 Establishing a Framework for Ensuring a Secure and Sustainable Supply of Critical Raw Materials and Amending Regulations (EU) No 168/2013, (EU) 2018/858, (EU) 2018/1724 and (EU) 2019/1020; European Commission: Brussels, Belgium, 2023; Volume 2024/1252. [Google Scholar]
  13. Lucarini, M.; Fumanti, F.; Martarelli, L.; Serra, M. Policymaking and Geosciences: The Case of Critical Raw Materials in Italy. Eur. Geol. 2023, 56, 32–38. [Google Scholar] [CrossRef]
  14. Araya, N.; Ramírez, Y.; Kraslawski, A.; Cisternas, L.A. Feasibility of Re-Processing Mine Tailings to Obtain Critical Raw Materials Using Real Options Analysis. J. Environ. Manag. 2021, 284, 112060. [Google Scholar] [CrossRef] [PubMed]
  15. Rosario-Beltré, A.J.; Sánchez-España, J.; Rodríguez-Gómez, V.; Fernández-Naranjo, F.J.; Bellido-Martín, E.; Adánez-Sanjuán, P.; Arranz-González, J.C. Critical Raw Materials Recovery Potential from Spanish Mine Wastes: A National-Scale Preliminary Assessment. J. Clean. Prod. 2023, 407, 137163. [Google Scholar] [CrossRef]
  16. Maroušek, L.; Dollinger, S.; Elmer, S.; Öfner, W.; Nussbacher, H.; Melcher, F.; Flachberger, H. Re-Mining of Waste Rock Dumps from a Closed Lead–Zinc Mine—Characterisation of the Residuals. Minerals 2023, 13, 361. [Google Scholar] [CrossRef]
  17. Lottermoser, B.G. Introduction to Mine Wastes. In Mine Wastes; Springer: Berlin/Heidelberg, Germany, 2010; pp. 1–41. ISBN 978-3-642-12418-1. [Google Scholar]
  18. Yıldız, T.D. Opportunities for the Recovery of Rare Earth Elements from Mining Tailings and Urban Mining. In Trash or Treasure; Singh, P., Borthakur, A., Eds.; Springer Nature: Cham, Switzerland, 2024; pp. 183–205. ISBN 978-3-031-55130-7. [Google Scholar]
  19. Whitworth, A.J.; Forbes, E.; Verster, I.; Jokovic, V.; Awatey, B.; Parbhakar-Fox, A. Review on Advances in Mineral Processing Technologies Suitable for Critical Metal Recovery from Mining and Processing Wastes. Clean. Eng. Technol. 2022, 7, 100451. [Google Scholar] [CrossRef]
  20. Sarker, S.K.; Haque, N.; Bhuiyan, M.; Bruckard, W.; Pramanik, B.K. Recovery of Strategically Important Critical Minerals from Mine Tailings. J. Environ. Chem. Eng. 2022, 10, 107622. [Google Scholar] [CrossRef]
  21. Gomez, D.V.; Whitworth, A.J.; Vaughan, J.; Sultana, U.; Ledezma, P.; Parbhakar-Fox, A. Review on Developments in Technologies for Critical Metal Recovery from Mining and Processing Wastes. Miner. Process. Extr. Metall. Rev. 2024, 1–20. [Google Scholar] [CrossRef]
  22. Zinck, J.; Tisch, B.; Cheng, T.; Cameron, R. Mining Value from Waste Initiative: Towards a Low Carbon and Circular Economy. In REWAS 2019; Gaustad, G., Fleuriault, C., Gökelma, M., Howarter, J.A., Kirchain, R., Ma, K., Meskers, C., Neelameggham, N.R., Olivetti, E., Powell, A.C., et al., Eds.; The Minerals, Metals & Materials Series; Springer International Publishing: Cham, Switzerland, 2018; pp. 325–332. ISBN 978-3-030-10385-9. [Google Scholar]
  23. Bodénan, F.; Guezennec, A.-G.; Beaulieu, M.; Bellenfant, G.; Lemiere, B.; Lerouge, C.; Save, M. Re-Processing of Mine Tailings: Discussion on Case Studies. In Proceedings of the 13th SGA Biennal Meeting, Nancy, France, 24–27 August 2015; pp. 1–5. [Google Scholar]
  24. Abaka-Wood, G.B.; Zanin, M.; Addai-Mensah, J.; Skinner, W. Recovery of Rare Earth Elements Minerals from Iron Oxide–Silicate Rich Tailings—Part 1: Magnetic Separation. Miner. Eng. 2019, 136, 50–61. [Google Scholar] [CrossRef]
  25. Abaka-Wood, G.B.; Zanin, M.; Addai-Mensah, J.; Skinner, W. Recovery of Rare Earth Elements Minerals from Iron Oxide–Silicate Rich Tailings—Part 2: Froth Flotation Separation. Miner. Eng. 2019, 142, 105888. [Google Scholar] [CrossRef]
  26. Mulenshi, J.; Khavari, P.; Chelgani, S.C.; Rosenkranz, J. Characterization and Beneficiation Options for Tungsten Recovery from Yxsjöberg Historical Ore Tailings. Processes 2019, 7, 895. [Google Scholar] [CrossRef]
  27. Mehta, N.; Dino, G.; Passarella, I.; Ajmone-Marsan, F.; Rossetti, P.; Luca, D.D. Assessment of the Possible Reuse of Extractive Waste Coming from Abandoned Mine Sites: Case Study in Gorno, Italy. Sustainability 2020, 12, 2471. [Google Scholar] [CrossRef]
  28. ISPRA-Istituto Superiore per la Protezione e la Ricerca Ambientale. Inventario Nazionale Delle Strutture Di Deposito Di Rifiuti Estrattivi, Chiuse o Abbandonate, Di Tipo A. Rapporto Di Aggiornamento 2017; ISPRA: Roma, Italy, 2017; p. 33.
  29. ISPRA-Istituto Superiore per la Protezione e la Ricerca Ambientale. Inventario Nazionale Delle Strutture Di Deposito Di Rifiuti Estrattivi, Chiuse o Abbandonate, Di Tipo A. Rapporto Di Aggiornamento 2022; ISPRA: Roma, Italy, 2022; p. 49.
  30. Turi, B.; Zucchetti, S. Indagine Isotopica Sui Processi Minerogenetici Nel Giacimento Di Traversella (Torino). Geoing. Ambient. E Mineraria 1978, 15, 42–53. [Google Scholar]
  31. Nimis, P.; Costa, L.D.; Guastoni, A. Cobaltite-Rich Mineralization in the Iron Skarn Deposit of Traversella (Western Alps, Italy). Mineral. Mag. 2014, 78, 11–27. [Google Scholar] [CrossRef]
  32. Costa, E.; Dino, G.A.; Benna, P.; Rossetti, P. The Traversella Mining Site as Piemonte Geosite. Geoheritage 2019, 11, 55–70. [Google Scholar] [CrossRef]
  33. Le Miniere Di Ferro Di Traversella e Brosso. Available online: https://sites.google.com/view/miniere-italia/regioni/piemonte/metalliferi/miniere-di-ferro-di-traversella-e-brosso (accessed on 5 March 2025).
  34. Respino, D. Traversella—Miniere, Minatori, Minerali; First; Giove Editrice s.r.l.: Torino, Italia, 2024. [Google Scholar]
  35. Matteucci, E. Tenori e distribuzione degli elementi del gruppo delle Terre rare nella Scheelite di Traversella. In Proceedings of the Symposium Internazionale Sui Giacimenti Minerari delle Alpi, Trento, Italy, 11–18 September 1966; Arti Grafiche “Saturnia”—Trento: Trento, Italy, 1966; Volume 2, pp. 689–704. [Google Scholar]
  36. Gruppo Mineralogico Valchiusella La scheelite di Traversella. Available online: https://drive.google.com/file/d/12BfddB_jgQJmxDyz7516QEqH-TZPlk6o/view (accessed on 5 March 2025).
  37. Omori, M. Powder X-Ray Diffraction Basic Course Second Installment: Selection of Equipment Configuration to Obtain High-Quality Data. Rigaku J. 2021, 37, 2021. [Google Scholar]
  38. Kabekkodu, S.N.; Dosen, A.; Blanton, T.N. PDF-5+: A Comprehensive Powder Diffraction FileTM for Materials Characterization. Powder Diffr. 2024, 39, 47–59. [Google Scholar] [CrossRef]
  39. Grant, D.C.; Goudie, D.J.; Shaffer, M.; Sylvester, P. A Single-Step Trans-Vertical Epoxy Preparation Method for Maximising Throughput of Iron-Ore Samples via SEM-MLA Analysis. Trans. Inst. Min. Metall. Sect. B Appl. Earth Sci. 2016, 125, 57–62. [Google Scholar] [CrossRef]
  40. The Mathworks Inc. MATLAB; The MathWorks, Inc.: Natick, MA, USA, 2024. [Google Scholar]
  41. The MathWorks Inc. MATLAB Image Processing Toolbox; The MathWorks, Inc.: Natick, MA, USA, 2024. [Google Scholar]
  42. Wills, B.A.; Finch, J.A. Wills’ Mineral Processing Technology: An Introduction to the Practical Aspects of Ore Treatment and Mineral Recovery; Elsevier Inc.: Amsterdam, The Netherlands, 2015; ISBN 978-0-08-097053-0. [Google Scholar]
  43. Warr, L.N. IMA-CNMNC Approved Mineral Symbols. Mineral. Mag. 2021, 85, 291–320. [Google Scholar] [CrossRef]
  44. Awahara, A.; Ohno, M.; Takano, Y. Structural Study of the Amphibole in Volcanic Tuff. Sci. Pap. Coll. Gen. Educ. Univ. Tokyo 1972, 22, 67–78. [Google Scholar]
  45. Mg, Z.; Sawada, H. Electron Density Study of Garnets. J. Solid State Chem. 1999, 142, 273–278. [Google Scholar] [CrossRef]
  46. Wartchow, R. Datensammlung Nach Der “Learnt Profile”-Methode(LP) Fuer Calcit Und Vergleich Mit Der “Background Peak Background”-Methode (BPB). Z. Krist. 1989, 186, 300–302. [Google Scholar]
  47. Joswig, W.; Fuess, H. Refinement of a One-Layer Triclinic Chlorite. Clays Clay Min. 1990, 38, 216–218. [Google Scholar] [CrossRef]
  48. Finger, L.W.; Hazen, R.M.; Hofmeister, A.M. High-Pressure Crystal Chemistry of Spinel (MgAI204) and Magnetite (Fe304): Comparisons with Silicate Spinels. Phys Chem Miner. 1986, 13, 215–220. [Google Scholar] [CrossRef]
  49. Norby, P. Synchrotron Powder Diffraction Using Imaging Plates: Crystal Structure Determination and Rietveld Refinement. J. Appl. Cryst. 1997, 30, 21–30. [Google Scholar] [CrossRef]
  50. Rayner, J.H.; Brown, G. The crystal structure of talc. Clays Clay Miner. 1973, 21, 103–114. [Google Scholar] [CrossRef]
  51. Zucchini, A.; Comodi, P.; Katerinopoulou, A.; Balic-Zunic, T.; McCammon, C.; Frondini, F. Order-Disorder-Reorder Process in Thermally Treated Dolomite Samples: A Combined Powder and Single-Crystal X-Ray Diffraction Study. Phys. Chem. Miner. 2012, 39, 319–328. [Google Scholar] [CrossRef]
  52. Krinsley, D.H.; Pye, K.; Boggs, S., Jr.; Tovey, N.K. Backscattered Scanning Electron Microscopy and Image Analysis of Sediments and Sedimentary Rocks; Cambridge University Press: Cambridge, UK, 1998; ISBN 978-0-521-45346-2. [Google Scholar]
  53. Madiba, M.; Mulenga, F.K.; Hildebrandt, D.; Madiba, M.S. Procedure for Quantitative Evaluation of Mineral Liberation. In Proceedings of the Computational Modelling’19, Falmouth, UK, 11–12 June 2019. [Google Scholar]
  54. Camalan, M.; Çavur, M.; Hoşten, Ç. Assessment of Chromite Liberation Spectrum on Microscopic Images by Means of a Supervised Image Classification. Powder Technol. 2017, 322, 214–225. [Google Scholar] [CrossRef]
  55. Nzeh, N.S.; Popoola, P.A. Physical Beneficiation of Heavy Minerals—Part 2: A State of the Art Literature Review on Magnetic and Electrostatic Concentration Techniques. Heliyon 2024, 10, e32201. [Google Scholar] [CrossRef]
  56. Nzeh, N.S.; Popoola, P.; Okanigbe, D.; Adeosun, S.; Adeleke, A. Physical Beneficiation of Heavy Minerals—Part 1: A State of the Art Literature Review on Gravity Concentration Techniques. Heliyon 2023, 9, e18919. [Google Scholar] [CrossRef] [PubMed]
  57. Baek, S.-H.; Jeon, H.-S. Application of Jig Separation for Pre-Concentration of Low-Grade Scheelite Ore. Mater. Trans. 2018, 59, 494–498. [Google Scholar] [CrossRef]
  58. Das, S.K.; Kundu, T.; Dash, N.; Angadi, S.I. Separation Behavior of Falcon Concentrator for the Recovery of Ultrafine Scheelite Particles from the Gold Mine Tailings. Sep. Purif. Technol. 2023, 309, 123065. [Google Scholar] [CrossRef]
  59. Kupka, N.; Rudolph, M. Froth Flotation of Scheelite—A Review. Int. J. Min. Sci. Technol. 2018, 28, 373–384. [Google Scholar] [CrossRef]
  60. Han, Z.; Golev, A.; Edraki, M. A Review of Tungsten Resources and Potential Extraction from Mine Waste. Minerals 2021, 11, 701. [Google Scholar] [CrossRef]
  61. Mohammadnejad, S.; Noaparast, M.; Hosseini, S.; Aghazadeh, S.; Mousavinezhad, S.; Hosseini, F. Physical Methods and Flotation Practice in the Beneficiation of a Low Grade Tungsten-Bearing Scheelite Ore. Russ. J. Non-Ferr. Met. 2018, 59, 6–15. [Google Scholar] [CrossRef]
  62. Yang, X. Beneficiation Studies of Tungsten Ores—A Review. Miner. Eng. 2018, 125, 111–119. [Google Scholar] [CrossRef]
Figure 1. Buildings of Traversella’s old processing plant (blue line), the Piano degli Svedesi area (red line), and sampling location (green star) (WGS84/UTM Zone 32N coordinates).
Mining 05 00021 g001
Figure 2. (a) Photograph of the sampling area with an imaginary 3 × 3 grid overlaid on the image. (b) Close-up of sampling site Section #4 (Photos credit: Baldassarre G.).
Mining 05 00021 g002
Figure 3. Detail of a portion of a waste rock sample collected from the Piano degli Svedesi dump site. (Photo credit: Baldassarre G.).
Mining 05 00021 g003
Figure 4. Sample preparation and separation testing procedure layout.
Mining 05 00021 g004
Figure 5. Optical microscopy of thin section images in parallel transmitted light (PL) and cross-polarized transmitted light (XPL): (a) thin section nr. 1 in PL; (b) thin section nr. 1 in XPL; (c) thin section nr.2 in PL; and (d) thin section nr.2 in XPL. Identified minerals: Ap—apatite, Mag—magnetite, Tlc—talc, Chl—chlorite, Lz—lizardite (abbreviation according to [43]).
Mining 05 00021 g005
Figure 6. Optical microscopy thin section images in parallel transmitted light (PL) and cross-polarized transmitted light (XPL): (a) thin section nr. 3 in PL; (b) thin section nr. 3 in XPL. Identified minerals: Ap—apatite, Mag—magnetite, Tlc—talc, Chl—chlorite, Lz—lizardite, Mlc—malachite (abbreviation according to [43]).
Mining 05 00021 g006
Figure 7. X-Ray powder diffraction (XRPD) spectra of the bulk-sampled material.
Mining 05 00021 g007
Figure 8. XRPD spectra for separation feeds 0.250–0.125 mm size class.
Mining 05 00021 g008
Figure 9. (a) SEM-BSE image from epoxy-mounted samples of the granulometric size class 0.25–0.125 mm (yellow dot: pyrite grain; blue dot: magnetite grain; green dot: gangue mineral grain); (b) EDS spectrum and quantification for pyrite (yellow dot); (c) EDS spectrum and quantification for magnetite (blue dot); (d) EDS spectrum and quantification for silicate gangue mineral (green dot).
Mining 05 00021 g009
Figure 10. SEM-BSE images, EDS spectra, and EDS quantification with size class 0.250–0.125 mm: (a) scheelite grain; (b) EDS spectrum and quantification for scheelite; (c) malachite grain; and (d) EDS spectrum and quantification for malachite.
Mining 05 00021 g010
Figure 11. (a) SEM-BSE image from epoxy-mounted samples of the granulometric size class 0.25–0.125 mm; (b) binary mask for magnetite-bearing minerals; and (c) binary mask for gangue minerals associated with magnetite.
Mining 05 00021 g011
Figure 12. TD-BSE2 sample BSE image of 0.250–0.125 mm material with grain contours overlapping (green contours: magnetite; red contours: gangue).
Mining 05 00021 g012
Figure 13. Liberation characteristics of magnetite in size class 0.250–0.125 mm obtained from BSE image fields TD_BSE1, TD_BSE2, and TD_BSE3, and average liberation values.
Mining 05 00021 g013
Figure 14. Liberated magnetite-free grain size distribution calculated with an equivalent diameter from image analysis.
Mining 05 00021 g014
Figure 15. Grade of output product as a function of the recovery rate for the metals assayed (Fe, W, and Cu). ER is shown only for values higher than 1 (assuming an upgrade in the concentration) for the separation test performed on size class 0.250–0.125 mm.
Mining 05 00021 g015
Table 1. Identified mineral phases in XRPD analysis on bulk-sampled materials before processing.
Mineral PhasePeak Positions (2θ, °)Reference
Amphibole10.48, 28.47, 33.09[44]
Andradite29.60, 33.19, 57.10[45]
Calcite29.41, 47.53, 48.52[46]
Clinochlore6.20, 12.42, 24.99[47]
Magnetite30.15, 35.51, 62.68[48]
Quartz20.86, 26.64, 50.15[49]
Talc9.45, 19.54, 28.60[50]
Table 2. Portable XRF analytical results for the initial material.
SampleAlAsCaCoCuFeHgKMgMnNbPPbSSiSrTiWYZnZr
(%)(ppm)(%)(ppm)(%)(%)(ppm)(ppm)(%)(ppm)(ppm)(%)(ppm)(ppm)(%)(ppm)(ppm)(ppm)(ppm)(ppm)(ppm)
Mine waste1.81864.0621.316.9333411.41235121.554260717.2285449655682
Table 3. Weight fractions of obtained size classes after crushing, milling, and sieving processes.
Size Class (mm)Mass Rate (%)
>0.2505.6
0.125–0.25042.3
<0.12552.1
Table 4. XRPD results for separation feed materials.
Size Class (mm)Mineral PhasePeak Positions (2θ, °)Reference
0.250–0.125Amphibole10.48, 28.47, 33.09[44]
Andradite29.60, 33.19, 57.10[45]
Calcite29.41, 47.53, 48.52[46]
Clinochlore6.20, 12.42, 24.99[47]
Dolomite30.87, 41.06, 50.94[51]
Magnetite30.15, 35.51, 62.68[48]
Quartz20.86, 26.64, 50.15[49]
Talc9.45, 19.54, 28.60[50]
Table 5. P-XRF chemical data for separation of feeding materials.
Size Class (mm)AlAsCaCoCuFeHgKMgMnNb
(%)(ppm)(%)(ppm)(%)(%)(ppm)(ppm)(%)(ppm)(ppm)
0.250–0.1251.91987.61191.318.3681510.2269716
PPbRbSSiSrTiWYZnZr
(%)(ppm)(ppm)(ppm)(%)(ppm)(ppm)(ppm)(ppm)(ppm)(ppm)
1.31807694215.747469204658144
Table 6. Liberated grain size analysis percentiles calculated from granulometric distributions.
PercentileTD-BSE1 (µm)TD-BSE2 (µm)TD-BSE3 (µm)Mean (µm)
P80158169153160
P50109113110111
Table 7. Yield, target element grade (p-XRF), and qualitative XRPD mineralogical characterization of LIMS and ST concentrates.
SeparatorOutputY (%)Metal Assay (p-XRF)Mineralogy (XRPD) 1
Fe (%)W (ppm)Cu (%)
LIMSNM167.57.62180.8Adr, Amp, Cal, Clc, Dol, Lz, Qz, Tlc;
NM25.712.32800.9Adr, Amp, Clc, Dol, Mag, Qz, Tlc;
M26.866.2470.6Clc, Mag, Tlc.
STH12.167.612890.3Adr, Clc, Mag, Qz, Tlc;
M55.322.22560.8Adr, Amp, Cal, Clc, Di, Dol, Mag, Qz, Tlc;
L32.612.31191.1Adr, Amp, Cal, Clc, Di, Dol, Qz, Tlc.
1 Adr = andradite; Amp = amphibole; Cal = calcite; Clc = clinochlore; Di = diopside; Dol = dolomite; Lz = lizardite; Mag = magnetite; Qz = quartz; Tlc = talc. (abbreviations according to [43]).
Table 8. ER values for separation concentrates obtained after LIMS and ST.
SeparatorOutputERFeERWERCu
LIMSNM10.31.21.1
NM20.51.61.3
M2.80.30.8
STH2.83.80.4
M0.90.81.0
L0.50.41.3
Table 9. Recovery (R) rates for Fe, W, and Cu across separation concentrates.
SeparatorOutputRFe (%)RW (%)RCu (%)
LIMSNM121.683.772.3
NM23.09.17.2
M75.47.220.5
STH33.446.34.3
M50.242.152.8
L16.411.642.9
Disclaimer/Publisher’s Note: The statements, opinions and data contained in all publications are solely those of the individual author(s) and contributor(s) and not of MDPI and/or the editor(s). MDPI and/or the editor(s) disclaim responsibility for any injury to people or property resulting from any ideas, methods, instructions or products referred to in the content.

