Abstract
The reclamation of waste rock piles (WRPs) is complex, requiring adaptation of existing mine site reclamation techniques. An alternative approach has been developed for waste rock piles reclamation which involves installing finer materials on the top of waste rock piles. These finer layers (flow control layers—FCLs) redirect water flowing inside the pile toward its slope and limits water infiltration into reactive waste rocks. In the context of sustainable development, a mixture material made with sludge and slag can be used as an FCL in the reclamation of a waste rock pile. To assess the effectiveness of this material, a physical model was used and instrumented with sensors for monitoring volumetric water content and suction and equipped with the following components: (1) a rain simulator; and (2) drains that allow the recovery of water that infiltrates through the system. The physical model was tested with various cover layer thicknesses, inclinations, and precipitation rates. Investigation results showed that the water infiltration across the system was very low, leading to the conclusion that the sludge and slug mixture performed well as a flow control layer in the reclamation of waste rock piles.
1. Introduction
Quémont 2 tailings storage facility (TSF) is an active site located approximately 2.5 km northeast of the Horne smelter plant, positioned between Osisko and Dufault Lakes, as illustrated in Figure 1. Its area is estimated to be 105 hectares. Deposition of tailings at this TSF began in 1949. Initially, sulfide tailings, which contributed to acidity, were deposited at this site. Subsequently, they were overlaid with a mixture of slag tailings and treatment sludge (UTAF sludge), which did not produce acidity. Between 1949 and 2018, approximately 7.6 Mt of sulfide tailings, 14.2 Mt of slag, and 1.1 Mt of UTAF sludge were deposited. These materials originated from the Quémont mine, the Gallen mine, and the slag and hydrometallurgical treatment (UTAF) circuit [1]. It is important to note that some of these materials may contribute to acid mine drainage.
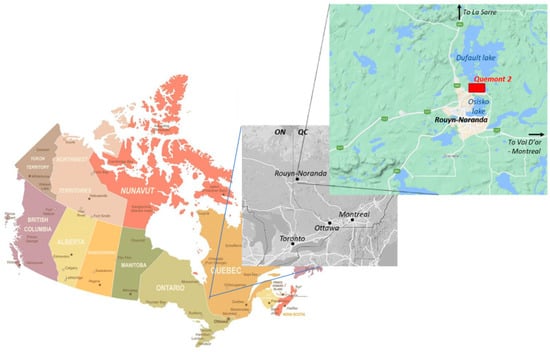
Figure 1.
Quémont 2 mine site location (https://mapamundi.online maps images, accessed on 11 July 2024).
Acid mine drainage (AMD) is widely acknowledged as one of the foremost environmental challenges linked with the mining industry. To limit the generation of AMD, numerous waste management options and site reclamation strategies are available. Among these approaches, one can find oxygen barrier and hydraulic barrier covers [2].
Indeed, store and release covers (SRCs) represent another approach used to control water infiltration into reactive tailings, particularly in arid environments [3,4,5,6].
In the context of sustainable development, the aim is to utilize sludge and slag materials derived from metallurgical treatment by integrating them into construction materials for engineering covers, especially as flow control layers (FCLs). To achieve this objective, this study intends to test sludge and slag materials as FCLs using a physical model. The study will involve varying the layer thickness, the slope, and the intensity of precipitation to assess their effects on cover performance. It is important to recall that the sludge and slag materials were tested to evaluate their geochemistry using humidity cells kinetic tests, and results showed that these materials can be considered as not AMD generating with the pH close to the neutrality [7].
In this paper, we begin with an overview of mine site reclamation techniques followed by the sludge and slag material characterizations, along with descriptions of the physical model configurations used in our study. Subsequently, investigation results obtained from physical and numerical modeling are presented. Finally, this paper ends by a conclusion.
1.1. Mine Site Reclamation
The reclamation of mine sites is indeed a crucial aspect of mining practices, with the primary goal of minimizing the environmental impact caused by mining activities. The reclamation of mine sites is indeed a crucial aspect of mining practices, with the primary goal of minimizing the environmental impact caused by mining activities.
One of the principal purposes of reclamation methods is to mitigate AMD by eliminating or reducing the presence of reactive elements involved in the acidification process, as presented in Equation (1):
FeS2 + 15/4 O2 + 7/2 H2O→Fe(OH)3 + 2SO4 2− + 4H+
Various methods of the prevention and control of AMD are available, and the selection of the most suitable method depends on the specific characteristics of each mine site. Below is a summary of the major methods used for the prevention and control of AMD.
1.1.1. Oxygen Barrier
The objective of this method is to minimize or prevent the oxygen flow towards sulfide tailings. There are several techniques commonly used to exclude oxygen to achieve this objective, including the following ones [2]:
- Water covers can effectively act as an oxygen barrier due to the lower concentration of oxygen and the lower diffusion coefficient in water compared to in air [8,9];
- The elevated water table combined with a monolayer cover technique aims to maintain reactive tailings saturated or close to saturation (Sr = 1) by keeping the water table at a higher level and close to interface cover-reactive tailings. This technique is similar to water covers in that it provides a barrier to oxygen migration [10,11,12];
- Covers with a capillary barrier effect (CCBEs) are multilayer covers whose aim is to maintain at least one of the layers at a high degree of saturation (Sr > 85%) to control the migration of gases to reactive waste and limit water infiltration [13,14,15];
- Oxygen-consuming materials (wood chips water, treatment sludge, etc.) can also control oxygen migration by placing them on reactive tailings. Oxygen-consuming materials limit the availability of oxygen that can reach underlying materials [16,17].
1.1.2. Hydraulic Barrier
In contrast, hydraulic barriers are specifically designed to prevent water infiltration. In regions with humid climates, these barriers can be constructed using a combination of natural and/or synthetic materials. Examples of such materials include clay, geosynthetic clay liners, and geomembranes.
This method relies on the installation of covers composed of materials with a saturated hydraulic conductivity (ksat) lower than 1 × 10⁻⁹ m/s. These covers typically made from natural soils such as clays or compacted tills, as well as synthetic materials (geotextiles, geomembranes, or geosynthetic clay liners), act as physical barriers to control water infiltration into mine waste [2,18,19,20].
1.1.3. Flow Control Layer
This method aims to limit water infiltration into waste rocks by redirecting precipitation water along inclined layers. Precipitation is temporarily stored in a flow control layer (FCL) and then evacuated by evaporation or lateral drainage, thereby preventing the contact with waste rock materials [21,22,23,24,25].
Various laboratory work and numerical modeling have validated the effectiveness of this method, including experiments conducted on waste rock piles of Lake Tio Mine. Factors such climatic conditions, the thickness of the FCL, inclination, and cover material properties influence the FCL performance [26,27,28,29,30].
The FCL will be tested in a laboratory by using a mixture material made from sludge and slag.
In the following sections, materials and methods used in this evaluation are presented.
2. Materials and Methods
The material was both physically and hydrogeologically tested in a laboratory. Physical characterization included assessing particle size distribution and specific gravity, while hydrogeological characterization involved determining parameters such as saturated hydraulic conductivity (ksat) and the water retention curve (WRC).
2.1. Physical Characterization
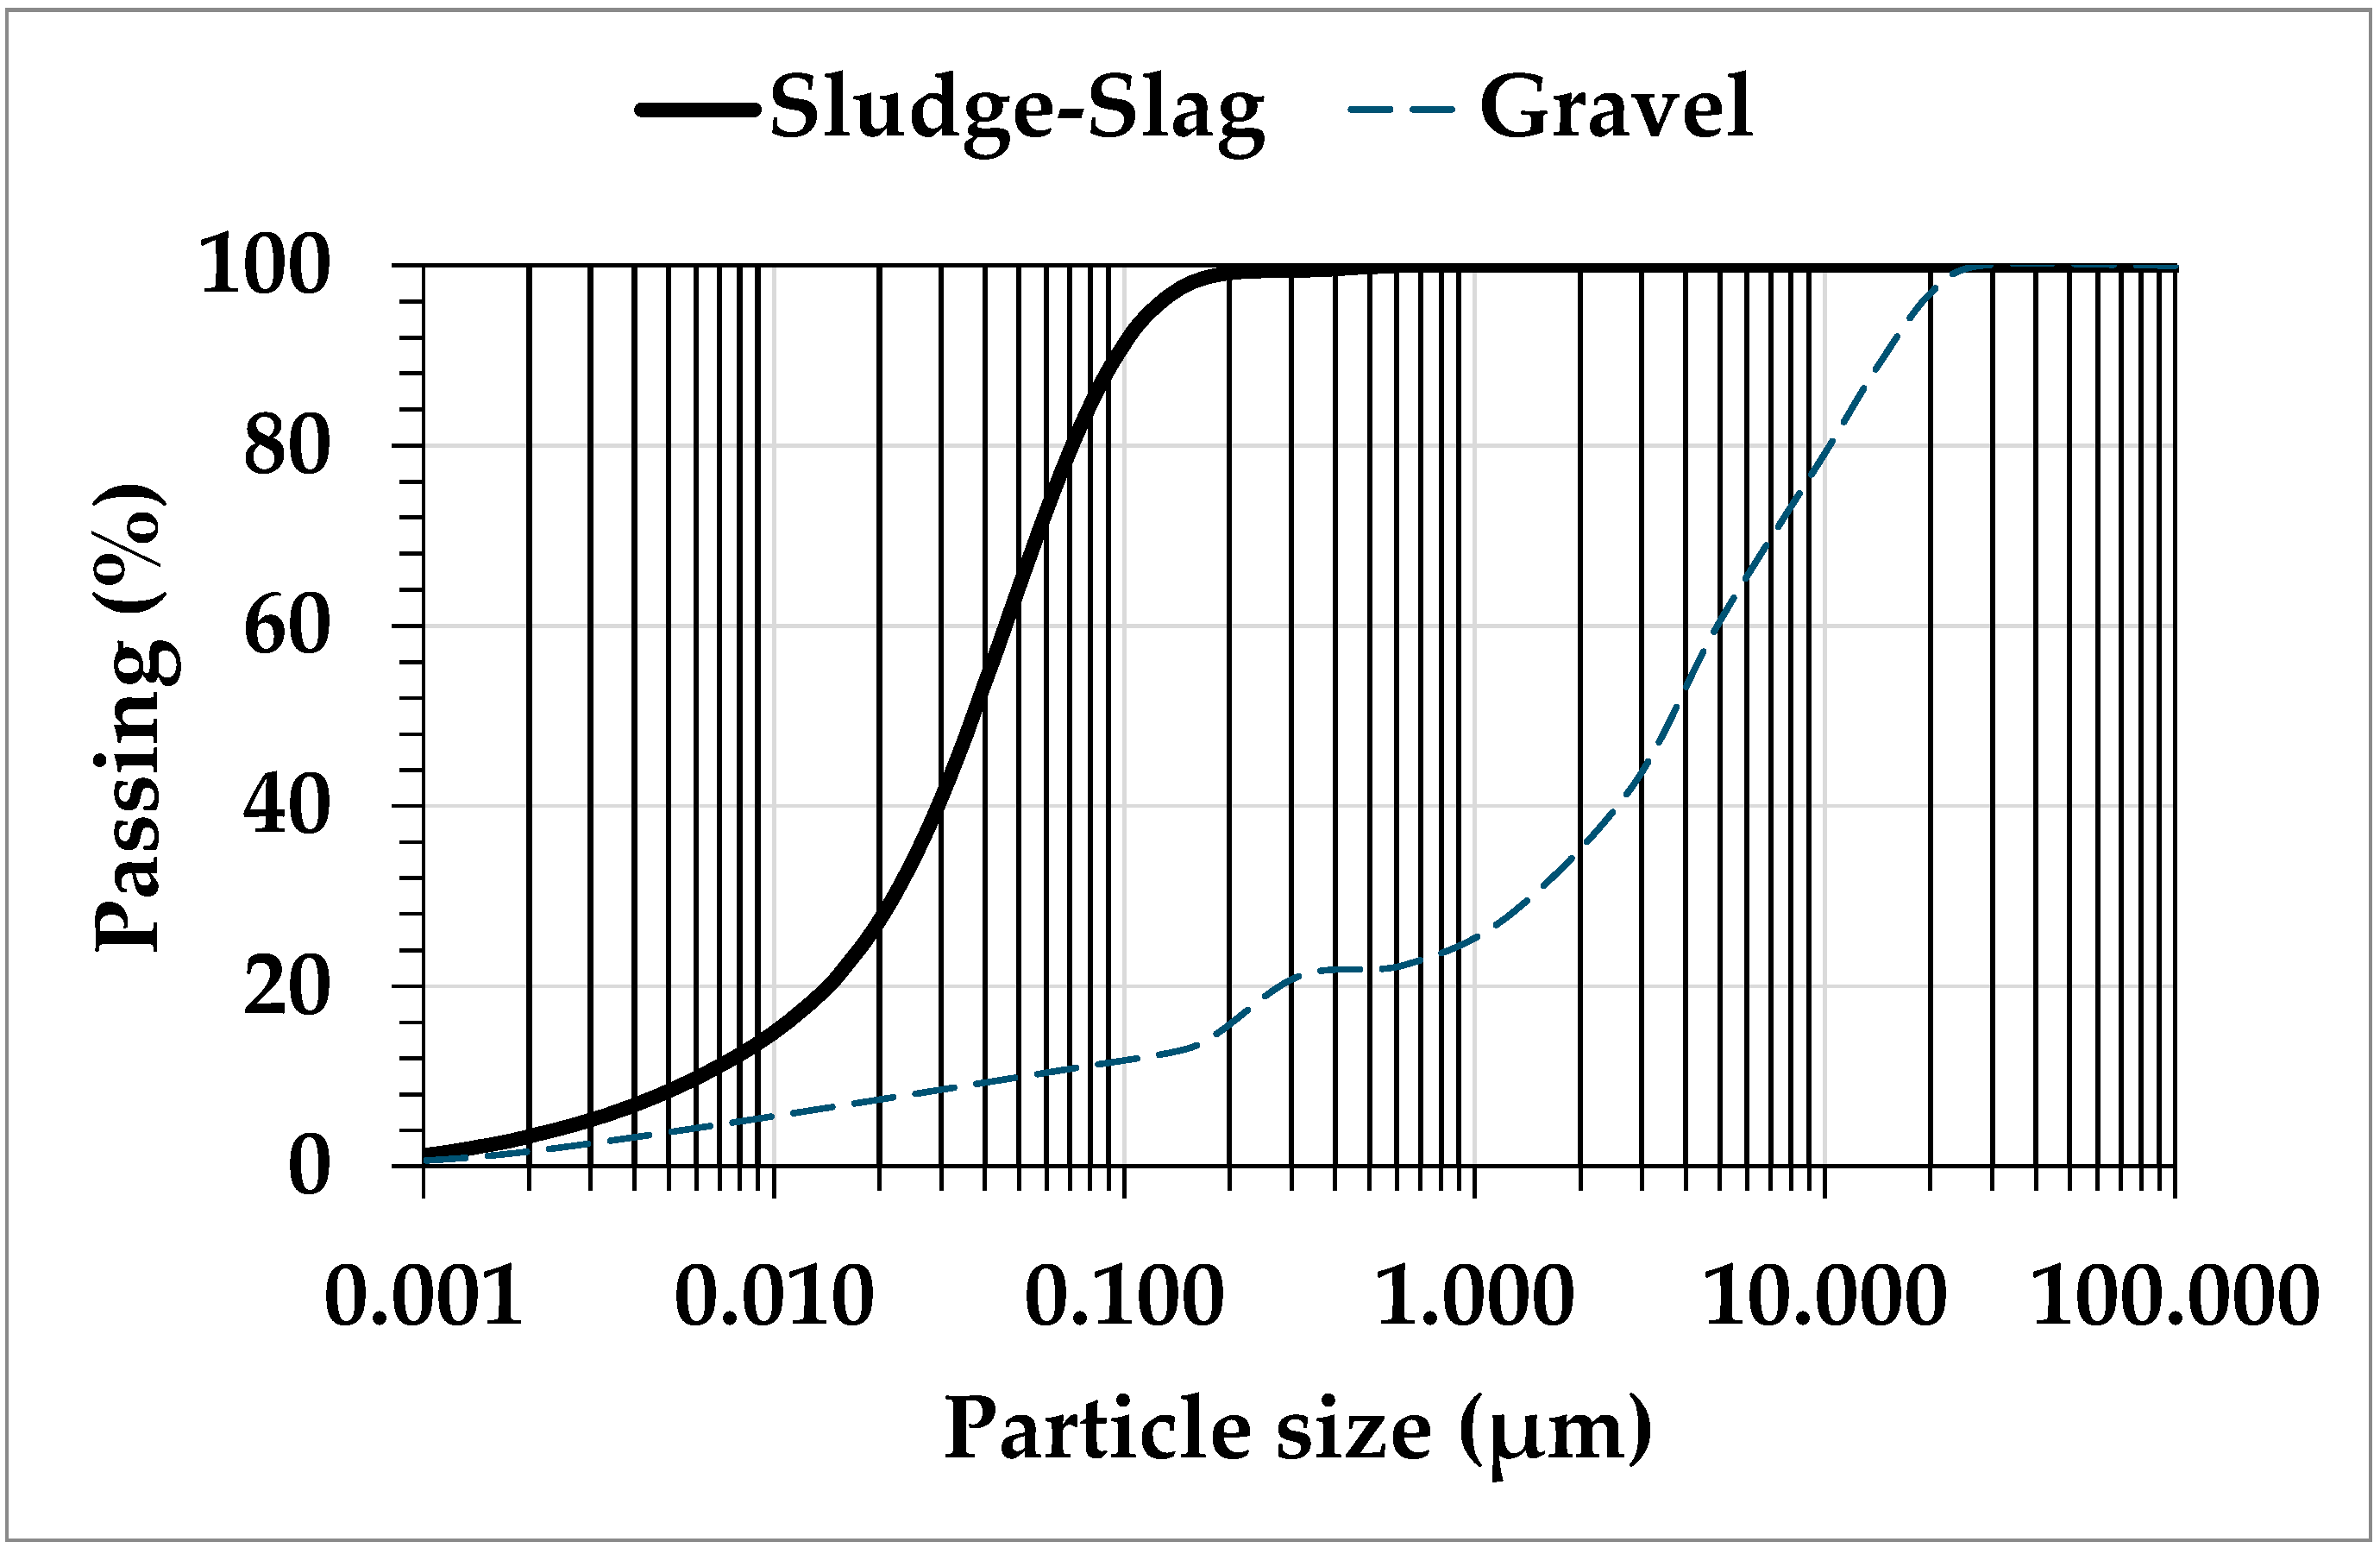
The purpose of particle size analysis was to quantitatively determine the distribution of soil particles based on their diameter classes. For the sludge and slag mixture, particle size distribution testing was conducted using a Malvern analytical Mastersizer 3000 laser particle sizer. The results of the grain size distribution (GSD) are illustrated in Figure 2, which displays the size distribution of particles in the mixture. The results of the GSD analyses indicated very low percentages of the clay fraction (lower than 2 µm) in both materials. The sludge–slag mixture had a silt fraction of 82% (fraction included between 2 and 80 µm). Additionally, the gravel material comprised a sand fraction of 49% and a gravel fraction of 40%.
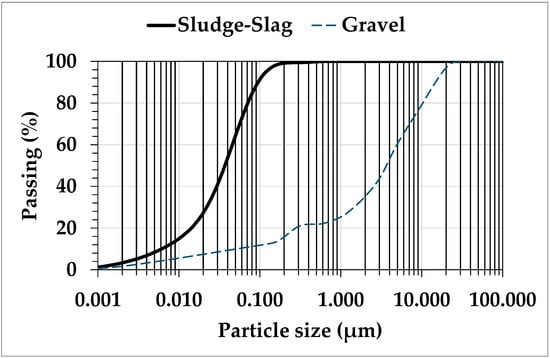
Figure 2.
Particle size distribution of materials.
According to [31], the sludge and slag mixture and gravel materials can be categorized as low plasticity silt (ML) and well-graded sand with silt (SW-SM), respectively.
Key parameters were extracted from the GSD curves and are listed in Table 1. D10, D30, and D60 represent the diameters corresponding to 10%, 30%, and 60% passing on the cumulative GSD curve, respectively (see Table 1). The coefficient of uniformity was calculated as CU = D60/D10. The CU values of the sludge–slag mixture and the gravel materials were 7.6 and 45.4, respectively. According to [31], these values (between 5 and 20) led to a classified sludge and slug materials as having a poorly graded GSD. In contrast, the gravel was classified as having a well graded GSD.

Table 1.
Grain size distribution parameters of the used materials.
The liquid limit (WL) corresponds to the water content at which the behavior of a material changes from the plastic state to the liquid state. The WL was determined using the Casagrande method, following ASTM D4318-17e1 [30]. The plastic limit (WP) is the water content at which a material sample begins to disintegrate into pieces that are 3 to 10 mm long when rolled into a cylinder with a diameter of 3 mm. The WP was determined using the rolling method [32].
For the sludge–slag mixture, the WL was 22%, and the WP was about 17%. These values were used to calculate the plasticity index (PI). This index showed the difference between the WL and the WP. The calculated PI was 5%, allowing concluding that this material can be considered as a low plastic material.
The proctor tests is a method allowing evaluating the optimal water content at which a given soil type becomes most dense and achieves its maximum dry density [33]. Protector test results showed that from the compaction curves the maximum dry unit weight (γdopt), the optimum water content (wopt (%)), the optimum void ration (eγopt), and the optimum porosity (nγopt) were 2.5 g/cm3, 10 %, 0.80, and 0.44 respectively.
In this case, the sludge and slag mixture can be categorized as silt ML.
2.2. Hydrogeological Characterization
For the sludge and slag mixture, the water retention curve (WRC) was measured in a laboratory using the Tempe cell. Laboratory testing using the “Tempe cell” method was conducted at 20 °C on a single sample in a ceramic cylinder with a diameter of 85 mm and a height of 60 mm. The Tempe cell is an instrument for assessing the volumetric water content of a saturated sample, which desaturates after the application of suction. Desaturation occurs when the applied suction pressures begin to force the water present in the pores of the sample to move and, consequently, to be extracted downwards from the cylinder [34,35].
Measurement results are presented in Figure 3 and were fitted using the van Genuchten model [36]. The fitting parameters for the sludge–slag mixture included volumetric water content at saturation θs (0.53), residual volumetric water content θr (0.10), αvG (0.029 cm−1), and nvG (2.911). The AEV calculated using the tangent method (see [37]) was about 22 kPa.
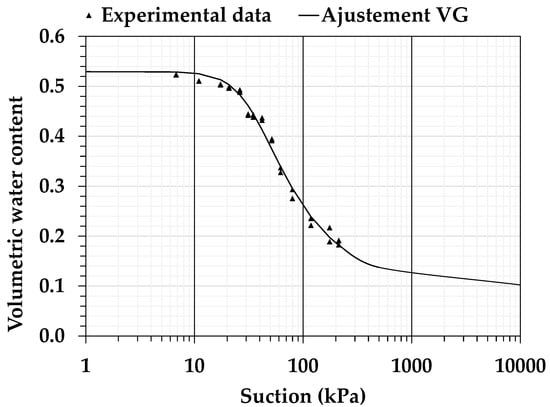
Figure 3.
Measured and fitted water retention curves of the sludge and slag mixture.
The saturated hydraulic conductivity (ksat) for the sludge–slag mixture was measured in the laboratory using a constant-load rigid-wall permeameter [31]. The permeameter used had a diameter of 11.4 cm and a height of 24 cm. It consisted of a Plexiglas cylinder, two perforated plates, seals, a base, and a plastic cap fitted with a drainage valve. The sludge–slag material was placed in the permeameter, and by applying a hydraulic load difference across the sample, water could pass through the sample in a given time interval. The saturated ksat of the sludge–slag mixture was calculated using the following Equation (2):
where Q is the quantity of water that flows (L3), L is the height of the material (L), Δh is the hydraulic head difference (L), A is the flow area (L), and t is the time (T).
The average measured values of ksat of the sludge–slag material was about 1.00 × 10⁻⁴ cm/s.
For the gravel, the ksat was estimated using the predictive modified Kozeny–Carman model (see Equation (3) [38]). In this model, only basic geotechnical properties are used (see Table 1):
where e is the void ratio, CU is the coefficient of uniformity, D10 represents the diameter corresponding to 10% (in cm), CG is the porous space geometry constant equal to 0.1, γw is the unit weight of the water (N/m3), μw is the dynamic viscosity of water, and x ≈ 2.
The estimated ksat corresponded to 2.18 × 10⁻¹ cm/s.
2.3. Experimental Setup and Physical Modeling
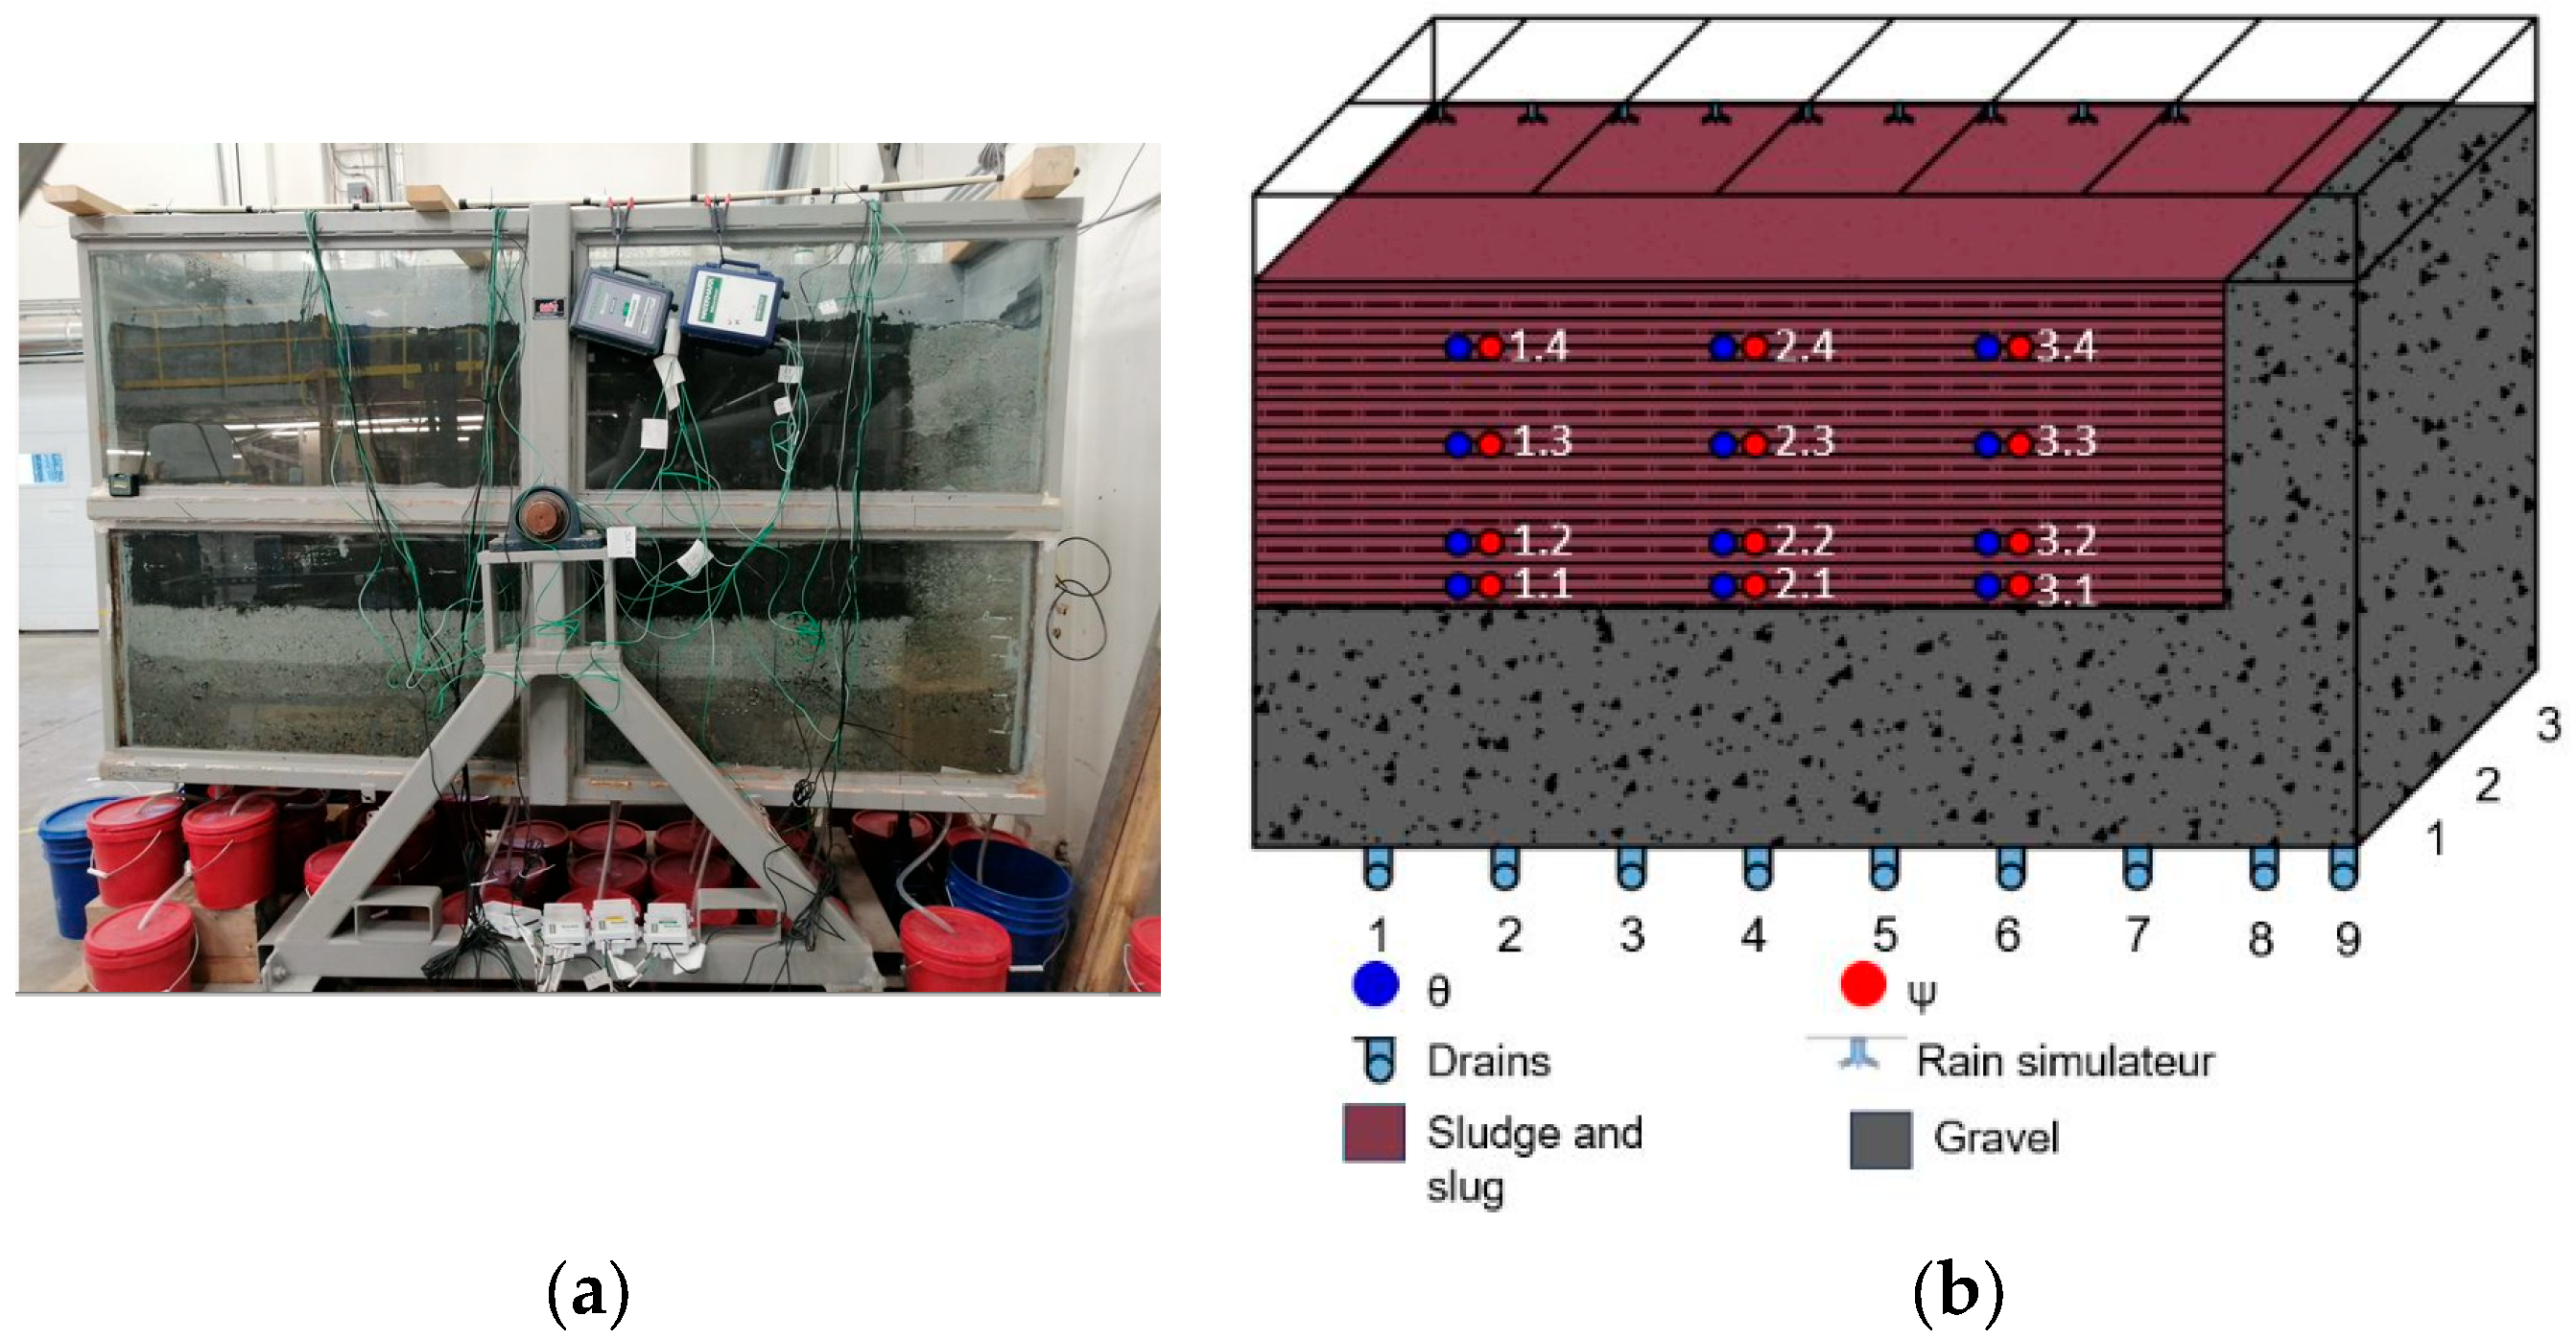
To assess the effectiveness of the FCL method in the waste rock pile reclamation, a laboratory physical model was utilized. This model had dimensions of 2.5 m in length, 0.6 m in width, and 1.5 m in height (see Figure 4). Equipped with a rotation axis, the physical model allowed for adjustment and variation of inclination with angles ranging up to 20 degrees [39]. Specific perforation in the lower part of the model along with drains enabled the separate recovery of infiltration and runoff water. Drainpipes were used to strain and collect infiltration water and runoff water separately.

Figure 4.
Experimental setup: (a) laboratory physical model; (b) locations of different devices used for volumetric water content (θ), suction (ψ) measurements, and drains used to recover infiltration and runoff.
The experimental setup was equipped with sensors for volumetric water content (θ) and suction (ψ) measurements (see Figure 4 for sensor locations).
A water dispersion device served as a rain simulator, ensuring a homogeneous distribution of precipitation and preventing the formation of preferential infiltration paths. Additionally, a flow meter was installed to maintain the specific flow rate. In the tests, precipitation rates for return periods of 25 and 100 years for the Abitibi region (Québec, Canada) were used.
The FCL physical model was constructed in three 25 cm layers of the slag–sludge mixture to evaluate the impact of the FCL thicknesses on the cover performance (25 cm, 50 cm, and 75 cm). A non-reactive gravel layer with a draining function was installed at the bottom of the device; this layer had a thickness of 50 cm; another layer was also installed in the front of the FCL to facilitate water drainage from the FCL (see Figure 2).
In the first 25 cm layer, 6 volumetric water content probes (5TM) and 6 suction probes (Watermark) were installed to monitor the sludge–slag layer near the top and near the gravel–sludge–slag interface (see Figure 4). For the other layers (when the FCL thicknesses were about 50 cm and 75 cm), only one level of instrumentation was installed (see Figure 4).
Two slope values were used: 2.5° and 5°; the 2.5° slope represents the average slope of various tailings storage facilities measured using satellite images. Conversely, the 5° slope was utilized in an experimental cell constructed at the Lac Tio mine in 2014 to investigate the hydrogeological behavior of an FCL under field conditions [23,25].
The proposed modeling aimed to assessing the impact of certain parameters on the hydrogeological behavior of an FCL composed of a sludge–slag mixture. The elements tested using the physical model were as follows: (i) the FCL thickness; (ii) the model slope; and (iii) the intensity of precipitations.
Considering the different variables to test (the thickness of the layer, the slope, and the intensity of precipitation), a total of 12 scenarios were performed as shown in Table 2.
Table 2.
Simulated scenarios conditions.
In each tested scenario, all parameters were kept constant, except for one which was varied to highlight its influence. In the first series of tests, a 25 cm layer of the sludge–slag mixture was used as an FCL. Two inclinations were tested: 2.5° and 5°. For each inclination of the physical model, two different rates of precipitation were applied: 46.8 mm/h and 60.6 mm/h.
In the second series of tests, the thickness of the slag–sludge layer was increased to 50 cm by adding an additional 25 cm layer. For this configuration, the same scenarios were tested with the same slopes and precipitation rates as for the 25 cm layer. In the third series of tests, the thickness of the sludge–slag layer was further increased by adding another 25 cm layer, resulting in a total thickness of 75 cm. For this new thickness, the same scenarios as in the previous cases were tested. Each series of tests lasted approximately three weeks, with precipitation conducted for 1 h and a drainage period of about 21 days. This period was left between successive tests to allow the system to equilibrate.
2.4. Numerical Simulation Modeling
Simulations were conducted using SEEP/W 2021. This software employs the finite element method (FEM) to simulate the movement of liquid water or water vapor through both saturated and unsaturated porous media. Water flow modeling with SEEP/W is based on the Richards equation, and simulations can be performed in either the steady state or the transient mode, considering hydrogeological conditions [40].
Two-dimensional (2D) model was constructed. The model simulates FCLs was built with the same dimensions as the laboratory physical model and include hydrogeological properties of the materials measured in a laboratory (see Figure 5). These models represent various scenarios and include different thicknesses of sludge–sludge layers (25 cm, 50 cm, and 75 cm) and gravel drainage layers (highlighted in yellow in Figure 5). Regarding the mesh sizes of the models, the 25 cm FCL model comprises 816 nodes and 750 quadrilateral elements, the 50 cm FCL model comprises 1071 nodes and 1000 quadrilateral elements, and the 75 cm FCL model comprises 1326 nodes and 1250 quadrilateral elements.
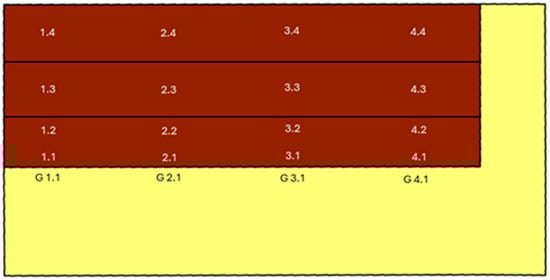
Figure 5.
Numerical model and location of simulated sensors in SEEP/W.
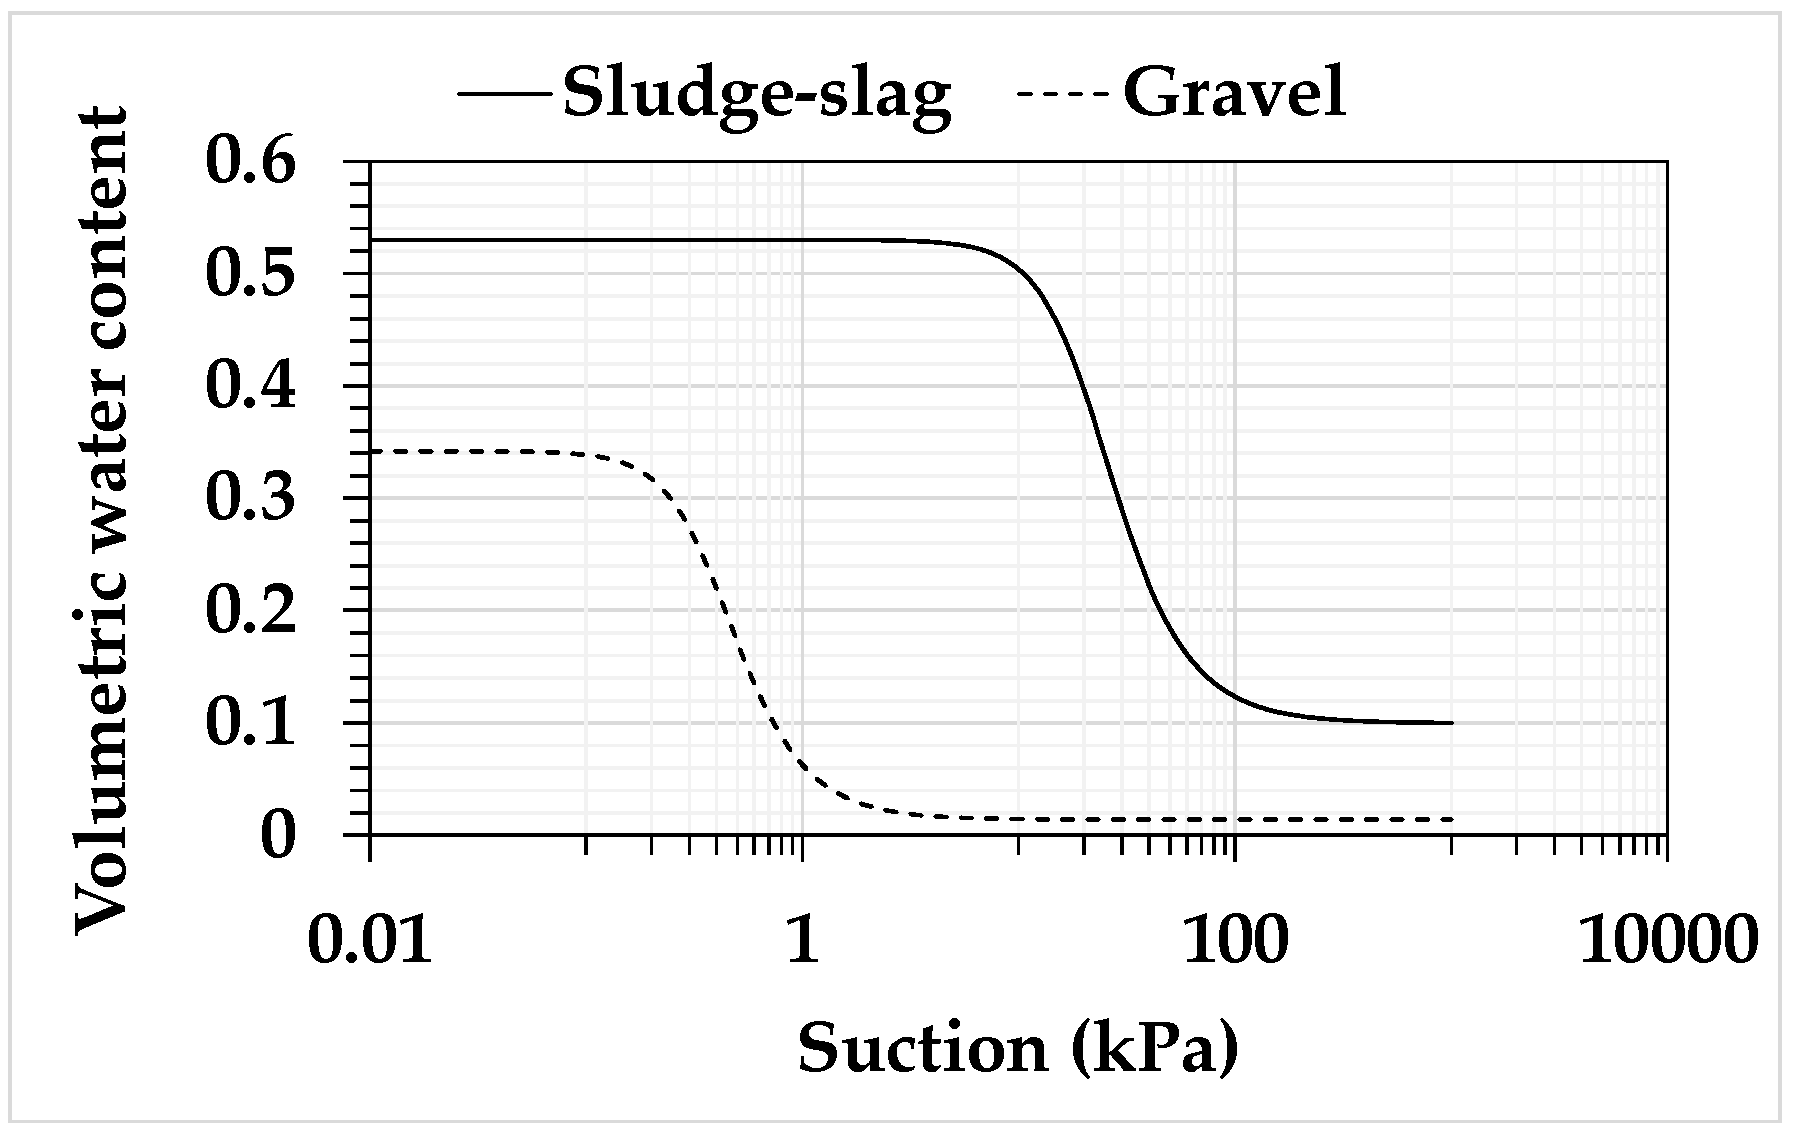
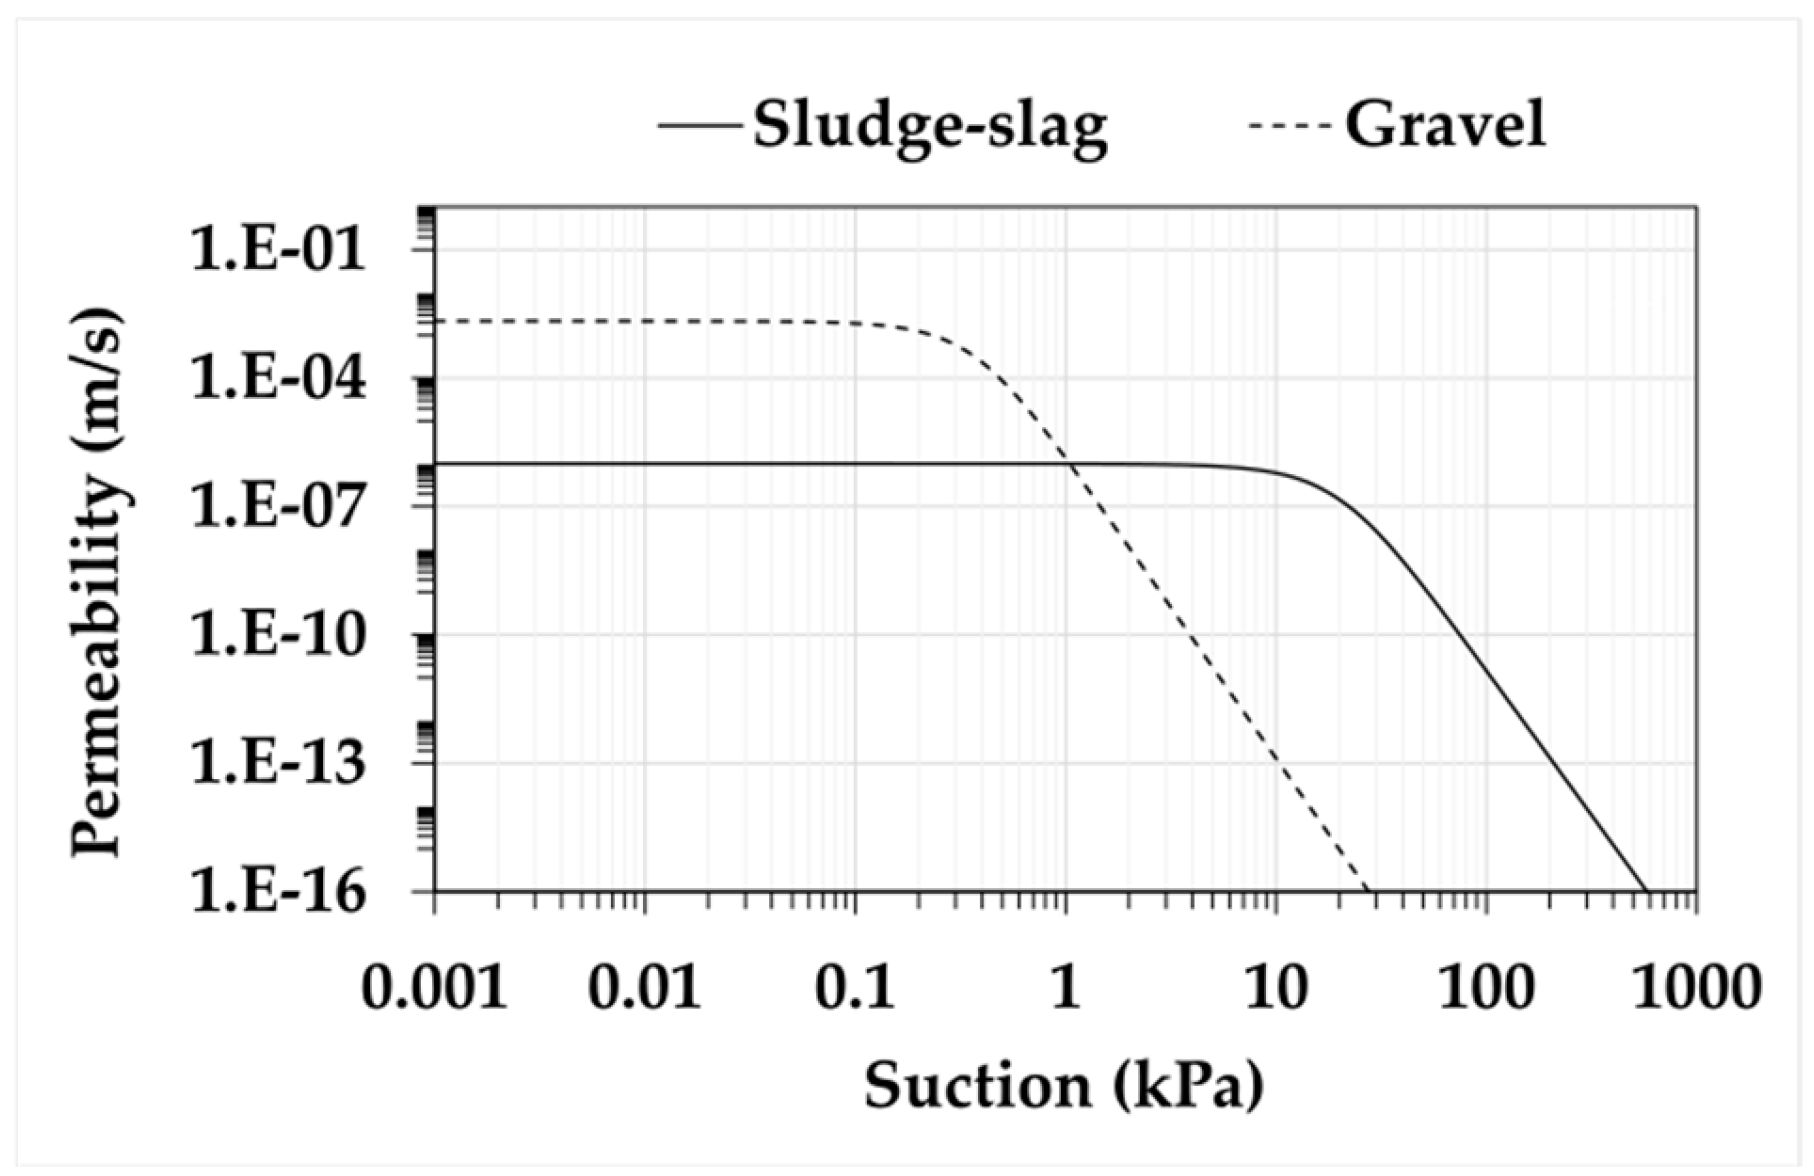
The van Genuchten (1980) model was chosen to describe the WRC and Mualem (1976) model to predict the unsaturated hydraulic conductivity function.
The used functions (WRC and permeability functions) are presented in Figure 6 and Figure 7 clearly shows the contrast in hydraulic properties between the used materials, allowing creating the capillary barrier effects.
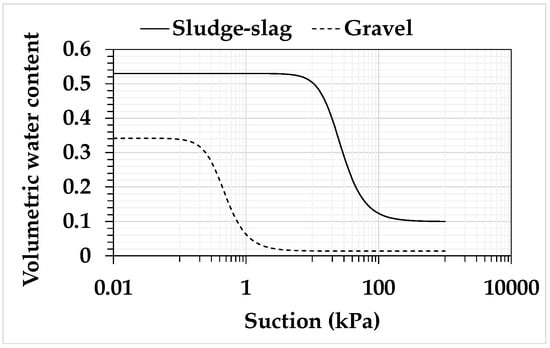
Figure 6.
Volumetric water content of the gravel and the sludge–slag materials.
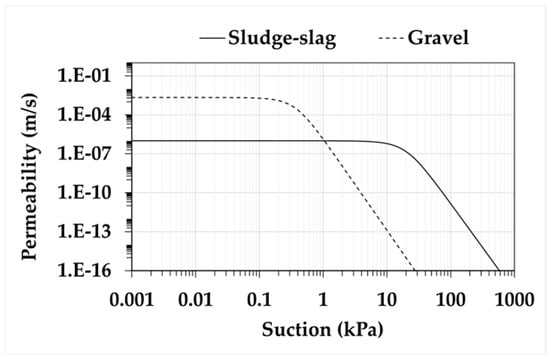
Figure 7.
Permeability function of the gravel and the sludge–slag materials.
3. Results
3.1. Infiltration and Runoff
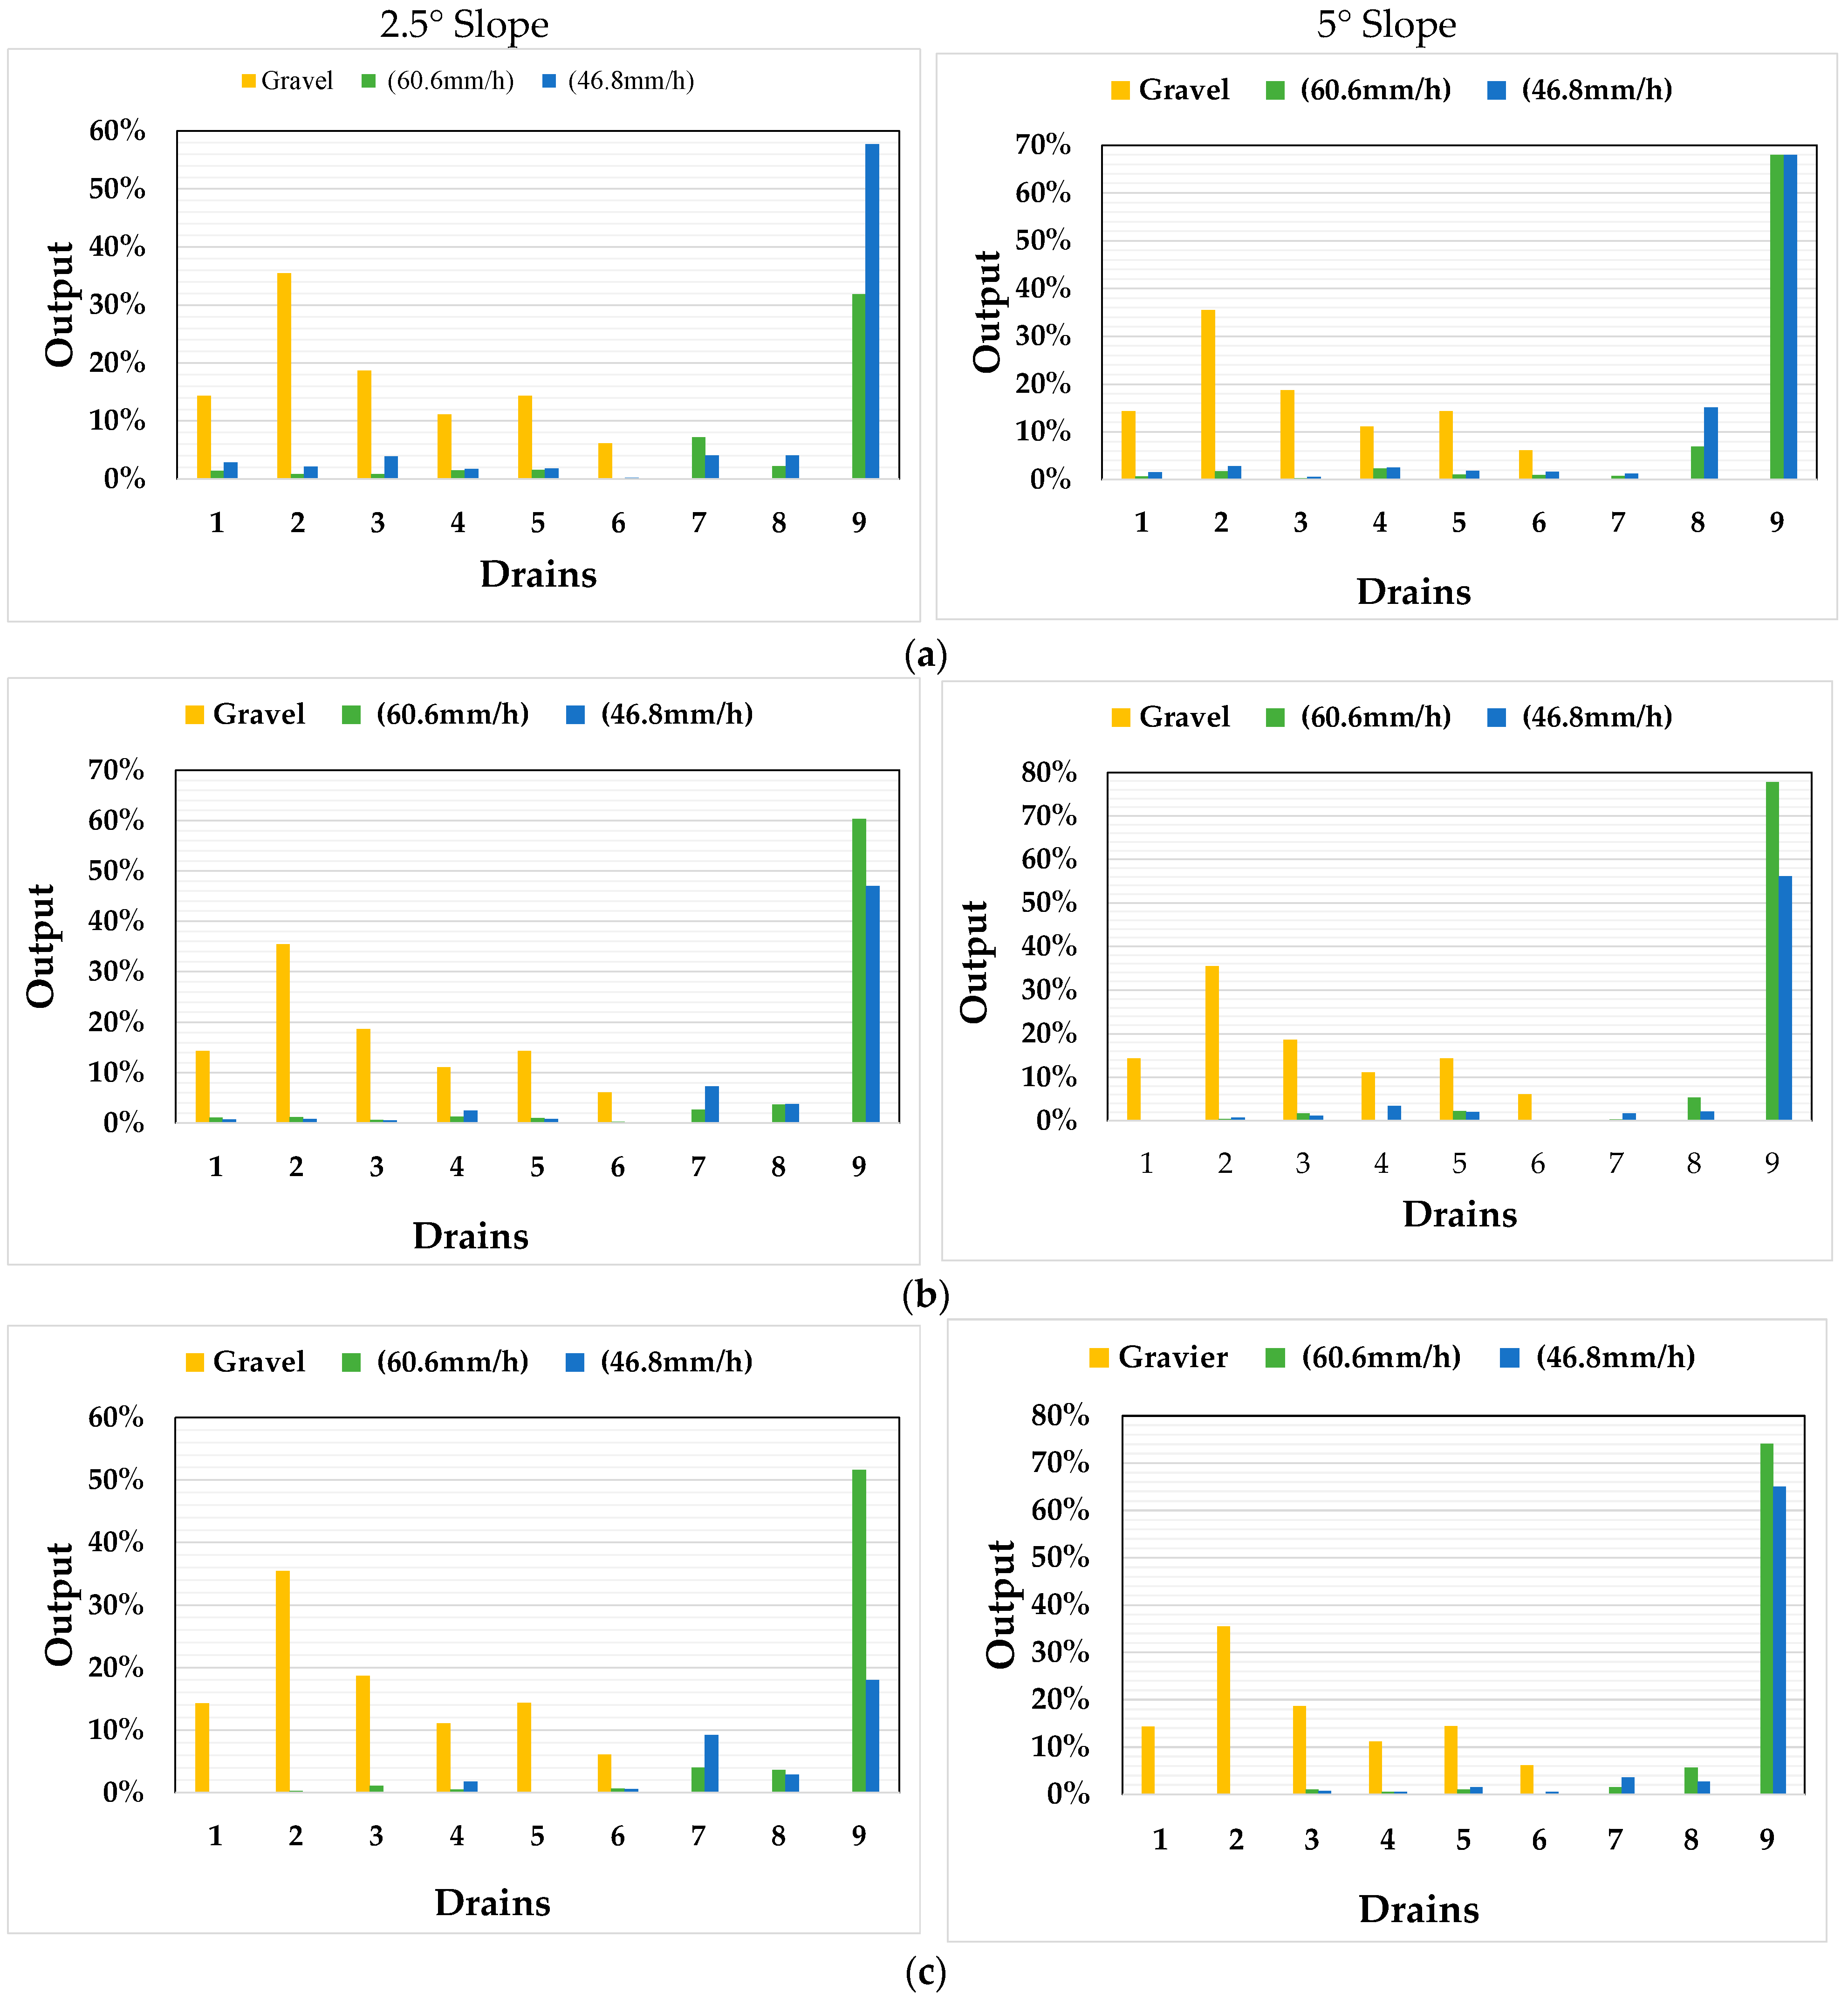
After each test, seepage and runoff water were collected, measured and compared with the volume of water injected. Results expressed as a percentage of injected water are presented in Figure 8. Figure 8 presents the average ratios of the infiltration percentage (drains 1–7) and the runoff (drains 8 and 9) for the different drains across various tested scenarios, encompassing variations in precipitation, slope, and FCL thickness.
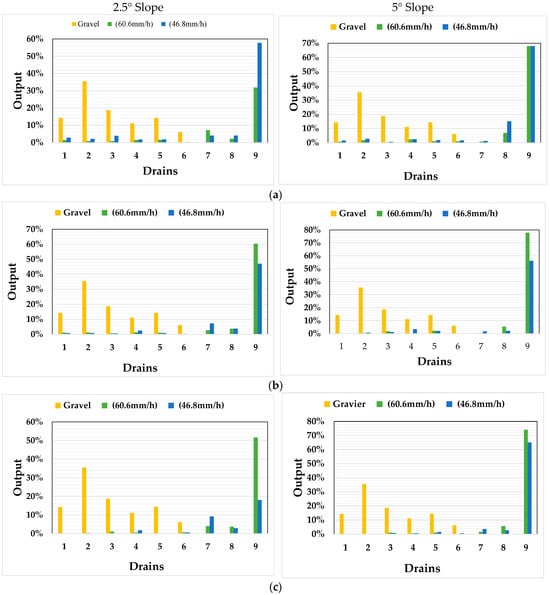
Figure 8.
Infiltration and runoff rates for different drains and for different slope and thickness scenarios: (a) thickness of 25 cm; (b) thickness of 50 cm; and (c) thickness of 75 cm.
The yellow columns in Figure 8 represent the results of the initial infiltration tests, conducted solely on the gravel layer, aiming to demonstrate that the infiltration system did not impact drains 8 and 9, which captured runoff water. The green columns depict precipitation at a rate of 60.6 mm/h, while the blue columns represent precipitation at 46.8 mm/h. Generally, the results indicated that runoff (drains 8 and 9) was higher with a 5° slope. Similarly, the 2.5° slope showed a higher infiltration rate on drain 7 by comparison to on the other drains (1 to 6).
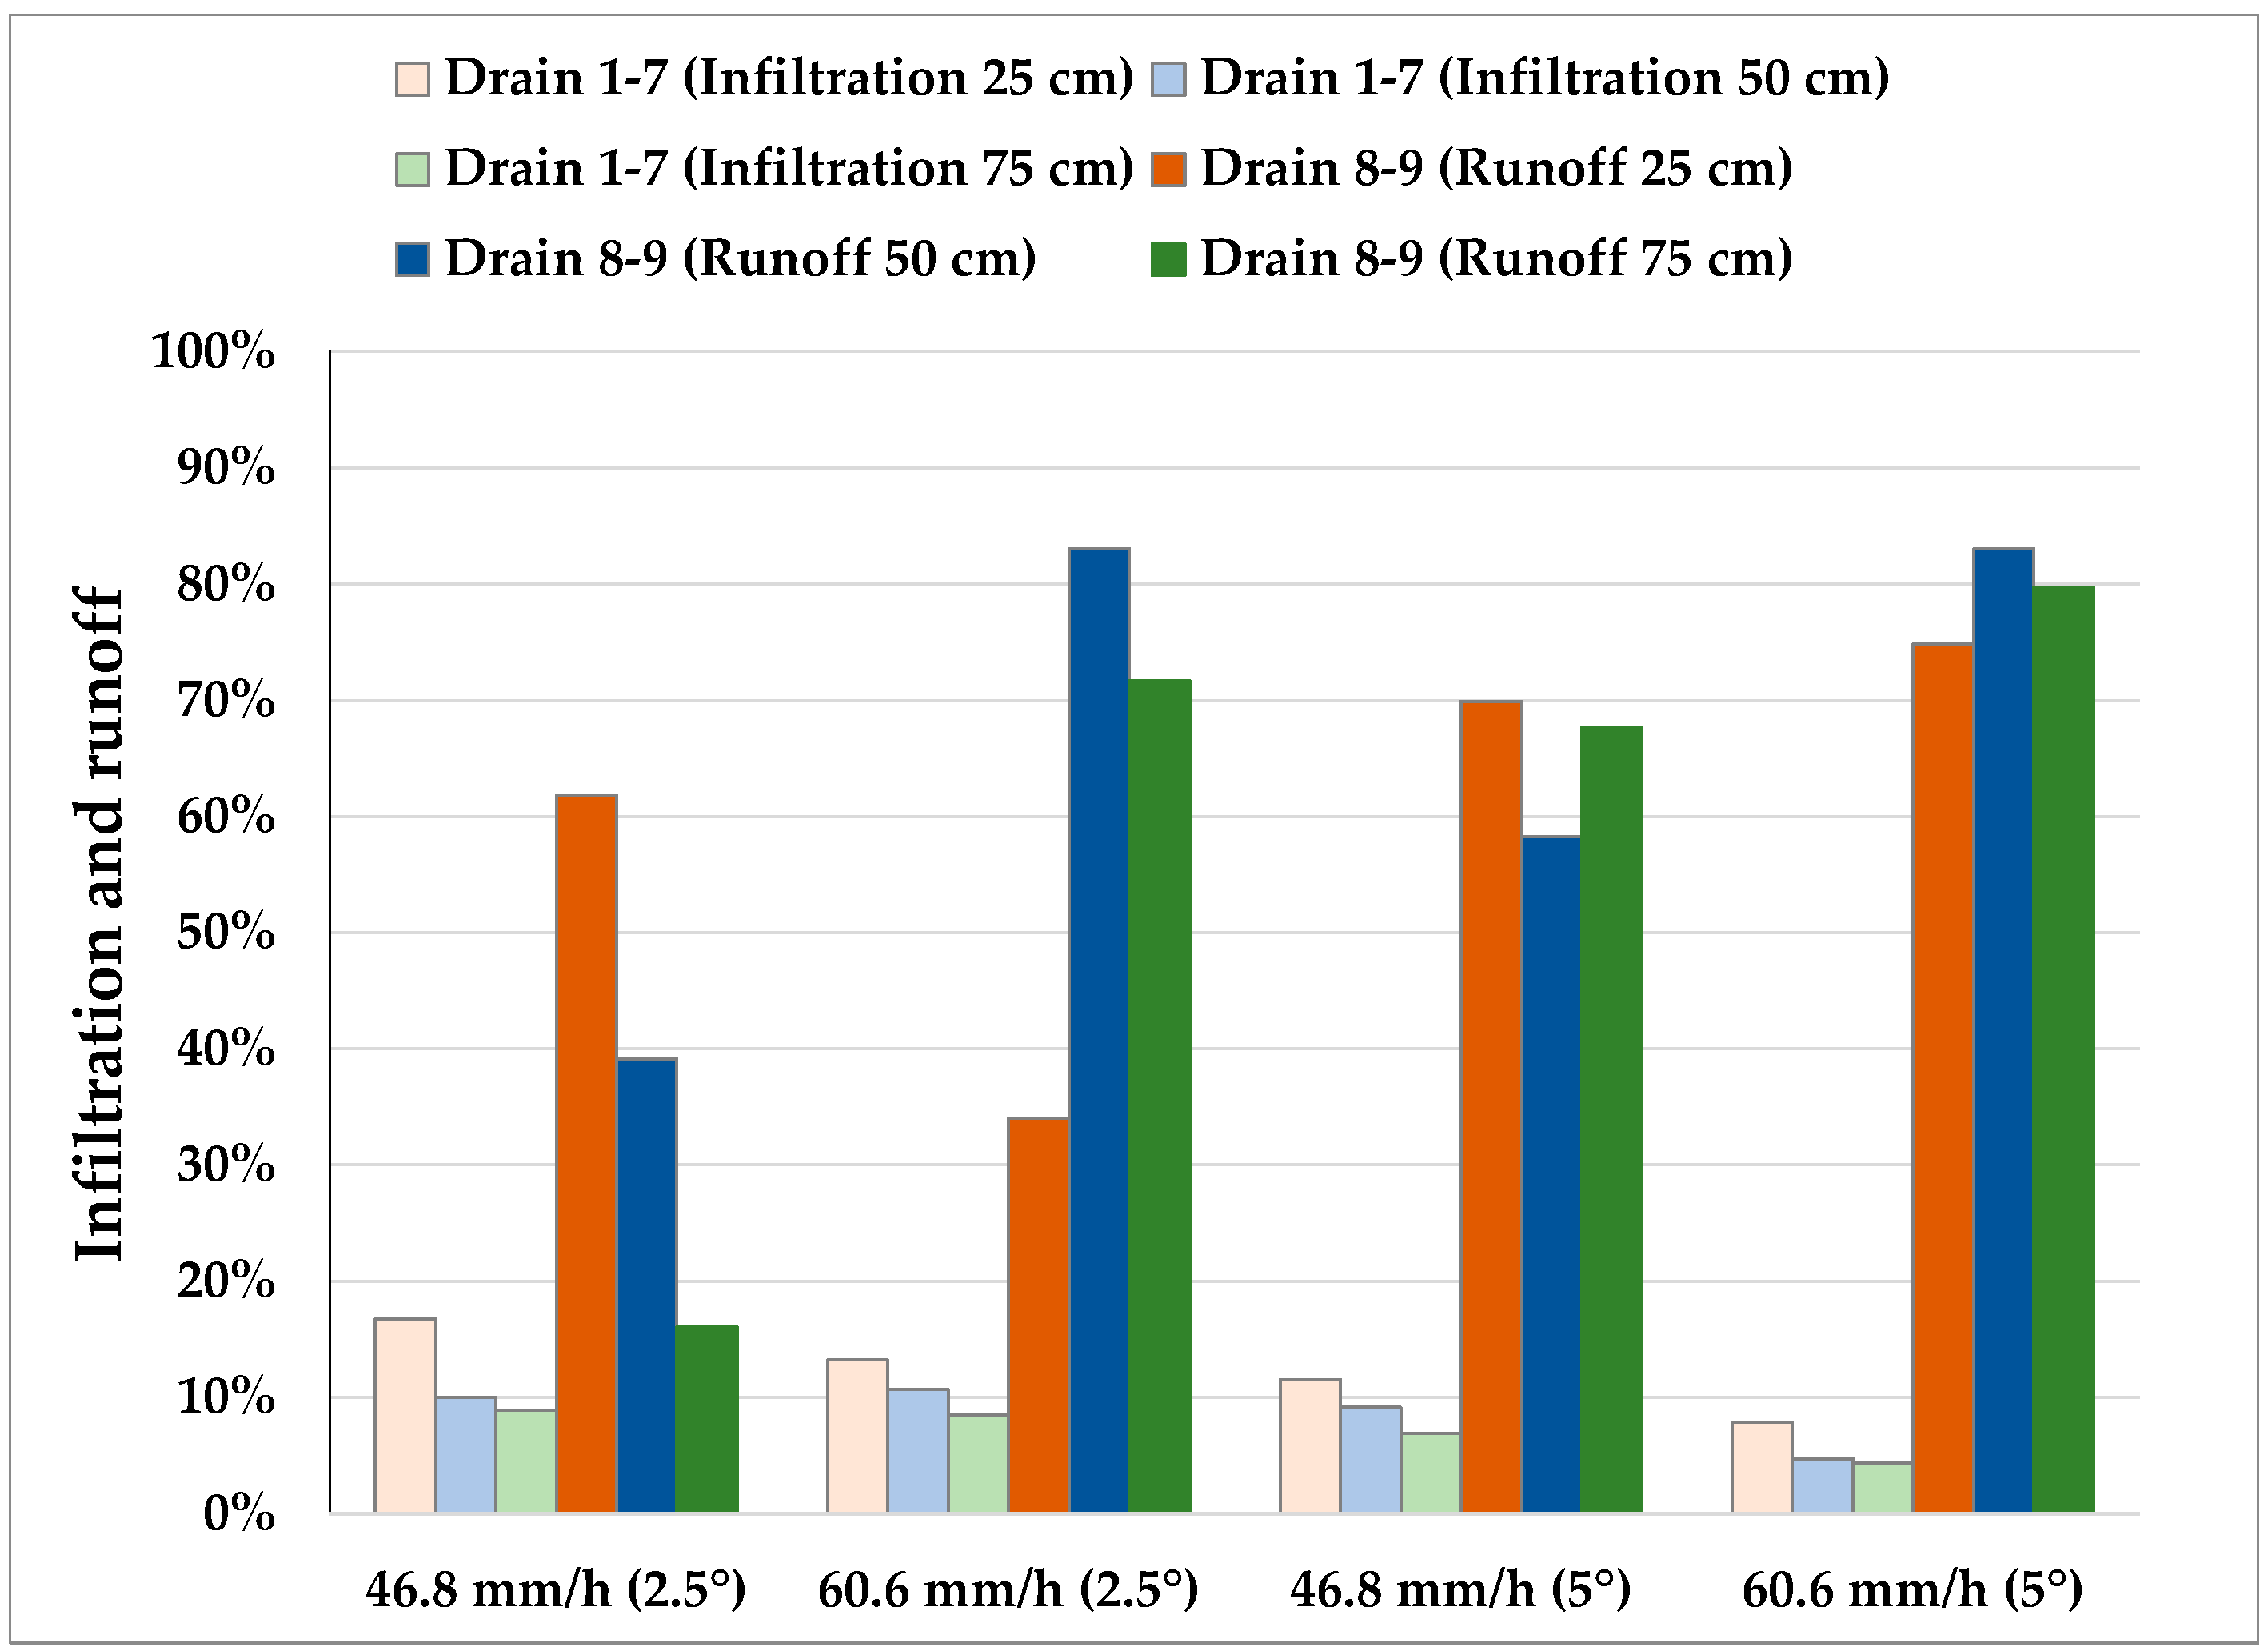
For the various scenarios tested, total infiltration and total runoff were calculated. Results of these calculations are presented in Figure 9. Figure 9 indicates that the lowest infiltration rates were 8%, 5%, and 4% for the FCL thicknesses of 25, 50, and 75 cm, respectively, when the inclination was 5° and the precipitation rate was 60.6 mm/h. In the same way, we can observe that the infiltration values were lower for the 75 cm layer compared to the 25 cm layer infiltration values.

Figure 9.
Infiltration and runoff rates for different slope and thickness scenarios.
For the runoff, one can observe that this parameter increased with an increase in inclination. The higher values were observed with the precipitation rate of 60.6 mm/h.
3.2. Volumetric Water Content and Suction
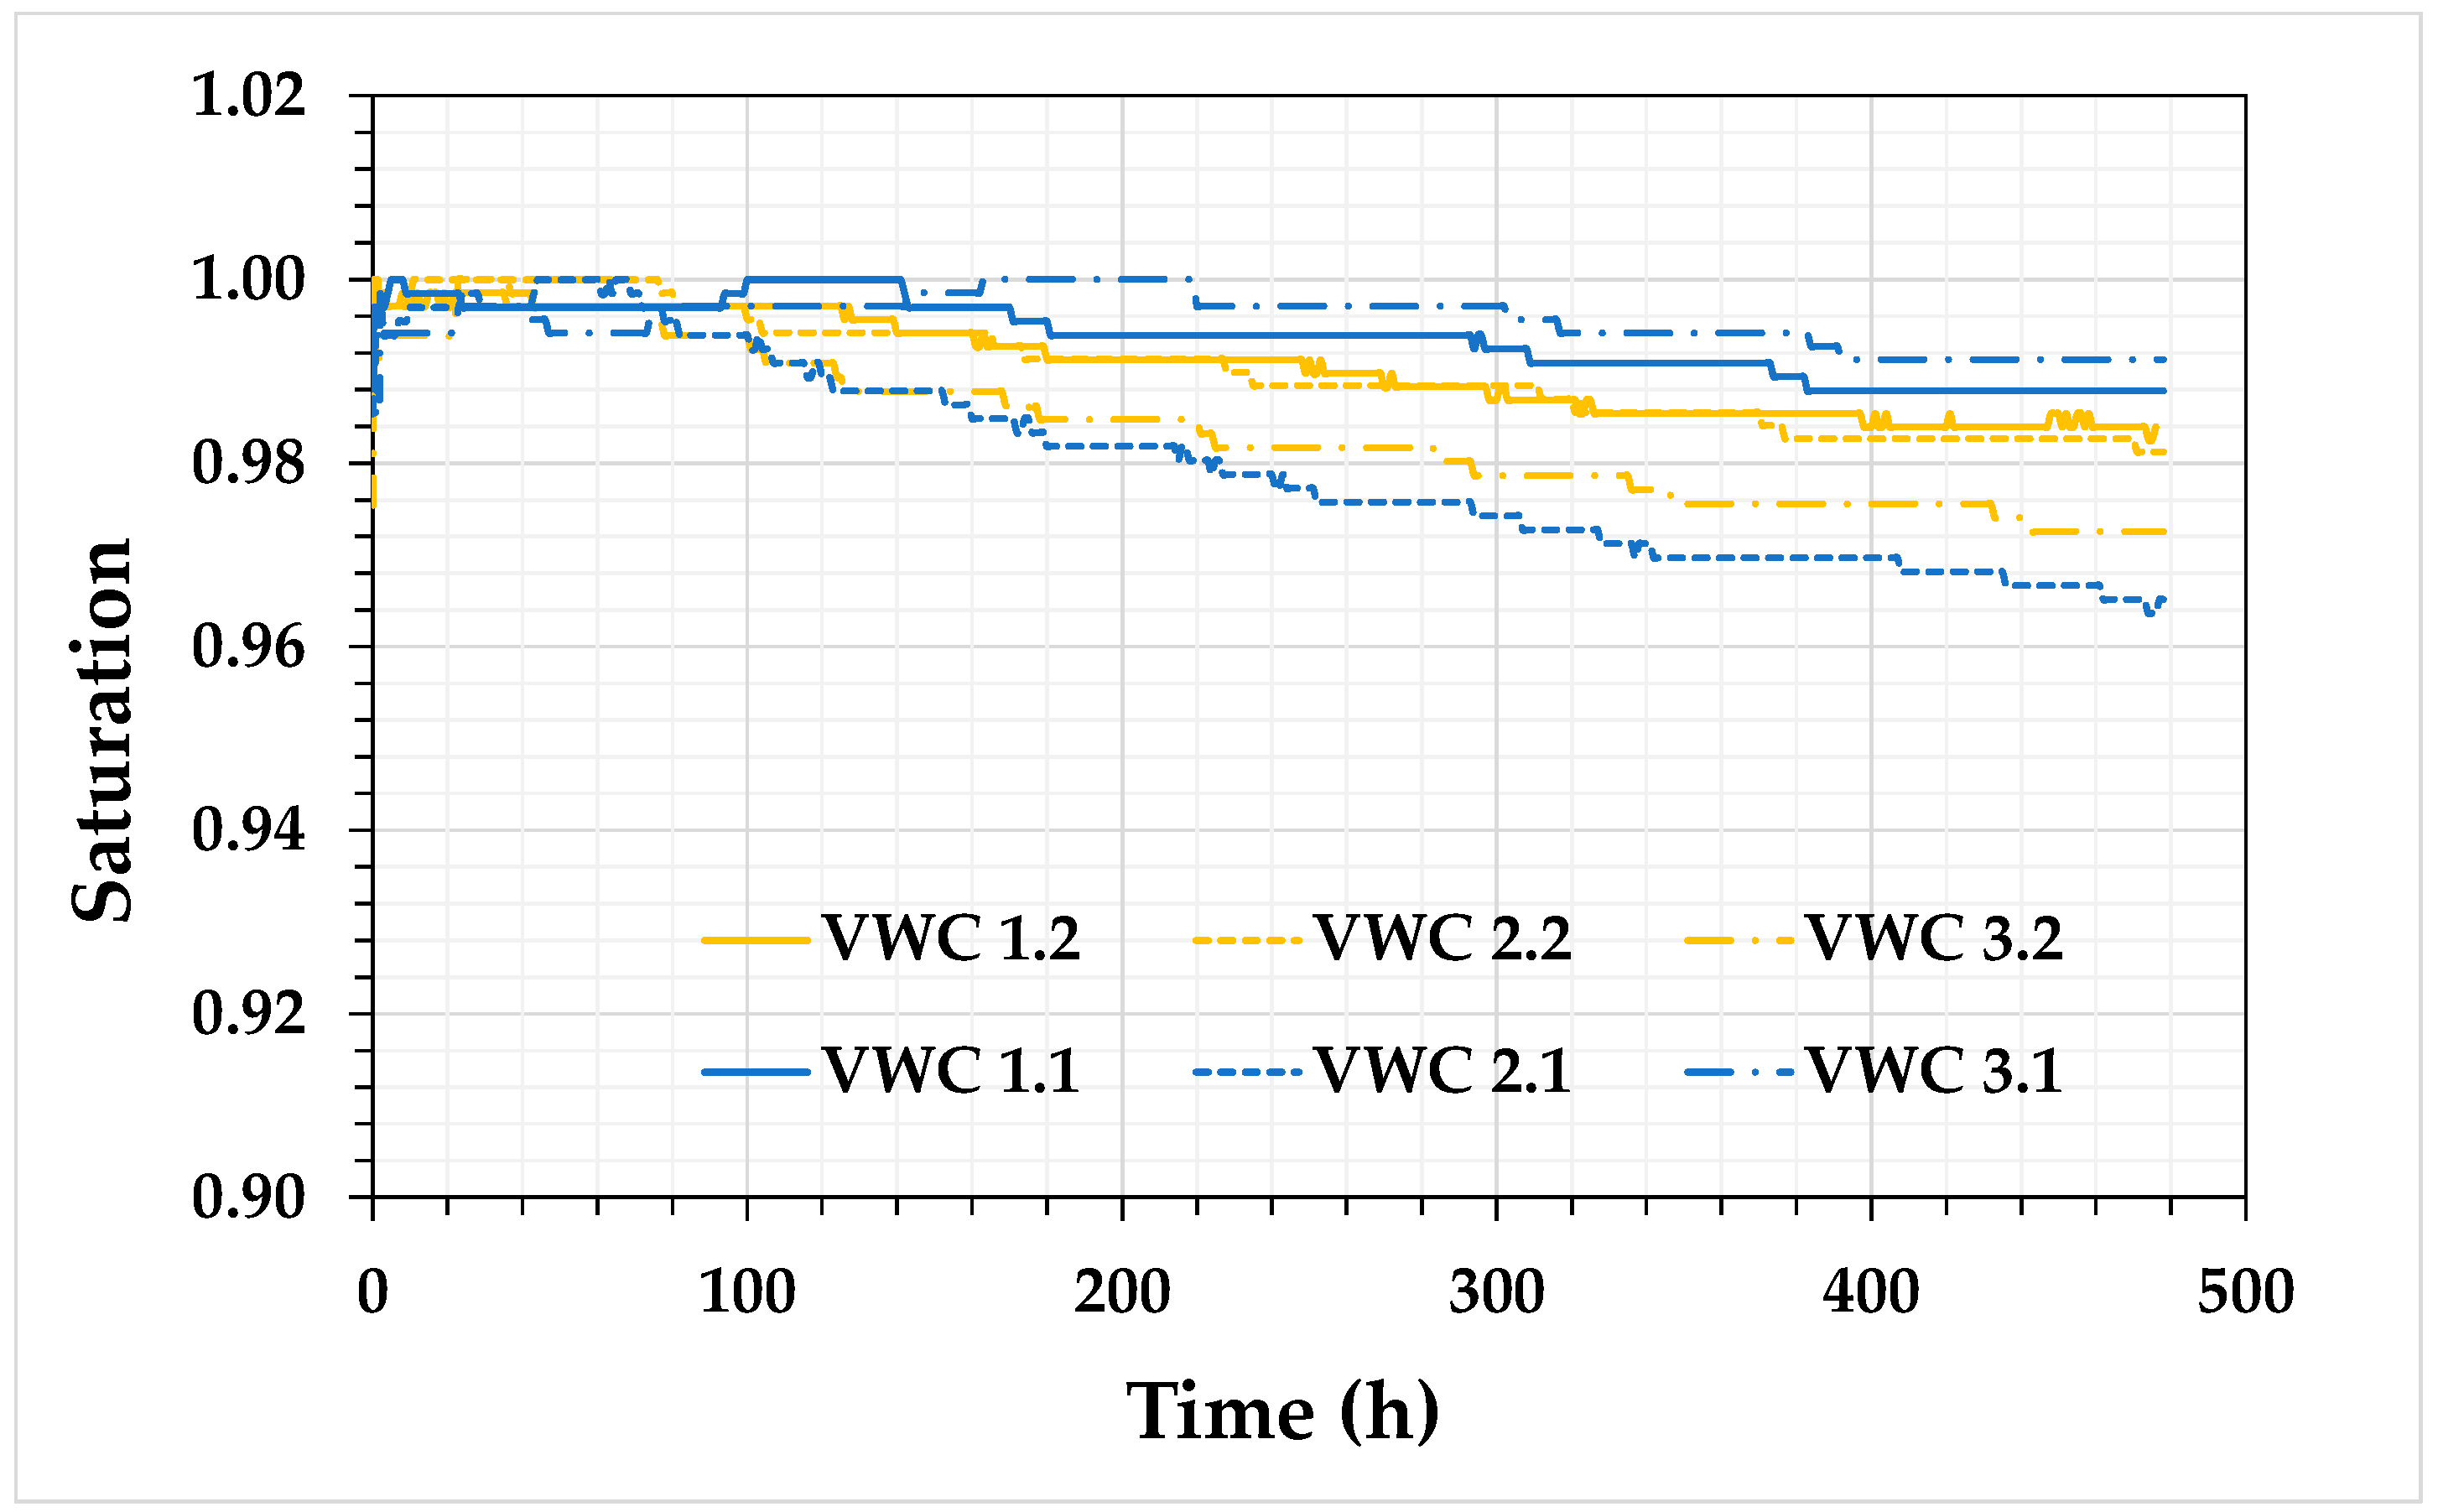
Figure 10 and Figure 11 show the follow-up of the saturation degree and suction data measured in the physical model. After the infiltration test, a drying process occurred over 20 days. The scenario presented here corresponded to the FCL with a 25 cm thickness, a 2.5° slope, and a precipitation rate of 60.6 mm/h. Figure 10 shows that during the infiltration test, the saturation degree increased rapidly. During the drainage period, a decrease in saturation degree (Sr) was observed at different levels.
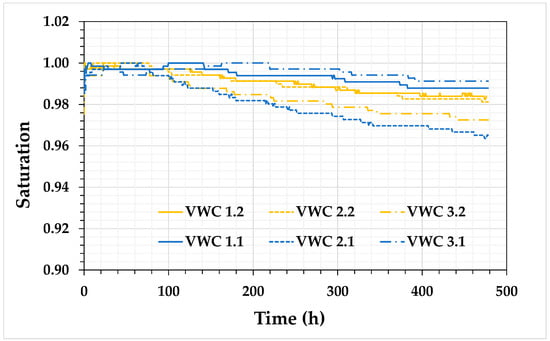
Figure 10.
Saturation profiles for the scenario with an FCL thickness of 25 cm and a slope of 2.5°.
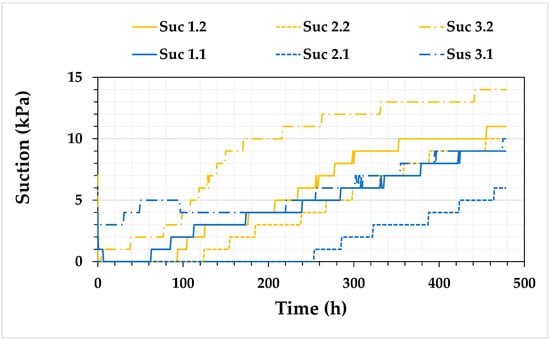
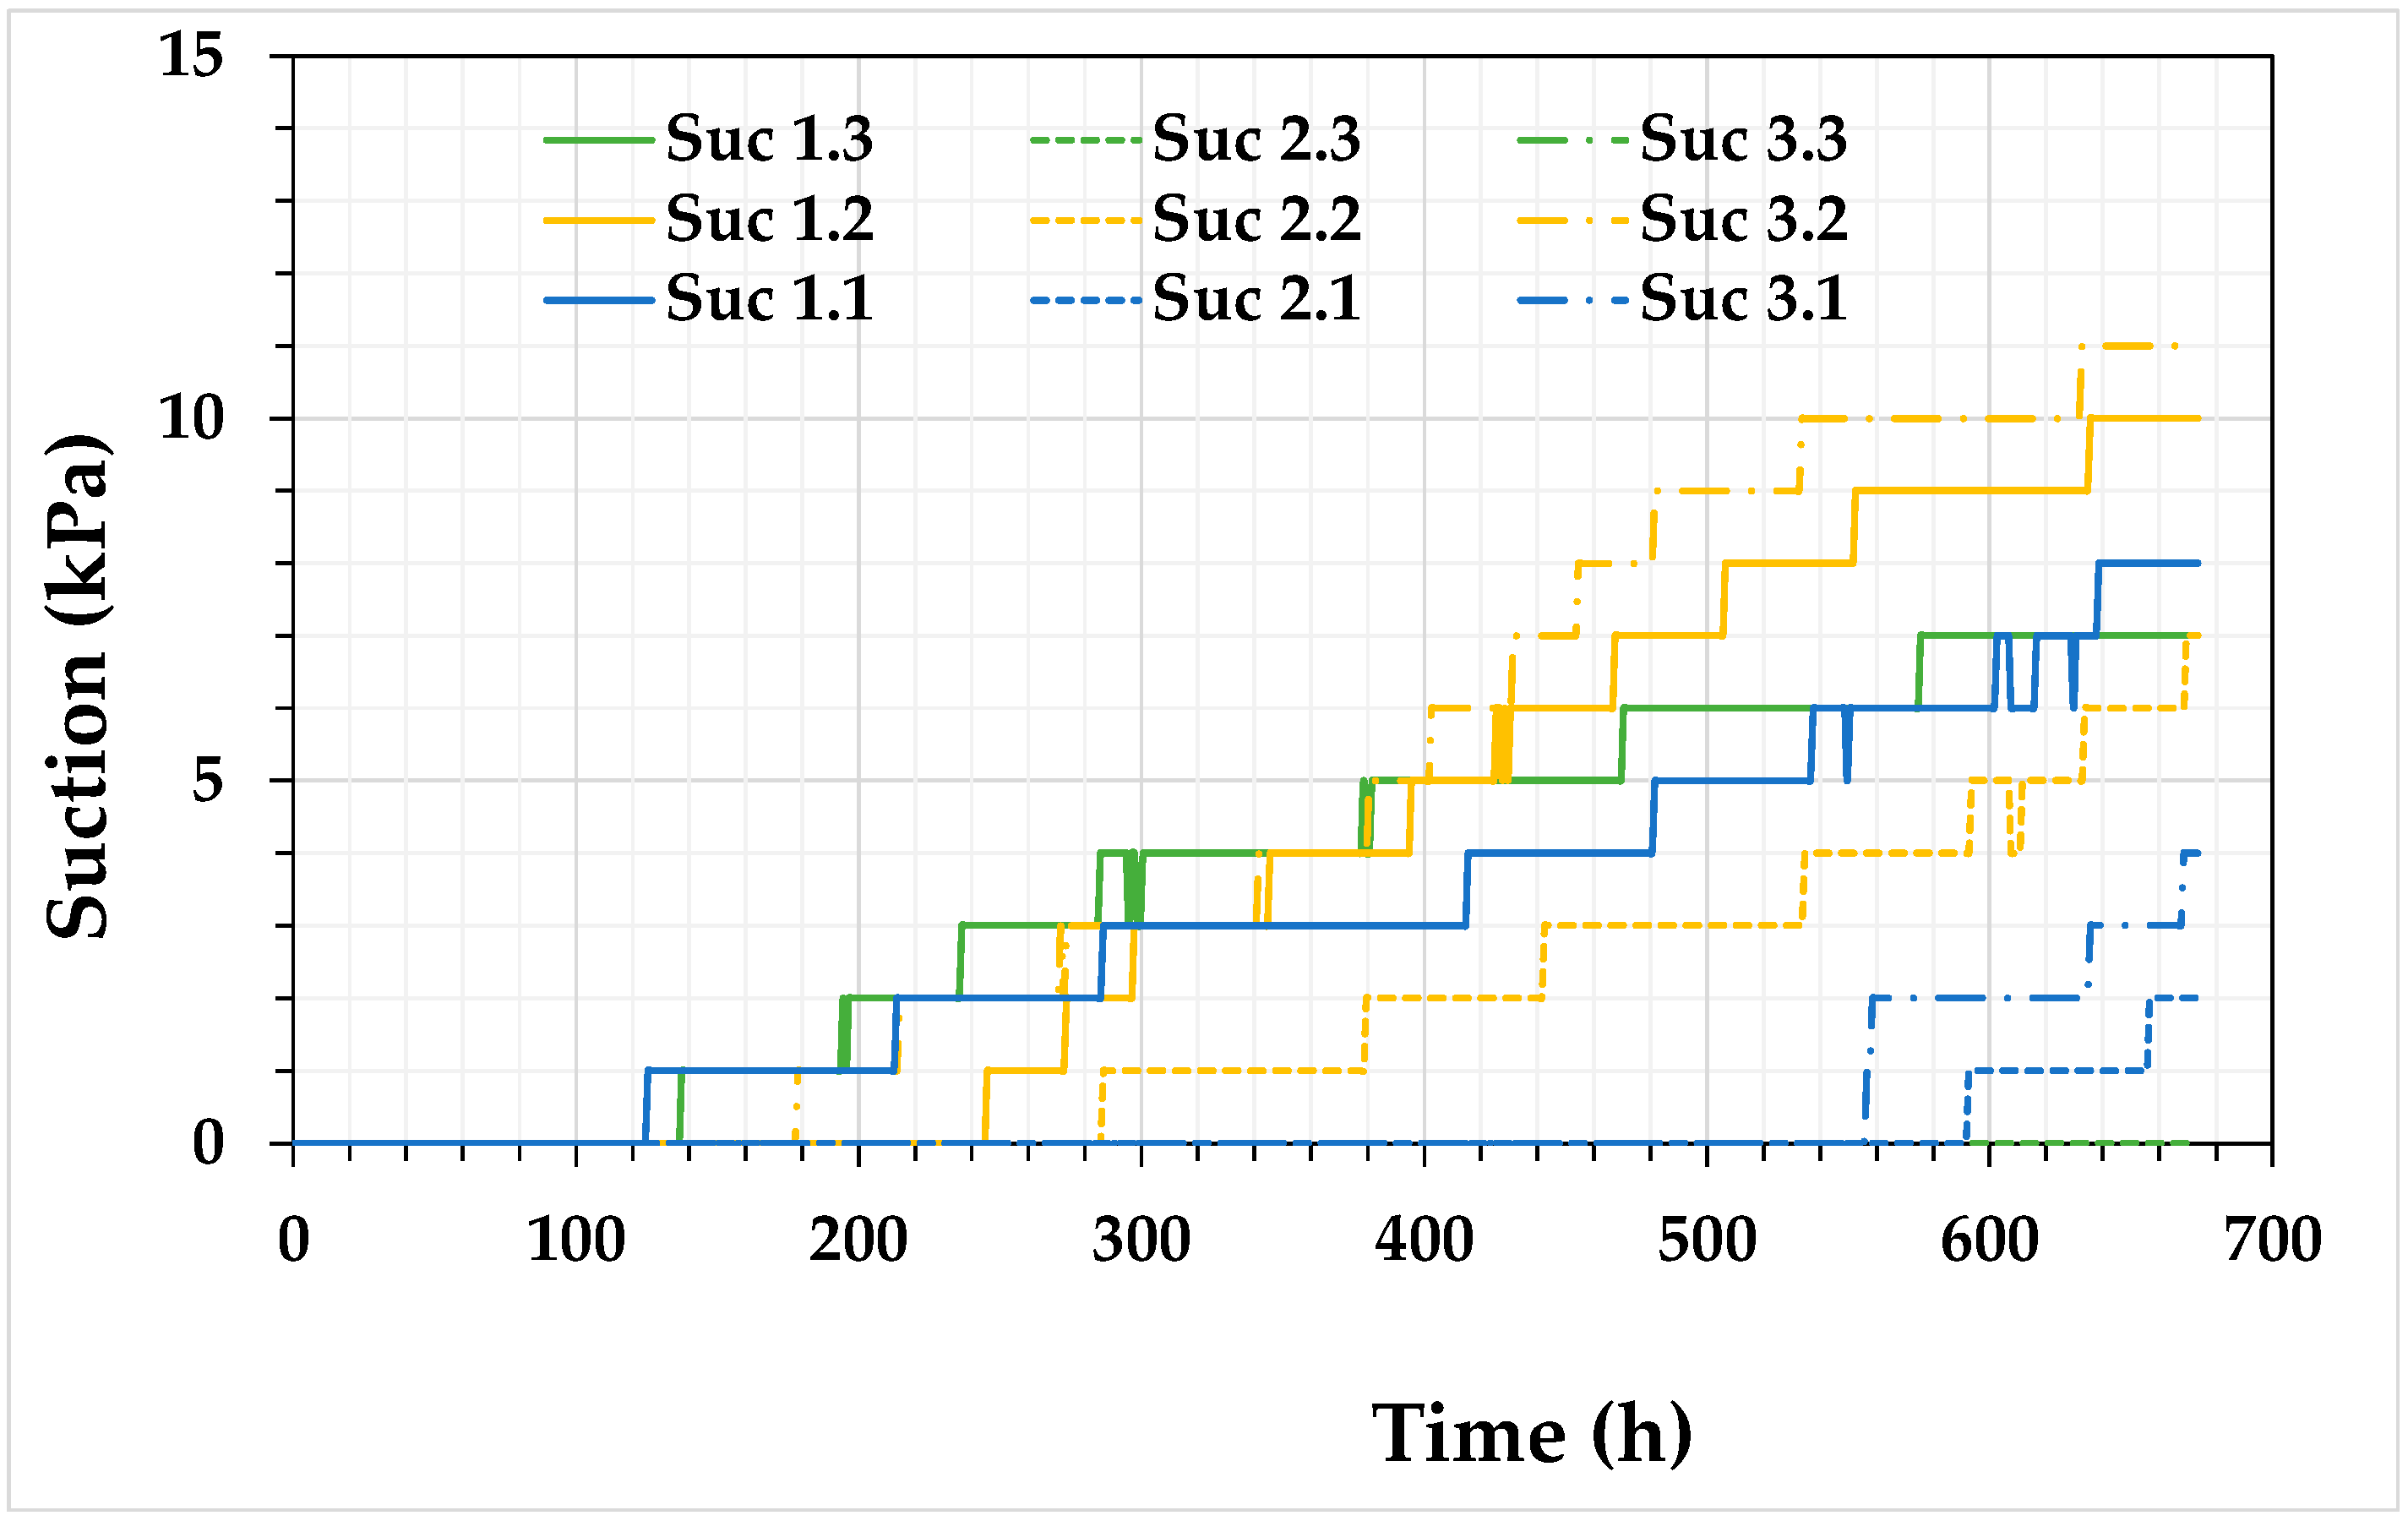
Figure 11.
Suction profiles for the scenario with an FCL thickness of 25 cm and slope 2.5.
A significant decrease was observed at location 2.1 (near the middle of the model; see Figure 4 for sensor locations). However, for all the sensors, the saturation degree remained higher than 90%, indicating that this layer was maintained at a high degree of saturation. This saturation was favorized by the capillary barrier effect created between a gravel layer and an FCL.
In addition, this effect of capillary barrier effect was created near the front of the model due to the presence of the gravel material.
Figure 11 illustrates the evolution of suctions where one can observe after the drop in suction following the wetting test, an increase in suction was observed at various sensors. The highest suction, 14 kPa, was measured at sensor 3.2. The lowest suctions, not exceeding 6 kPa, were measured at sensor 2.1. It is worth mentioning that all measured suctions remained below the Air Entry Value (AEV) of 22 kPa. These results agreed with measurements of volumetric water content.
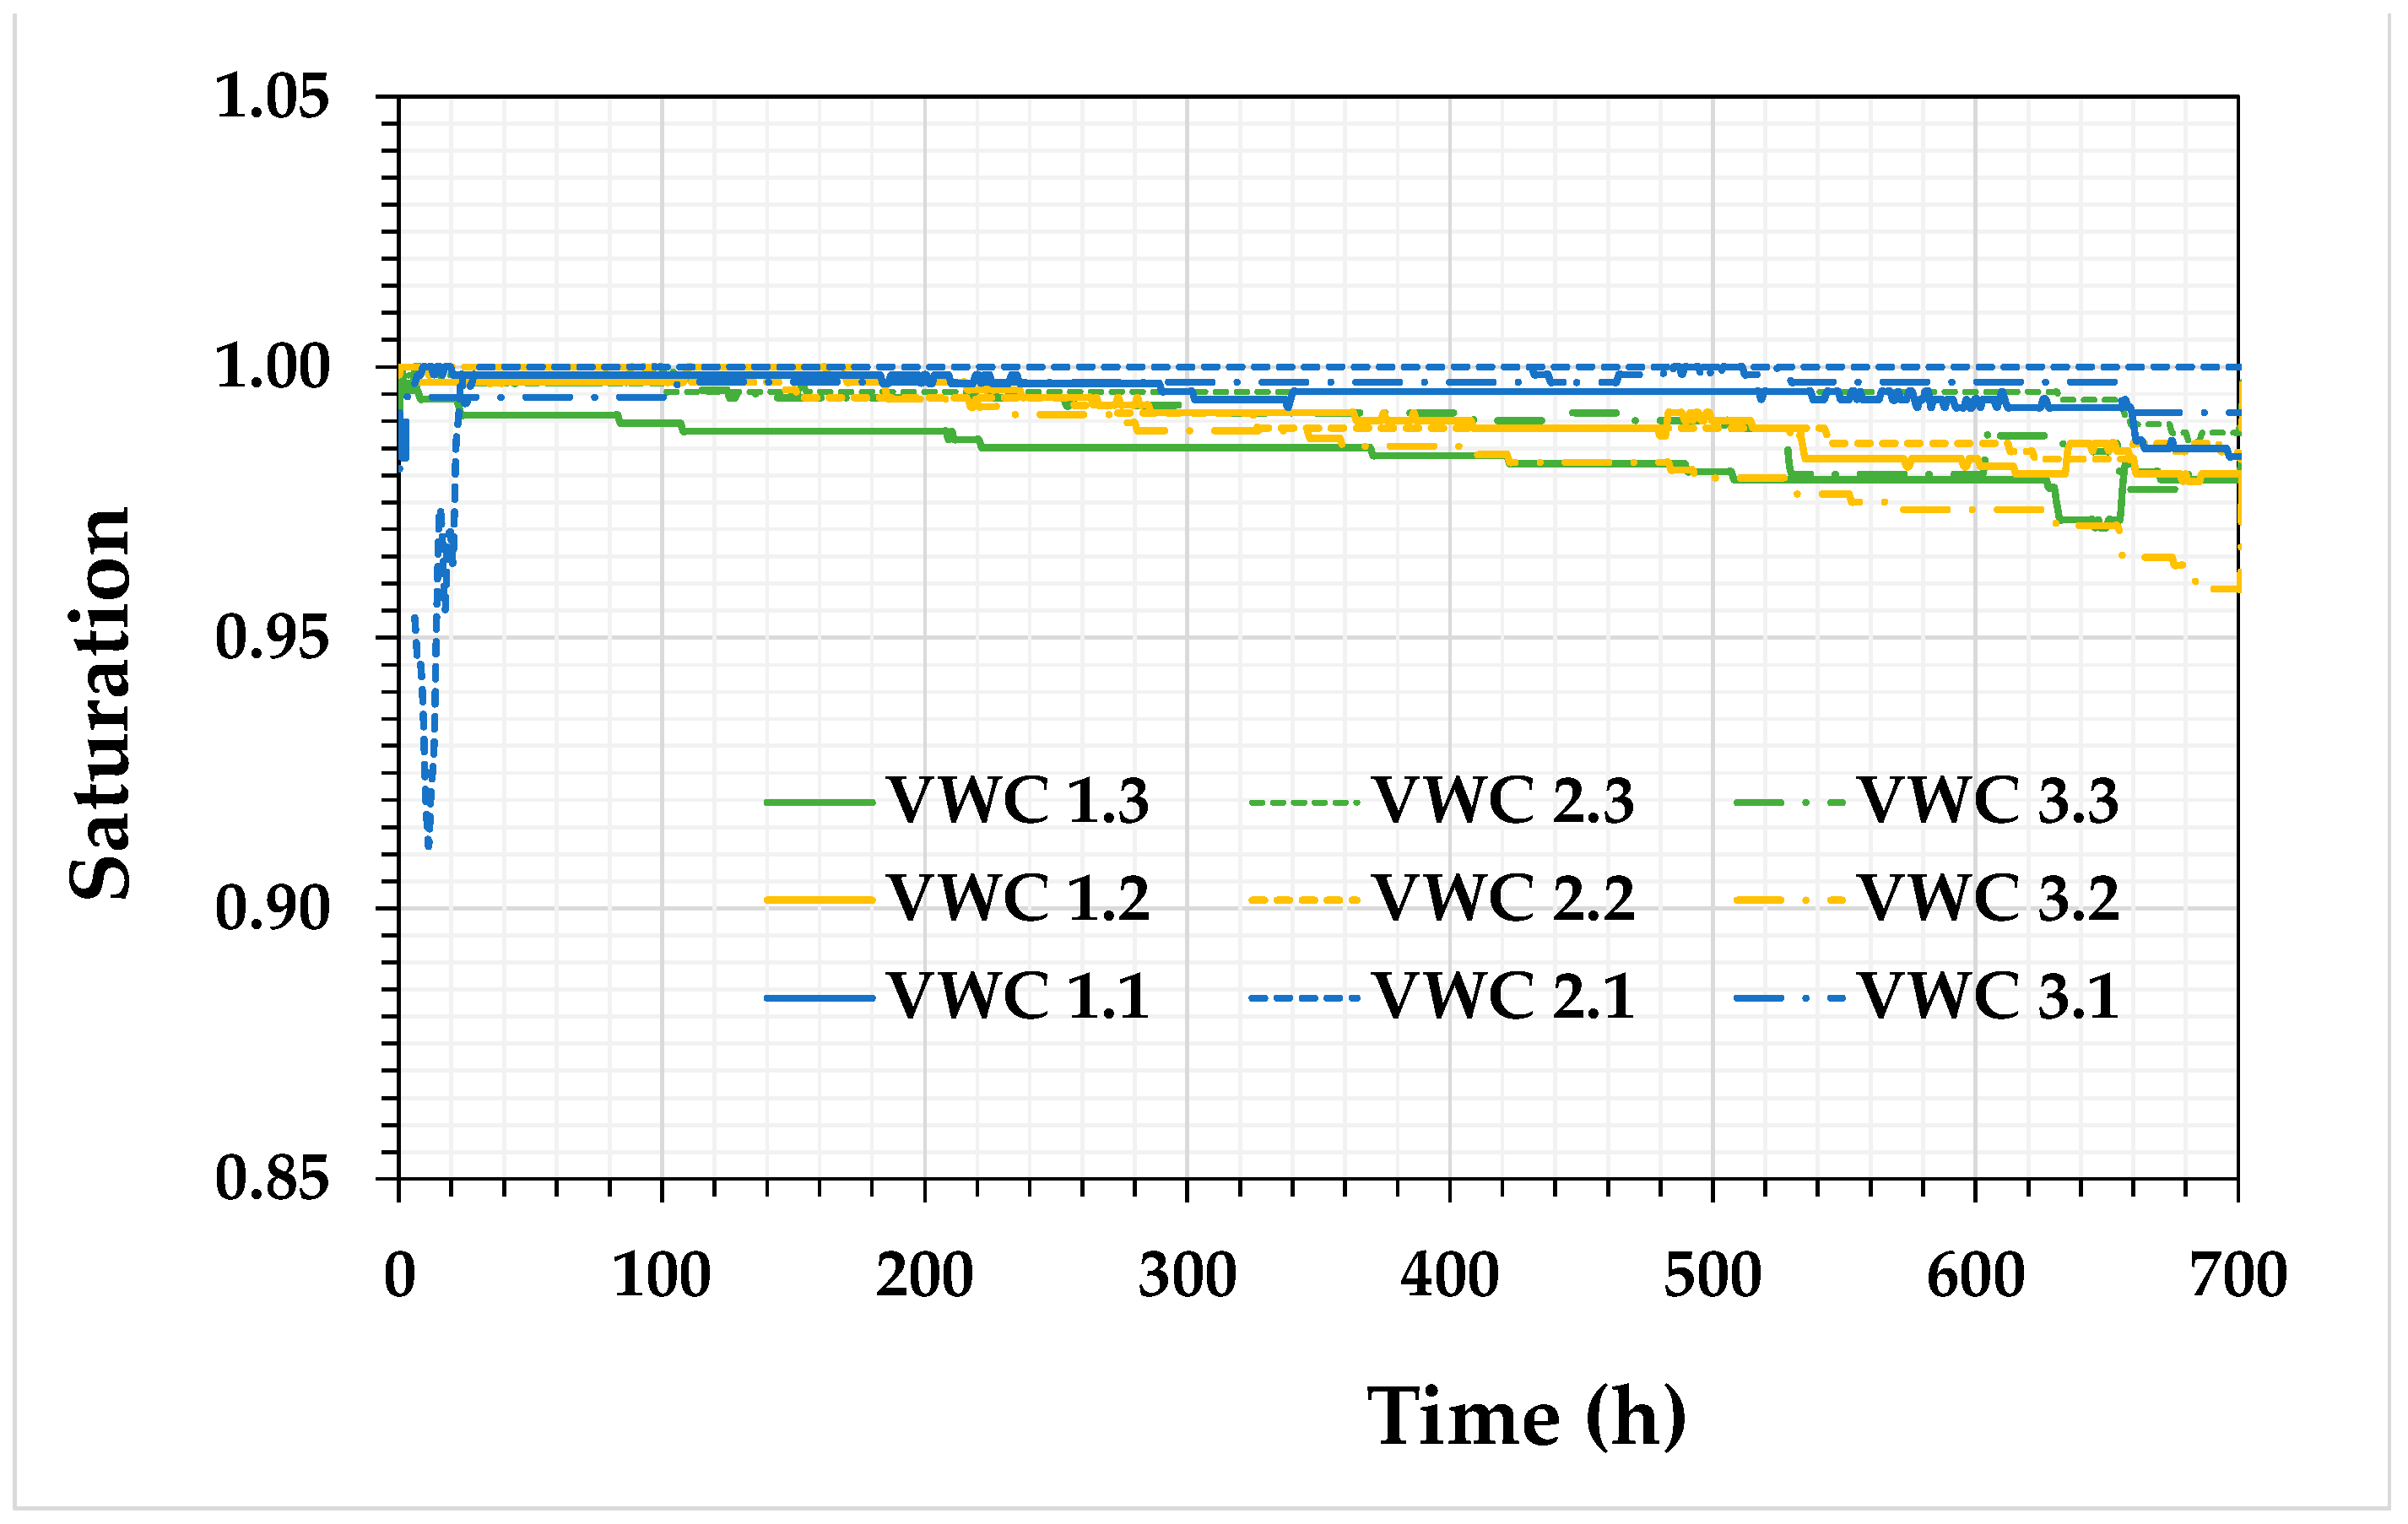
Results for the scenario with an FCL that was 50 cm thick with a 5° slope and a precipitation rate of 60.6 mm/h are presented in Figure 12 and Figure 13, showing saturation degrees and suctions respectively. The saturation degrees for a drainage period of 31 days indicated that desaturation was not significative. The sensor 1.3, located near the surface layer, showed the lowest degree of saturation which was close to 97%. The other sensors displayed saturation degrees equal to or greater than 98%. These saturation values showed a good retention capacity of the sludge–slag mixture, similarly to the previous case. The saturation of the FCL was favorized by the capillary barrier effect created between an FCL and a gravel layer due to the contrast in the hydraulic properties of used materials. It is worth mentioning that the FCL had some saturation at the start of this test, which contributed to explaining the high saturation measured during this period.

Figure 12.
Saturation profiles for the scenario with an FCL thickness of 50 cm and a slope of 5°.
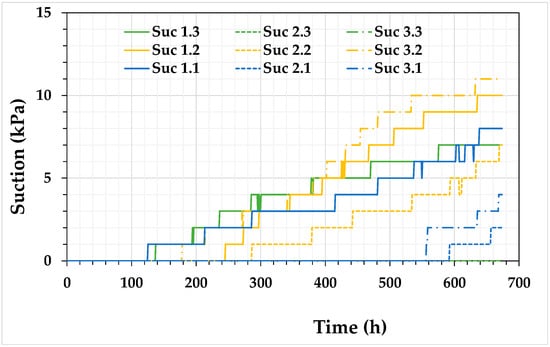
Figure 13.
Suction profiles for the scenario with an FCL thickness of 50 cm and a slope of 5°.
At the end of the drainage period, the highest suction, 11 kPa, was measured at sensor 3.2. The lowest suctions, not exceeding 2 kPa, were measured at sensor 2.1. It is worth mentioning that all measured suctions remained below the AEV of 22 kPa (calculated using the tangent method in the water retention curve). These results agreed with measurements of volumetric water content.
Measurement results showed that infiltration rates through the model were lower than runoff rates and the FCL layer remained highly saturated. It is important to note that the drain layer positioned at the model’s end enhanced water retention, potentially affecting diversion capacity. This hypothesis will be further evaluated using numerical modeling.
3.3. Numerical Simulation Results
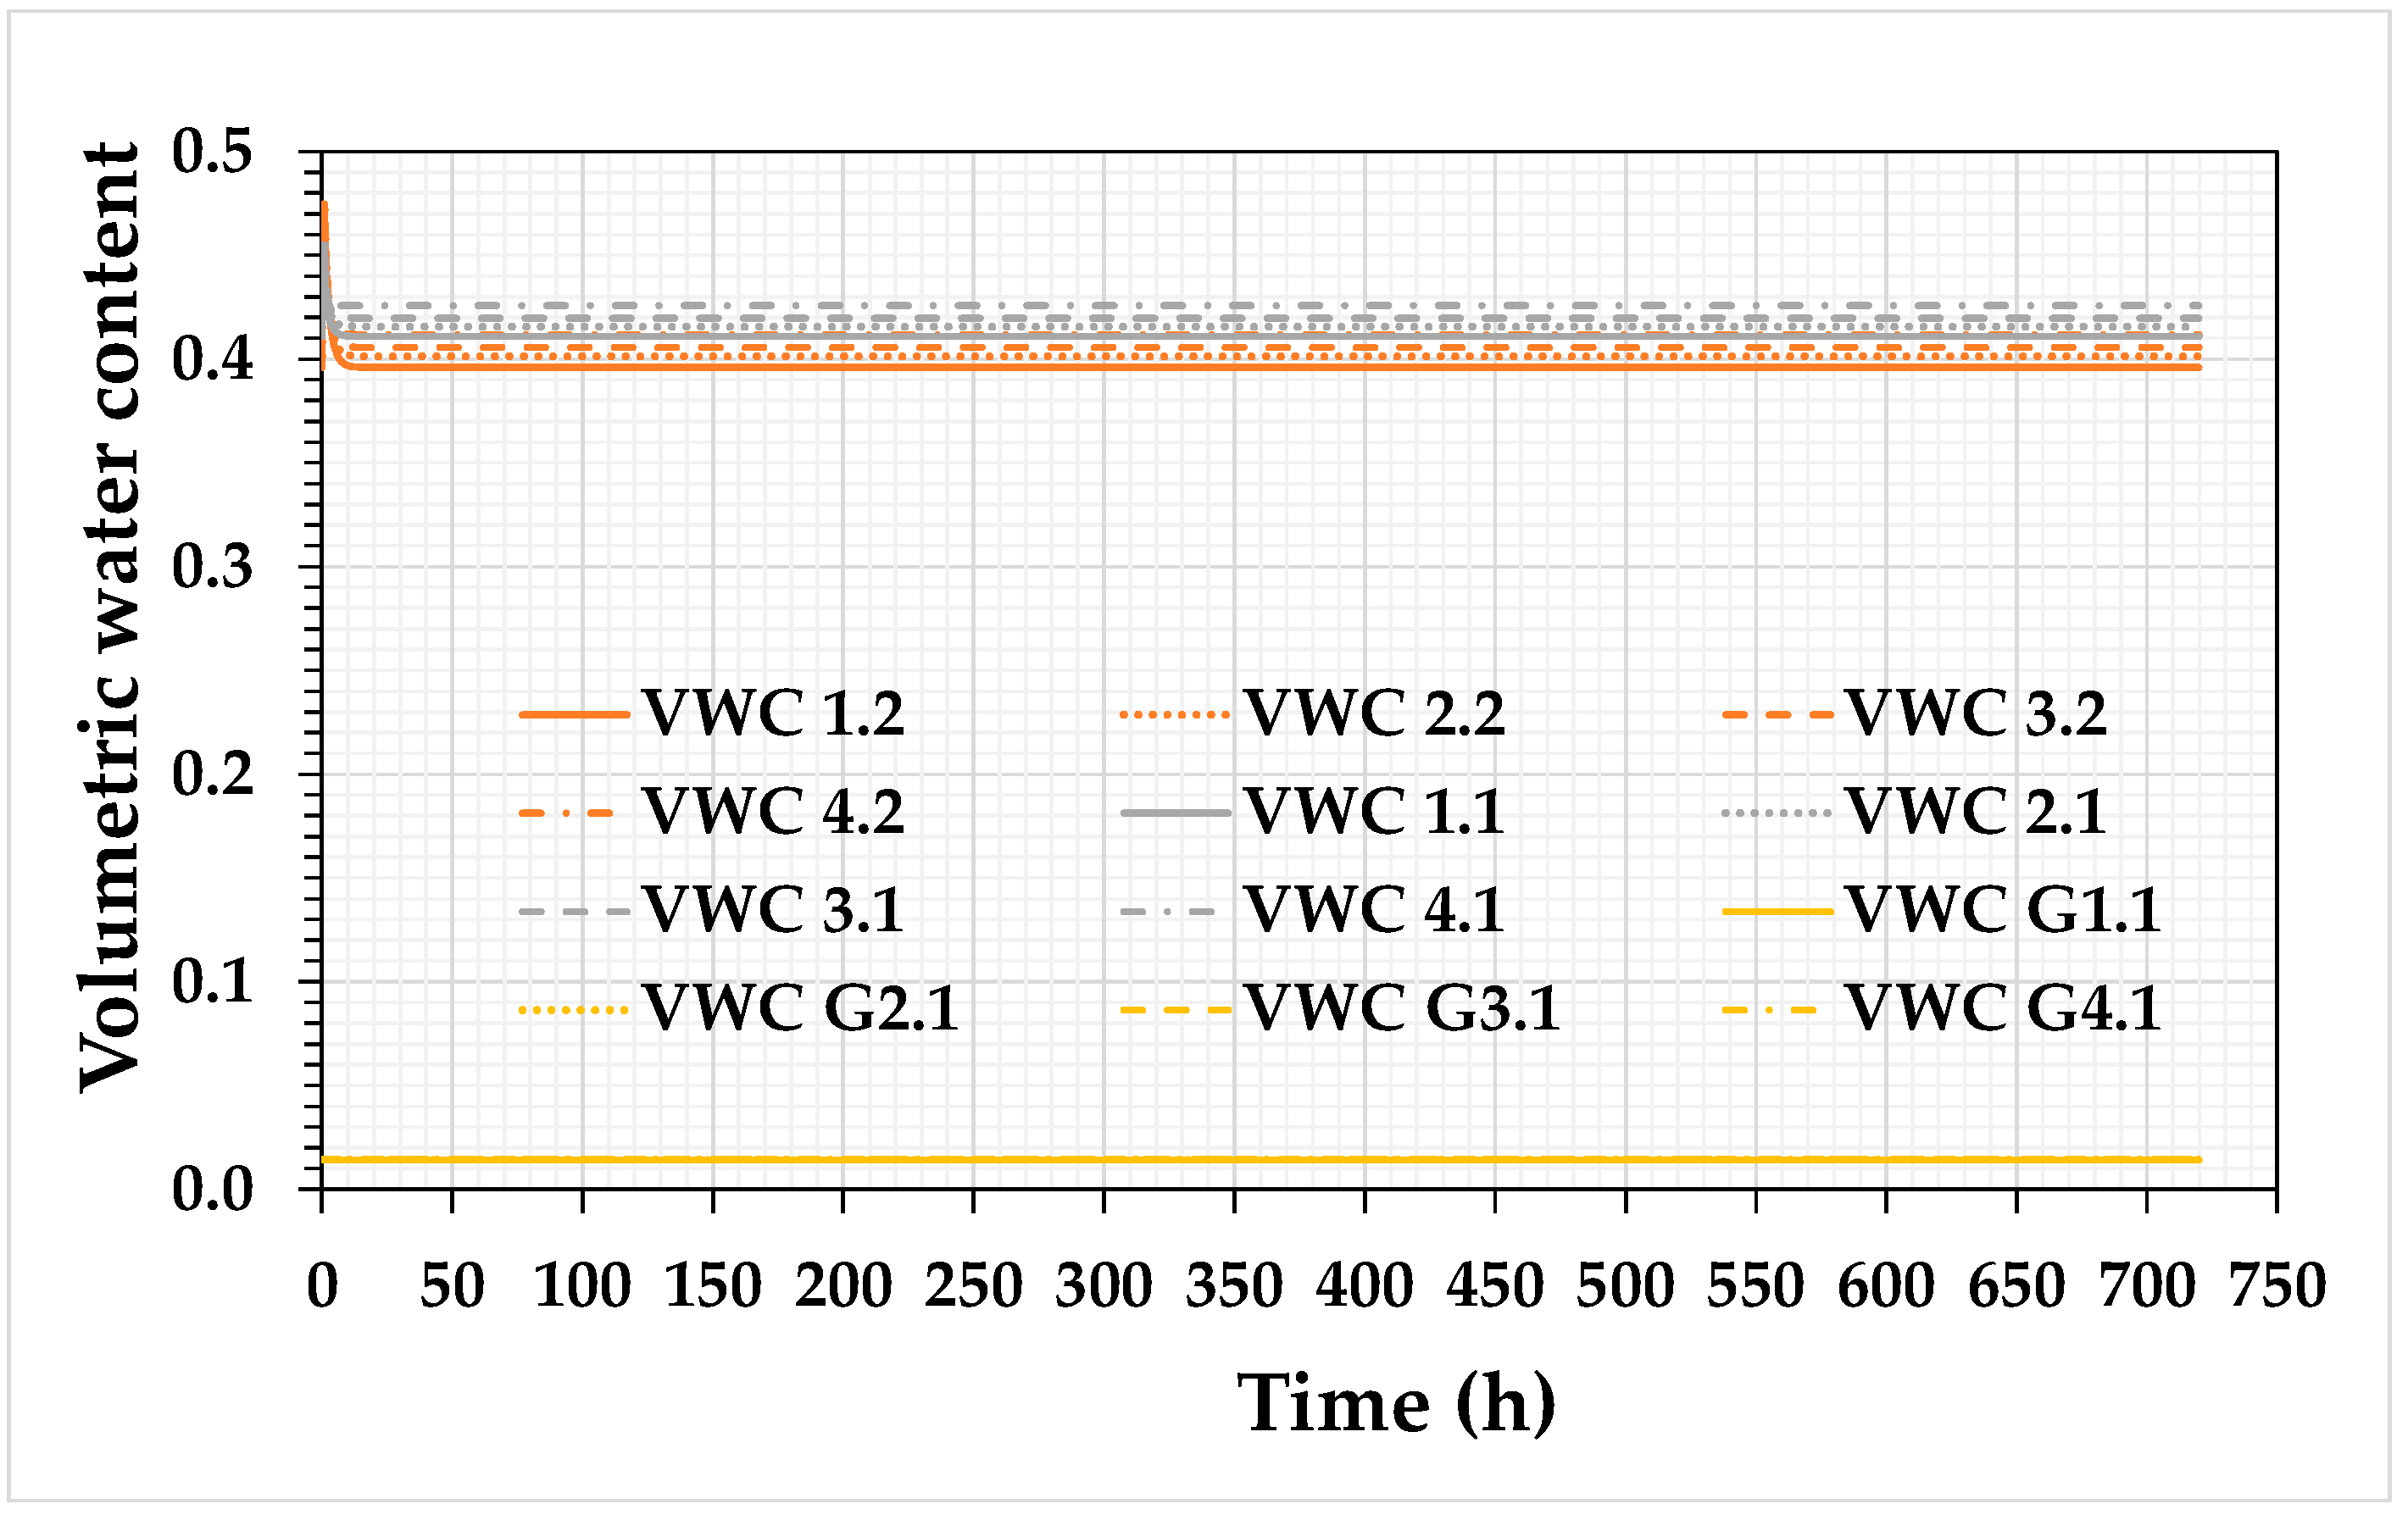
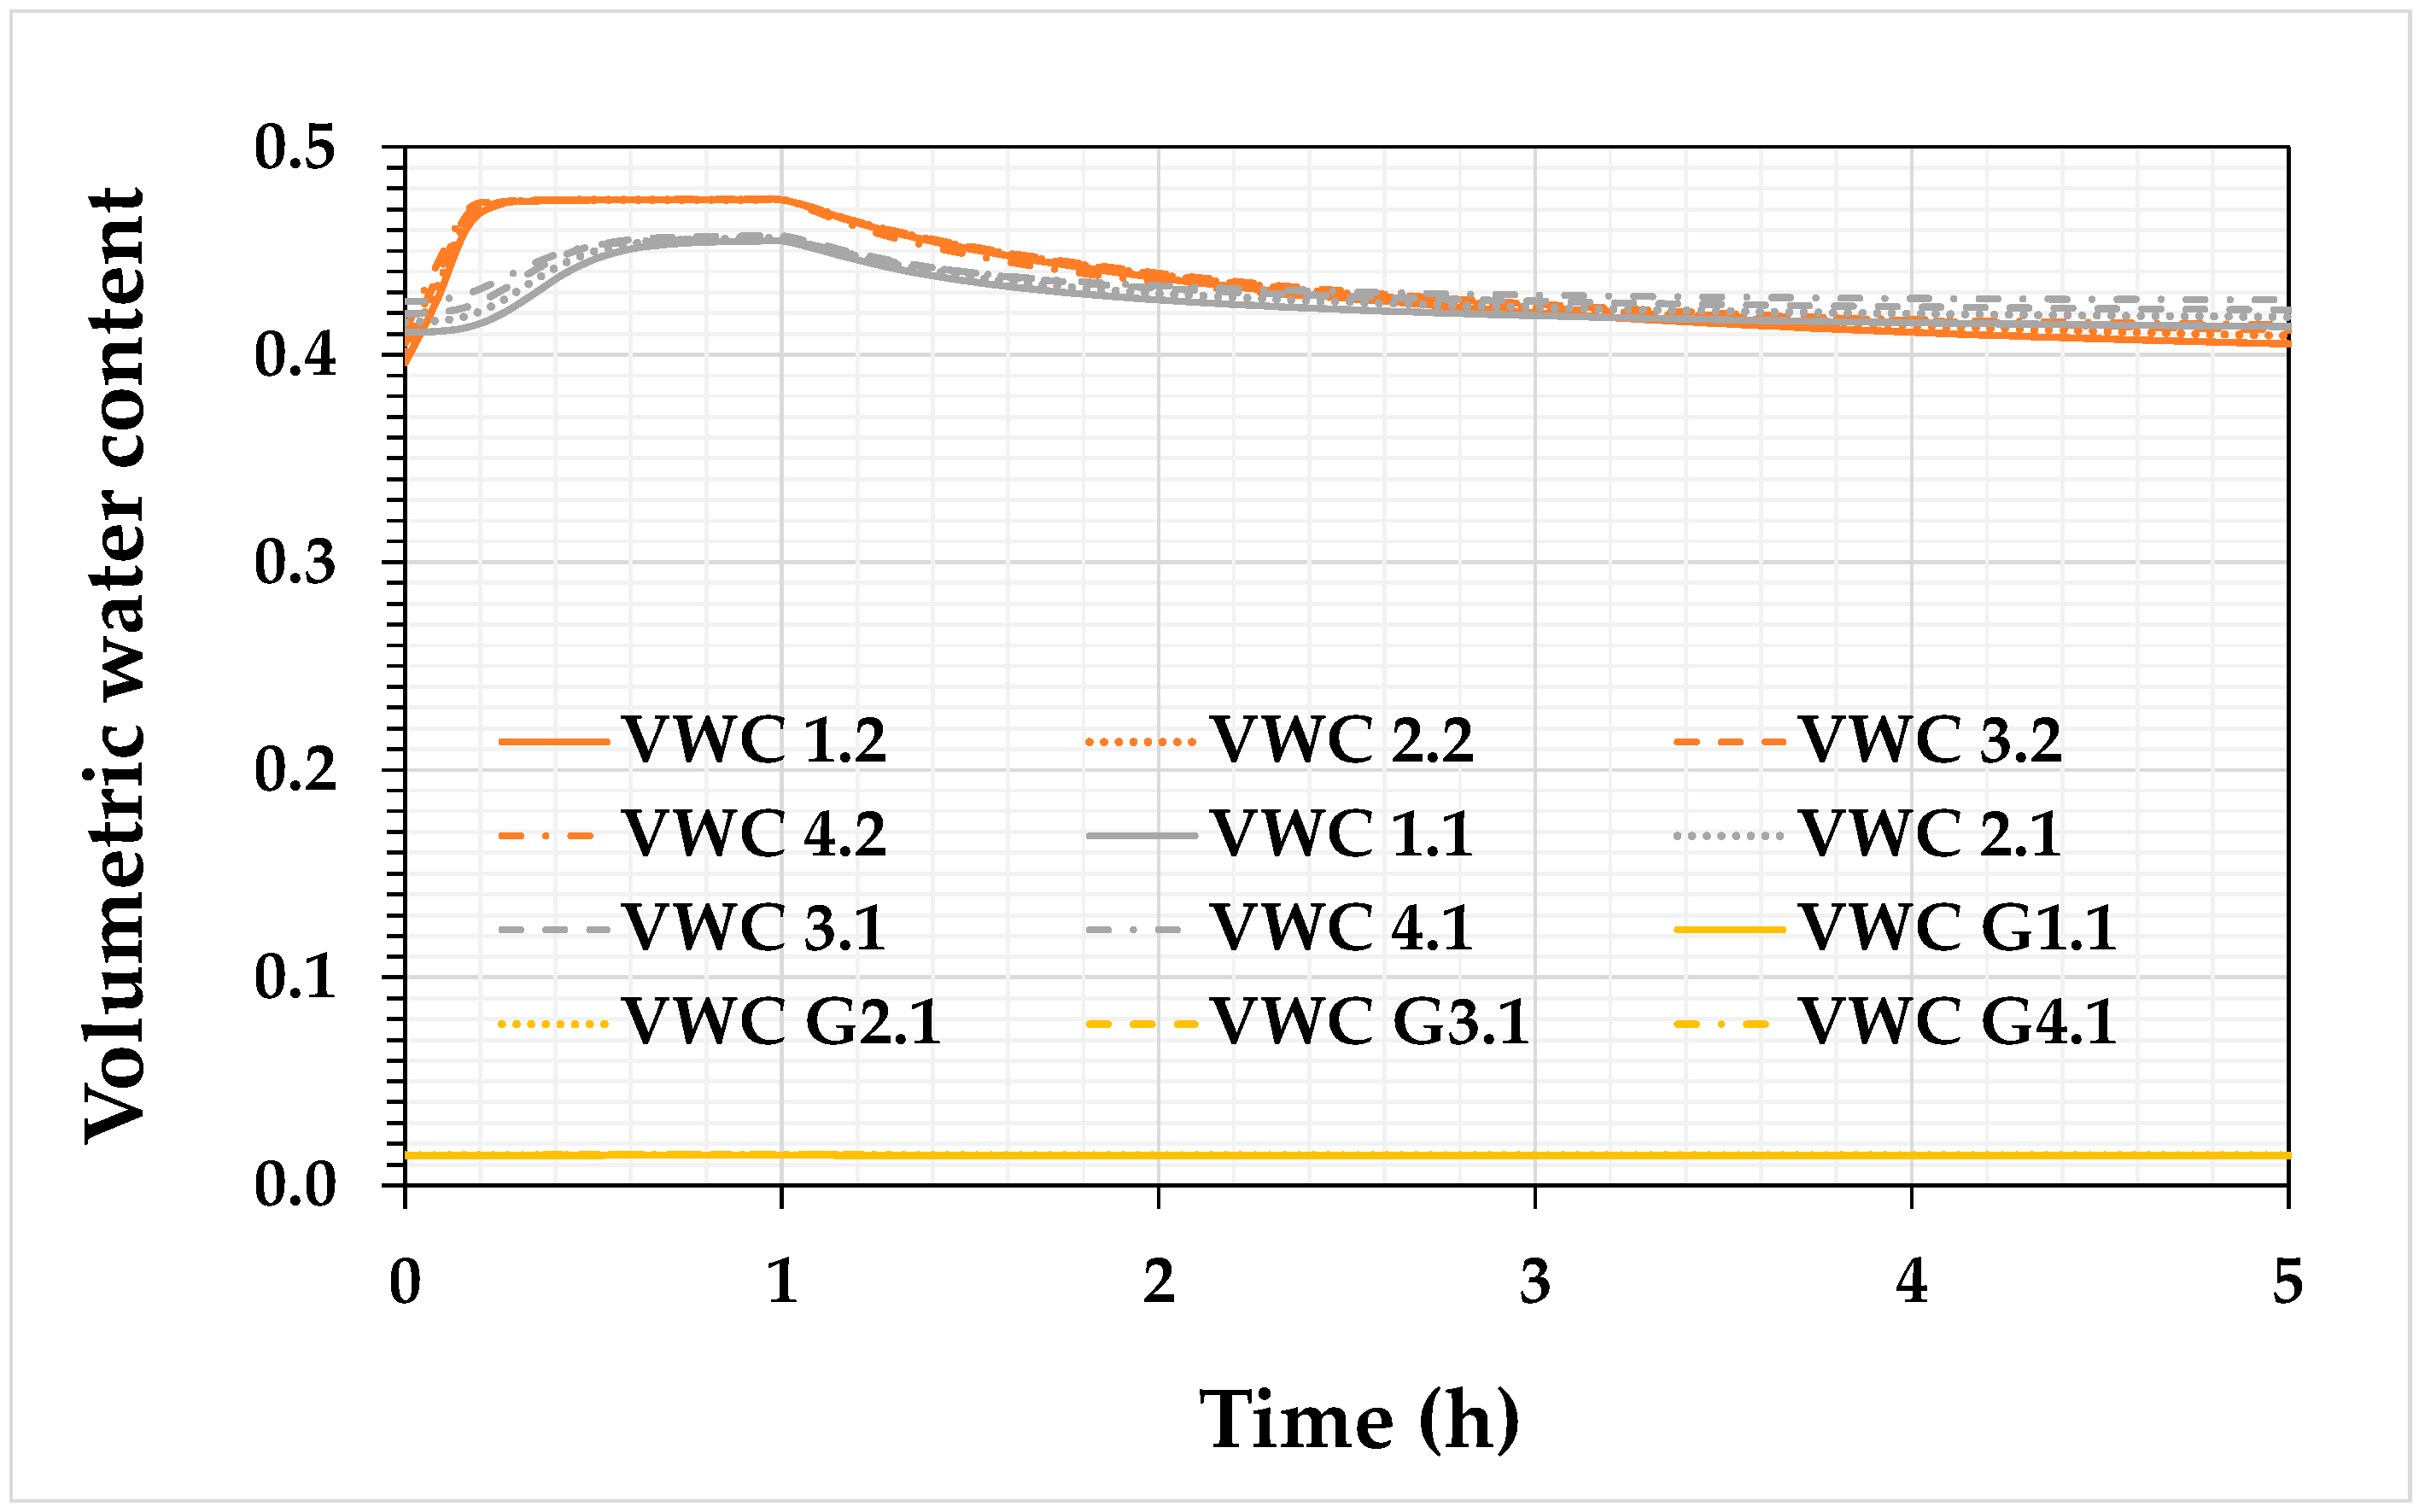
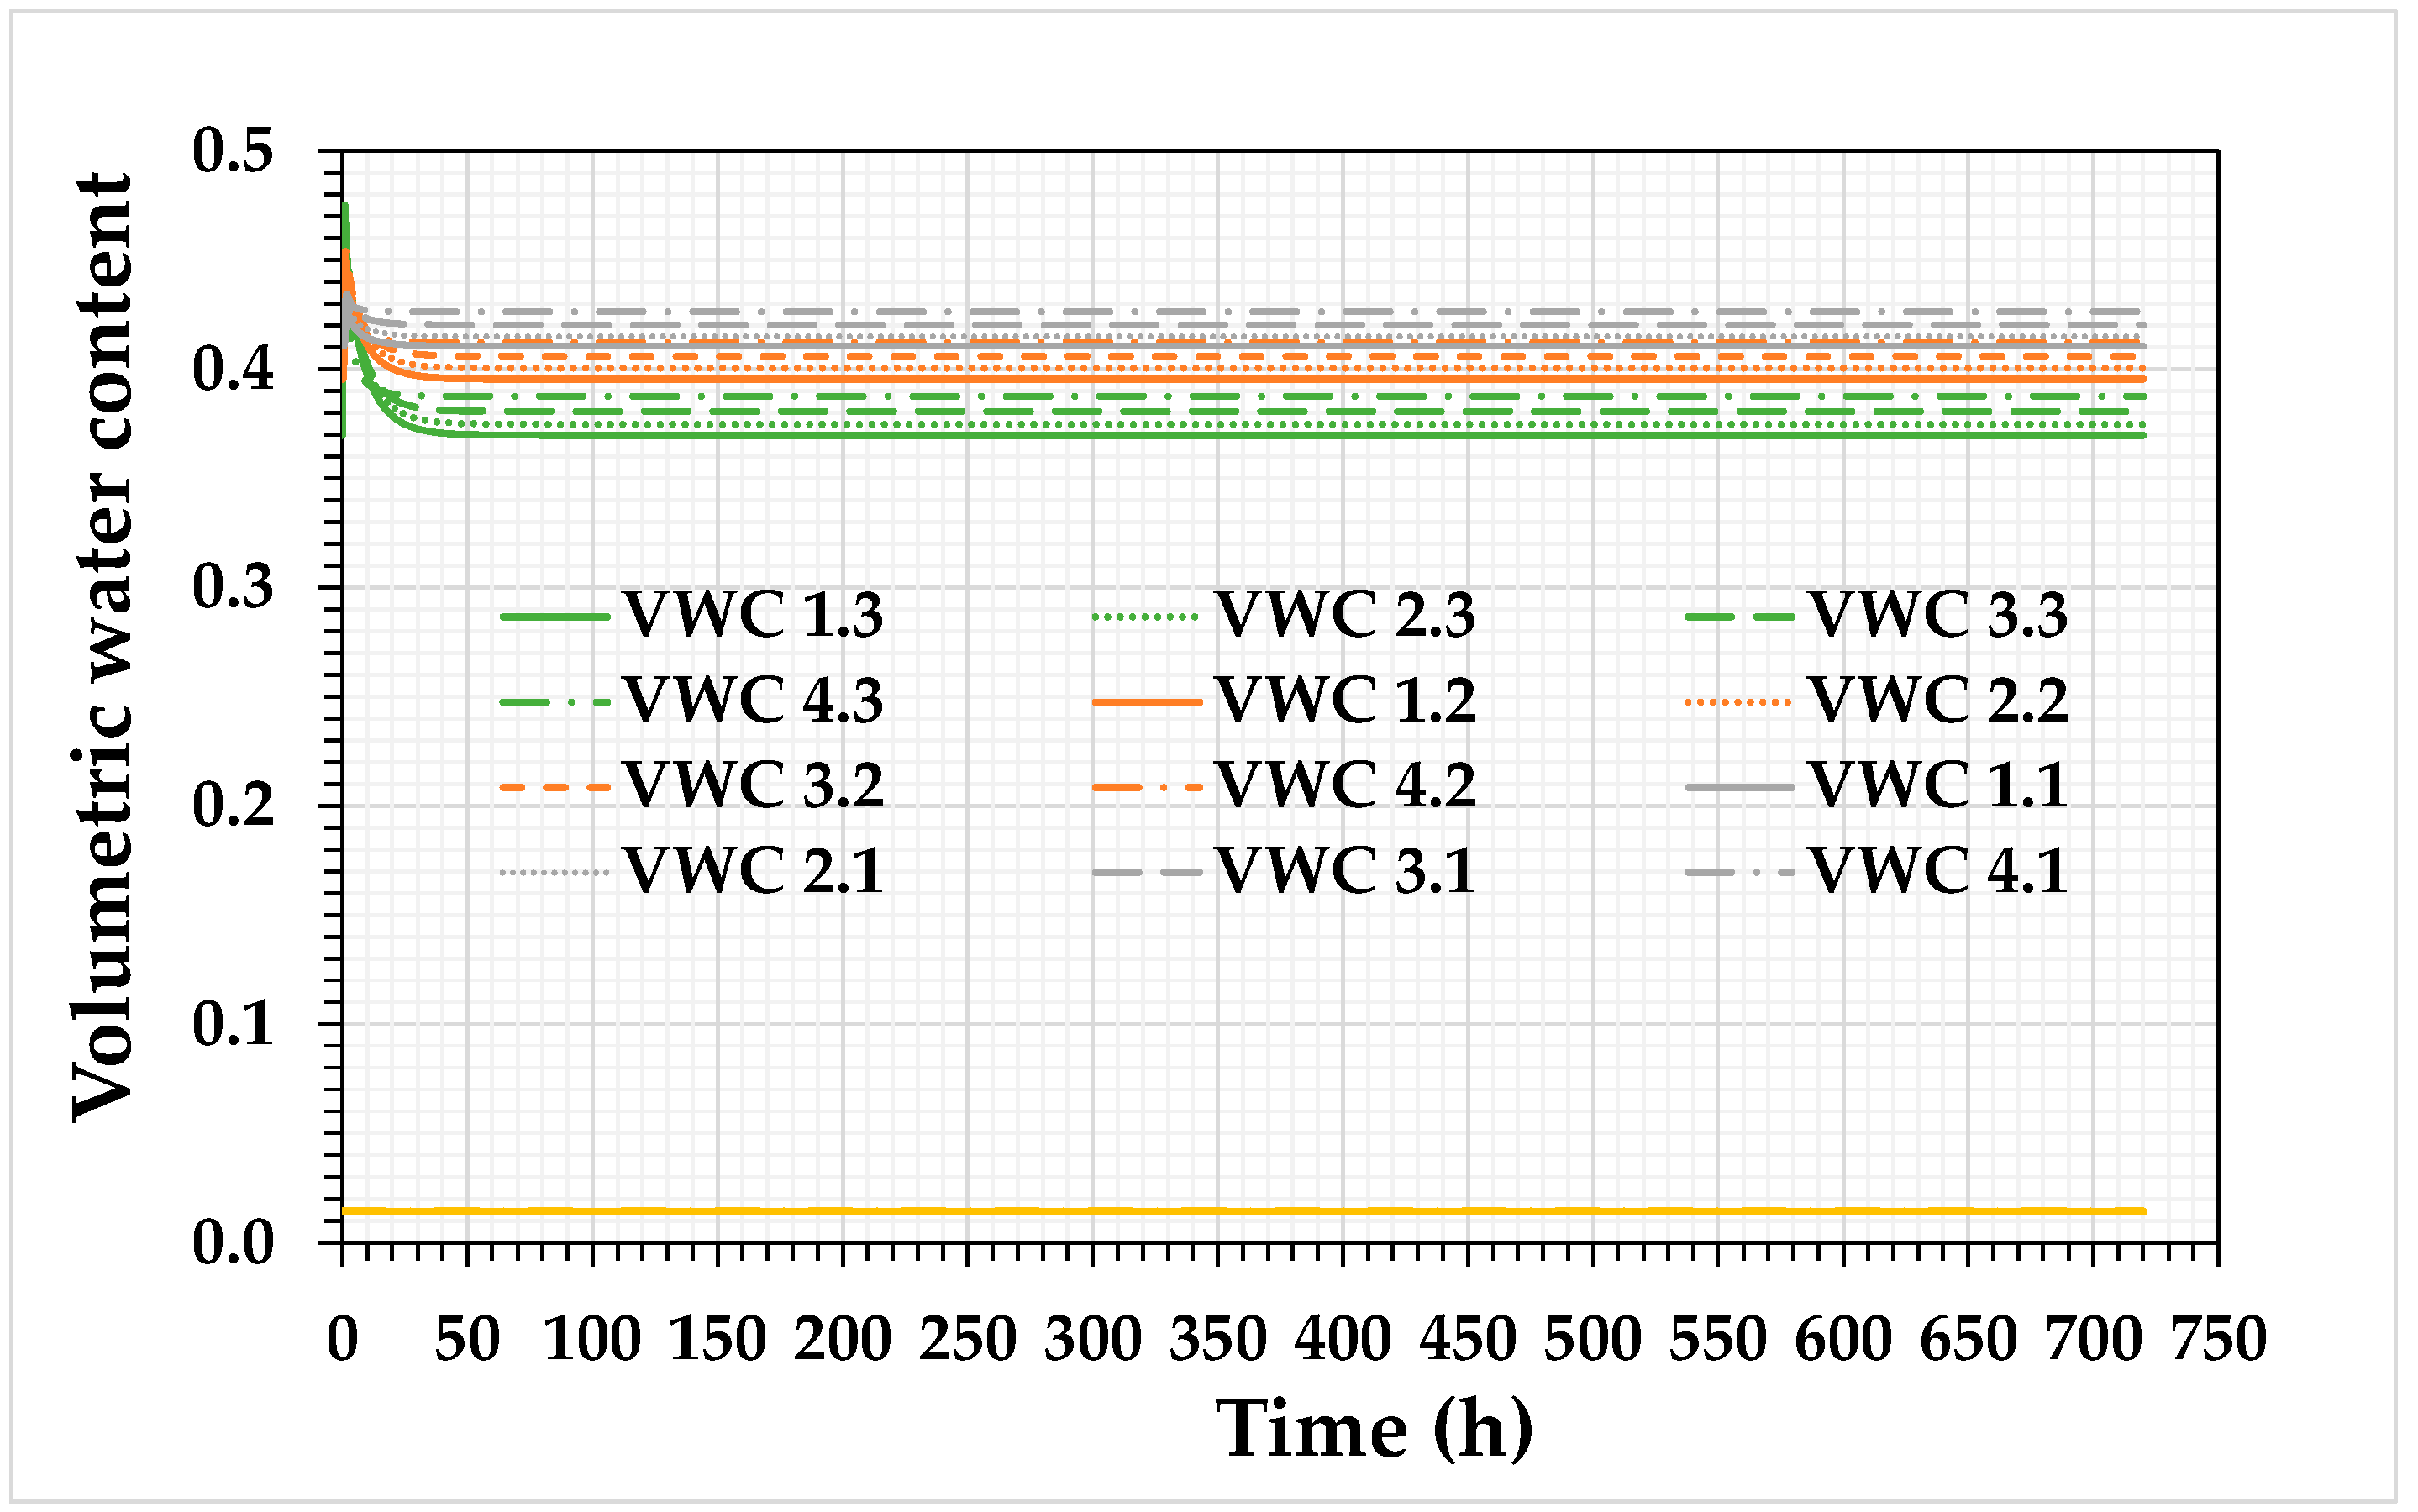
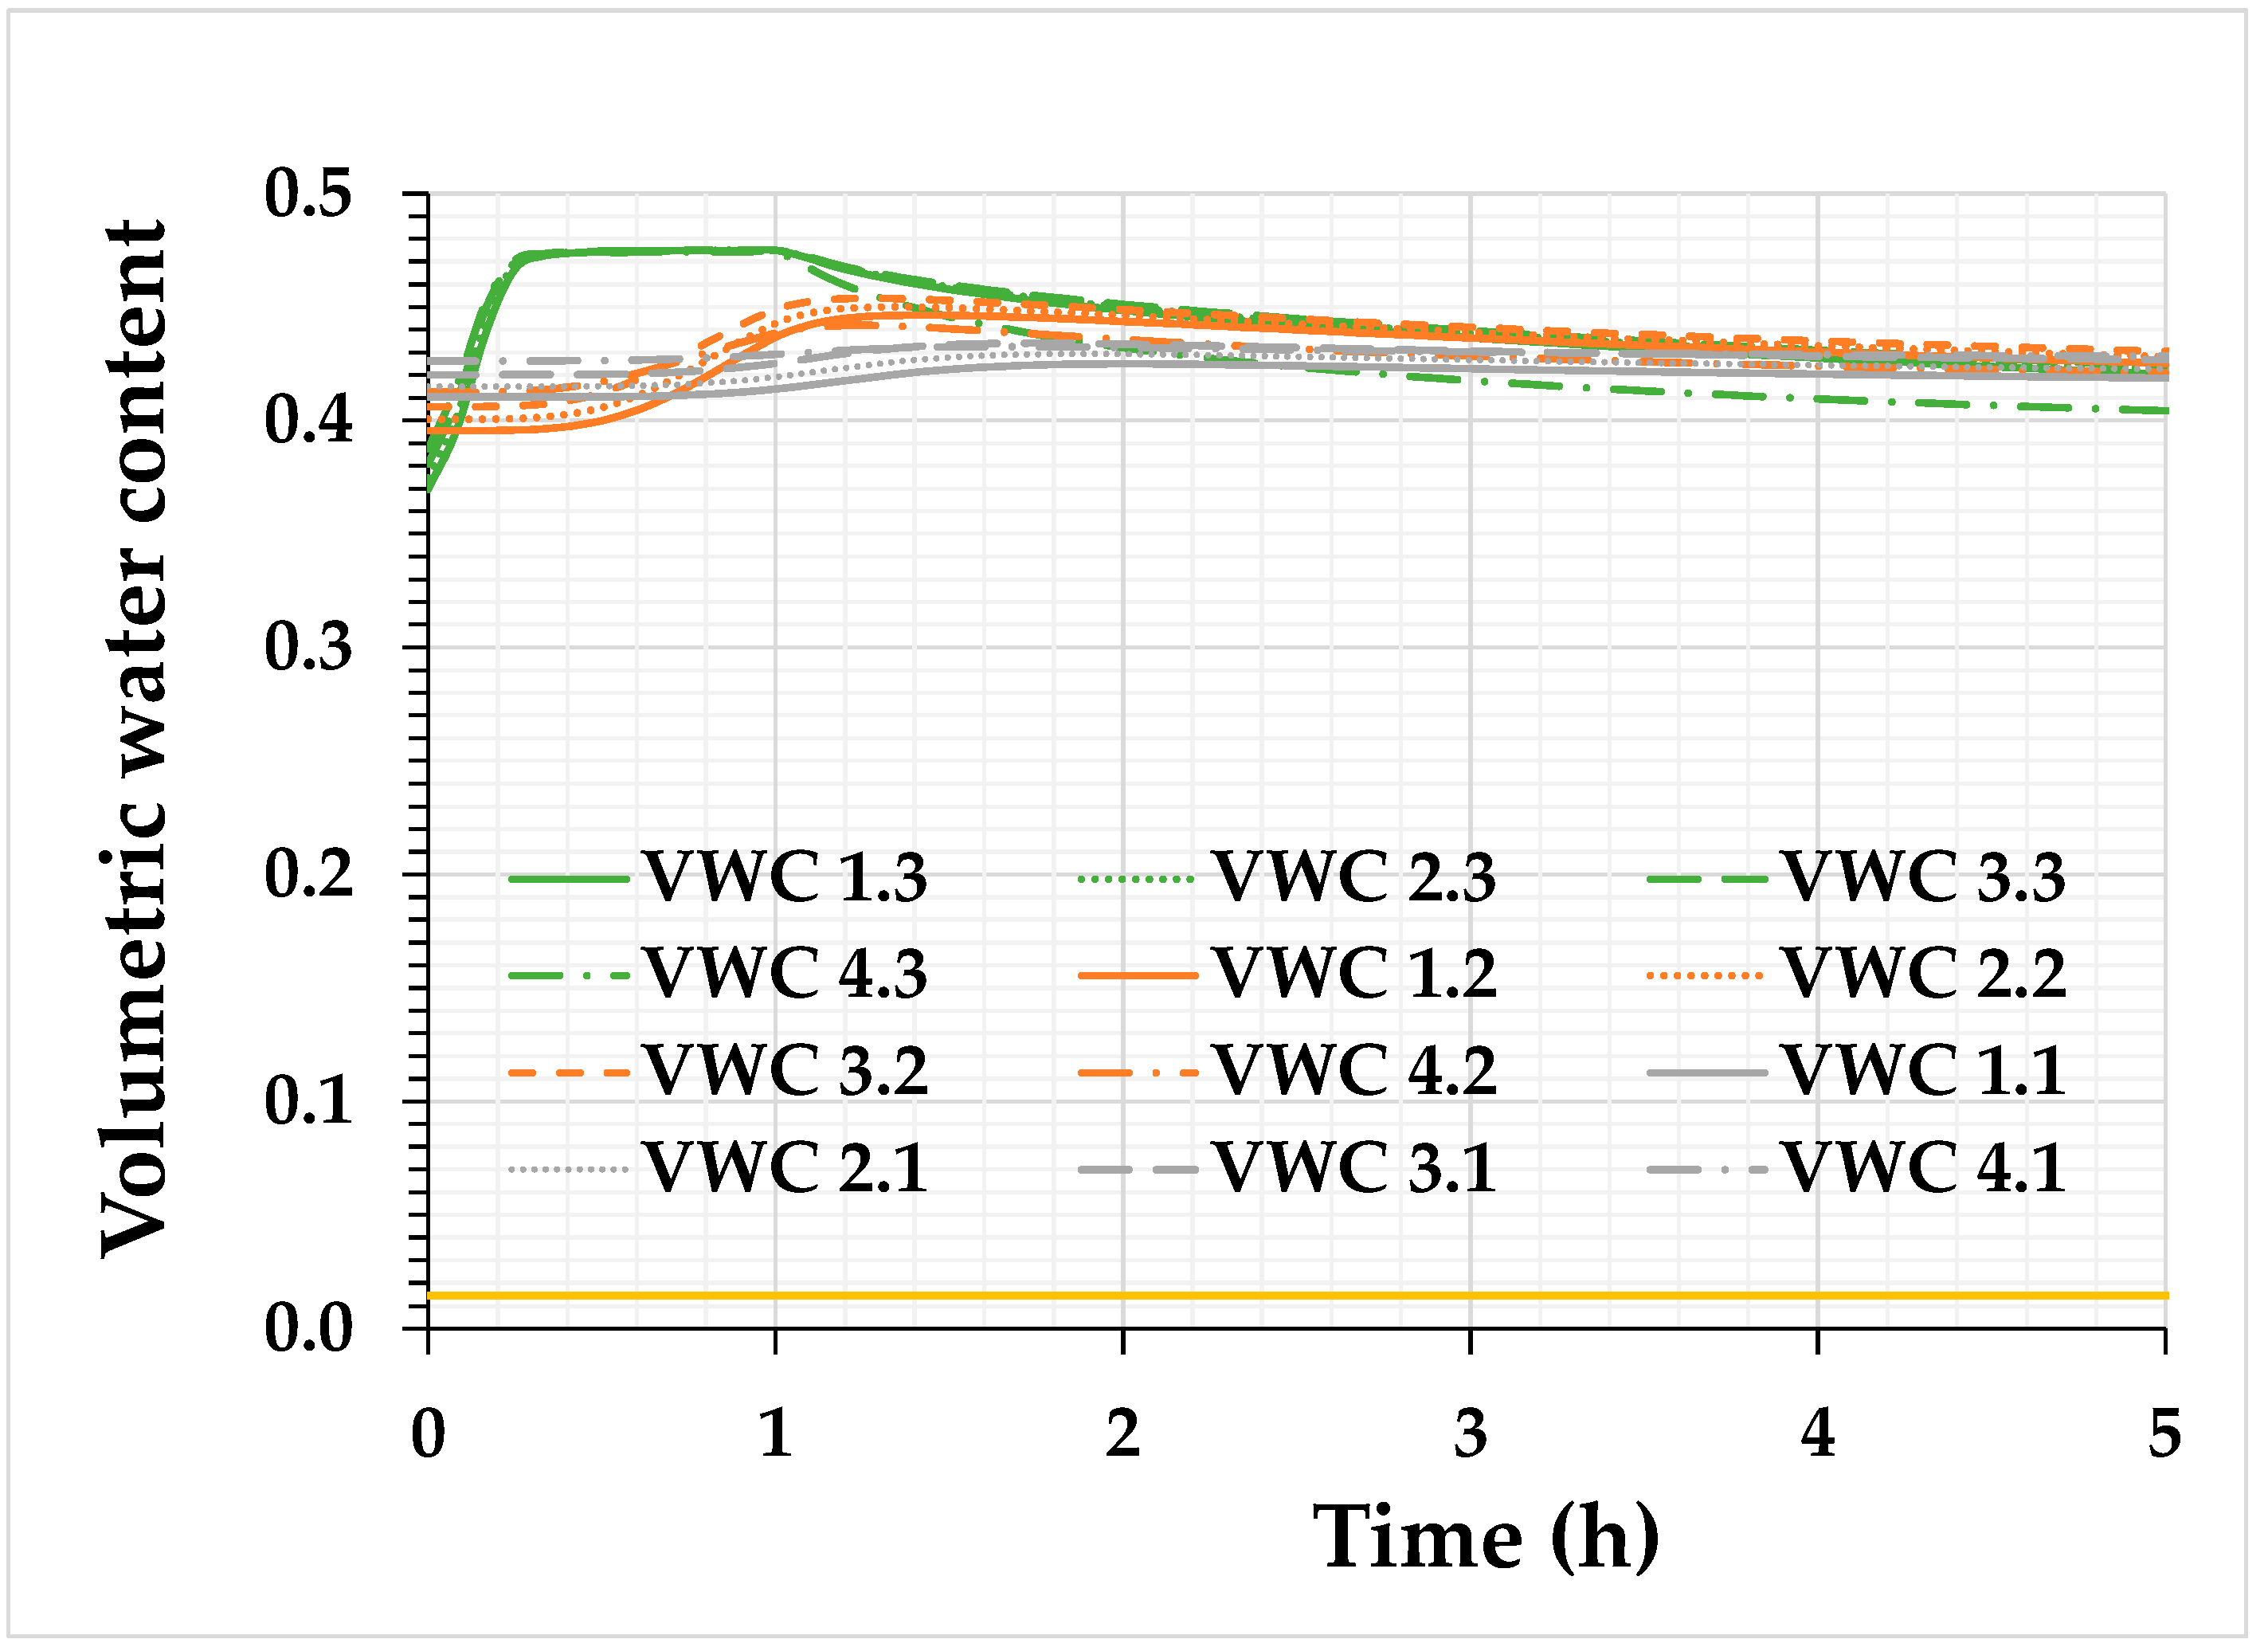
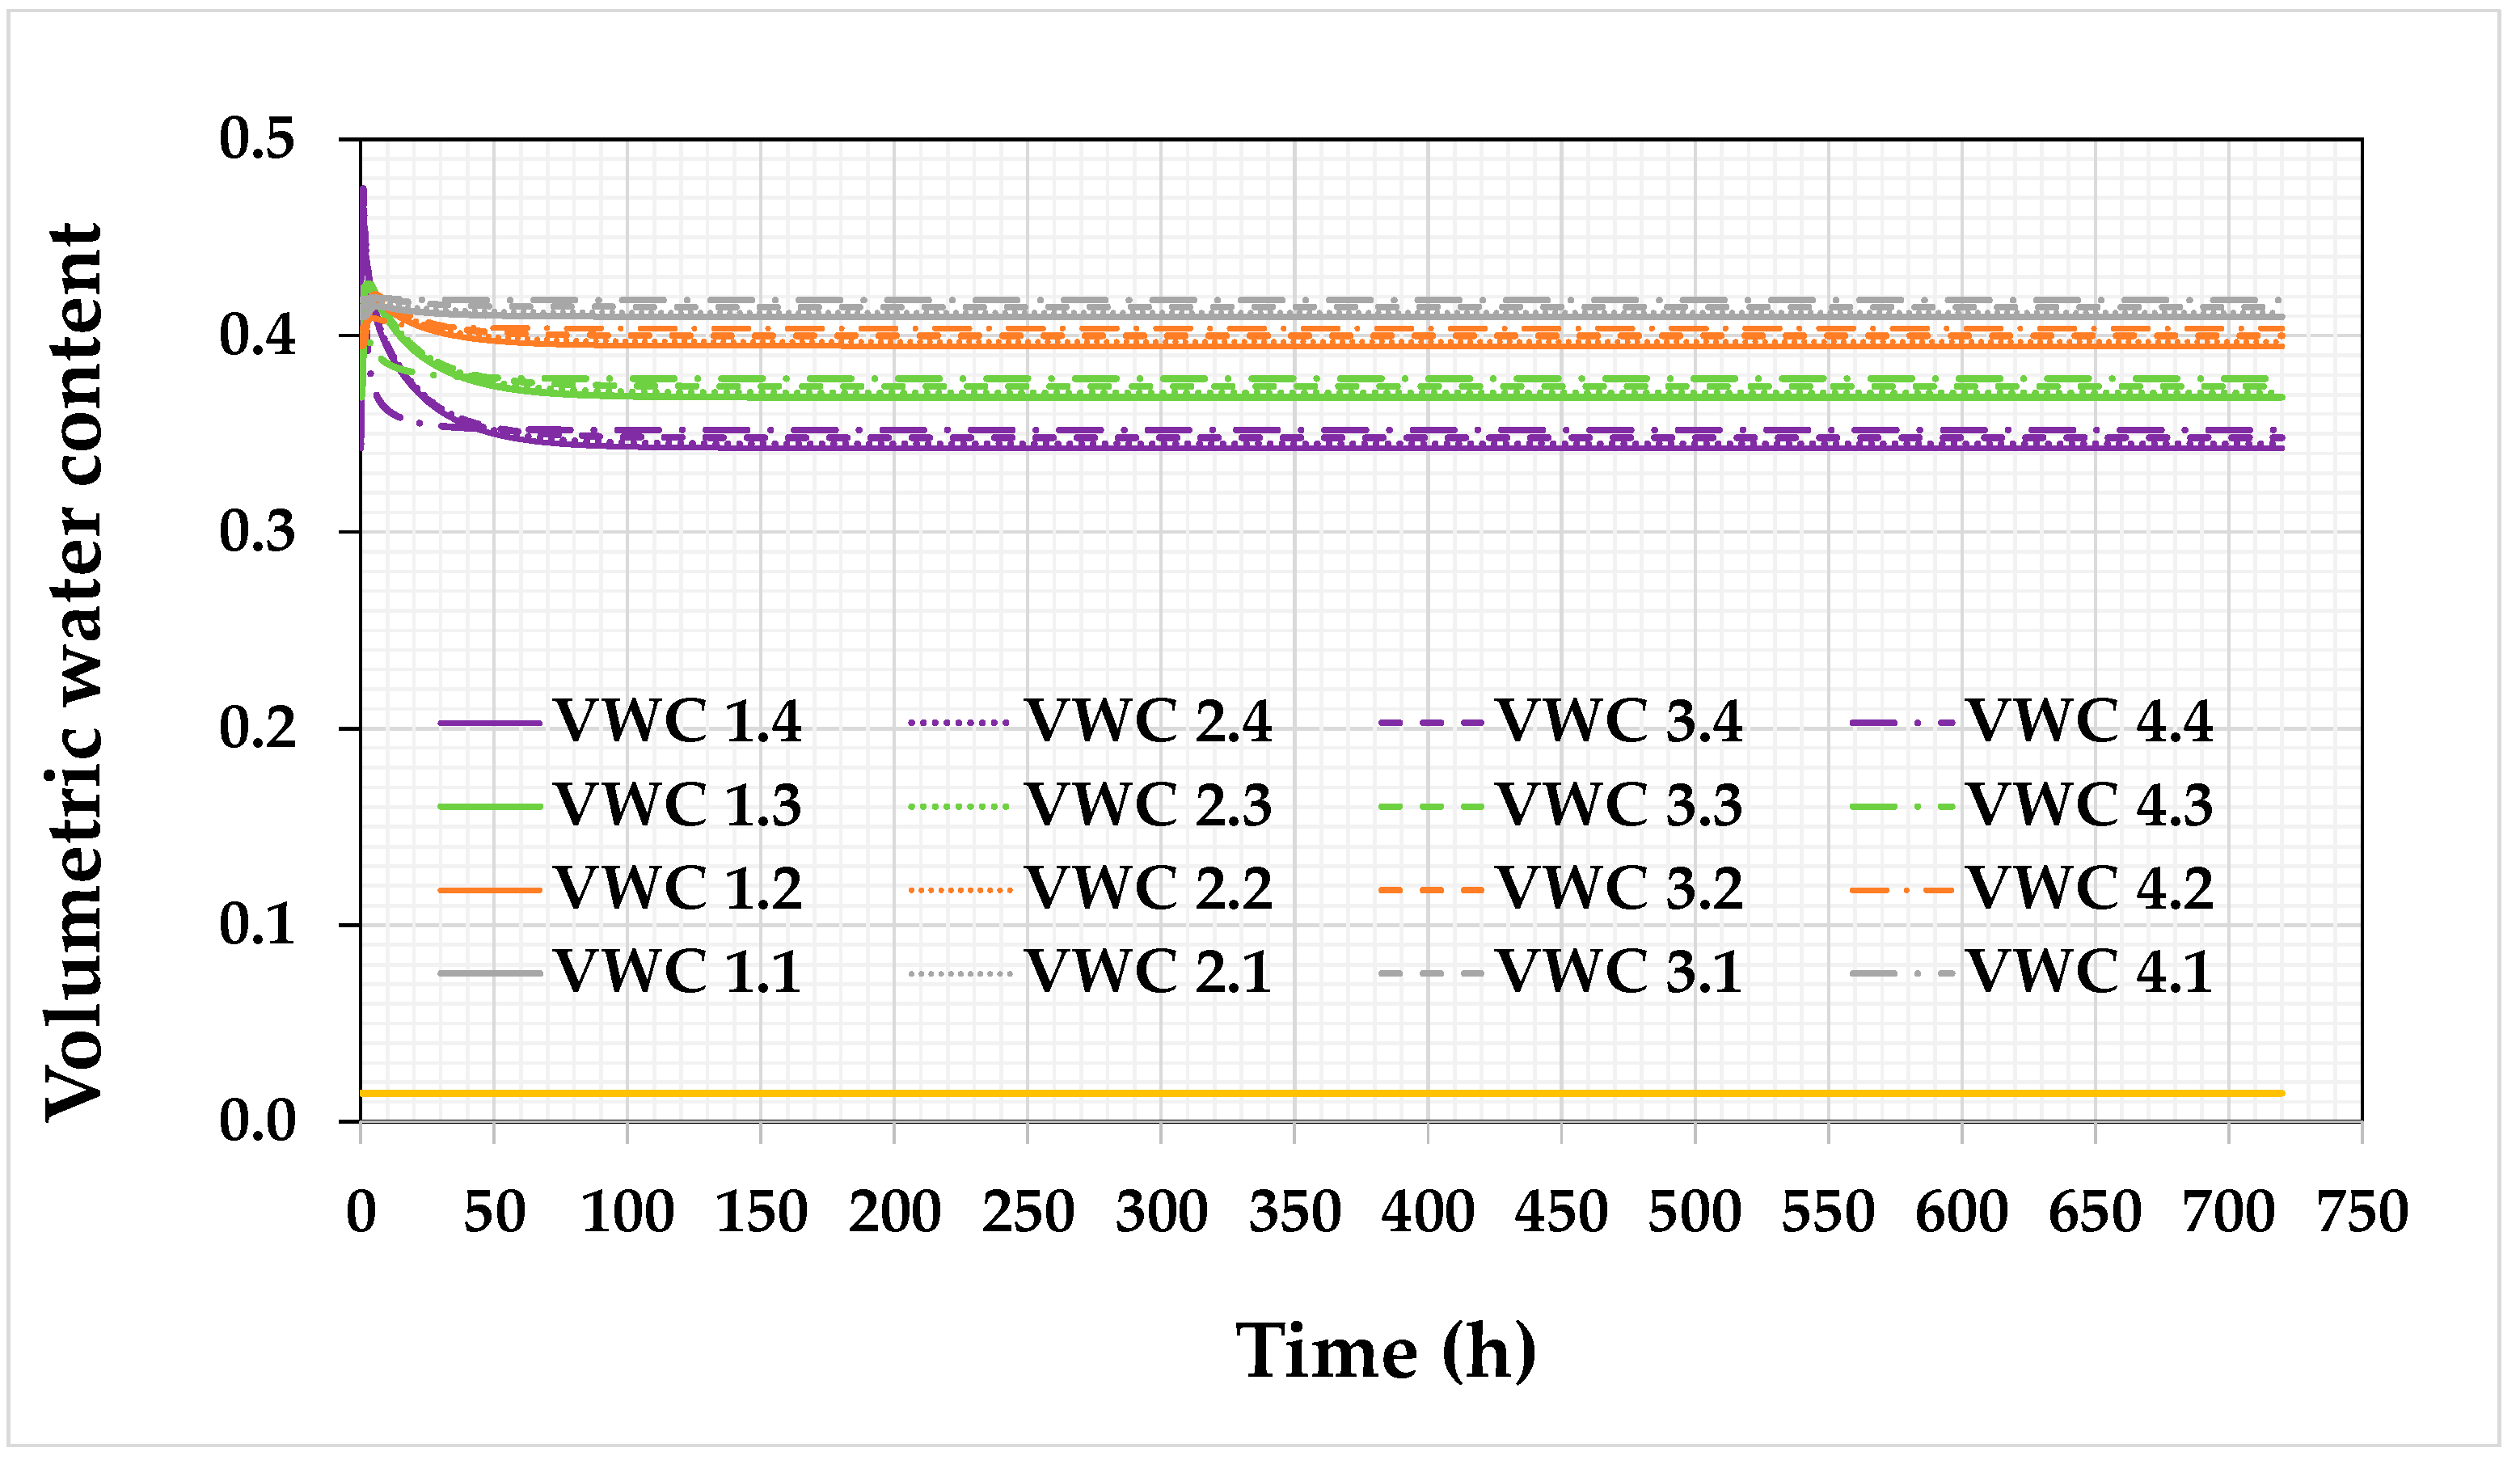
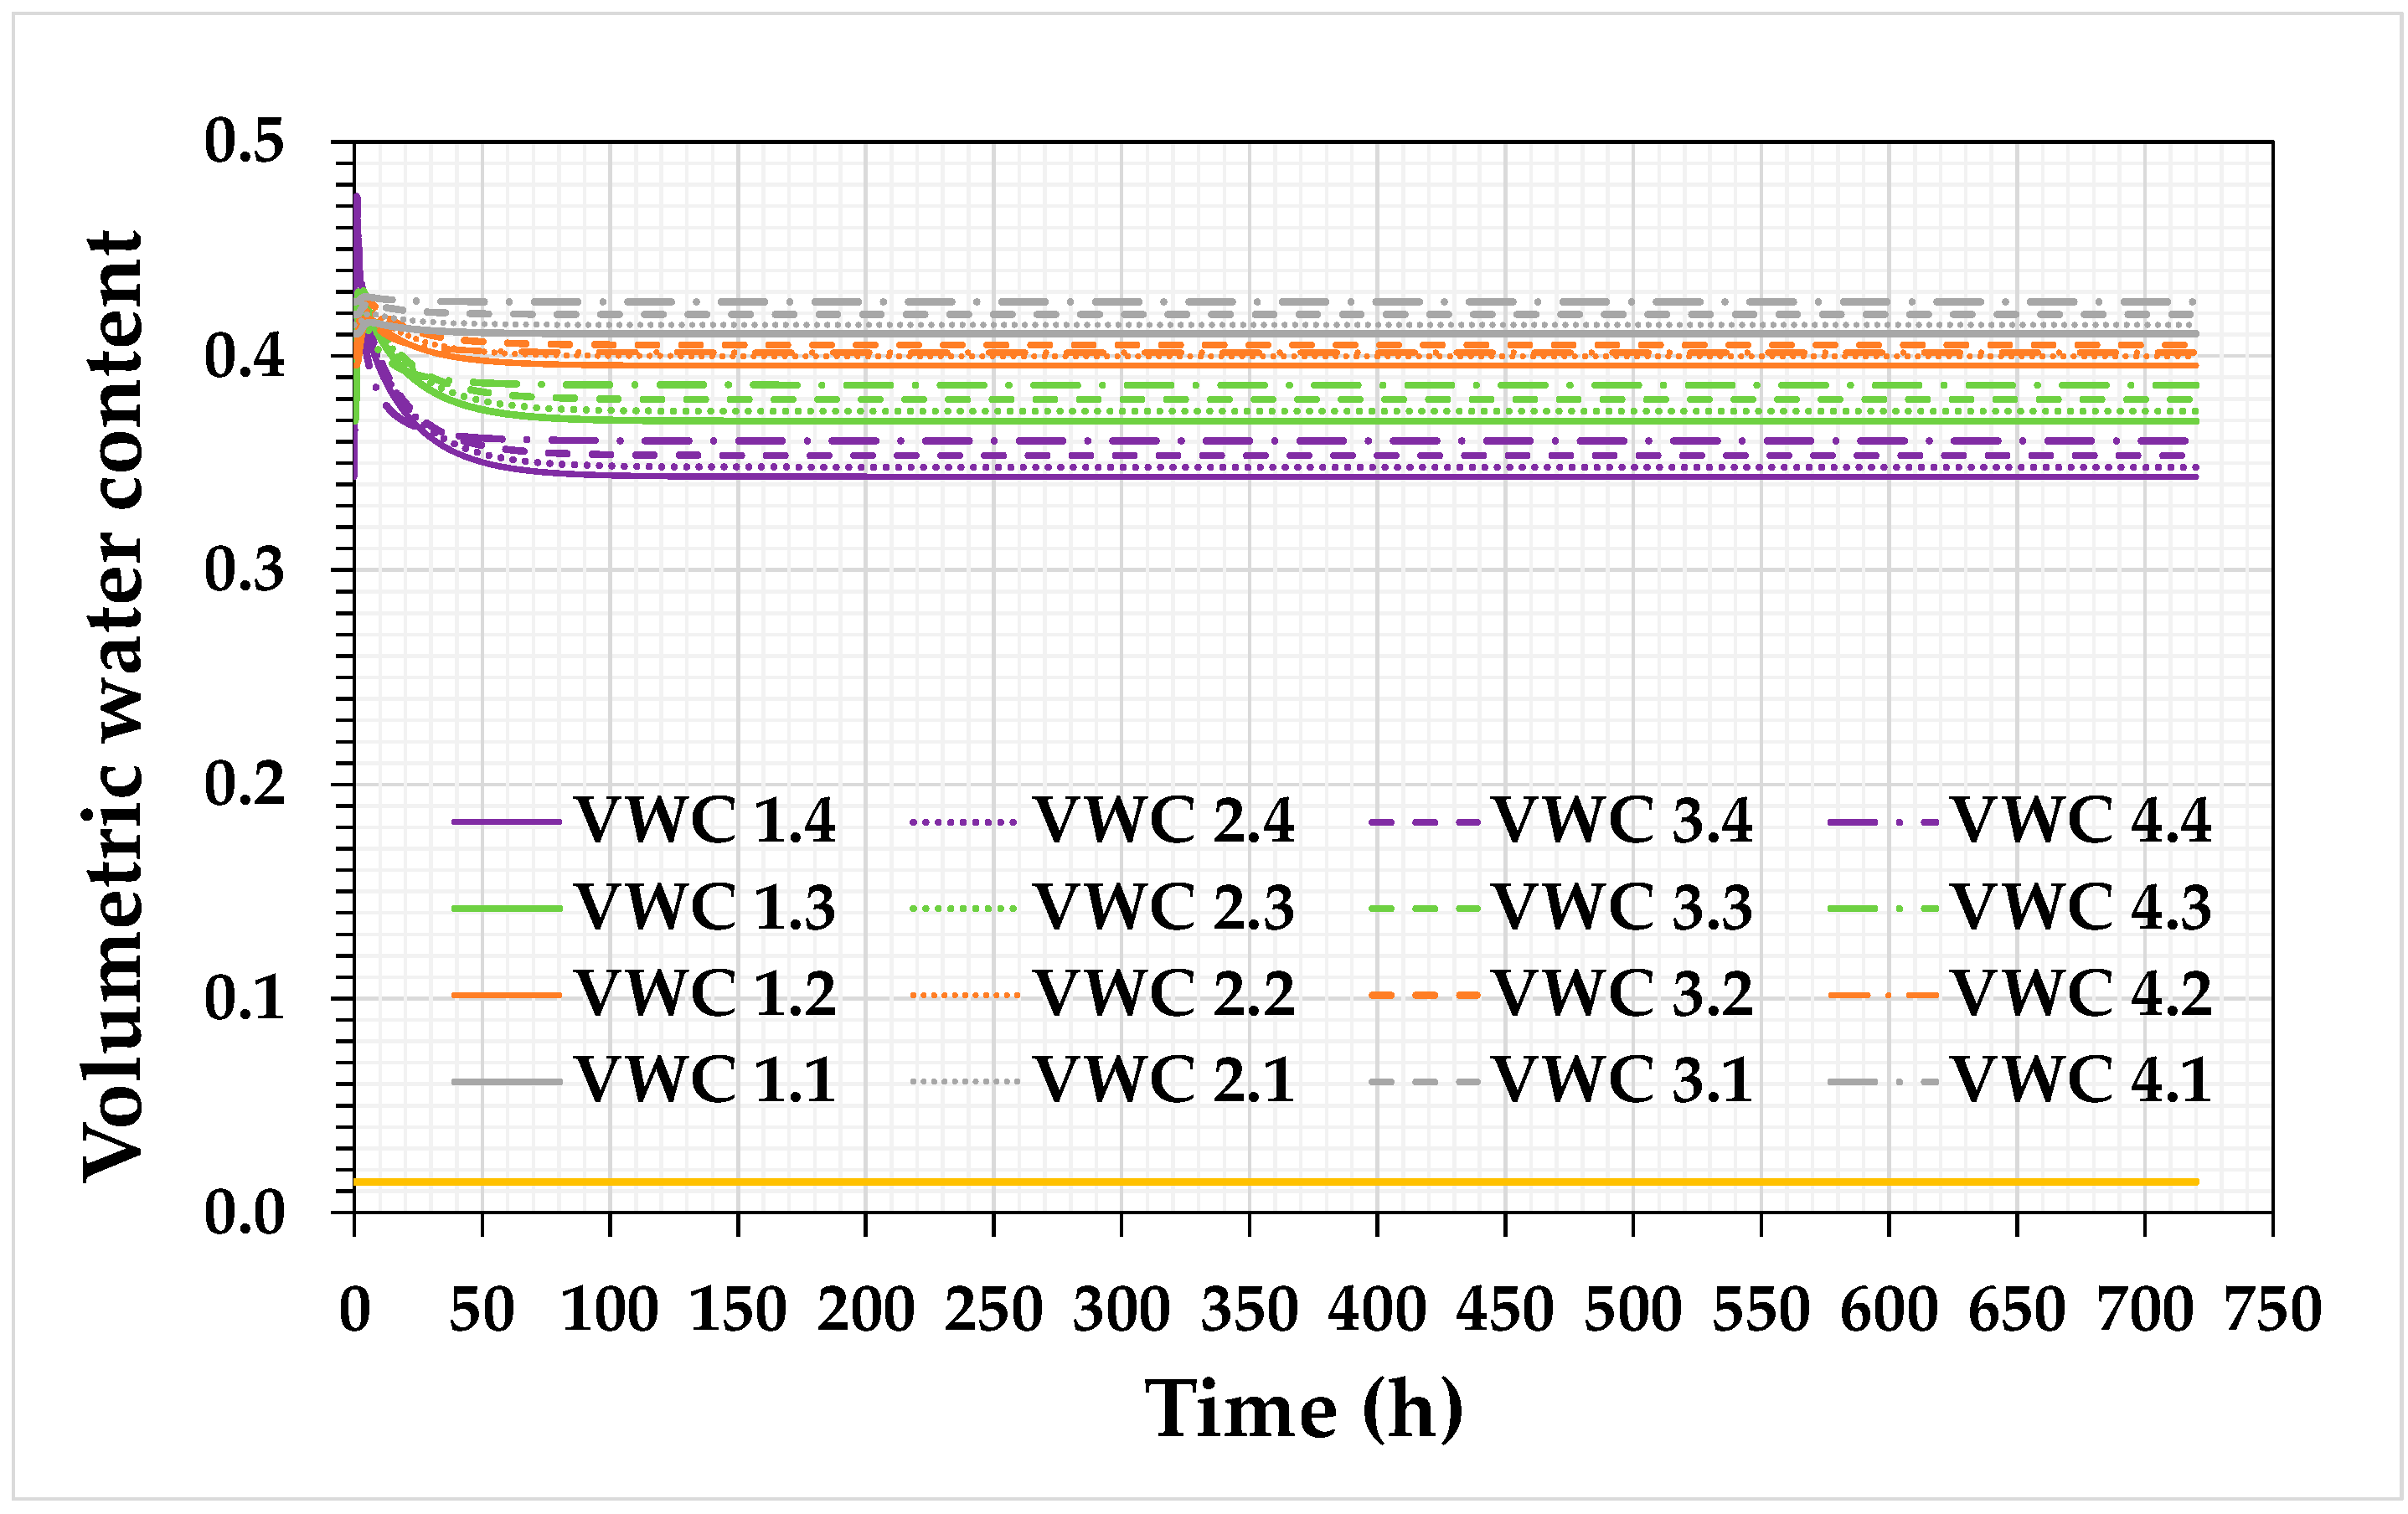
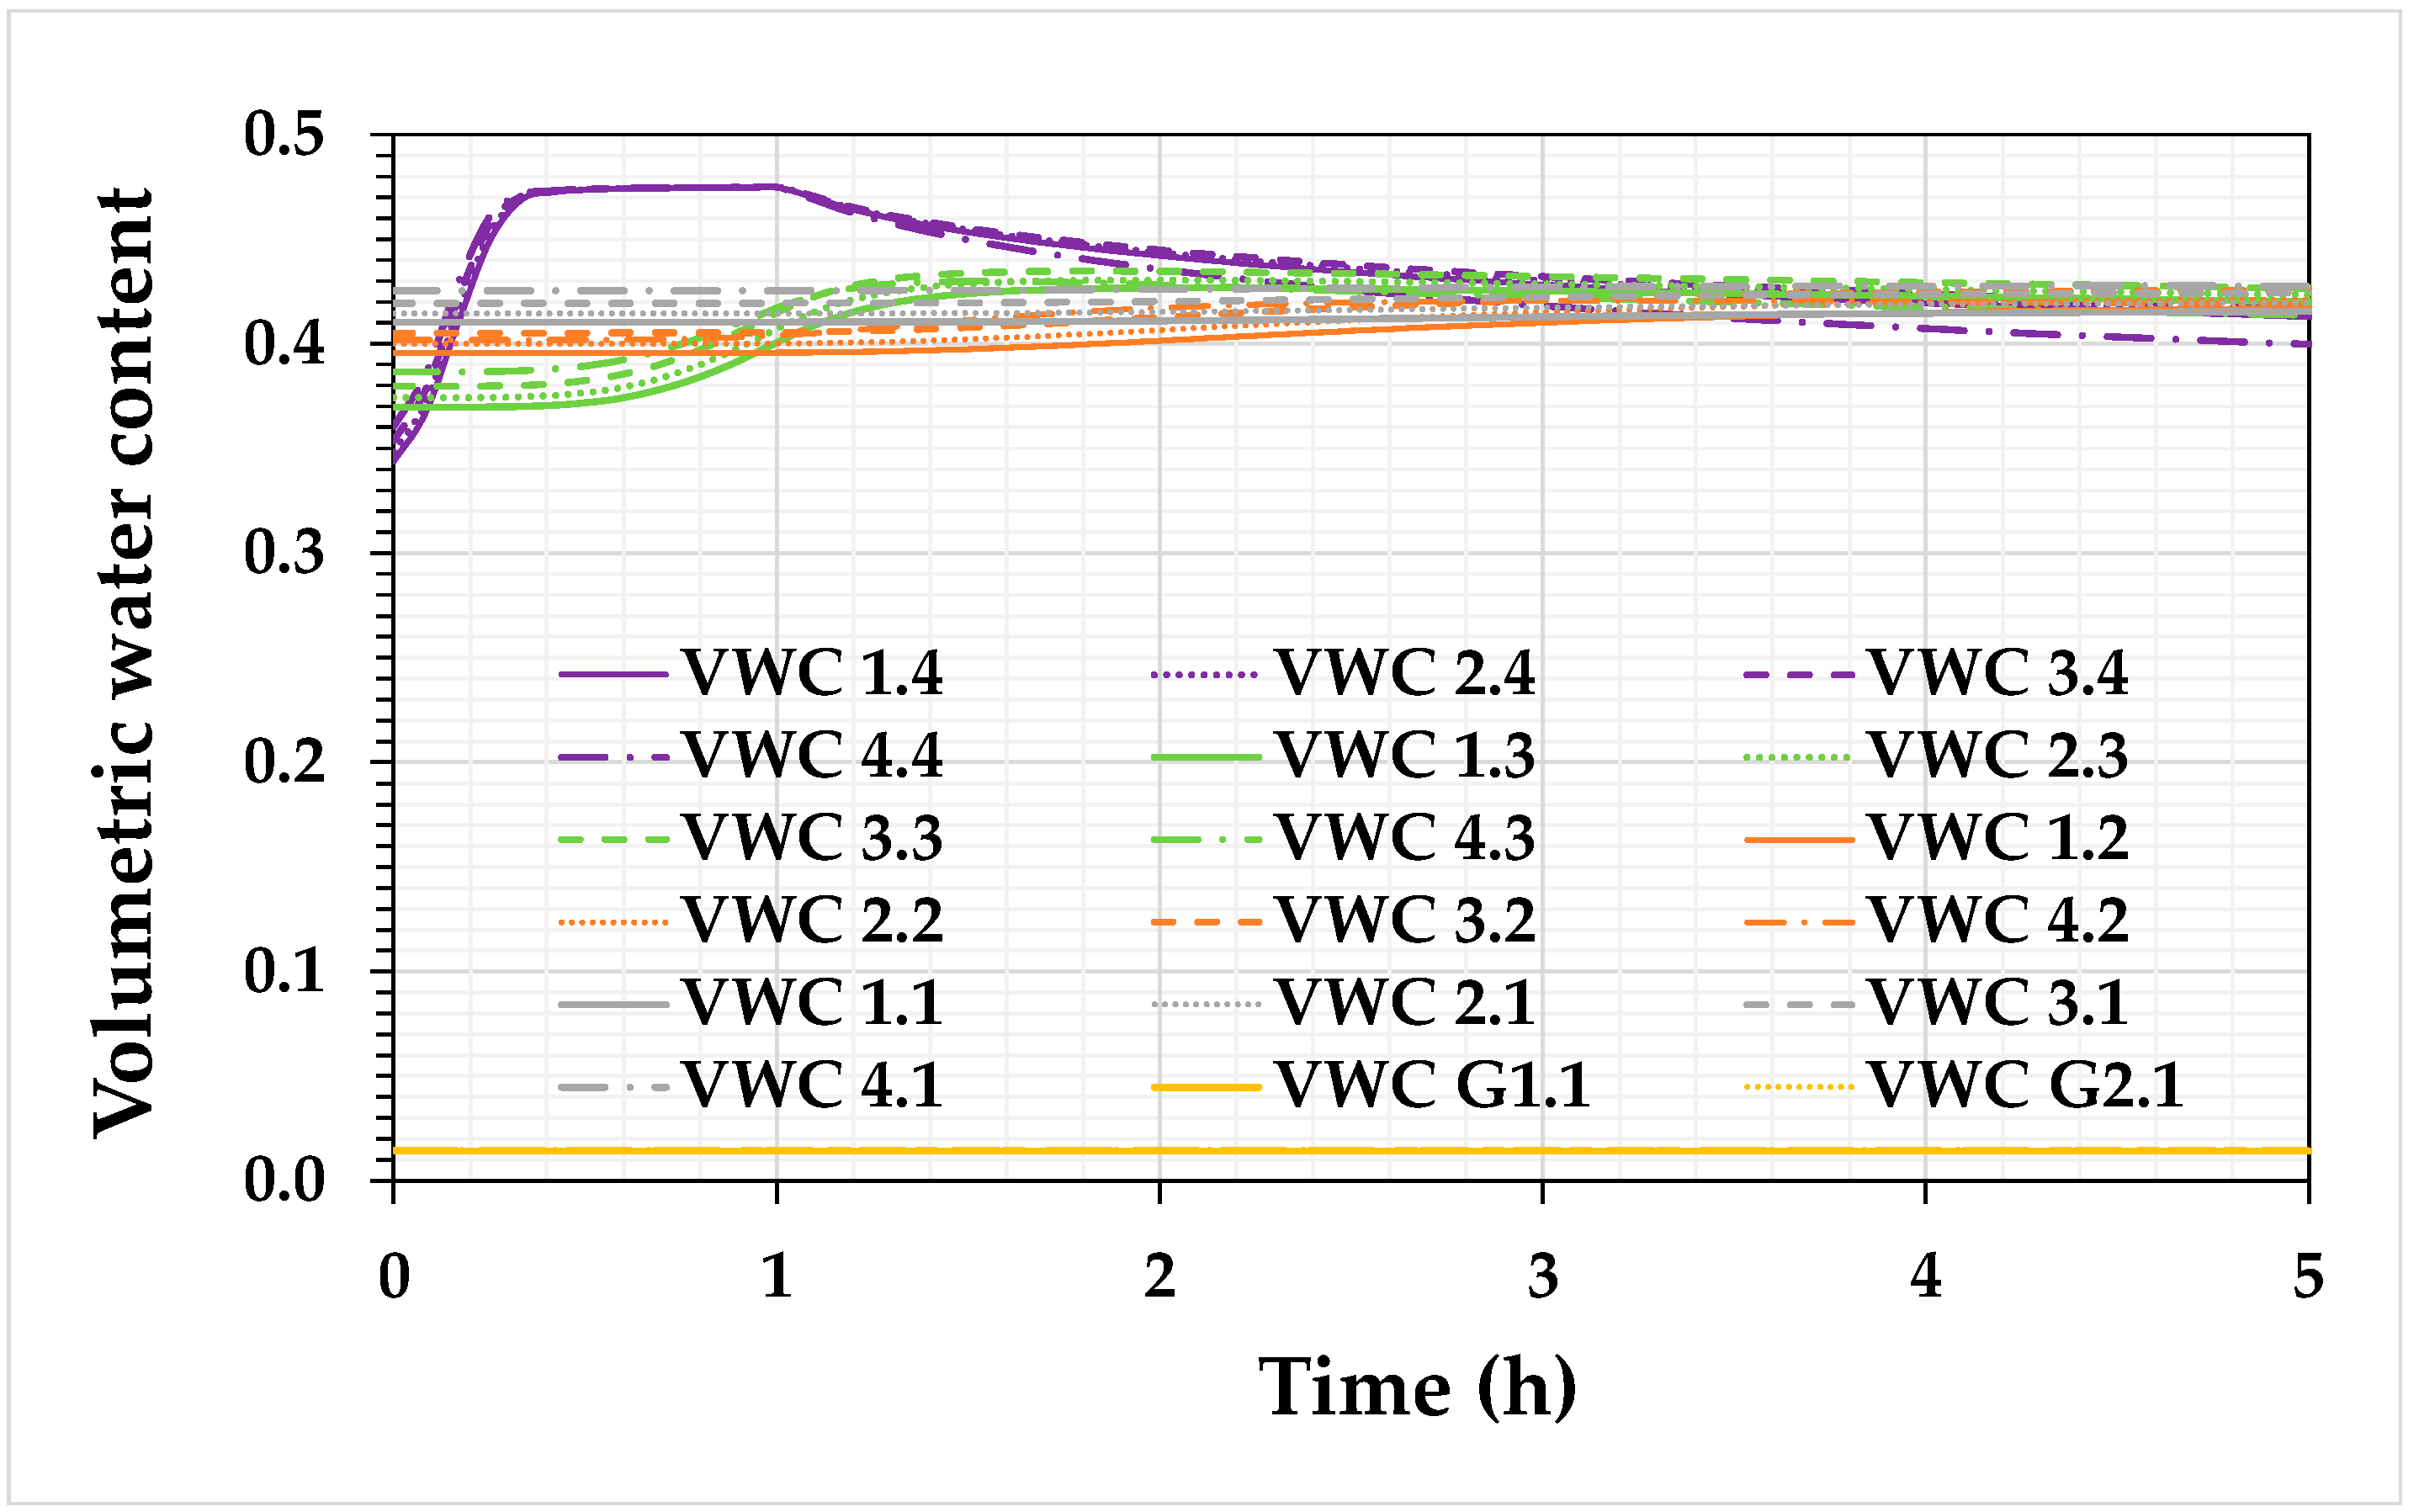
Figure 14, Figure 15, Figure 16, Figure 17, Figure 18, Figure 19, Figure 20, Figure 21, Figure 22, Figure 23, Figure 24 and Figure 25 show the results of volumetric water content simulations for a precipitation of 46.8 mm/h. The evolution of volumetric water content showed that it increased only during the first hour (period of a precipitation event) and then it began to decrease. The time in which the volumetric water content began to decrease was less for the 5° slope, compared to for the slope of 2.5°.
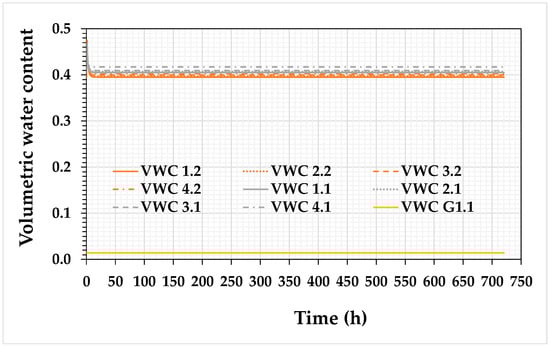
Figure 14.
Volumetric water content results for a precipitation of 46.8 mm/h, a slope of 2.5°, a layer thickness of 25 cm, and a period of 720 h (30 days).
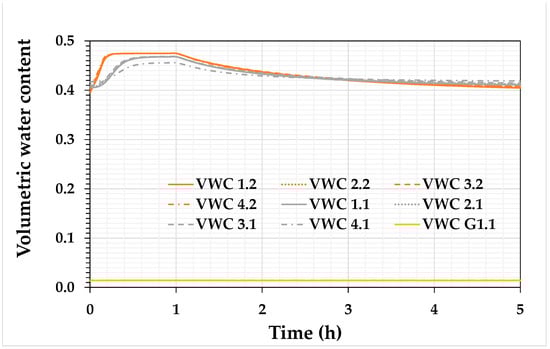
Figure 15.
Volumetric water content results at a precipitation rate of 46.8 mm/h, a slope of 2.5°, a layer thickness of 25 cm, and a period of 5 h.
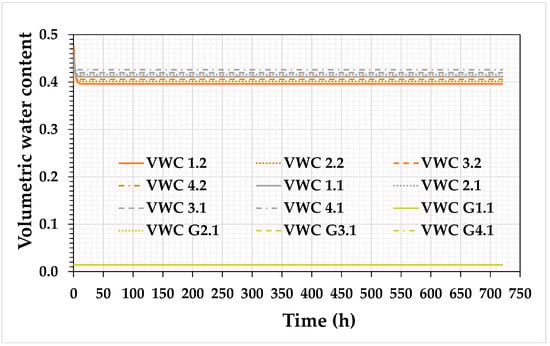
Figure 16.
Volumetric water content results for a precipitation of 46.8 mm/h, a slope of 5°, a layer thickness of 25 cm, and a period of 720 h (30 days).

Figure 17.
Volumetric water content results for a precipitation of 46.8 mm/h, a slope of 5°, a layer thickness of 25 cm, and a period of 5 h.
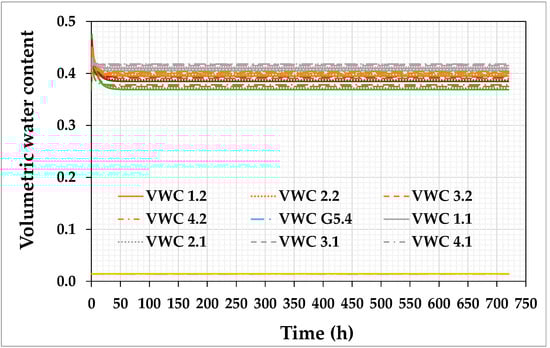
Figure 18.
Volumetric water content results for a precipitation of 46.8 mm/h, a slope of 2.5°, a layer thickness of 50 cm, and a period of 720 h (30 days).

Figure 19.
Volumetric water content results for a precipitation of 46.8 mm/h, a slope of 2.5°, a layer thickness of 50 cm, and a period of 5 h.
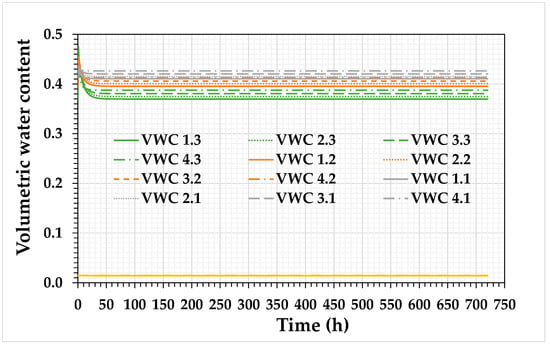
Figure 20.
Volumetric water content results for a precipitation of 46.8 mm/h, a slope of 5°, a layer thickness of 50 cm, and a period of 720 h (30 days).
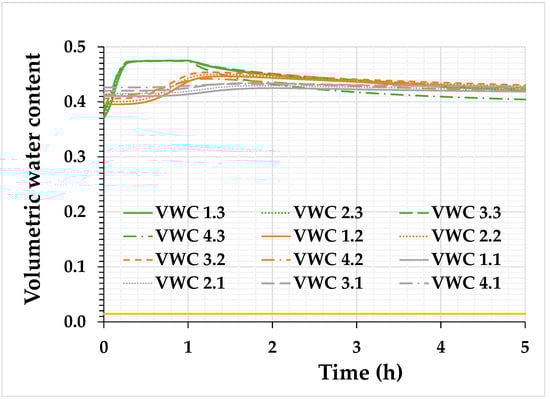
Figure 21.
Volumetric water content results for a precipitation of 46.8 mm/h, a slope of 5°, a layer thickness of 50 cm, and a period of 5 h.
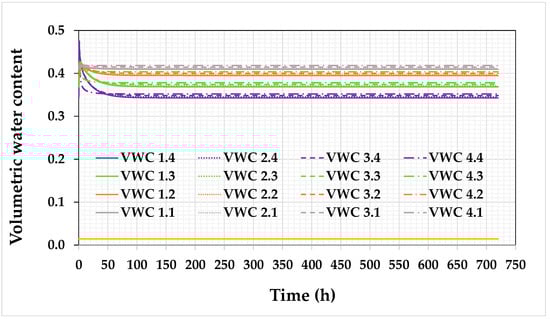
Figure 22.
Volumetric water content results for a precipitation of 46.8 mm/h, a slope of 2.5°, a layer thickness of 75 cm, and a period of 720 h (30 days).
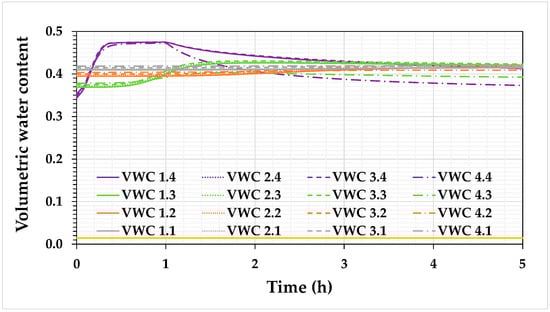
Figure 23.
Volumetric water content results for a precipitation of 46.8 mm/h, a slope of 2.5°, a layer thickness of 75 cm, and a period of 5 h.
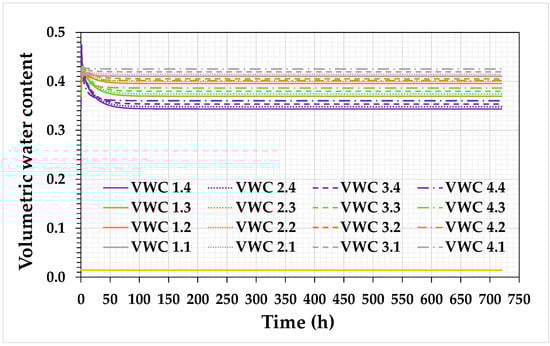
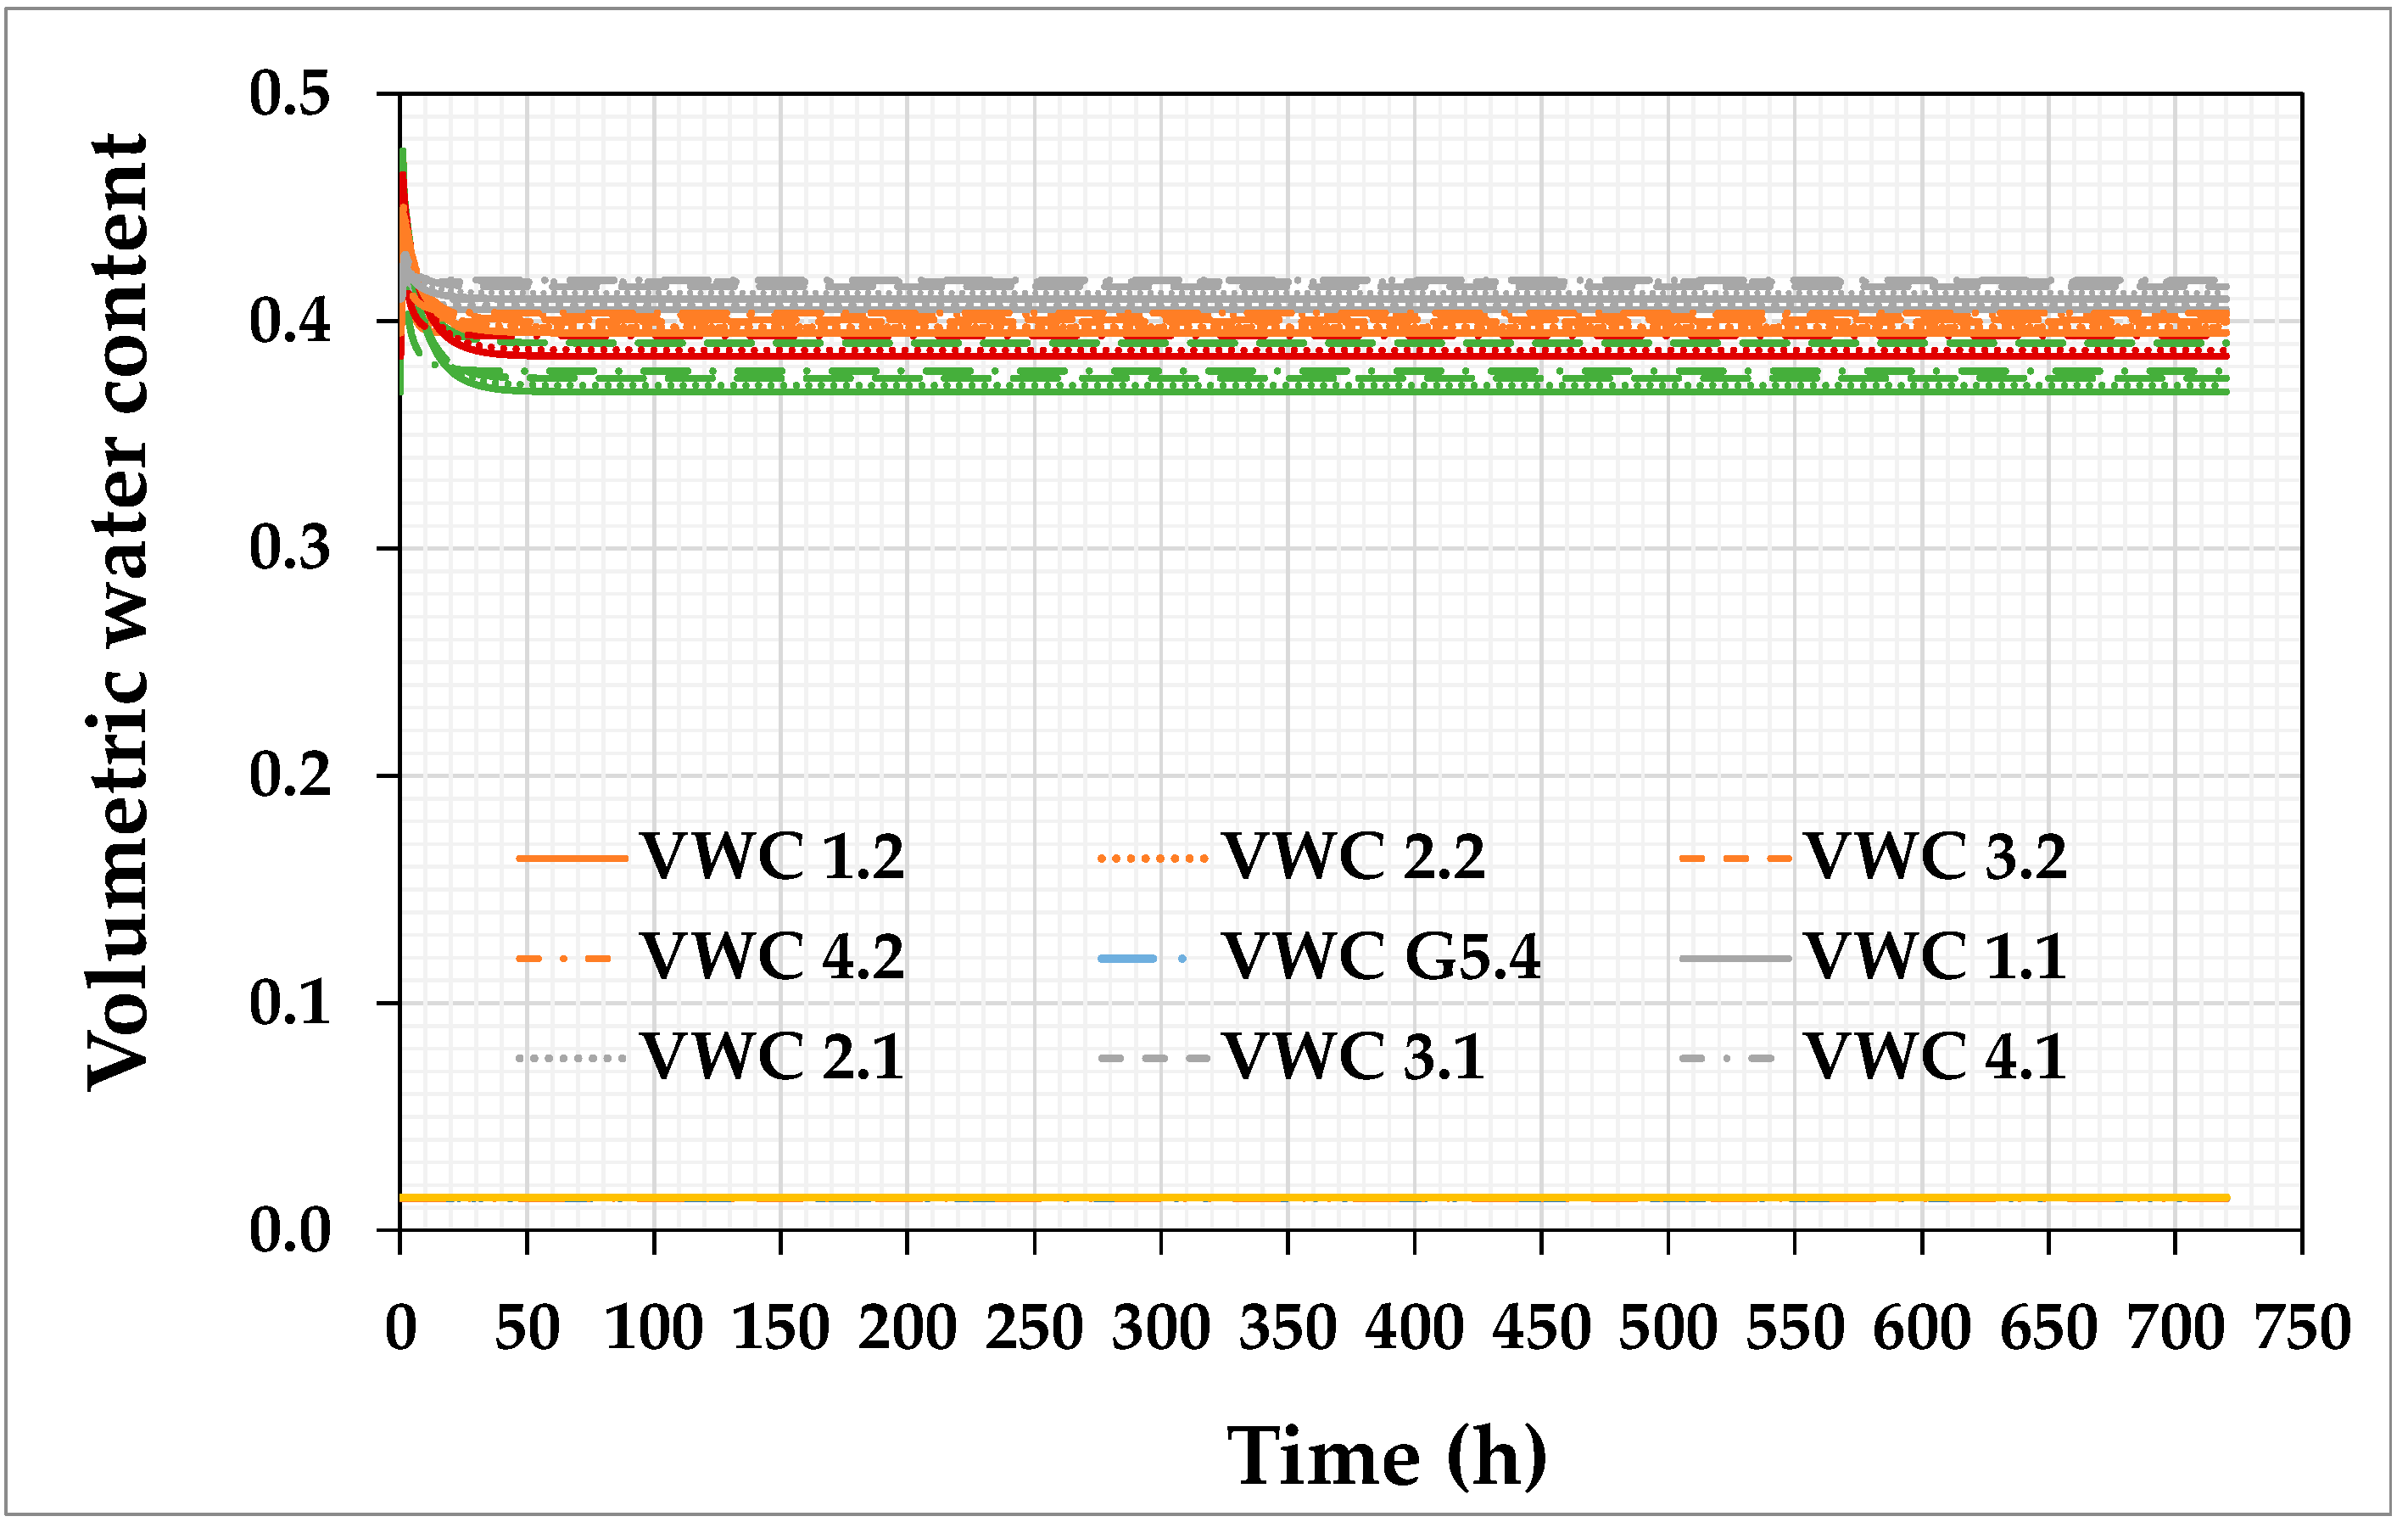
Figure 24.
Volumetric water content results for a precipitation of 46.8 mm/h, a slope of 5°, a layer thickness of 75 cm, and a period of 720 h (30 days).
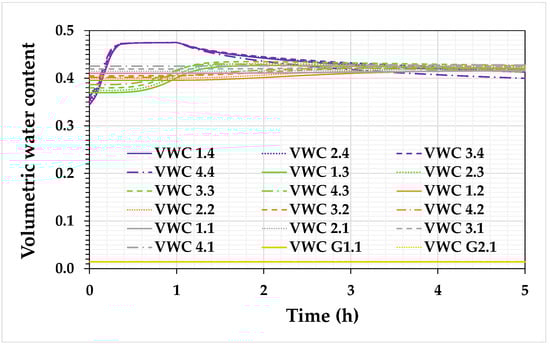
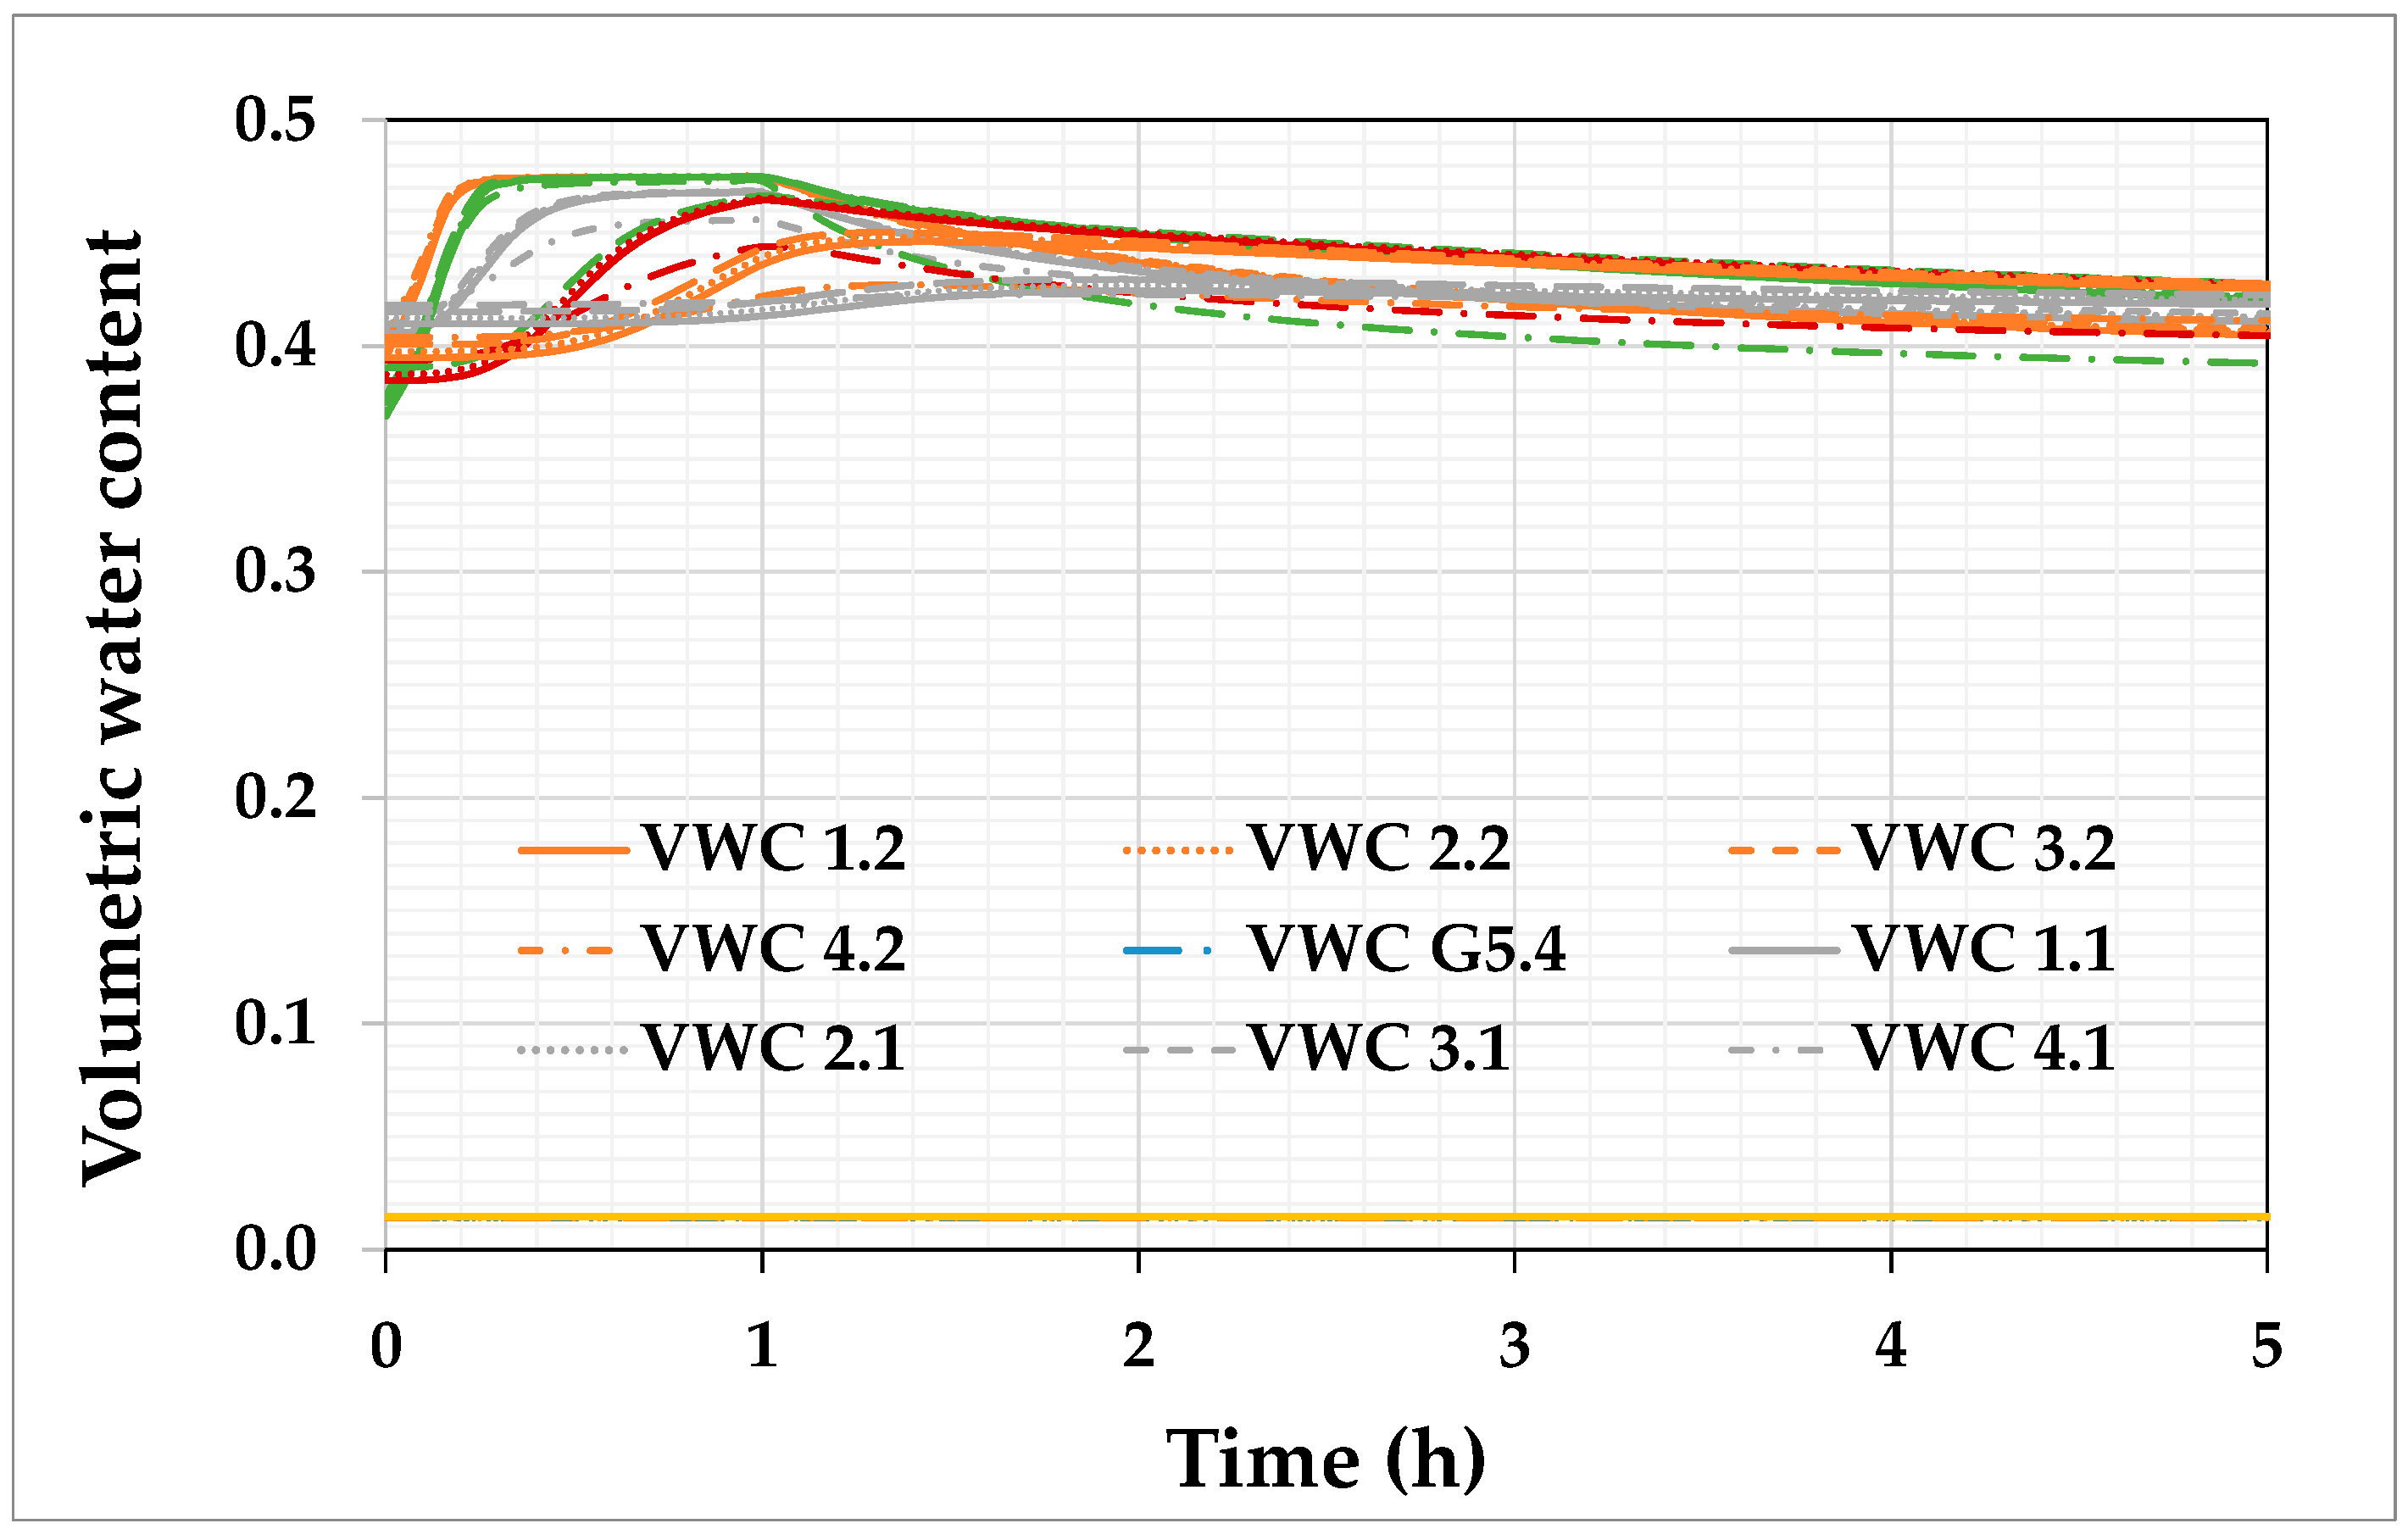
Figure 25.
Volumetric water content results for a precipitation of 46.8 mm/h, a slope of 5°, a layer thickness of 75 cm, and a period of 5 h.
For the layer thickness of 25 cm (see Figure 14, Figure 15, Figure 16 and Figure 17), both sensors were affected by precipitation. However, for the thickness of 50 cm (see Figure 18, Figure 19, Figure 20 and Figure 21), it was observed that the most superficial sensors were affected by precipitation, while the sensors near the bottom of the FCL showed no variation in volumetric water content.
For the layer thickness of 75 cm (see Figure 22, Figure 23, Figure 24 and Figure 25), it was observed that the sensors most affected by precipitation were the ones closest to the superficial. Additionally, it was evidenced that the deeper sensors showed little, or no variation induced by precipitation.
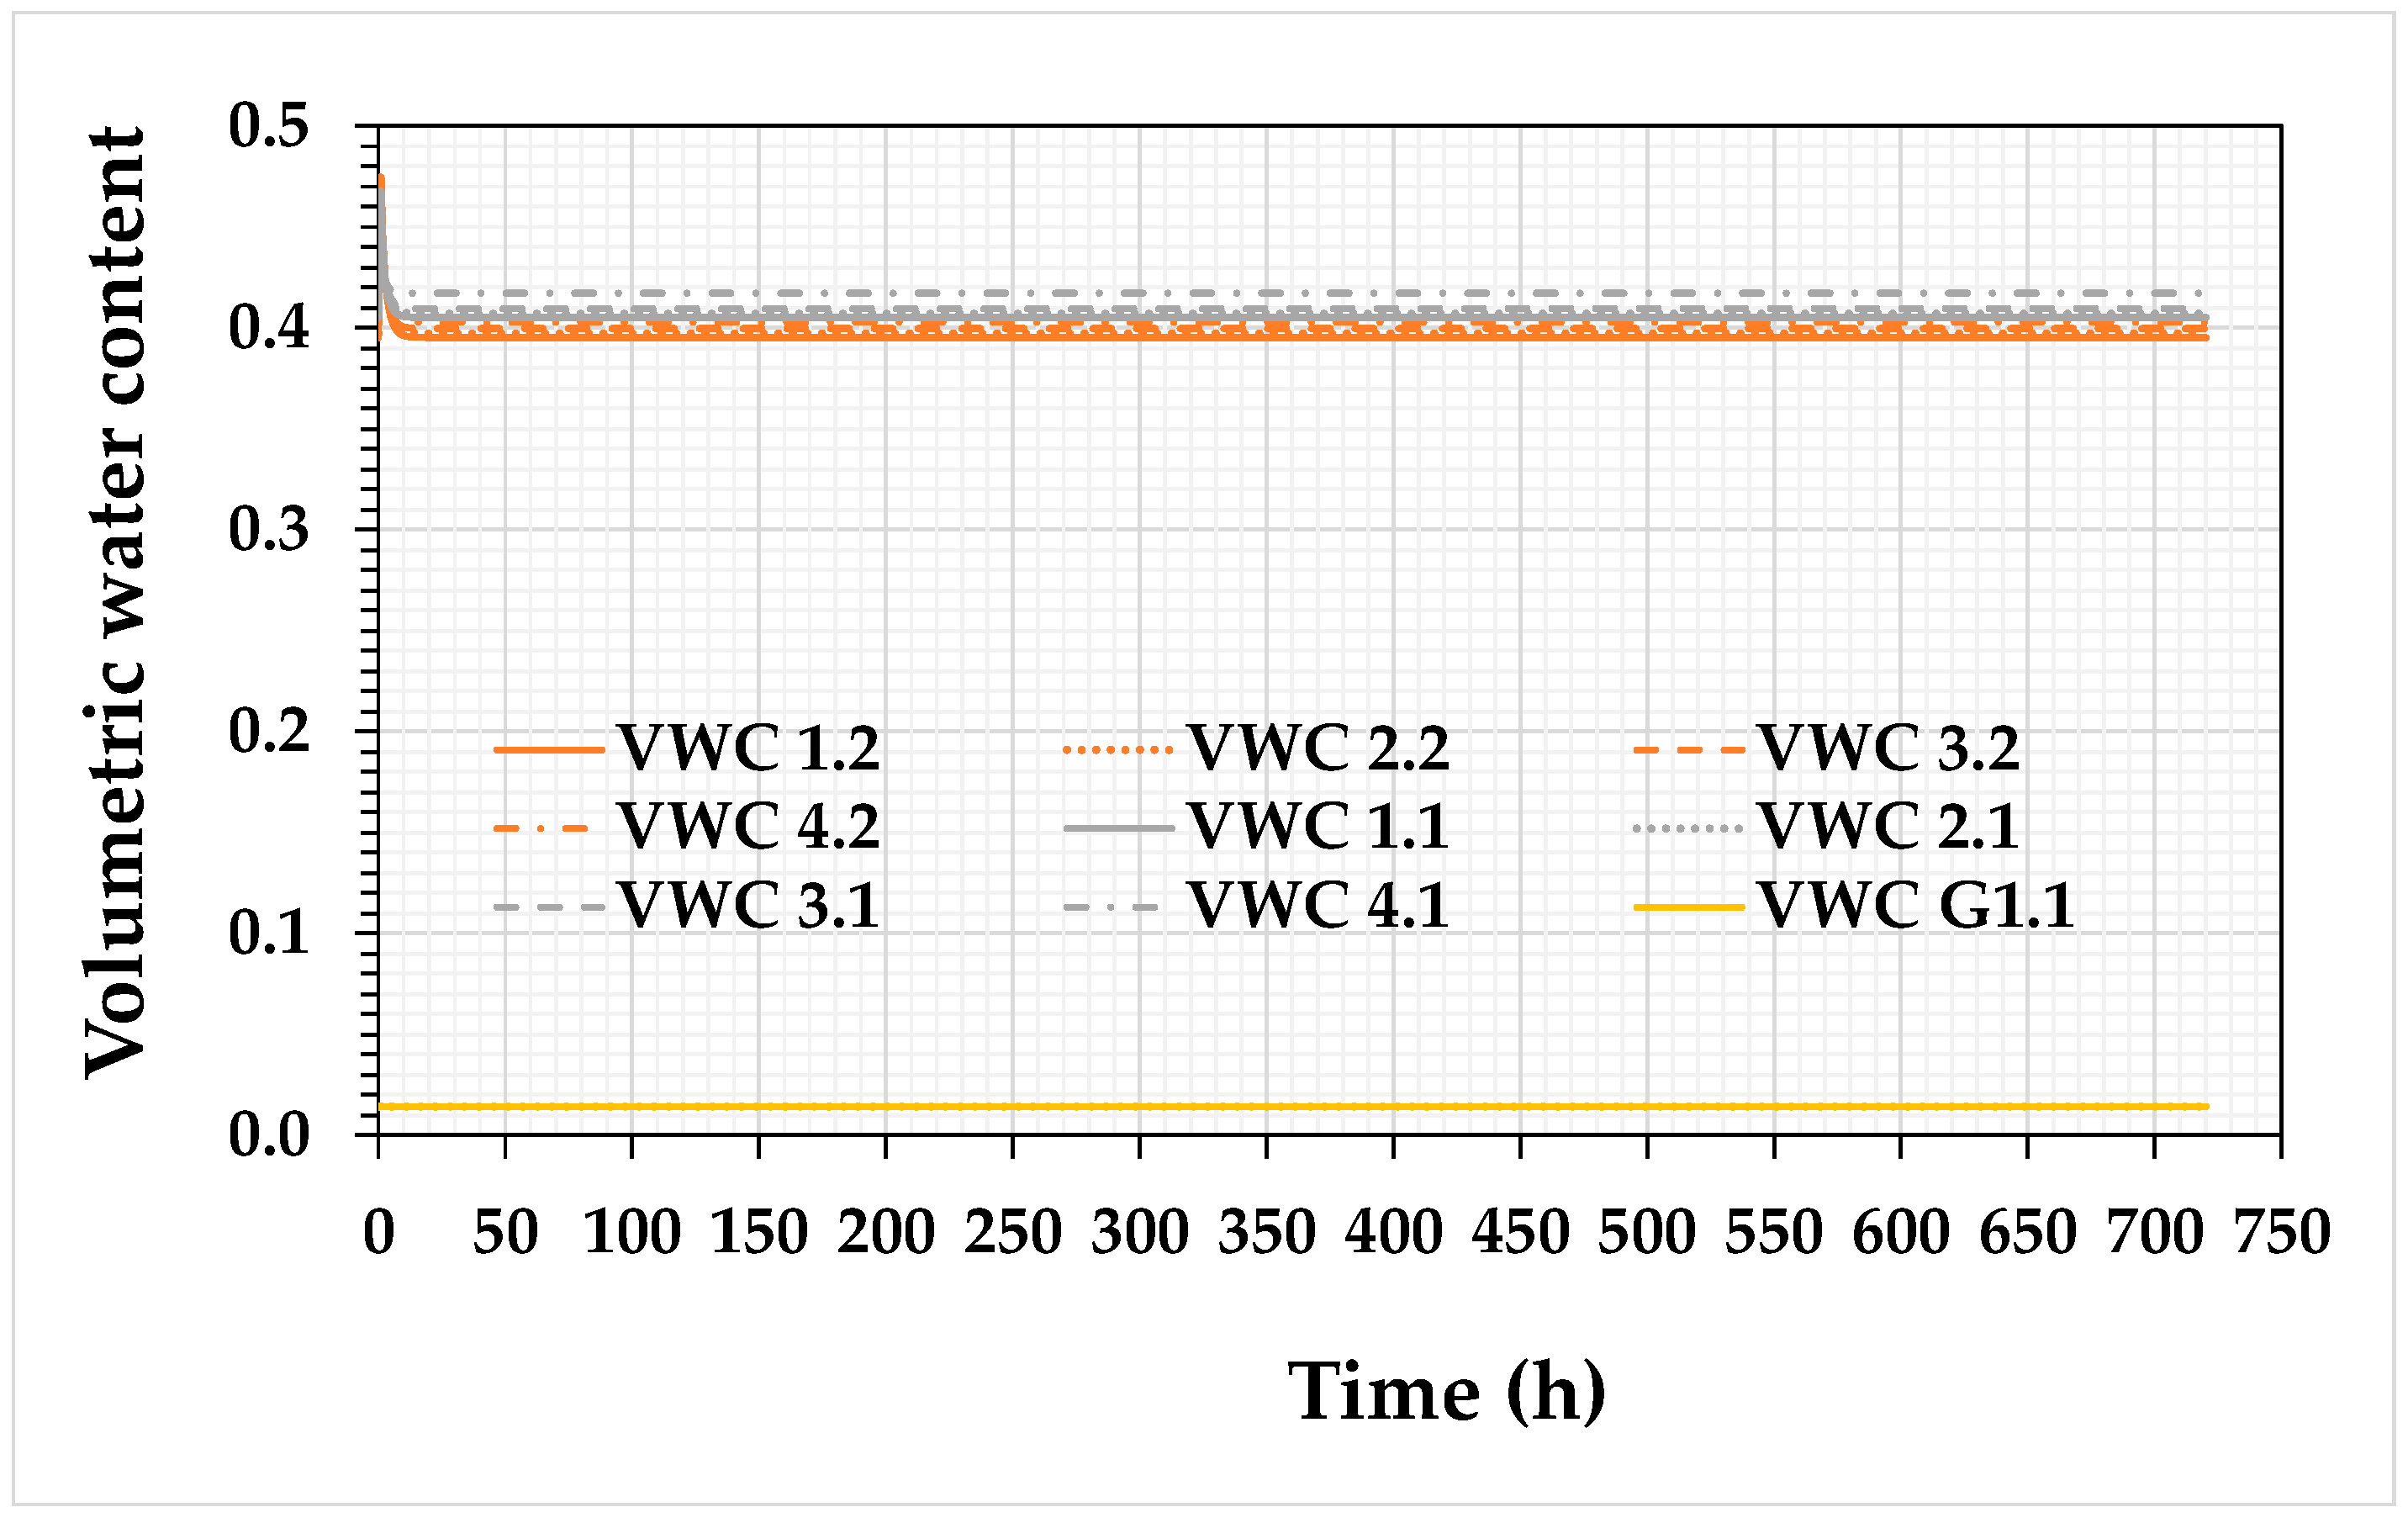
In the gravel layer and near the interface (G1-1, G2-1, G3-1, and G4-1), volumetric water content showed no variation in any of the performed tests (different precipitation rates, thicknesses, and slopes). This numerical simulation results indicated that water infiltration did not reach the gravel layer. These results obtained at the gravel layer level contradicted those from physical modeling. However, the infiltration water collected at the base of the model could be explained by the presence of a preferential flow along the walls of the physical model.
This hypothesis could be verified by numerical simulation or artificial chemical tracing. For numerical simulations, an additional boundary condition corresponding to vertical flow along the wall could be included. For chemical tracing, a tracer could be placed along the walls, and its presence at the bottom of the model could be monitored to confirm the preferential flow.
4. Final Remark
During laboratory tests, slopes of 2.5° and 5° showed no visible superficial erosion (see Figure 26). However, additional tests conducted with a 10° slope demonstrated a significant increase in water velocity and visible superficial erosion (see Figure 27). These findings suggest that high slopes are unsuitable for FCLs unless protective measures are implemented to safeguard the FCLs.
Figure 26.
Photos showing FCLs at 2.5° and 5° slopes which were not affected by superficial erosion.
Figure 27.
Visible superficial erosion for an FCL with a 10° slope.
Due to the erosion observed with the 10° slope (see Figure 27), an additional test was conducted with a 10 cm gravel layer for protection of an FCL. This measure successfully prevented superficial erosion. Subsequently, in this test involving an FCL with a thickness of 75 cm, the measured infiltration rate was 2%.
As a final remark, the FCL remained saturated after the various tests, aided by the capillary barrier effects created at the interface between the gravel layer and the FCL. This capillary barrier effect was also present along the front of the FCL. This concept can be applied to the inclined CEBC where the retention layer shows significant desaturation, thereby reducing their performance.
5. Conclusions
The sludge and slag mixture has been classified as an ML, indicating a texture that suggests low permeability behavior, as confirmed by the hydraulic conductivity test (ksat = 1.00 × 10⁻⁴ cm/s). This characterization leads to the expectation of a low infiltration rate.
Investigation results demonstrated that a steeper slope correlated with lower infiltration rates. For instance, in the scenario with a rainfall intensity of 46.8 mm/h and an FCL thickness of 25 cm, the infiltration rates were 17% for a 2.5° slope and 12% for a 5° slope. With a thicker FCL layer of 75 cm in thickness and the same rainfall intensity, the infiltration rates were reduced to 9% and 7% for 2.5° and 5° slopes, respectively.
Similarly, when considering a rainfall intensity of 60.6 mm/h and a soil thickness of 0.25 m, the infiltration rates were 13% and 8% for 2.5° and 5° slopes, respectively. For a scenario with an FCL thickness of 0.75 m, the rate decreased to 8% and 4% for 2.5° and 5° slopes, respectively.
Furthermore, the results indicated that a greater FCL thickness led to a lower infiltration rate. For instance, with a 2.5° slope and a rainfall intensity of 60.6 mm/h, the infiltration rates were 13%, 9%, and 7% for FCL thicknesses of 0.25 m, 0.5 m, and 0.75 m, respectively. Similarly, with a 5° slope and a rainfall intensity of 46.8 mm/h, the infiltration rates were 12%, 9%, and 7% for the respective FCL thicknesses of 0.25 m, 0.5 m, and 0.75 m.
In terms of rainfall intensity, the lowest infiltration rates occurred during heavier precipitation. For instance, for a 2.5° slope and a FCL thickness of 0.25 m, the infiltration rate decreased from 17% at a rain intensity of 46.8 mm/h to 13% at a rain intensity of 60.6 mm/h. Similarly, for a 5° slope, infiltration rates dropped from 12% to 8% when rainfall intensity increased from 46.8 mm/h to 60.6 mm/h.
For the runoff, one can observe that this parameter increased with an increase in inclination. The higher values were observed with the precipitation rate of 60.6 mm/h.
The monitoring data indicated that sludge and slag possessed a higher water retention capacity. Even after three weeks without rainfall under laboratory conditions, the minimum observed volumetric water content corresponded to 96% of saturation. This high saturation degree effectively restricted oxygen migration to reactive tailings.
The different results of simulated infiltration test indicated that precipitation rates significantly influenced outcomes. For instance, during a 100-year return period rain event, infiltration rates were 13% and 8% for slopes of 2.5° and 5°, respectively. Conversely, during a 25-year return period rain event, infiltration rates were 17% and 14% for slopes of 2.5° and 5°, respectively, with an FCL thickness of 25 cm.
The sludge and slag mixture presented a good performance as an FCL. Once saturated, the mixture demonstrated effective water diversion at a laboratory scale. Measurements performed during different tests indicated strong water retention capabilities in this material under controlled laboratory conditions (constant temperature and humidity and no wind).
The numerical simulations confirmed the experimental results, allowing concluding that this material can be used as an FCC layer or can be used as a component in a cover with a capillary barrier effect.
Author Contributions
Conceptualization, A.M. and N.C.O.V.; methodology, A.M. and N.C.O.V.; validation, A.M. and T.B.; formal analysis, A.M. and N.C.O.V.; investigation, N.C.O.V., A.M. and T.B.; resources, A.M. and T.B.; data curation, A.M.; writing—original draft preparation, N.C.O.V. and A.M.; writing—review and editing, A.M. and T.B.; visualization, N.C.O.V. and A.M; supervision, A.M. and T.B.; project administration, A.M. and T.B.; funding acquisition, A.M. and T.B. All authors have read and agreed to the published version of the manuscript.
Funding
This research was funded by the Fonds de Recherche du Québec sur la Nature et les Technologies (FRQNT): sustainable development of the mining sector program and the industrial partner Fonderie Horne.
Data Availability Statement
Data are contained within the article.
Conflicts of Interest
The author declares no conflicts of interest.
References
- Kahlaoui, S. Évaluation des Échanges Hydrogéochimiques Entre un parc à Résidus Miniers et les Aquifères Périphériques. Ph.D. Thesis, Polytechnique Montréal, Montréal, QC, Canada, 2022. [Google Scholar]
- Aubertin, M.; Pabst, T.; Bussière, B.; James, M.; Mbonimpa, M.; Benzaazoua, M.; Maqsoud, A. Revue des meilleures pratiques de restauration des sites d’entreposage de rejets miniers générateurs de DMA. In Proceedings of the Symposium 2015 Sur L’environnement et les Mines, Rouyn-Noranda, QC, Canada, 14–17 June 2015. [Google Scholar]
- Bossé, B.; Bussière, B.; Hakkou, R.; Maqsoud, A.; Benzaazoua, M. Field experimental cells to assess hydrogeological behaviour of store-and-release covers made with phosphate mine waste. Can. Geotech. J. 2015, 52, 1255–1269. [Google Scholar] [CrossRef]
- Knidiri, J.; Bussière, B.; Hakkou, R.; Bossé, B.; Maqsoud, A.; Benzaazoua, M. Hydrogeological behaviour of an inclined store-and-release cover experimental cell made with phosphate mine wastes. Can. Geotech. J. 2017, 54, 102–116. [Google Scholar] [CrossRef]
- Wilson, G.W.; Williams, D.J.; Rykaart, E.M. The integrity of cover systems—An update. In Proceedings of the 6th International Conference for Acid Rock Drainage, Cairns, QLD, Australia, 14–17 July 2003; Australian Institute of Mining & Metallurgy: Carlton, VIC, Australia, 2003; pp. 445–451. [Google Scholar]
- Zhan, G.; Mayer, A.; McMullen, J.; Aubertin, M. Capillary cover design for a spent leach pad. In Proceedings of the International Symposium on Hydrogeology and the Environment, Wuhan, China, 17 October 2000; pp. 17–21. [Google Scholar]
- El Hamidi, M.-J.; Maqsoud, A.; Belem, T.; Viger, M.-E.; Çiner, A.; Khari, M.F.; Kallel, M.; Rodrigo-Comino, J.; Parise, M.; Barzagar, R.; et al. A Kinetic test method to assess the long-term acid generation behavior of sludge/slag and mine tailings of Quemont 2 (Quebec, Canada). In Recent Research on Sedimentology, Stratigraphy, Paleontology, Geochemistry, Volcanology, Tectonics, and Petroleum Geology, Advances in Science, Technology & Innovation; Springer: Cham, Switzerland, 2022. [Google Scholar] [CrossRef]
- Amyot, G.; Vézina, S. Flooding as a reclamation solution to an acidic tailings pond-the Solbec case. In Proceedings of the 4th International Conference on Acid Rock Drainage, Vancouver, BC, Canada, 31 May–6 June 1997; Volume 31, pp. 681–696. [Google Scholar]
- Awoh, A.S. Étude Expérimentale du Comportement Géochimique de Résidus Miniers Hautement Sulfureux Sous un Recouvrement en Eau; Universite du Quebec en Abitibi-Temiscamingue (Canada): Rouyn-Noranda, QC, Canada, 2012. [Google Scholar]
- Demers, I. Performance d’une Barrière à L’oxygène Constituée de Résidus Miniers Faiblement Sulfureux Pour Contrôler la Production de Drainage Minier Acide; Université du Québec en Abitibi-Témiscamingue: Rouyn-Noranda, QC, Canada, 2008. [Google Scholar]
- Ethier, M.-P. Évaluation de la Performance d’un Système de Recouvrement Monocouche Avec Nappe Surélevée Pour la Restauration d’un parc à Résidus Miniers Abandonné; Université du Québec en Abitibi-Témiscamingue: Rouyn-Noranda, QC, Canada, 2018. [Google Scholar]
- Ouangrawa, M.; Aubertin, M.; Molson, J.; Zagury, G.; Bussière, B. An evaluation of the elevated water table concept using laboratory columns with sulphidic tailings. In Proceedings of the Geosask2005, 58th Canadian Geotechnical Conference and 6th Joint IAHC-NC, Saskatoon, SK, Canada, 18–21 September 2005. [Google Scholar]
- Aubertin, M.; Chapuis, R. Considérations hydro-géotechniques pour l’entreposage des résidus miniers dans le nord-ouest du Québec. In Proceedings of the Second International Conference on the Abatement of Acidic Drainage, Montreal, QC, Canada, 16–18 September 1991; MEND/Canmet. Volume 3, pp. 1–22. [Google Scholar]
- Nicholson, R.V.; Gillham, R.W.; Cherry, J.A.; Reardon, E.J. Reduction of acid generation in mine tailings through the use of moisture-retaining cover layers as oxygen barriers. Can. Geotech. J. 1989, 26, 1–8. [Google Scholar] [CrossRef]
- Ricard, J.; Aubertin, M.; Firlotte, F.; Knapp, R.; McMullen, J.; Julien, M. Design and construction of a dry cover made of tailings for the closure of Les Terrains Aurifères site, Malartic, Québec, Canada. In Proceedings of the 4th International Conference on Acid Rock Drainage, Vancouver, BC, Canada, 31 May–6 June 1997; Volume 31, pp. 1515–1530. [Google Scholar]
- Rakotonimaro, T.V.; Neculita, C.M.; Bussière, B.; Benzaazoua, M.; Zagury, G.J. Recovery and reuse of sludge from active and passive treatment of mine drainage-impacted waters: A review. Environ. Sci. Pollut. Res. 2017, 24, 73–91. [Google Scholar] [CrossRef] [PubMed]
- Tassé, N.; Germain, D.; Dufour, C.; Tremblay, R. Le recouvrement de résidus organiques au parc East Suillivan: Au delà de la barrière d’oxygène. In Proceedings of the Colloque sur le Programme de Neutralisation des Eaux de Drainage dans l’Environnement Minier, Rouyn-Noranda, QC, Canada, 29–30 October 1996; Ministère des Ressources Naturelles Quebec: Québec, QC, USA, 1996; pp. 106–128. [Google Scholar]
- Albright, W.H.; Benson, C.H.; Gee, G.W.; Abichou, T.; McDonald, E.V.; Tyler, S.W.; Rock, S.A. Field performance of a compacted clay landfill final cover at a humid site. J. Geotech. Geoenviron. Eng. 2006, 132, 1393–1403. [Google Scholar] [CrossRef]
- Maqsoud, A.; Bussière, B.; Mbonimpa, M. Low saturated hydraulic conductivity covers. In Hard Rock Mine Reclamation: From Prediction to Management of Acid Mine Drainage; Bussière, B., Guittonny, M., Eds.; CRC Press: Boca Raton, FL, USA, 2021. [Google Scholar]
- Rarison, R.F. Évaluation des Propriétés Chimiques, Mécaniques et Hydrogéologiques de Géomembranes Utilisées Comme Matériaux de Recouvrement Pour Restaurer des Sites Miniers en Milieu Froid et Acide; Polytechnique Montréal: Montréal, QC, Canada, 2021. [Google Scholar]
- Aubertin, M.; Cifuentes, E.; Apithy, S.; Bussière, B.; Molson, J.; Chapuis, R. Analyses of water diversion along inclined covers with capillary barrier effects. Can. Geotech. J. 2009, 46, 1146–1164. [Google Scholar] [CrossRef]
- Bussière, B.; Plante, B.; Broda, S.; Aubertin, M.; Chen, D.; Medina, F. Contrôle des infiltrations d’eau dans les haldes à stériles à l’aide des effets de barrière capillaire: Design, construction et instrumentation de la halde expérimentale de la mine Tio. In Proceedings of the Symposium sur L’environnement et Les Mines, Rouyn-Noranda, QC, Canada, 14–17 June 2015; pp. 14–17. [Google Scholar]
- Dimech, A.; Chouteau, M.; Aubertin, M.; Bussière, B.; Martin, V.; Plante, B. Three-dimensional time-lapse geoelectrical monitoring of water infiltration in an experimental mine waste rock pile. Vadose Zone J. 2019, 18, 1–19. [Google Scholar] [CrossRef]
- Ait Khouia, A. Évaluation de la Capacité de Déviation Latérale de la Couche de Contrôle des Écoulements d’eau Dans un Modèle physique au Laboratoire; Ecole Polytechnique: Montreal, QC, Canada, 2018. [Google Scholar]
- Martin, V.; Bussière, B.; Plante, B.; Pabst, T.; Aubertin, M.; Medina, F.; Bréard-Lanoix, M.L.; Dimech, A.; Dubuc, J.; Poaty, B.; et al. Controlling water infiltration in waste rock piles: Design, construction, and monitoring of a large-scale in-situ pilot test pile. In Proceedings of the 70th Canadian Geotechnical Society Conference, Ottawa, ON, Canada, 1–4 October 2017; Volume 70. [Google Scholar]
- Crouzal, T.; Pabst, T. A black-box automated approach to calibrate numerical simulations and optimize cover design: Application to a flow control layer constructed on an experimental waste rock pile. Vadose Zone J. 2021, 20, e20130. [Google Scholar] [CrossRef]
- Dubuc, J. Étude du Comportement Hydrogéologique d’une Couche de Contrôle des Écoulements Placée à la Surface d’une Halde à Stériles Expérimentale; Ecole Polytechnique: Montreal, QC, Canada, 2018. [Google Scholar]
- Poaty, B.; Plante, B.; Bussière, B.; Benzaazoua, M. Assessment of hydrogeochemical behavior of layered waste rock stockpiles: A meso-scale laboratory experiment. Appl. Geochem. 2022, 136, 105154. [Google Scholar] [CrossRef]
- Raymond, K.E.; Seigneur, N.; Su, D.; Poaty, B.; Plante, B.; Bussière, B.; Mayer, K.U. Numerical modeling of a laboratory-scale waste rock pile featuring an engineered cover system. Minerals 2020, 10, 652. [Google Scholar] [CrossRef]
- Rossit, M. Utilisation des Stériles Miniers Concassés et Compactés Comme Couche de Contrôle des Écoulements Pour Contrôler le DMA; Ecole Polytechnique: Montreal, QC, Canada, 2020. [Google Scholar]
- Tremblay, D.; Robitaille, V. Mécanique des Sols: Théorie et Pratique, 2nd ed.; Groupe Modulo: Quebec, QC, Canada, 2014; ISBN 978-2-89650-627-9. [Google Scholar]
- ASTM D4318-17e1; Standard Test Methods for Liquid Limit, Plastic Limit, and Plasticity Index of Soils. American Society for Testing of Materials (ASTM): West Conshohocken, PA, USA, 2017.
- ASTM D1557-12(2021); Standard Test Methods for Laboratory Compaction Characteristics of Soil Using Modified Effort (56,000 ft-lbf/ft3 (2,700 kN-m/m3)). American Society for Testing of Materials (ASTM): West Conshohocken, PA, USA, 2021.
- Delage, P.; Cui, Y.-J. L’eau Dans les Sols; Edition Technique de l’ingénieur: Paris, France, 2000; Volume C2. [Google Scholar]
- ASTM D2434-22; Standard Test Methods for Measurement of Hydraulic Conductivity of Coarse-Grained Soils. American Society for Testing of Materials (ASTM): West Conshohocken, PA, USA, 2022.
- Van Genuchten, M.T. A closed-form equation for predicting the hydraulic conductivity of unsaturated soils. Soil Sci. Soc. Am. J. 1980, 44, 892–898. [Google Scholar] [CrossRef]
- Aubertin, M.; Mbonimpa, M.; Bussière, B.; Chapuis, R.-P. A model to predict the water retention curve from basic geotechnical properties. Can. Geotech. J. 2003, 40, 1104–1122. [Google Scholar] [CrossRef]
- Mbonimpa, M.; Aubertin, M.; Bussière, B. Predicting the unsaturated hydraulic conductivity of granular soils from basic geotechnical properties using the modified Kovacs (MK) model and statistical models. Can. Geotech. J. 2006, 43, 773–787. [Google Scholar] [CrossRef]
- Otalora, C.; Maqsoud, A.; Belem, T. Evaluation of the Sludge and Slag Mixture to Act Flow Control Layer in the Waste Rock Pile Reclamation; A Springer Book Series Advances in Science, Technology & Innovation; Springer: Berlin/Heidelberg, Germany, 2024. [Google Scholar]
- GEOSLOPE International Ltd. Heat and Mass Transfer Modeling with GeoStudio 2020, 1st ed.; GEOSLOPE International Ltd.: Calgary, AB, Canada, 2020. [Google Scholar]


Disclaimer/Publisher’s Note: The statements, opinions and data contained in all publications are solely those of the individual author(s) and contributor(s) and not of MDPI and/or the editor(s). MDPI and/or the editor(s) disclaim responsibility for any injury to people or property resulting from any ideas, methods, instructions or products referred to in the content. |
© 2024 by the authors. Licensee MDPI, Basel, Switzerland. This article is an open access article distributed under the terms and conditions of the Creative Commons Attribution (CC BY) license (https://creativecommons.org/licenses/by/4.0/).